43
NEDLAC Trade & Industry Chamber STRATEGIC SESSION Presentation – steel, CTFL and procurement. 19 September 2016

NEDLAC Trade & Industry Chamber STRATEGIC SESSION
Presentation – steel, CTFL and
procurement.
19 September 2016
CONTENTS
• Update on steel sector interventions
• Update on Clothing Textile Leather and Footwear (CTFL) sector
• Update on public procurement and localisation
2

CONTEXT: STEEL INDUSTRY• The global economic environment remains difficult for resource based
economies with sharply lower commodity prices a reflection of a decline in global demand but also of over supply by major producers
• Many emerging market currencies exposed to lower growth prospects and subdued commodity prices have seen the sharpest falls
• The steel industry has been particularly hard hit - oversupply and massive installed capacity in China has seen a number of countries deploying a range of measures to protect steel production capacity
• Governments around the world are grappling with the steel crisis.
• Forecasts predict that an oversupply (currently at 400m tons/annum) will remain for some time due to China’s massive over capacity as well as the declining global demand. China accounts for 50% of global steel production
3

Source: Mckinsey, World steel association base case scenario
1 Overcapacity = (crude steel capacity* 85% capacity utilization) – crude steel
apparent demand2 Based on Nominal capacity
0
500
1 000
1 500
2 000
2 500
06052004 202019181716151413121110090807
Global demand
OutlookGlobal overcapacity1 is
estimated at ~400 mtpa
crude steel• 2004 – 2008
demand and
supply were
closely
matched
• Plant
utilization to
stay below
80% for the
next few
years
• Global
overcapacity
has been
steadily
increasing
• 2004 – 2008
demand and
supply were
closely
matched
• Plant
utilization to
stay below
80% for the
next few
years
• Global
overcapacity
has been
steadily
increasing
Production @ 85%
capacity utilization
Nominal capacity1
mtp
aGLOBAL OVERSUPPLY
4

STRUCTURAL CHALLENGES• The effects of the depressed global steel market are evident across the value chain as the
iron-ore mines, primary steel mills & domestic manufacturers struggle to compete, sustain jobs and invest
• The situation is exacerbated by SA’s high steel production costs & administered prices
– Aged plants and inefficiencies - lack of investment and maintenance
– Energy - electricity and gas price increases (>300% and 160% since 2007)
– Transport - increasing rail tariffs (>100% increase since 2007), uncompetitive port charges and inefficiencies on domestic vs export lines (Sishen-Van der Byl), AMSA additional road transportation costs for 2016 @R731m
– Costs: 40% transport, electricity and wagesdollar based inputs (iron-ore, coking coal)
• Given the above structural challenges and indications that the existing slump is likely to continue, the need for a steel industry in SA is often debated when there is a high price tag associated with both support and any future significant structural reform.
5
STRATEGIC IMPORTANCEWhy do we need a steel industry in SA?
• Steel is fundamental to manufacturing in SA accounting for significant value add and representing 190 000 jobs in the direct iron-ore, steel making and fabrication industries.
• Top steel consuming industries (mining, construction, autos, cables, structural steel) contribute ~R600bn to SA’s GDP (~15%) and employ ~8m people (direct and indirect)
• The loss of SA’s primary steel production capacity (and becoming an exporter of iron ore and an importer of steel) will leave SA at the mercy of the global steel market in the long run and preclude SA from utilizing its comparative resource endowment advantage
• The sustainability and future existence of the sector as a whole (both upstream and downstream) is integral to achieve the country’s economic development goals and support the growth of key sectors.
6

OUTLOOK FOR SA
Despite the current challenges, there are opportunities and strengths for a sustainable, competitive steel sector:
• There is a positive correlation between GDP and steel intensity for developing countries. SA and countries in the region are low down on the steel consumption curve with forecasts that this is likely to increase with economic growth
• SA has the only primary steel mill in SSA and with Egypt are the only producers in the region representing a huge opportunity to supply steel and steel products to neighbouring economies, many of which are growing at about 5% or more per annum.
• Significant infrastructure expansion and construction activity will take place on the continent and within SADC over the next decade, creating demand for steel products
• Export growth in structural steel to other African countries and global mining regions (Australia, S America)
• Significant capabilities, skill and capacity of the local steel construction industry to supply the infrastructure program, mining & oil and gas
7

POLICY INTERVENTIONS
• Over the last 18 months since the slump began to take effect, the Inter-Departmental Task Team on iron and steel has been working on a number of demand side measures to support and save the industry from the immediate threats of closure and the subsequent loss of capacity.
• Task team also looking at long term policy, programme and project interventions to arrive at an optimal ‘end state’ of a viable, competitive and sustainable steel industry in SA, balancing the interests and support for both upstream and downstream and across the entire value chain.
8

MEASURES
Package of interventions to ensure the sustainability of the steel industry is based on the following initiatives:
1. An increase in tariffs for primary steel products within the policy parameters and due processes
2. Downstream support measures including tariff review and deployment of rebates subject to policy and due process
3. Agreement on a set of principles for flat steel pricing in SA that is priced appropriately to ensure that steel-dependent industries are competitive while at the same time ensuring that the upstream steel mills remain sustainable
4. Increase of local procurement by government in the infrastructure programmes
5. Settlement of the Competition Commission issues with AMSA
9

PRIMARY STEEL SUPPORT &
COMMITMENTS
TARIFFS
Increase in the rate of customs duty to 10% implemented for 10 primary steel products
– galvanised, coated/painted steel (September 2015)
– wire rod, rebar and structural steel (Dec 2015)
– semi-finished steel, steel plates, cold-rolled steel and steel sections (Feb 2016)
– hot rolled coil and other rods, bars and forges (June 2016)
TARIFF COMMITMENTS
1. Investment and improving competitiveness in product lines for key economic sectors (technology, equipment upgrades, skills)
2. Job creation and job retention
3. Pricing remedy and an agreement on a suitable pricing model with government
4. Industrial output
10
STEEL COMMITTEE
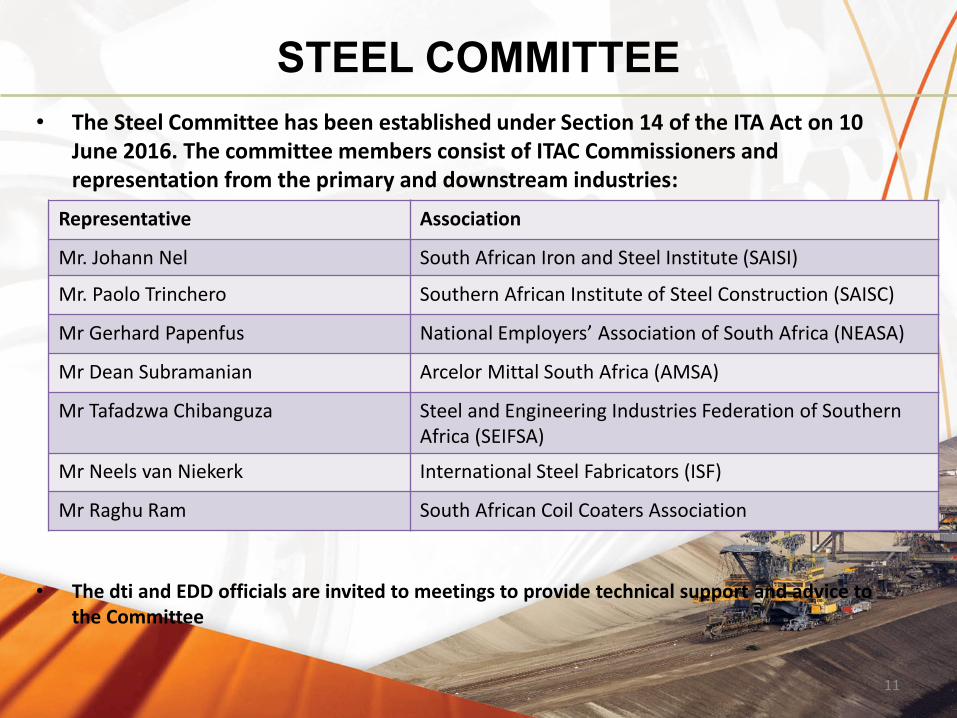
• The Steel Committee has been established under Section 14 of the ITA Act on 10 June 2016. The committee members consist of ITAC Commissioners and representation from the primary and downstream industries:
• The dti and EDD officials are invited to meetings to provide technical support and advice to the Committee
Representative Association
Mr. Johann Nel South African Iron and Steel Institute (SAISI)
Mr. Paolo Trinchero Southern African Institute of Steel Construction (SAISC)
Mr Gerhard Papenfus National Employers’ Association of South Africa (NEASA)
Mr Dean Subramanian Arcelor Mittal South Africa (AMSA)
Mr Tafadzwa Chibanguza Steel and Engineering Industries Federation of Southern Africa (SEIFSA)
Mr Neels van Niekerk International Steel Fabricators (ISF)
Mr Raghu Ram South African Coil Coaters Association
11

STEEL COMMITTEE
The roles and responsibilities of the Committee include monitoring and evaluating
– the performance of the primary steel industry against the set reciprocal commitments including pricing, equipment upgrading, technology, production and employment
– steel pricing for all steel products using the basket pricing methodology for flat steel
– the performance with regard to new investments and growth, ensuring both the short and long term viability of the primary producers as well as the downstream steel fabricating industry
– import and export trends relevant to the steel industry value chain; and
– the preparation of reports with recommendations to the Commission at least bi-annually.
12

INVESTMENT COMMITMENTSProject Capex
(Rm)
Volume
(ktpa)
Date Product Line
Increase colour line capacity 10 18 2016 Appliance
Install new colour line 280 100 2016 Appliance/Roofing, Cladding
Install additional ladle furnace 90 200 2015
Convert continuous annealing to galv 460 230 2016 Automotive/Construction
Develop double reduced tinplate 200 100 2015-16 Packaging
Reline of Corex/Midrex at Saldanha 1050 170 2016* Primary steel making
New coke oven battery at Vanderbijlpark 2550 n/a 2016-18 Primary steel making
Total 4640
* Delayed for 3 years, mini reline underway
13

KEY INVESTMENT ISSUESVEREENIGING AND HIGHVELD
• AMSA are in the process of restarting the:
– Vereeniging Melt shop (specialised long steel)
– Highveld Heavy Structural Mill (with the IDC). Heavy sections that were produced by Highveld in the past are all currently being imported. Retention of 300 jobs that were lost due to Highveld closure
CAPE TOWN IRON AND STEEL WORKS
• In light of recent duties and designations Cisco are ready to re-start the long steel plant
• Significant investment, technology and efficiency upgrades complete and planned employment of 500 people
• Preliminary 12i Tax Incentive approval
• Measures to support better access to domestic scrap metal will be critical. Challenges with current Price Preference System
• National Treasury has developed guidelines for export tax applications
14

KEY ISSUES: FOUNDRIES• Current Status:
– Approximately 170 foundries operating in the formal sector (2015) , output of ~374 000t (2015)
– Employs 13 000 employees (9000 direct; 4000 indirect)
– Serious capacity decline since 2010 (25 foundries closed; 1700 jobs lost)
– In 2015/16 , 9 foundries closed and 635 direct jobs lost
– Three foundries have applied for “business rescue” interventions (2016)
• Challenges:
– Costs (scrap, energy and labour). Price of foundry grade scrap has increased by 28% since Jan 2016.
– Compliance with the environmental legislation: Air Emissions license fees, fines
– Require stronger response to the localisation policy by SOC’s
– Skills Development, ageing equipment and technology
– Accreditation (only 1/3 are internationally accredited limiting participation in global supply chains)
15

DOWNSTREAM SUPPORT MEASURES
TARIFF REVIEW
• the dti requested ITAC to lead a proactive investigation and review of downstream tariffs
• ITAC are working with industry through the associations, surveys including targeted workshops/roadshows to compile the required information.
• The following product groups are targeted for the Phase 1 investigation:– Tubes and pipe fittings
– Structures
– Wire and wire products
– Screws, bolts and nuts
– Gas stoves
– Refrigerators
– Base metal mountings
– Washing and drying machines
– Transformers
– Fully built up locomotives
– Rail parts
16

DOWNSTREAM SUPPORT MEASURES
REBATES
1. Rebates 470.03/521.00 (full waiver or refund) on the customs duty on imported steel used in the manufacture of goods exclusively for export. This rebate is readily available and can be issued within 10 days. Rebate being taken up by re-rollers who export large portion of production.
2. Schedule 3 and 4 rebates (full waiver) on the customs duty on imported steel or steel products that attract duties but are not produced or insufficiently produced domestically and therefore allowing manufacturers to source their intermediate material and component inputs at world prices. Rebate determined on a case by case basis upon application. Autos and appliance sector are applying.
3. ITAC are working on the creation of a Schedule 4 rebate for HRC and plate. The creation of a dedicated rebate provision will allow for efficient implementation in the event of shortages in the market.
17
LOCAL PROCUREMENT:PRIMARY AND
DOWNSTREAM1. Both primary and downstream have raised the need for increased local
demand to drive economies of scale and relieve price and cost pressures
2. Primary producers have requested government to reconsider public procurement of locally manufactured primary steel as input into current and future designated steel products.
3. Steel crisis led to the review of the deeming of steel as one of the measures to support the industry and protect jobs
4. Revised instruction notes for the ‘undeeming’ of primary steel published by National Treasury for 7 designated products in July (two way radio terminals , photovoltaic systems and components , solar water heaters, rail rolling stock , cables, conveyance pipes, working vessels, steel power pylons)
18

LOCAL PROCUREMENT:PRIMARY AND
DOWNSTREAM5. Additional designations of steel construction materials are being
considered to support the downstream job intensive steel sectors including:
fabricated structural steel
wire products
roofing and cladding
ducting and structural pipework, gutters, downpipes and launders
frames
fasteners, joining and connecting components
19

STEEL PRICING PRINCIPLES
The Fair Pricing Principles to be agreed between the parties (AMSA and government)
• Import Parity Pricing (IPP) will be removed as a basis for pricing
• The pricing principles will exclude long products.(unless specifically stated)
• The local price for flat steel products will be based on an import weighted basket (excluding China & Russia) (note A), determined by the weighted average of countries we compete with This will be based on primary data from the CRU and MEPS global steel indices and:
• agreed upon benchmarked “deltas” (note B) will then be added on to the hot rolled coil base price to calculate base prices for other flat steel products; and
• agreed upon averages (not exceeding 11% overall) will be used to calculate “extras”.
20
STEEL PRICING PRINCIPLES
• When AMSA reviews it’s flat steel pricing, it will be done using a transparent mechanism based on forecast basket prices using the latest CRU published prices, where available, and the R/USD exchange rate, assuming a 1 month forward. The announced and published price will include the settlement discount, currently 2,5%.
• Quarterly monitoring of the import weighted basket, and compliance with the pricing mechanism for all flat steel products will be the responsibility of the steel committee under the auspices of ITAC. AMSA’s published pricing will be reviewed based on actuals for the preceding quarter.
• The overall EBIT margin cap to be imposed will have the effect of ensuring that the benefits of iron-ore pricing will result in a benefit to AMSA’s customers and the downstream.
21

STEEL PRICING
NOTE A
Weighted average based on the domestic steel price in countries (excluding China and Russia) we compete with in following steel intensive downstream sectors/sub sectors
1. fabricated metal products
2. machinery and equipment
3. vehicles and other transport equipment
Basket countries are:
• EU 50%
- 50% Germany, 50% (France, UK, Italy, Spain)
• Asia 30%
- 50% Japan, 40% (South Korea and India), 10% Taiwan
• NAFTA plus Brazil 20%
- 75% USA, 25% (Canada and Brazil)
NOTE B
22
Products Deltas over HRC Base Price
Hot Rolled Plate USD 99/t
Cold Rolled Coil USD 95/t
Galvanised Coil USD 177/t
Colour Coated Coil USD 472/t
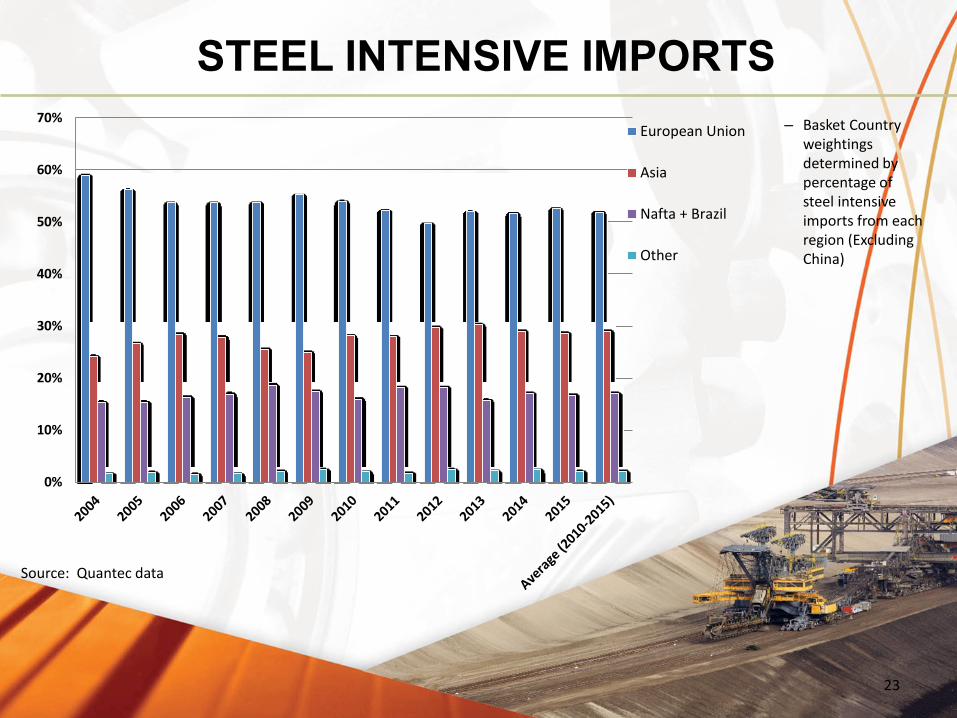
STEEL INTENSIVE IMPORTS
– Basket Country weightings determined by percentage of steel intensive imports from each region (Excluding China)
23
0%
10%
20%
30%
40%
50%
60%
70%European Union
Asia
Nafta + Brazil
Other
Source: Quantec data

STEEL PRICING• Basket aims to provide a fair price
(during boom and bust periods) and in its absence import parity pricing will prevail
• Close correlation between basket and AMSA prices from early 2015 as slump began to take effect
• Global market prices have increased since Feb 2016 as many countries introduced tariff and other measures, increased input costs
• Prices have come down since June, (AMSA reduced prices in July according to basket), global prices will be flat for the medium term
24

COMPETITION COMMISSION SETTLEMENT
The Commission has reached a settlement agreement covering all cases against AMSA, filed with the Tribunal on 22 August 2016 for confirmation
Agreed Terms of Settlement:
• AMSA agreed to pay an administrative penalty of R1.5 billion in five annual instalments of no less than R300 million
• AMSA has agreed to remedies relating to complaints against its pricing conduct: AMSA has undertaken that for a period of five years it will limit its EBIT (earnings before interest and tax) margin to a cap of 10% for flat steel products sold in SA. The 10% margin cap is subject to variation up to a maximum of 15% subject to certain market circumstances as set out in the agreement
• AMSA has committed to a R4.6bn capital expenditure over the next five years
25

CONCLUDING REMARKS - STEEL
• Given the current severe challenges, the future of SA’s steel sector depends on a holistic solution underpinned by interventions that are designed to ensure a sustainable primary steel industry whilst supporting the downstream industry
• Key objectives is to stimulate the economy, generate exports and create employment
• Sustaining a competitive local steel producing capacity and capability will be a significant advantage in contributing to economic growth and infrastructure development in a cost effective manner
• Support for the value added, labour intensive downstream industry remains a priority and imperative of government
• The key outcome is the optimal ‘end state’ of a viable, competitive and sustainable steel industry in SA
26
SELECTED HIGHLIGHTS – CTFL SECTOR
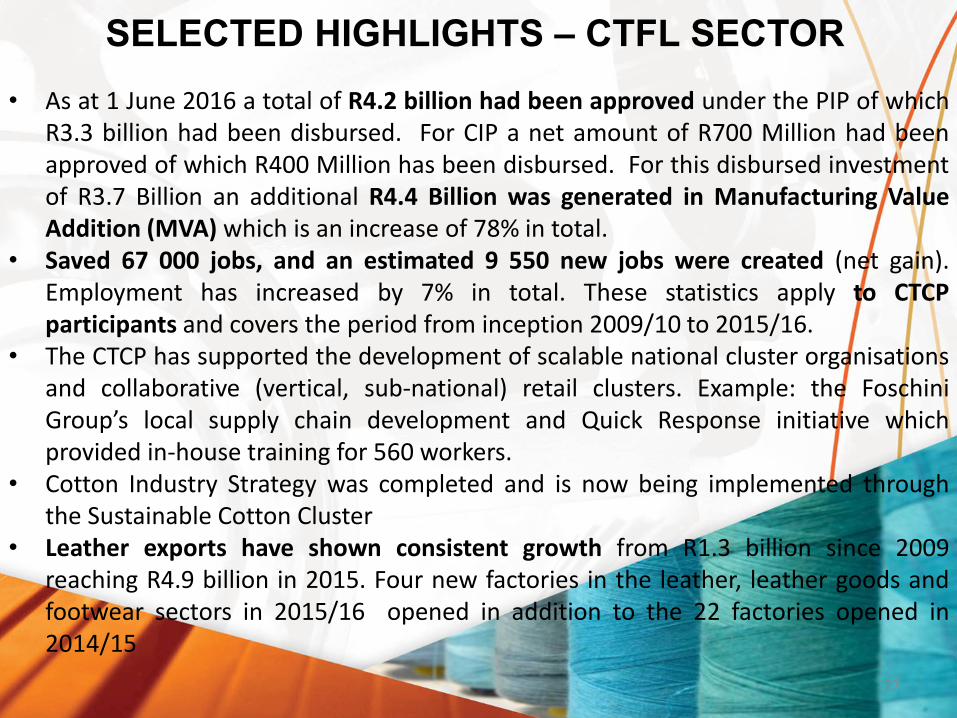
• As at 1 June 2016 a total of R4.2 billion had been approved under the PIP of whichR3.3 billion had been disbursed. For CIP a net amount of R700 Million had beenapproved of which R400 Million has been disbursed. For this disbursed investmentof R3.7 Billion an additional R4.4 Billion was generated in Manufacturing ValueAddition (MVA) which is an increase of 78% in total.
• Saved 67 000 jobs, and an estimated 9 550 new jobs were created (net gain).Employment has increased by 7% in total. These statistics apply to CTCPparticipants and covers the period from inception 2009/10 to 2015/16.
• The CTCP has supported the development of scalable national cluster organisationsand collaborative (vertical, sub-national) retail clusters. Example: the FoschiniGroup’s local supply chain development and Quick Response initiative whichprovided in-house training for 560 workers.
• Cotton Industry Strategy was completed and is now being implemented throughthe Sustainable Cotton Cluster
• Leather exports have shown consistent growth from R1.3 billion since 2009reaching R4.9 billion in 2015. Four new factories in the leather, leather goods andfootwear sectors in 2015/16 opened in addition to the 22 factories opened in2014/15
27

TCFL Employment (1994 to 2015)
28
0
50000
100000
150000
200000
250000
300000
19
94
19
95
19
96
19
97
19
98
19
99
20
00
20
01
20
02
20
03
20
04
20
05
20
06
20
07
20
08
20
09
20
10
20
11
20
12
20
13
20
14
20
15
Emp
loym
en
t
Textile, Clothing, Leather & Footwear Employment (1994 to 2015)
Source: Quantec (1994 to 2015)
The sector employed 238 939 in1994.
Sector employment peaked at 275407 employees in 1996.
• Sector employment declined from250 121 in 2001 to 164 313 in 2009.
Job losses were stabilized by 2014with employment of 137 816,supported by the CTCP introducedin 2009.
Sector employment increased by5 903 from 2014 to 143 719 in 2015.

TCFL SECTOR OUTPUT (1994 to 2015)
29Source: Quantec (1994 to 2015)
0
5
10
15
20
25
30
35
40
45
19
94
19
95
19
96
19
97
19
98
19
99
20
00
20
01
20
02
20
03
20
04
20
05
20
06
20
07
20
08
20
09
20
10
20
11
20
12
20
13
20
14
20
15
Ou
tpu
t R
bill
ion
Textile, Clothing, Leather & Footwear Output R billion (1994 to 2015)
Sector output in 1994 was R10.3billion.
Sector output growth stagnated atR21 billion from 2003 to 2007.
Sector output grew from R26bn in2009 to R41bn in 2015 supportedby the CTCP from 2009.
Exports contributed to sectoroutput growth by R15.9 billionfrom 2009 to 2015.
TCFL IMPORTS (1994 to 2015)
30Source: Quantec (1994 to 2015)
0
10
20
30
40
50
60
70
Imp
ort
s R
bill
ion
Textile, Clothing, Leather & Footwear Imports R billion (1994 to 2015)
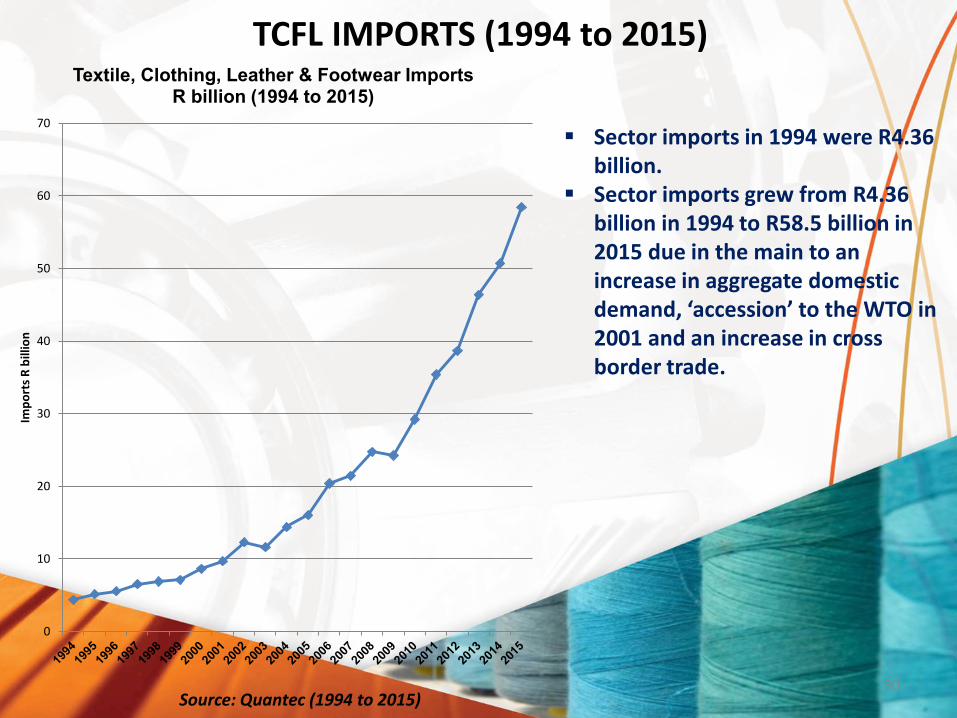
Sector imports in 1994 were R4.36 billion.
Sector imports grew from R4.36 billion in 1994 to R58.5 billion in 2015 due in the main to an increase in aggregate domestic demand, ‘accession’ to the WTO in 2001 and an increase in cross border trade.
TCFL EXPORTS (1994 to 2015)
31Source: Quantec (1994 to 2015)
0
5
10
15
20
25
19
94
19
95
19
96
19
97
19
98
19
99
20
00
20
01
20
02
20
03
20
04
20
05
20
06
20
07
20
08
20
09
20
10
20
11
20
12
20
13
20
14
20
15
Exp
ort
s R
bill
ion
Textile, Clothing, Leather & Footwear Exports (1994 to 2015)
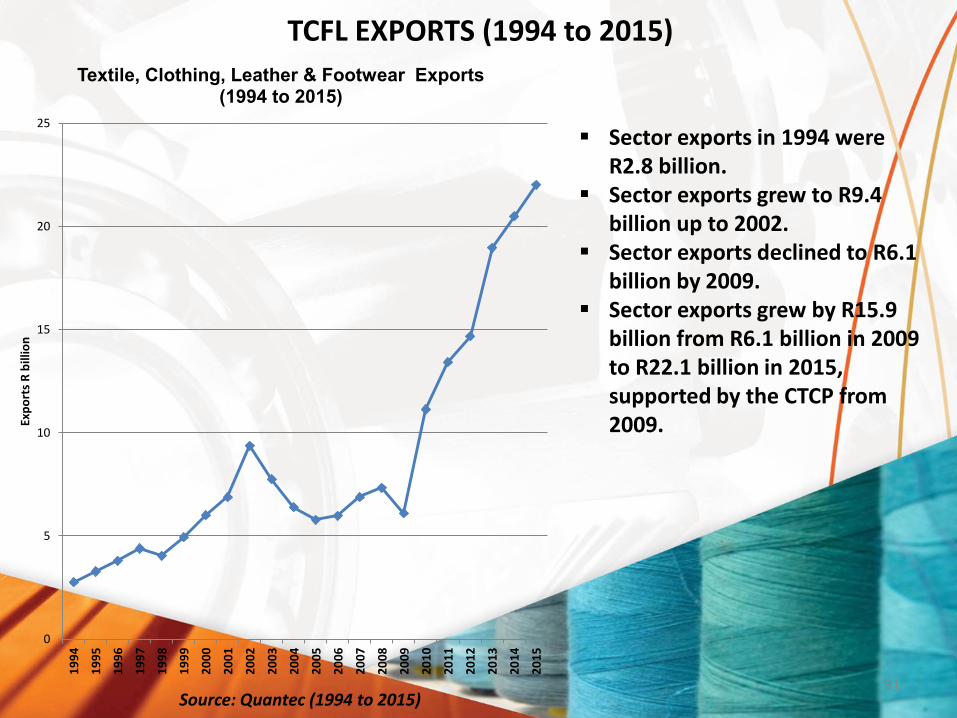
Sector exports in 1994 were R2.8 billion.
Sector exports grew to R9.4 billion up to 2002.
Sector exports declined to R6.1 billion by 2009.
Sector exports grew by R15.9 billion from R6.1 billion in 2009 to R22.1 billion in 2015, supported by the CTCP from 2009.

TCFL TRADE DEFICIT (1994 to 2015)
32Source: Quantec (1994 to 2015)
-40
-35
-30
-25
-20
-15
-10
-5
0
19
94
19
95
19
96
19
97
19
98
19
99
20
00
20
01
20
02
20
03
20
04
20
05
20
06
20
07
20
08
20
09
20
10
20
11
20
12
20
13
20
14
20
15
Trad
e D
efi
cit
R b
illio
n
Textile, Clothing, Leather & Footwear Trade Deficit (1994 to 2015)
The sector trade deficit in 1994 was - R1.6 billion.
The sector trade deficit grew from - R1.6 billion in 1994 to R 3.9 billion in 2003.
The sector trade deficit rapidly grew from - R 3.9 billion in 1994 to - R 36.5 billion in 2015 due to an increase in domestic aggregate demand, ‘accession’ to the WTO in 2001, the increase in cross border trade and a loss of domestic manufacturing capacity.

SELECTED HIGHLIGHTS – CTFL
CTCP beneficiary sales as percentage of domestic sales –
‘recapturing’ the domestic market. (Source dti)
29
,5%
20
,9%
11
,7%
13
,0%
19
,0%
43
,8%
33
,9%
27
,2%
37
,0%
0,0%
10,0%
20,0%
30,0%
40,0%
50,0%
60,0%
Clothing Footwear Leather and Leather Products Textiles Total
2009 2010 2011
2012 2013 2014
2015
33
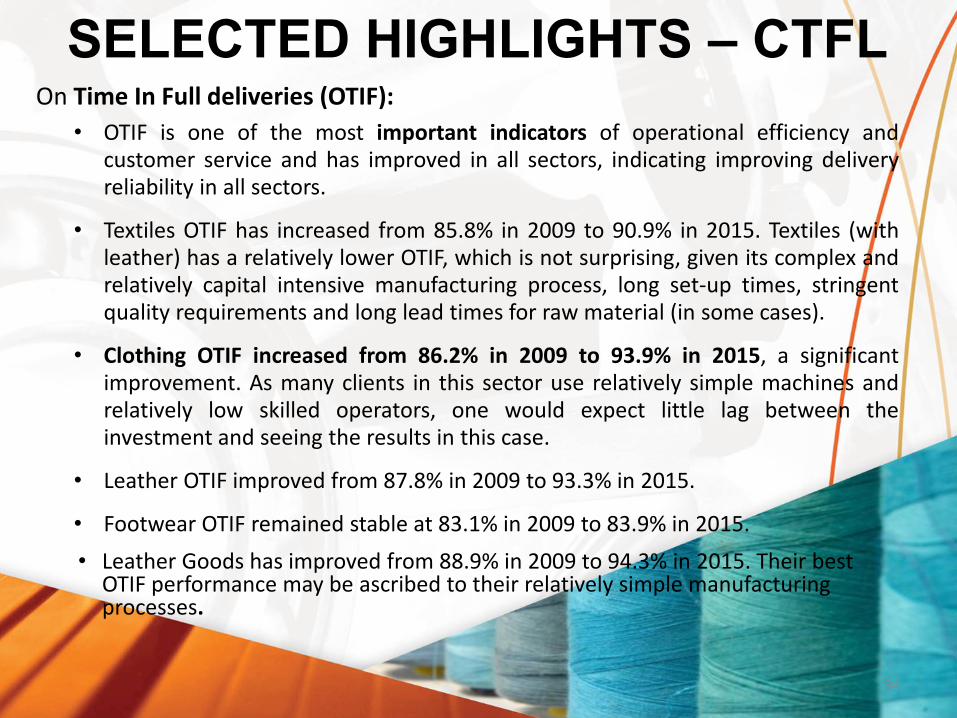
SELECTED HIGHLIGHTS – CTFLOn Time In Full deliveries (OTIF):
• OTIF is one of the most important indicators of operational efficiency andcustomer service and has improved in all sectors, indicating improving deliveryreliability in all sectors.
• Textiles OTIF has increased from 85.8% in 2009 to 90.9% in 2015. Textiles (withleather) has a relatively lower OTIF, which is not surprising, given its complex andrelatively capital intensive manufacturing process, long set-up times, stringentquality requirements and long lead times for raw material (in some cases).
• Clothing OTIF increased from 86.2% in 2009 to 93.9% in 2015, a significantimprovement. As many clients in this sector use relatively simple machines andrelatively low skilled operators, one would expect little lag between theinvestment and seeing the results in this case.
• Leather OTIF improved from 87.8% in 2009 to 93.3% in 2015.
• Footwear OTIF remained stable at 83.1% in 2009 to 83.9% in 2015.
• Leather Goods has improved from 88.9% in 2009 to 94.3% in 2015. Their best OTIF performance may be ascribed to their relatively simple manufacturing processes.
34
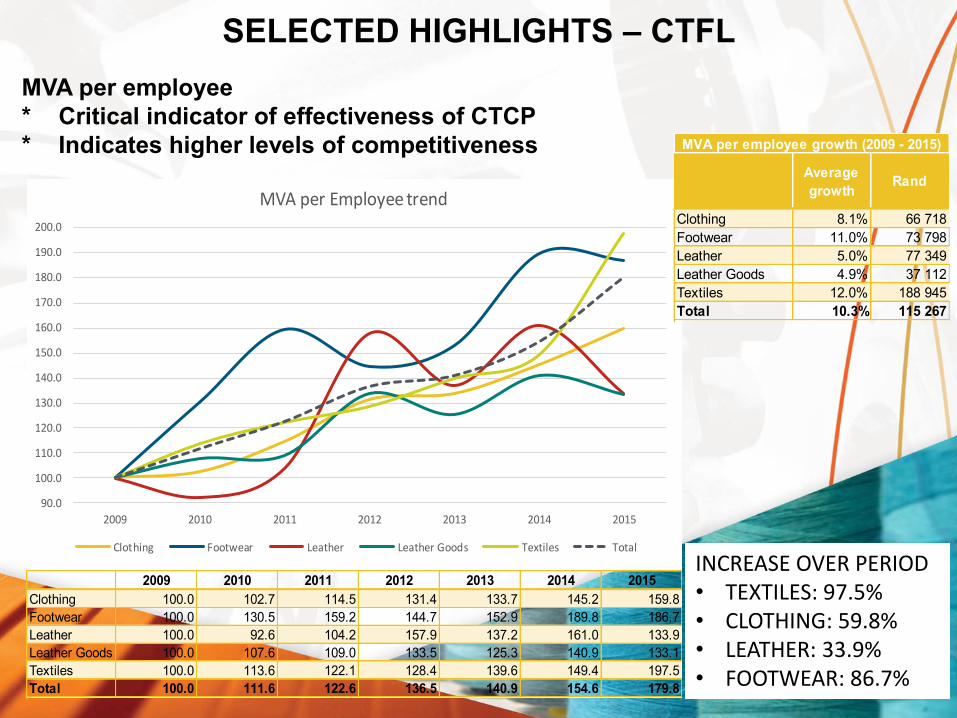
2009 2010 2011 2012 2013 2014 2015
Clothing 100.0 102.7 114.5 131.4 133.7 145.2 159.8
Footwear 100.0 130.5 159.2 144.7 152.9 189.8 186.7
Leather 100.0 92.6 104.2 157.9 137.2 161.0 133.9
Leather Goods 100.0 107.6 109.0 133.5 125.3 140.9 133.1
Textiles 100.0 113.6 122.1 128.4 139.6 149.4 197.5
Total 100.0 111.6 122.6 136.5 140.9 154.6 179.8
90.0
100.0
110.0
120.0
130.0
140.0
150.0
160.0
170.0
180.0
190.0
200.0
2009 2010 2011 2012 2013 2014 2015
MVA per Employee trend
Clothing Footwear Leather Leather Goods Textiles Total
SELECTED HIGHLIGHTS – CTFL
MVA per employee
* Critical indicator of effectiveness of CTCP
* Indicates higher levels of competitiveness
35
Average
growthRand
Clothing 8.1% 66 718
Footwear 11.0% 73 798
Leather 5.0% 77 349
Leather Goods 4.9% 37 112
Textiles 12.0% 188 945
Total 10.3% 115 267
MVA per employee growth (2009 - 2015)
INCREASE OVER PERIOD• TEXTILES: 97.5% • CLOTHING: 59.8%• LEATHER: 33.9%• FOOTWEAR: 86.7%

SELECTED HIGHLIGHTS – CTFL
Labour costs are down as a percentage of sales because total factor productivity is upwhich in turn arises because of competitiveness improvement interventions securedthrough the CIP & PIP. (Source the dti M&E)
36
Labour cost as percentage of sales
2009 2015
Clothing 32.0% 26.8%
Footwear 21.0% 17.7%
Leather 26.0% 10.4%
Leather Goods 19.1% 21.8%
Textiles 15.0% 15.2%
Total 23.3% 20.1%

LEATHER AND FOOTWEAR
Sector Growth (2012 – 2015)
Projected Investment (2016-2020)
Investment Value Proposition 2011 2015 Growth Growth%
Footwear manufacturing million pairs /
year
47 61 +14 +30%
L,LG&F Output (R billion) 12.0 13.44 +1.44 +12%
L,LG&F Domestic (R billion) 9.06 10.79 +1.73 +20%
L,LG&F Exports (R billion) 2.2 4.9 +2.7 +123%
L,LG&F Trade Deficit (R billion) 10.7 9.20 -1.5 -14%
L,LG&F Formal Employment 13926 15996 +2070 +15%
L,LG&F Capital Investment Projection for
sector development R b / (2016 to 2020)
R 1.754 billion
Average Capital Investment projections /
year
R 0.292 billion / year
37
PUBLIC PROCUREMENT
• Local procurement (designations; local content and supplier development in the CSDP and the REIPP and local content enablement in the PPPFA Regulations, NIP etc) is a critical lever for re-industrialisation.
• Roll-out of localisation in public procurement demonstrates need to secure greater compliance with procurement prescripts across government and SOE’s – audit function
• Similarly capacity building is critical. Programmes are in place to build capacity and improve strategic sourcing and supplier development across all spheres of government and State Owned Companies (SOC)
• Private sector support for local procurement has been slow to materialise notwithstanding the Procurement Accord – but some progress is being registered e.g. Mining Cluster
• NT is engaged in a process of reviewing the PPPFA Regulations and Act. A Procurement Bill is being prepared.
38
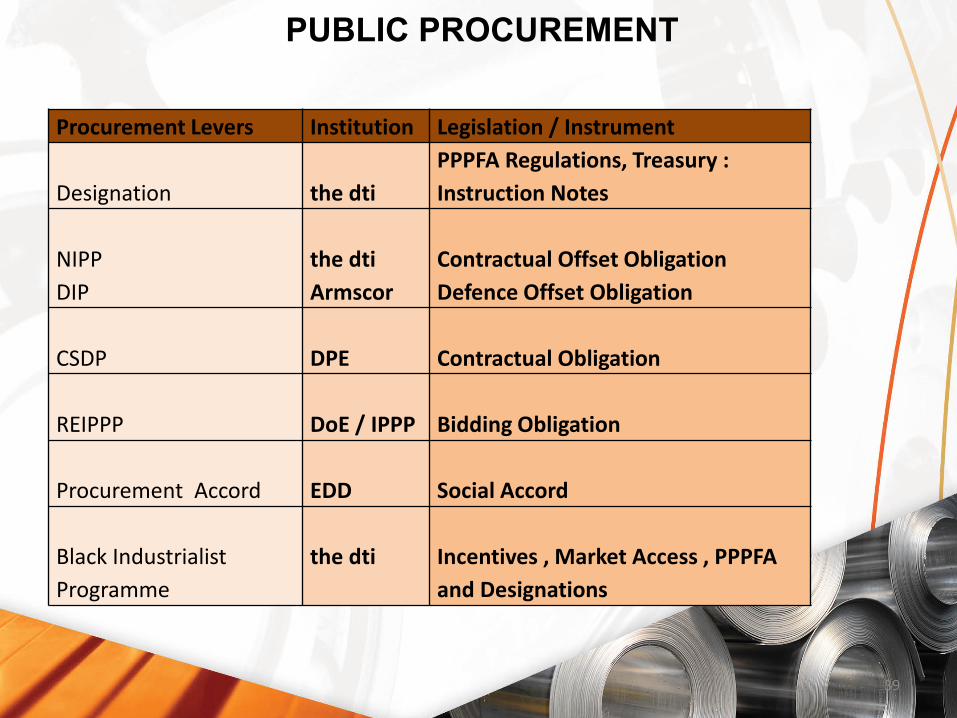
PUBLIC PROCUREMENT
Procurement Levers Institution Legislation / Instrument
Designation the dti
PPPFA Regulations, Treasury :
Instruction Notes
NIPP
DIP
the dti
Armscor
Contractual Offset Obligation
Defence Offset Obligation
CSDP DPE Contractual Obligation
REIPPP DoE / IPPP Bidding Obligation
Procurement Accord EDD Social Accord
Black Industrialist
Programme
the dti Incentives , Market Access , PPPFA
and Designations
39

SELECTED HIGHLIGHTS: PUBLIC PROCUREMENT
40
Designation Matrix
Sectors Already Designated *Minimum
Local Content
Thresholds
Sectors Forwarded to the NT for Designation**
MinimumLocal
ContentThresholds
Description Date Description Date
1. Rail Rolling Stock 65% 16-07-121. Building & Construction Material / Steel Structures 100% 14/15 Q1
2. Bus Bodies 80% 16-07-12 2. Yellow Metals 60% 14/15 Q1
3. Canned / Processed Vegetables 80% 16-07-12 3. Fire trucks / engines 30% 15/16 Q4
4. Textile, Clothing , Leather and
100%16-07-1216-07-12
4. Water meters 40% 15/16 Q4
Footwear Sector 1. Guidelines on the Implementation of Reg. 9.3 of the PPPFA 11-12
5. Solar Water Heaters 70% 19-07-12
6. Set-top Boxes 30% 26-09-12
7. Certain Pharmaceutical Products Per Tender 07-11-12
8. Furniture Products 85% 15-11-12
9. Electrical and Telecom Cables 90% 08-05-13
10. Valves Products and Actuators 70% 06-02-14
11. Working Vessels 10-100% 01-08-14
12. Residential Electricity Meters 50-70% 01-08-14
13 Steel Conveyance Pipes 80-100% 28-09-15
14. Power-line Hardware and Structure 100% 28-09-15
15. Transformers 10-100% 28-09-15
16. Two Way Radios 20-100% 30-06-16
17. Solar PV Components 65% 30-06-16
18. Rail Signalling System 15-90% 30-06-16
19. Wheelie Bins 100% 18-08-16

SELECTED HIGHLIGHTS: PUBLIC PROCUREMENT
RAIL LOCALISATION
• Local content, skills development and training commitments, 1064 locomotives (except 70) are to be built at Transnet Engineering’s plants in Koedoespoort, Pretoria and Durban by four global OEMs
• R1 billion factory complex at Dunnottar, Ekurhuleni is being built by Gibela Rail Transport Consortium for the manufacturing and supply of 600 new trains for PRASA
The contract value of R51 billion expected to provide employment for at least 1,500 people and train 19, 000 artisans;
• With the support of the dti’s Designation Programme, Aberdare Cables, local cables manufacturer launched a new production line at its Pietermaritzburg manufacturing plant to supply to PRASA and Transnet’s combined R100 billion locomotive build programmes.
• A major contract was awarded to Guestro Foundry, a black-owned company, to supply casting components to 4 OEM’s as part of Transnet’s locomotive
41

SELECTED HIGHLIGHTS: PUBLIC PROCUREMENT
• Under the Renewable Energy Independent Power Producer Procurement Programme (REIPPPP), 92 projects approved in 4 successful bidding rounds
The volume of local content spent up to March 2016 was R65.7 billion.
• A tender was awarded to Mercedes-Benz to provide 134 buses for phase 1B of Johannesburg’s Rea Vaya BRT system and 80 new commuter buses for Great North Transport.
• Transversal tenders for blankets, footwear, fabric & towels and clothing, managed and awarded by National Treasury under local content requirements, increased from a total value of R237,9 million in the 2014/5 FY to R279.5 million in the 2016/6 FY
• R700-million of the R1.4 billion TNPA tender awarded to Southern African Shipyards, earmarked for the Supplier Development Plan; approximately 200 additional jobs created and more than 60 apprentice artisans and three marine engineers in training.
• A tender worth nearly R23 million to build workboat ferries for the Navy was awarded to a local vessel manufacturer
42

Thank You
43


