34
Presentation to ECSECC Public Seminars The Role of IPAP in Supporting Industrial Development in South Africa Tebogo Makube (Ph.D.), tha dti 20 August 2014

Presentation to ECSECC Public SeminarsThe Role of IPAP in Supporting Industrial
Development in South AfricaTebogo Makube (Ph.D.), tha dti
20 August 2014
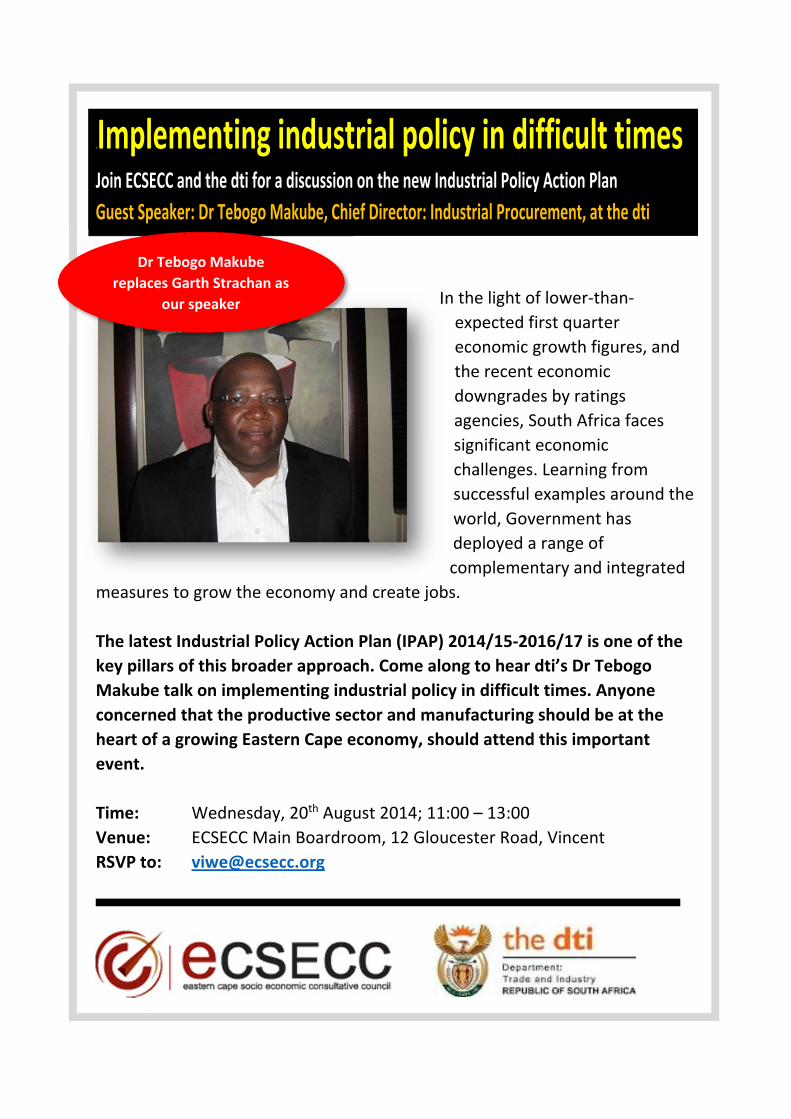
\\Implementing industrial policy in difficult times Join ECSECC and the dti for a discussion on the new Industrial Policy Action Plan Guest Speaker: Dr Tebogo Makube, Chief Director: Industrial Procurement, at the dti
In the light of lower‐than‐expected first quarter economic growth figures, and the recent economic downgrades by ratings agencies, South Africa faces significant economic challenges. Learning from successful examples around the world, Government has deployed a range of complementary and integrated
measures to grow the economy and create jobs. The latest Industrial Policy Action Plan (IPAP) 2014/15‐2016/17 is one of the key pillars of this broader approach. Come along to hear dti’s Dr Tebogo Makube talk on implementing industrial policy in difficult times. Anyone concerned that the productive sector and manufacturing should be at the heart of a growing Eastern Cape economy, should attend this important event. Time: Wednesday, 20th August 2014; 11:00 – 13:00 Venue: ECSECC Main Boardroom, 12 Gloucester Road, Vincent RSVP to: [email protected]
IDr Tebogo Makube
replaces Garth Strachan as our speaker

The Role of IPAP in Supporting Industrial Development in South Africa
Presentation to the Eastern Cape Socio Economic Council (ECSECC)
20 August 2014
Tebogo Makube (Ph.D.)

• Key context; underlying principles and drivers of Industrial Policy ActionPlan (IPAP)
• Economic challenges facing South Africa and the role of the IPAP• Key transversal interventions and supporting agencies• Industrial Finance, Incentives and Special Economic Zones
Purpose
2

• IPAP is aligned with the vision of the NDP and the key growth drivers of theNGP. It seeks to:– Support the economy and reverse the threat of deindustrialisation;– Place it on a more value-adding, labour-intensive and environmentally
sustainable growth path - especially in globally competitive non-traditionaltradable goods and services;
– Produce a decisive shift of focus towards historically disadvantaged peopleand regions of SA;
– Contribute towards comprehensive industrial development in Africa,primarily focused on infrastructure, industrial productive capacity andregional integration.
Underlying principles of IPAP
3

• IPAP assets state leadership in strategic areas of the economy and isinformed by:– Robust research framework and agenda;– Intensive stakeholder engagement;– Intra-governmental coordination and integration;– Identification of key areas of market failure;– Industrial ‘self-discovery’ and learning-by-doing
• It is a product of the Economic Sectors and Employment Cluster.• Its oversight is effected through Ministers Monthly meetings, NEDLAC and
regular reporting to the Parliamentary Portfolio Committee on Trade &Industry.
• It is also committed to internal process improvement and capacity building,both within the dti and in support of its partner institutions
Underlying principles of IPAP (cont…)
4


RSA: Manufacturing challenges & the need for designation
7
In recent years, South Africa South Africa has been posting trade deficits primarily due to deterioration in commodities exports, high imports of fuel and high value added goods. SA recorded a trade deficit of R13.03 billion in April 2014. This can be attributed to exports of R77.42 billion [and imports of R90.45 billion.
Manufacturing contribution to GDP (%)
Source: DTI, SARS, SARB Databases

Structural composition of South Africa’s GDP
8
Source: Own calculations compiled from the South African Reserve Bank database
0
10
20
30
40
50
60
70
80
1950s 1960s 1970s 1980s 1990s 2000s
Gross Value Added
(%) by Sector
Years
Primary Secondary Tertiary
Finance, retail estate & business services
21%
Manufacturing15%
General government services14%
Wholesale, retail & motor trade, catering & accommodation
9%
Transport, storage & communication
9%
Personal services6%
Mining & quarrying5%
Construction3%
Agriculture, forestry & fishing2%
Electricity, gas & water2%
Taxes less subsidies on products14%
Annual contributions to GDP ‐ 2012
Six industries dominate the country’s manufacturing:• Automotive, Chemicals, Metals, Textiles, clothing and footwear, ICT and electronics,
and Agro-processing

SA Economy vs. Global Economic Growth Trends
(4.0)
(2.0)
‐
2.0
4.0
6.0
8.0
10.0
2001 02 03 04 05 06 07 08 09 10 11 12 13 14 15 16 17 18
% GDP Growth
Emerging
World
South Africa
2013 Fcst
Source: International Monetary Fund

RSA: Manufacturing challenges & the need for designation
10
In recent years, South Africa South Africa has been posting trade deficits primarily due to deterioration in commodities exports, high imports of fuel and high value added goods. The trade deficit amounted to R19.05bn in August 2013.
Manufacturing contribution to GDP (%)
Source: DTI, SARS, SARB Databases

• South Africa’s trade patterns have changed in response to global growth trends
• Emerging Markets and SADC share in South Africa’s export basket is rising:
– SADC absorbed 13% of South Africa’s exports over the past year
– almost a quarter of manufactured exports destined to SADC
– exports to China increased to 11.6% in 2012 (averaged 4.2% between 2005-2008)
• Share of exports to the European Union declined from 33% in 2005 to 20.5% in 2012
Source: the dti, StatsSA, SARB, SA National Treasury
Automobiles (25.8) Platinum (6.6) Rhodium( 3.7)Palladium (5.2)
Purifying Machinery (8.6) Platinum (7.2)Coal (6.3)Automobiles (5.5)
Petroleum carbons (4.4) Diesel trucks (3.2) Electrical energy (2.2) Diesel trucks( 3.2)
Iron ore(47) Coal (11.2) Chromium ores (7.7) Ferro-chromium (6.8)
Platinum (35.3) Iron ore (13) Aluminium (4.7) Ferro-chromium (5)
Region/Country Share of Exports (%) Main Products (%)
5.5
12.8
8.8
Commodity
Manufactured
Total
16.1
23.8
20.5
Commodity
Manufactured
Total
3.3
22.4
12.9
Commodity
Manufactured
Total
18.55.4
11.6
Commodity
Manufactured
Total
8.9
4
6.3
Commodity
Manufactured
Total
11
Highlights of South Africa’s Exports, 2013

Household Consumption and Saving
• All income is either spent on consumption or saved in an economy
– Income (Y) = Consumption (C) + Savings (S)– Consumption (C) = Income (Y) - Savings (S) – Savings (S) = Income (Y) – Consumtion (C)
Household debt to disposable income, 1970-2011
20
30
40
50
60
70
80
90
Per c
ent
• Household debt is equivalent to 75% of disposable income after taxes and social grants)• Down from 80% in 2007/8
Source: SARB

IPAP Sectoral Intervention: Cluster 1
13

IPAP Sectoral Intervention: Cluster 2
14

IPAP Transversal Interventions
15

Procurement Levers
National Industrial Participation Programme (NIPP)– Applicable to all government procurement, except State Owned Companies (SOCs)
that have opted for CSDP– Direct NIPP is used in projects where there is potential to develop or support
strategic industries– Indirect NIPP is used in projects where there is no potential or opportunities for
local manufacturing in procured industries– Imported Content => US$10 million
CSDP– Managed by DPE in conjunction with State Owned Companies (SOCs)– Used in instances where there are long term Supplier Development Plans in
place
Designation & Local Production– Used in instances where government has carried out an in depth analysis of the
sector and there is local production capacity and public procurement opportunities. 16

Reform of the PPPFA
17
• Preferential Procurement Policy Framework Act (PPPFA) was enacted in 2000,and its Regulations promulgated in 2001
• The Regulations were amended in 2011 and new regulations came into effecton 7 December 2011.
• Section 9: Local Production and Content
• Paragraph 9 (1) of the Regulations empowers the dti to designate specificindustries where tenders should prescribe that only locally manufacturedproducts with a prescribed minimum threshold for local production and contentwill be considered
• To give effect to government decisions on public procurement; sectors/productswere and are being designated for local production
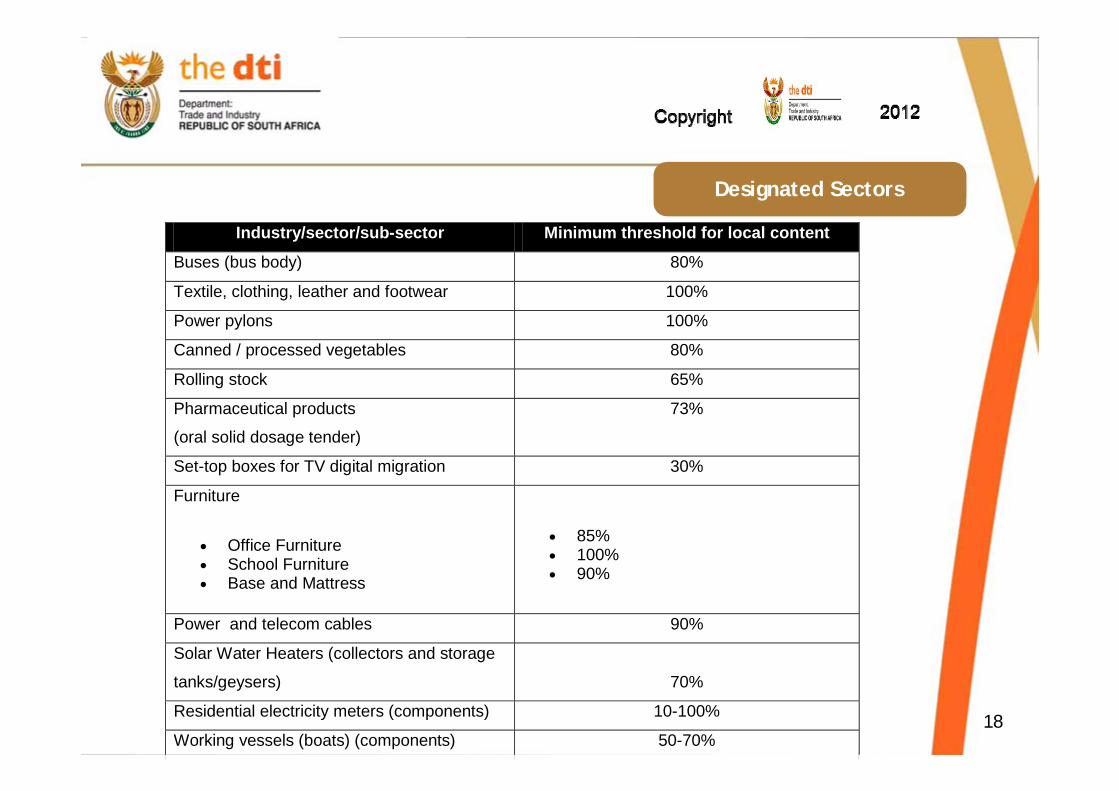
Designated Sectors
18
Industry/sector/sub-sector Minimum threshold for local content
Buses (bus body) 80%
Textile, clothing, leather and footwear 100%
Power pylons 100%
Canned / processed vegetables 80%
Rolling stock 65%
Pharmaceutical products
(oral solid dosage tender)
73%
Set-top boxes for TV digital migration 30%
Furniture
Office Furniture School Furniture Base and Mattress
85% 100% 90%
Power and telecom cables 90%
Solar Water Heaters (collectors and storage
tanks/geysers)
70%
Residential electricity meters (components) 10-100%
Working vessels (boats) (components) 50-70%

Rail Rolling Stock Opportunities

Assembly of MHCV and Busses in South Africa
• Bus body building and assembly is classified under Medium and HeavyCommercial Vehicles (MHCV)
– Iveco; MAN; Mercedes Benz; Scania; Tata; VDL Coach & Bus; Volvo,Marcopolo
20
Assembly Output of medium and heavy commercial vehicles and buses – 2000 to 2015
2000 2001 2002 2003 2004 2005 2006 2007 2008 2009 2010 2011 2012 2013 2014 2015Domestic 12275 13323 14335 16957 21464 27406 33080 37069 34659 19934 22021 26656 27850 29000 31000 33000Exports 679 465 582 469 448 424 539 650 1227 831 861 803 1074 1300 1400 1500Total 12954 13788 14917 17426 21912 27830 33619 37719 35886 20765 22882 27459 28924 30300 32400 34500Y‐o‐Y % Growth 6.4% 8.2% 16.8% 25.7% 27.0% 20.8% 12.2% ‐4.9% ‐42.1% 10.2% 20.0% 5.3% 4.8% 6.9% 6.5%Exports % 5.5% 3.5% 4.1% 2.8% 2.1% 1.5% 1.6% 1.8% 3.5% 4.2% 3.9% 3.0% 3.9% 4.5% 4.5% 4.5%Source: NAAMSA: Industry Production Data: 2000 ‐ 2015

• Regulation 9 (3) prescribes that “…where there is no designated sector, anorgan of state may include, as a specific tendering condition, that only locallyproduced services, works or goods or locally manufactured goods with astipulated minimum threshold for local production and content, will beconsidered, on condition that such prescript and threshold(s) are inaccordance with the specific directives issued for this purpose by theNational Treasury in consultation with the dti”.
Consideration:– Constitutional and legal compliance– Economic and fiscal considerations– Long term public procurement plan and expenditure– Alignment with policy objectives, in particular the creation and
retention of decent jobs– Promotion of SMME’s, geographic spread, technological
capabilities – Local manufacturing capacity and security of supply
Reg. 9.3 (PPPFA Regulations)
21
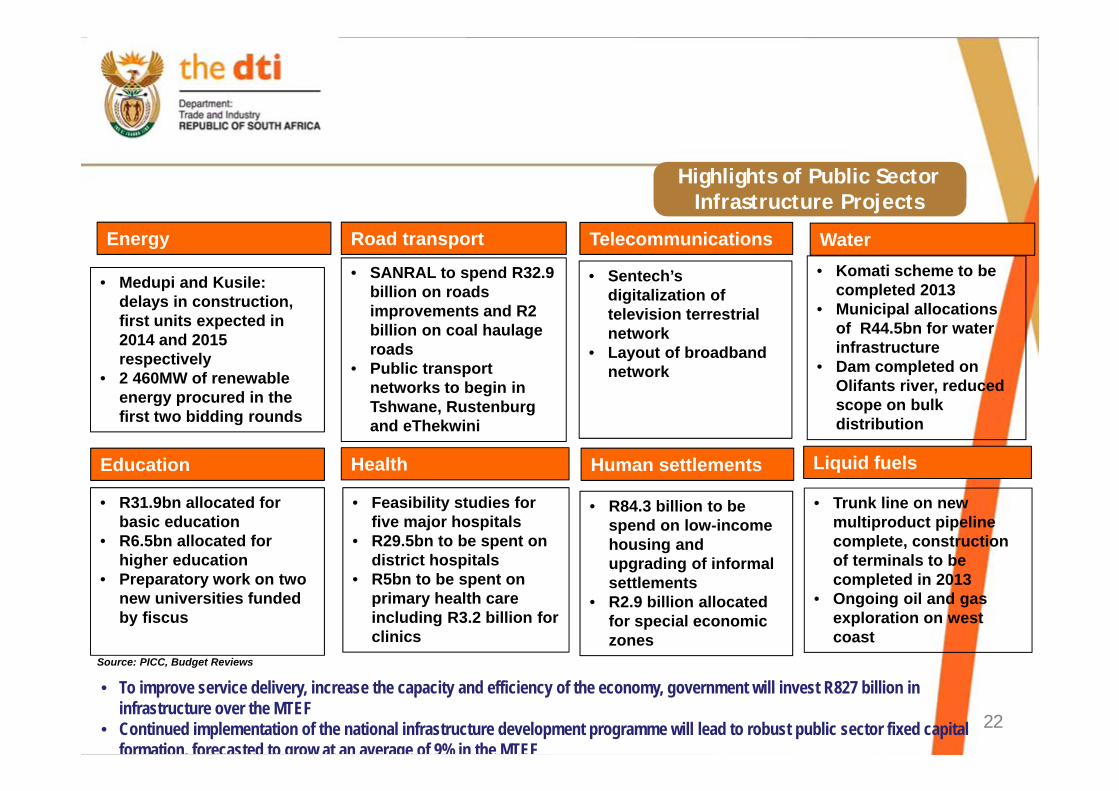
Highlights of Public Sector Infrastructure Projects
22
Energy Road transport Water
• Sentech’s digitalization of television terrestrial network
• Layout of broadband network
• SANRAL to spend R32.9 billion on roads improvements and R2 billion on coal haulage roads
• Public transport networks to begin in Tshwane, Rustenburg and eThekwini
• Komati scheme to be completed 2013
• Municipal allocations of R44.5bn for water infrastructure
• Dam completed on Olifants river, reduced scope on bulk distribution
Education
• Medupi and Kusile: delays in construction, first units expected in 2014 and 2015 respectively
• 2 460MW of renewable energy procured in the first two bidding rounds
Human settlements
• R31.9bn allocated for basic education
• R6.5bn allocated for higher education
• Preparatory work on two new universities funded by fiscus
Health
• Feasibility studies for five major hospitals
• R29.5bn to be spent on district hospitals
• R5bn to be spent on primary health care including R3.2 billion for clinics
• R84.3 billion to be spend on low-income housing and upgrading of informal settlements
• R2.9 billion allocated for special economic zones
Telecommunications
• Trunk line on new multiproduct pipeline complete, construction of terminals to be completed in 2013
• Ongoing oil and gas exploration on west coast
Liquid fuels
Source: PICC, Budget Reviews
• To improve service delivery, increase the capacity and efficiency of the economy, government will invest R827 billion in infrastructure over the MTEF
• Continued implementation of the national infrastructure development programme will lead to robust public sector fixed capitalformation, forecasted to grow at an average of 9% in the MTEF

The importance of local production and content
23
• Goods and services bought from abroad – represents an outflow of funds from South Africa (reduces AD & local AS) – import spending is recorded as negative
• Goods and services sold abroad – represents a flow of funds into the South African economy (raises AD & local AS)

• Leveraging public expenditure
• Supporting economic growth and creation of job opportunities in the country
• Attracting new investments (in particular, foreign direct investments)
• Reducing South Africa's trade deficit
• Overall savings due to lower impact of currency fluctuation (owing to high localcontent) and faster response time to varying demand.
• Consistency of supply, quality-wise - compliance with SABS - SANS 24
Arguments in favour of local content

Support for Emerging / Black Industrialists
• The creation of emerging / black industrialists is one of the key priorities of the dti• Amendments to the B-BBEE legislation and Code of Good Practice with intention of
creating an environment for the meaningful participation of black people, women, youthand people living with disabilities
• Acceleration and up-scaling of support particularly to black-owned, rural and townshipSMMEs as well as cooperative programme– The merger of the national government’s major credit programmes for SMMEs has
been finalised and a new agency SEFA was established in April 2012– Through SEDA’s network of financial service providers (known as Retail Financial
Intermediaries (RFI)), the dti has further improved access to finance for SMME’s
• The dti has partnered with UNISA and WITS University to offer a B-BBEE ManagementDevelopment Programme
• The dti is working on the National Strategic Framework on Women’s EconomicEmpowerment 25

Supplier Development
Preferential Procurement
Skills Development
Regional Economic
Development
• Focus on big contracts for BBBEE• OEM localisation for companies that comply with BBBEE codes.• Develop local suppliers for the manufacturing of strategic items that are
procured overseas.• Build capacity of the existing and future small enterprises.
• Build capacity for small enterprises through skills development.• Training and development , prioritising youth and women.• Partnership with training institutions for practical training.• Continuous investment in sector skill s development
• Localise the manufacturing of material items used in that region wherepossible
• Build capacity and capability of regional suppliers.• Enlist the support of Financial institutions to fund the small enterprises.• Direct investment in Special Economic Zones
• Support local content initiatives• Develop and agree on local content targets• Monitor and report on local content targets, outputs and outcomes.• Build long term relationships with suppliers.
Expected public procurement outcomes

Incentive Schemes managed by the dti
27
CLUSTER INCENTIVE SCHEME
BROADENING PARTICIPATION
• Black Business Supplier Development Programme (BBSDP)
• Co-operative Incentive Scheme (CIS)
COMPETITIVENESS INVESTMENT
• Sector Specific Assistance Scheme (SSAS)• Export Marketing & Investment Assistance (EMIA)
MANUFACTURING INVESTMENT
• Manufacturing Investment Programme (MIP)• Capital Projects Feasibility Programme (CPFP) • 12i Tax Incentive• Automotive Incentive Scheme (AIS)
SERVICES INVESTMENT
• Film & Television Production • Business Process Services (BPS) • Tourism Support Programme (TSP)
INFRASTRUCTURE INVESTMENT
• Critical Infrastructure Programme (CIP) • IDZs

Industrial Financing
28
Manufacturing Competitiveness Enhancement Programme(MCEP)
• Budget allocation of R5.8bn over the 2013/14 MTEF
• Manufacturing support response to companies impacted bystructural and cyclical economic changes
• Deployed towards upgrading competitiveness of labourintensive and value-adding manufacturing sectors
• Grant finance with clear rules-bound access criteria
• Maximise employment and value-added potential in keysectors
• Exclusions: sectors with dedicated support programmes

IPAP: 2012/13-2014/15 Strategic Priorities
29
Special Economic Zones (SEZ’s)
• Budget allocation of R2,3bn over MTEF forSEZ’s
• Promote creation of a regionally diversifiedindustrial economy
• Establish broader range of industrial parksand infrastructure for effective clusteringand hubs
• A dedicated and integrated legislativeframework to enable effective regulationand management
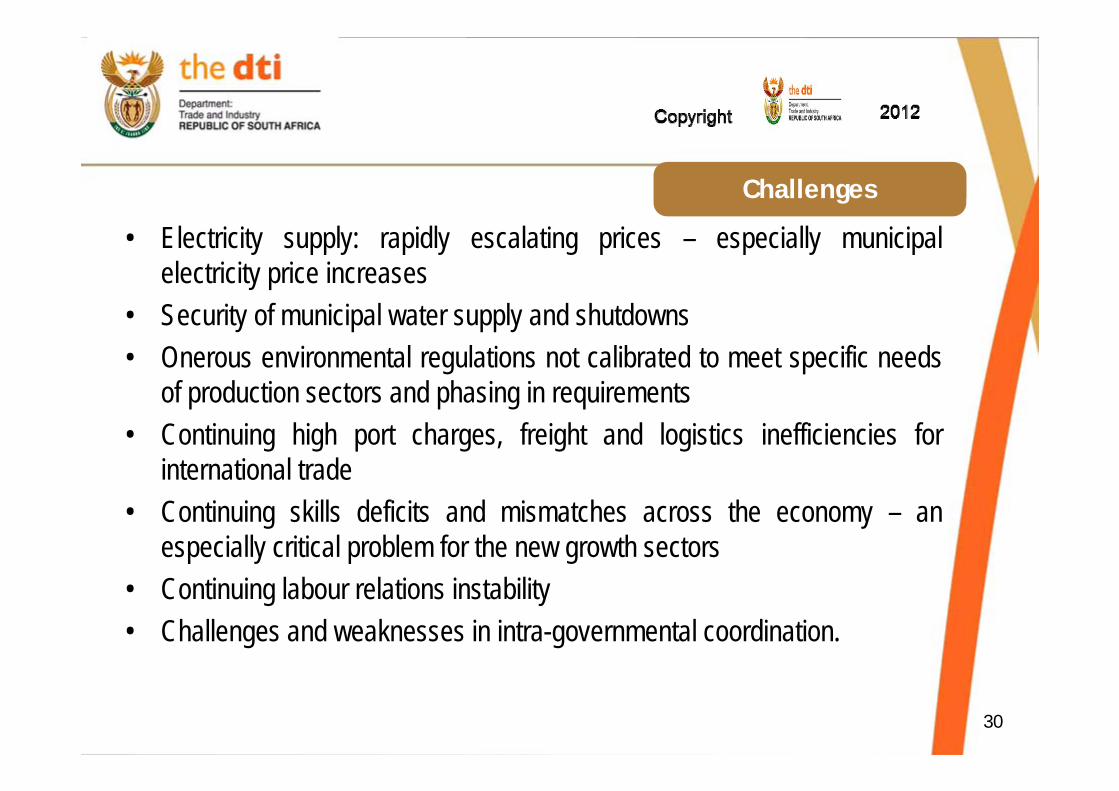
Challenges
• Electricity supply: rapidly escalating prices – especially municipalelectricity price increases
• Security of municipal water supply and shutdowns• Onerous environmental regulations not calibrated to meet specific needs
of production sectors and phasing in requirements• Continuing high port charges, freight and logistics inefficiencies for
international trade• Continuing skills deficits and mismatches across the economy – an
especially critical problem for the new growth sectors• Continuing labour relations instability• Challenges and weaknesses in intra-governmental coordination.
30

Work in Progress
• Capacity building in procurement planning; strategic sourcing and supplierdevelopment, contract management, and market and value chains needs to beurgently addressed
• Supplier Development Programme providing value chain analysis and capacitybuilding for SMME’s and Co-operatives
• There needs to be a much greater push (e.g. through contracts, licenses,financial and non-financial incentives) to get the private sector – in particularlarge corporates to commit to local procurement and supplier development ratherthan the current approach captured in the Procurement Accord
• The price reference system and the risk premium government is prepared to payfor socio-economic objectives (80/20 < R1m, 90/10 > R1m) or 70/30 > R1m
• Alignment of BB-BEE Scorecards (enterprise and supplier development) andCompetitive Supplier Development Programme (CSDP) 31

32


