91
January 2009 SARAS S.p.A. 1 Presentation to investors Last update: Jan 2009

January 2009 SARAS S.p.A. 1
Presentation to investors
Last update: Jan 2009

January 2009 SARAS S.p.A. 2
Contents
• Saras Group Overview
• EBITDA by Business Segment
• Vision and Strategic goals
SARAS IN A SNAPSHOT page 4
• Demand Growth (by product and region)
• Supply/Demand Balance
• Crude Prices
• Refinery Utilisation
• Prices, Stocks and Crack Spreads
• Global Refining Margins
MARKET OVERVIEW page 8
• Refining investments
• Impact on Product yields and Margin growth
• Total CAPEX
• Reference long term runs and CAPEX
• Investments in Power
• Investments in Marketing
• Wind and Gas Exploration
INVESTMENT PLAN 2008-11 page 56
• Financial targets
• Group Financials
• Segment financials
• Changes in Taxation
• Analysts estimates
FINANCIALS page 71
• Board of Directors and Top management
• Management compensation
• Corporate governance
• Personnel
• HSE
• Website
OTHERS page 84
• Complexity and conversion capacity
• Exposure to “Diesel - Fuel Oil” differential
• EMC Benchmark and Saras performance
• Guidance on refining margins
• Operational Flexibility
COMPETITIVE POSITIONING page 22
• Refining
• IGCC Power generation
• Marketing
• Wind
BUSINESS SEGMENTS page 29
January 2009 SARAS S.p.A. 3
Disclaimer
Certain statements contained in this presentation are based on the belief of the Company, as well as factual assumptions made by any information available to the Company. In particular, forward-looking statements concerning the Company’s future results of operations, financial condition, business strategies, plans and objectives, are forecasts and quantitative targets that involve known and unknown risks, uncertainties and other important factors that could cause the actual results and condition of the Company to differ materially from that expressed by such statements.

• Saras in a Snapshot
•• Market OverviewMarket Overview
•• Competitive PositioningCompetitive Positioning
•• Business SegmentsBusiness Segments
•• Investment Plan 2008Investment Plan 2008--20112011
•• FinancialsFinancials
•• OthersOthers

January 2009 SARAS S.p.A. 5
Saras in a Snapshot
ITALYSPAIN
Ulassai
Sarroch
Sardinia
• 300,000 bl/day high complexity refinery integrated with petrochemical & power
Cartagena
Arcola
Pure play refiner with stabilization of returns from Power generation
• Marketing activities based in the high diesel demand regions of Italy and Spain
• Investing also in renewable energy
• World’s largest liquid fuel gasification plant, converting heavy bottoms into clean gas, fed into a 575 MW CCGT
Refinery&Power plant
Wind farm
Tank farm
Tank farm
• diesel yield above 50%, the highest amongst European listed refiners
• flexible operations to exploit market opportunities
• stable cashflows
• fuel oil yield close to zero
• Sales of 4 mtons/ year (mainly diesel), in wholesale market
• 200 kton/year biodiesel plant near Cartagena, integrated with existing depot (ready in Q4/2008)
• New depot in Sagunto (260,000 mc, 14 tanks), in final permitting phase (expected completion by H2/2011)
• 72 MW wind farm located in Sardinia
• Pipeline of projects in Southern Italy
Retailstations
Sagunto
Biodiesel Plant
Tank farm

January 2009 SARAS S.p.A. 6
EBITDA BY BUSINESS SEGMENT (Jan – Sep 2008)
Saras in a Snapshot
Wind
2%
Refining 63%
Power
Generation
30%
Marketing
5%
3327MARKETING
515
1
11
151
325
JanJan--SepSep 20082008
613Group Comparable2 EBITDA
26WIND1
372REFINING
182POWER GENERATION
0OTHER
20072007EUR ml
1. Until 30.06.2008, WIND was a Joint Venture Consolidated under the equity method (Saras share 70%). Subsequently, Saras acquired from Babcock & Brown its minority share. Therefore figures for WIND have been restated at 100%
2. Calculated evaluating inventories at LIFO and deducting non recurring items

January 2009 SARAS S.p.A. 7
• Best in class refiner, through sustainable technological excellence
Saras in a Snapshot
VISION
STRATEGIC GOALS
• Prioritize organic growth in our core business, moving towards a “ZERO FUEL OIL”configuration
• Grow selectively in marketing & renewables
• Maintain top of the industry return on investment

•• Saras in a SnapshotSaras in a Snapshot
• Market Overview
•• Competitive PositioningCompetitive Positioning
•• Business SegmentsBusiness Segments
•• Investment Plan 2008Investment Plan 2008--20112011
•• FinancialsFinancials
•• OthersOthers

January 2009 SARAS S.p.A. 9
Market Overview
OIL PRODUCTS GLOBAL DEMAND GROWTH
• IEA “Oil Market Report” – 16 Jan 2009:• World oil demand forecasted at -0.3% in 2008 and -0.6%
in 2009, following IMF revision of GDP growth estimates
• OECD down by 3.3% in 2008 and 2.5% in 2009 (mainly
driven by Japan and US, while Europe stays approx. flat)
• Non-OECD up by 3.7% in 2008 and 1.8% in 2009, mainly
driven by China, India, Latin America and Middle East
• In the mid-term (2009-13), geographic differences in demand growth:
� OECD expected to decrease by 0.1% on average per
year, from 47.0 mb/d in 2009 to 46.8 mb/d in 2013
� Non-OECD, by contrast, forecasted to increase by 3.1%
per year, from 39.4 mb/d in 2009 to 44.4 mb/d in 2013
• Diverging trends for individual products:� Gasoline, LPG & Naphtha will grow approx. by 1% p.a.
� Middle Distillates expected to grow approx. 2% p.a.
� Fuel Oil demand forecasted to shrink
Sources: IEA – “Medium Term Oil Market Report” , Jul08IEA – “Medium Term Oil Market Report – Supplement” , Dec08 IEA – “Monthly Oil Market Report”, Jan09

January 2009 SARAS S.p.A. 10
Market Overview
• Diesel is primary transportation fuel
� commercial use key driver
� private cars in Europe
� greater fuel efficiency
� more stringent CO2 emissions targets
� possible “dieselisation” of US car fleet
• Gasoil used as heating oil, but also
as an important power source in
emerging economies
• Shipping industry will progressively
switch from bunker fuel oil to gasoil
MIDDLE DISTILLATES WILL CONTINUE TO BE THE LEADING FUELS
2009-2015 avg. growth rate approx. 2%
Middle Distillates demand forecastsource EMC World Refining Outlook
4,9 5,0 5,1
6,8 7,0 7,4
7,3 7,58,3
1,5 1,6
1,94,3 4,4
5,0
0
2
4
6
8
10
12
14
16
18
20
22
24
26
28
30
2009 2010 2015
Mil
lio
n b
/d
North America Europe Asia Middle East others
January 2009 SARAS S.p.A. 11
Market Overview
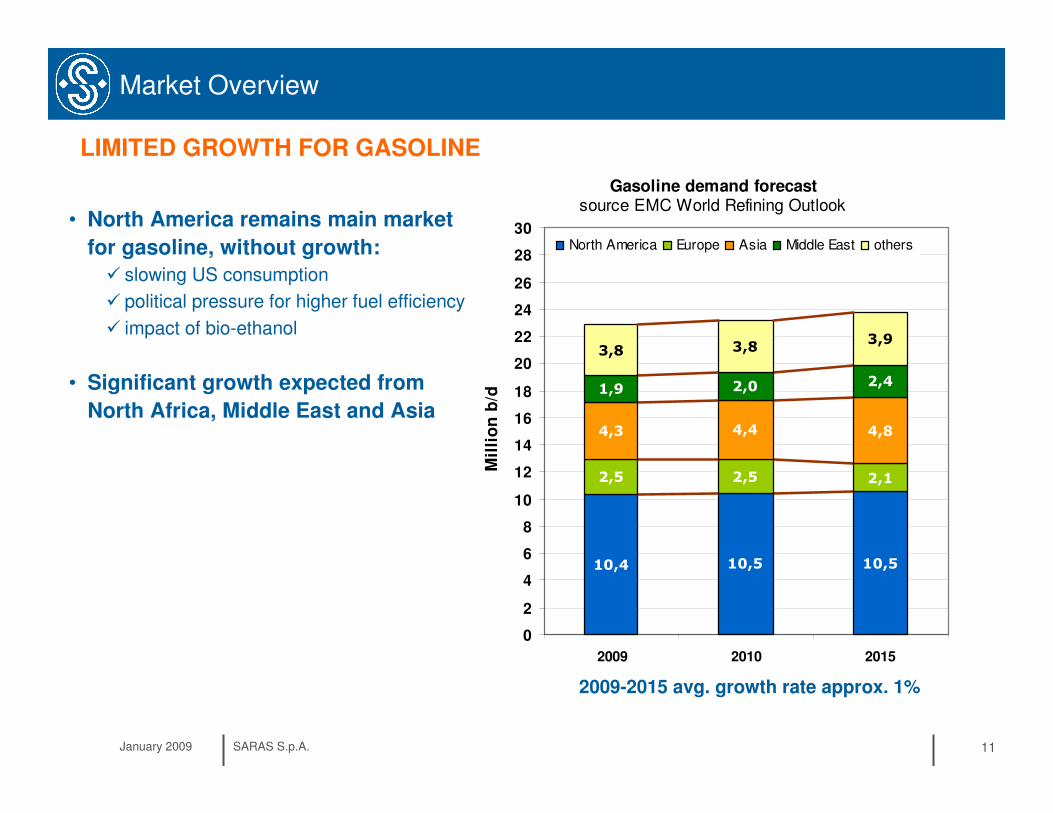
• North America remains main market
for gasoline, without growth:
� slowing US consumption
� political pressure for higher fuel efficiency
� impact of bio-ethanol
• Significant growth expected from
North Africa, Middle East and Asia
LIMITED GROWTH FOR GASOLINE
2009-2015 avg. growth rate approx. 1%
Gasoline demand forecastsource EMC World Refining Outlook
10,4 10,5 10,5
2,5 2,5 2,1
4,3 4,4 4,8
1,9 2,0 2,4
3,83,9
3,8
0
2
4
6
8
10
12
14
16
18
20
22
24
26
28
30
2009 2010 2015
Mil
lio
n b
/d
North America Europe Asia Middle East others

January 2009 SARAS S.p.A. 12
Market Overview
• Declining power generation demand due to fuel switch (gas, coal) and renewables
• Increasing consumption of higher quality bunker fuel, but in a changing environment:
� cap of 4.5% sulphur in marine bunker oil reduced to 3.5% from 2012, then down to 0.5% from 2020
� in the SECAs(*) current 1.5% sulphur cap reduced to 1% from 2010, and then down to 0.1% from 2015
• Ship owners will have two options:
� use gasoil (more likely and practical)
� install “scrubbers” to reduce sulphur content in exhaust gas (complex and environmentally unfriendly)
DECLINING DEMAND AND CHANGING SPECS FOR FUEL OIL
(*) Currently there are only two Sulphur Emission Control Areas (SECAs) - in the Baltic Sea and the North Sea – more are expected to be imposed in due course, particularly off the coasts of North America and Med Europe

January 2009 SARAS S.p.A. 13
Market Overview
INVESTMENT DELAYS AND CANCELLATIONS• Since 2005, more than 160 projects (between grassroots and expansions) have been announced, totaling over 25 million b/d of
new crude distillation capacity, due to come on stream globally pre-2015
• However, construction costs skyrocketed in recent years, reaching 25,000 - 35,000 USD/bpd for state of the art refineries, and
environmental organizations staged fierce opposition to the identification of new sites in OECD countries
• Limited availability of funds due to the global financial crisis and the credit crunch, together with a sharp fall in costs for raw
materials (steel, cement, etc.) prompted a wave of cancellations and delays in refining investments
• Therefore, only 30 new projects out of ~160 announcements are currently expected to come on stream, with NOC’s providing for
the largest part of the new capacity additions (approx. 11 million b/d, by 2015)
Source: Wood MacKenzie. Base Year, Jan 2008
January 2009 SARAS S.p.A. 14
Market Overview
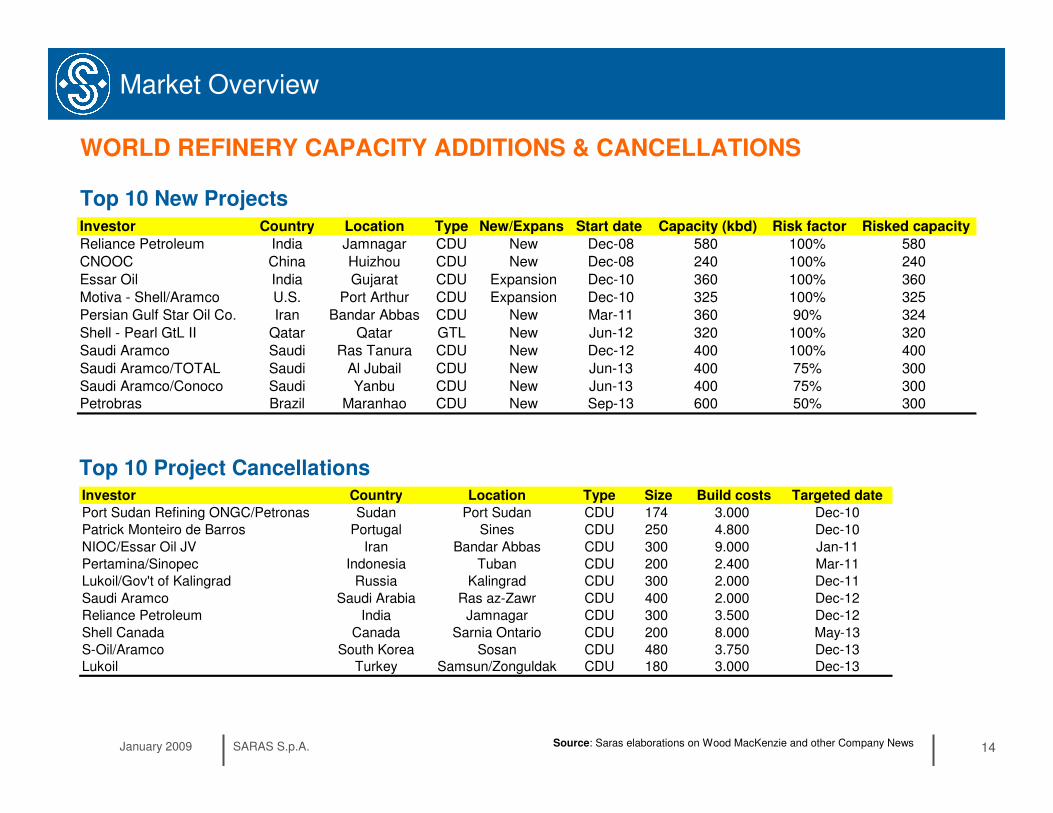
WORLD REFINERY CAPACITY ADDITIONS & CANCELLATIONS
Source: Saras elaborations on Wood MacKenzie and other Company News
Investor Country Location Type New/Expans Start date Capacity (kbd) Risk factor Risked capacity
Reliance Petroleum India Jamnagar CDU New Dec-08 580 100% 580
CNOOC China Huizhou CDU New Dec-08 240 100% 240
Essar Oil India Gujarat CDU Expansion Dec-10 360 100% 360
Motiva - Shell/Aramco U.S. Port Arthur CDU Expansion Dec-10 325 100% 325
Persian Gulf Star Oil Co. Iran Bandar Abbas CDU New Mar-11 360 90% 324
Shell - Pearl GtL II Qatar Qatar GTL New Jun-12 320 100% 320
Saudi Aramco Saudi Ras Tanura CDU New Dec-12 400 100% 400
Saudi Aramco/TOTAL Saudi Al Jubail CDU New Jun-13 400 75% 300
Saudi Aramco/Conoco Saudi Yanbu CDU New Jun-13 400 75% 300Petrobras Brazil Maranhao CDU New Sep-13 600 50% 300
Top 10 New Projects
Investor Country Location Type Size Build costs Targeted date
Port Sudan Refining ONGC/Petronas Sudan Port Sudan CDU 174 3.000 Dec-10
Patrick Monteiro de Barros Portugal Sines CDU 250 4.800 Dec-10
NIOC/Essar Oil JV Iran Bandar Abbas CDU 300 9.000 Jan-11
Pertamina/Sinopec Indonesia Tuban CDU 200 2.400 Mar-11
Lukoil/Gov't of Kalingrad Russia Kalingrad CDU 300 2.000 Dec-11
Saudi Aramco Saudi Arabia Ras az-Zawr CDU 400 2.000 Dec-12
Reliance Petroleum India Jamnagar CDU 300 3.500 Dec-12
Shell Canada Canada Sarnia Ontario CDU 200 8.000 May-13
S-Oil/Aramco South Korea Sosan CDU 480 3.750 Dec-13Lukoil Turkey Samsun/Zonguldak CDU 180 3.000 Dec-13
Top 10 Project Cancellations
January 2009 SARAS S.p.A. 15
Market Overview
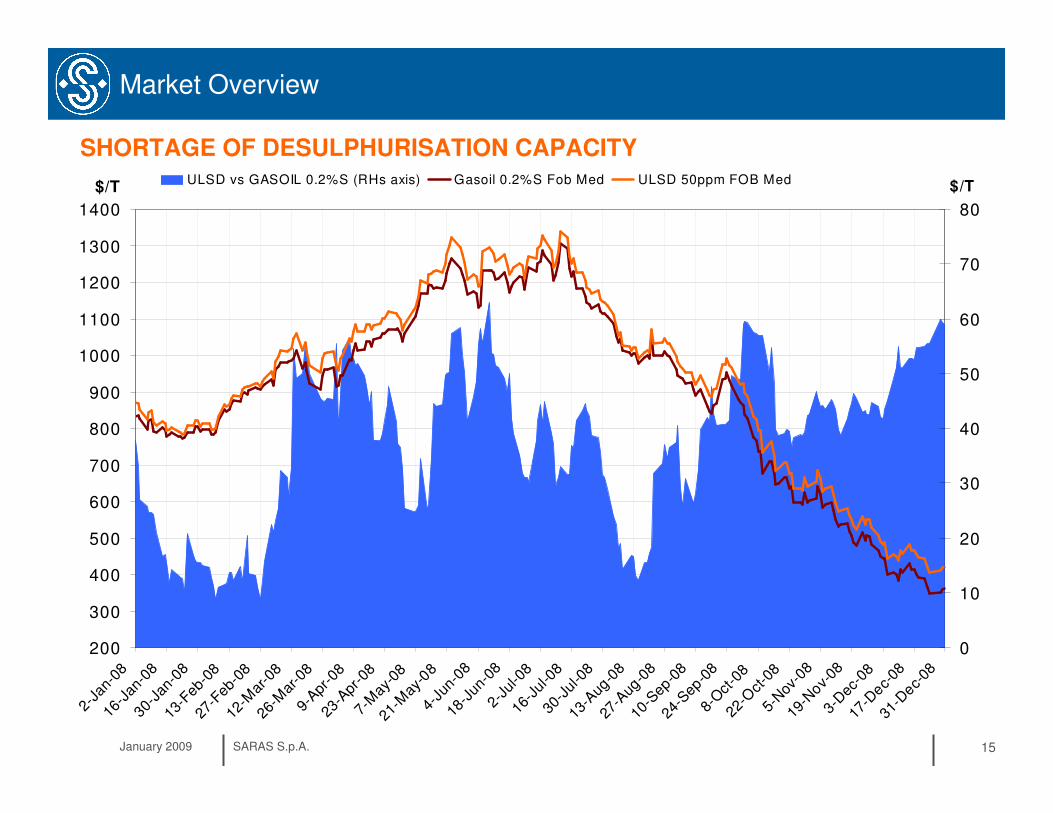
SHORTAGE OF DESULPHURISATION CAPACITY
200
300
400
500
600
700
800
900
1000
1100
1200
1300
1400
2-Ja
n-08
16-J
an-0
830
-Jan
-08
13-F
eb-0
827
-Feb
-08
12-M
ar-0
826
-Mar
-08
9-Apr
-08
23-A
pr-0
87-
May
-08
21-M
ay-0
84-
Jun-
0818
-Jun
-08
2-Ju
l-08
16-J
ul-0
830
-Jul
-08
13-A
ug-0
827
-Aug
-08
10-S
ep-0
824
-Sep
-08
8-O
ct-0
822
-Oct
-08
5-N
ov-0
819
-Nov-
083-
Dec
-08
17-D
ec-08
31-D
ec-08
$/T
0
10
20
30
40
50
60
70
80
$/TULSD vs GASOIL 0.2%S (RHs axis) Gasoil 0.2%S Fob Med ULSD 50ppm FOB Med

January 2009 SARAS S.p.A. 16
0
2 0
4 0
6 0
8 0
1 0 0
1 2 0
1 4 0
Jan-99
Apr-
99Ju l-9
9O
ct-99
Jan-00
Apr-
00Ju l-0
0O
ct-00
Jan-01
Apr-
01Ju l-0
1O
ct-01
Jan-02
Apr-
02Ju l-0
2O
ct-02
Jan-03
Apr-
03Ju l-0
3O
ct-03
Jan-04
Apr-
04Ju l-0
4O
ct-04
Jan-05
Apr-
05Ju l-0
5O
ct-05
Jan-06
Apr-
06Jul-0
6O
ct-06
Jan-07
Apr-
07Ju l-0
7O
ct-07
Jan-08
Apr-
08Ju l-0
8O
ct-0
8Jan-0
9
$ /b l
0
2
4
6
8
1 0
1 2
1 4
$ /b lB r e n t v s A r a b H v y ( R H s a x is ) B r e n t d td U r a ls M e d A r a b ia n H e a v y M e d
Market Overview
Source: Platt’s – last update 13th Jan 2009
PRICES FOR REFERENCE CRUDES
0
2 0
4 0
6 0
8 0
1 0 0
1 2 0
1 4 0
Jan-99
Apr-
99
Jul-99
Oct
-99
Jan-00
Apr-
00
Jul-00
Oct
-00
Jan-01
Apr-
01
Jul-01
Oct
-01
Jan-02
Apr-
02
Jul-02
Oct
-02
Jan-03
Apr-
03
Jul-03
Oct
-03
Jan-04
Apr-
04
Jul-04
Oct
-04
Jan-05
Apr-
05
Jul-05
Oct
-05
Jan-06
Apr-
06
Jul-06
Oct
-06
Jan-07
Apr-
07
Jul-07
Oct
-07
Jan-08
Apr-
08
Jul-08
Oct
-08
Jan-09
$ /b l
0
5
1 0
1 5
2 0
2 5
$ /b lW T I v s M a y a ( R H s a x is ) W T I M a y a
January 2009 SARAS S.p.A. 17
O E C D E u ro p e : R e f in e r y u t iliz a t io n
7 5
7 7
7 9
8 1
8 3
8 5
8 7
8 9
9 1
9 3
9 5
J a n F e b M a r A p r M a y Ju n Ju l A u g S e p O c t N o v D e c
% utilization
U S A : R efinery u tilization
65
70
75
80
85
90
95
100
1 4 7 10 13 16 19 22 25 28 31 34 37 40 43 46 49 52
W eek n°
% u
tiliza
tio
n
Market Overview
2008
2007
'02-'06 avg
'02-'06 range
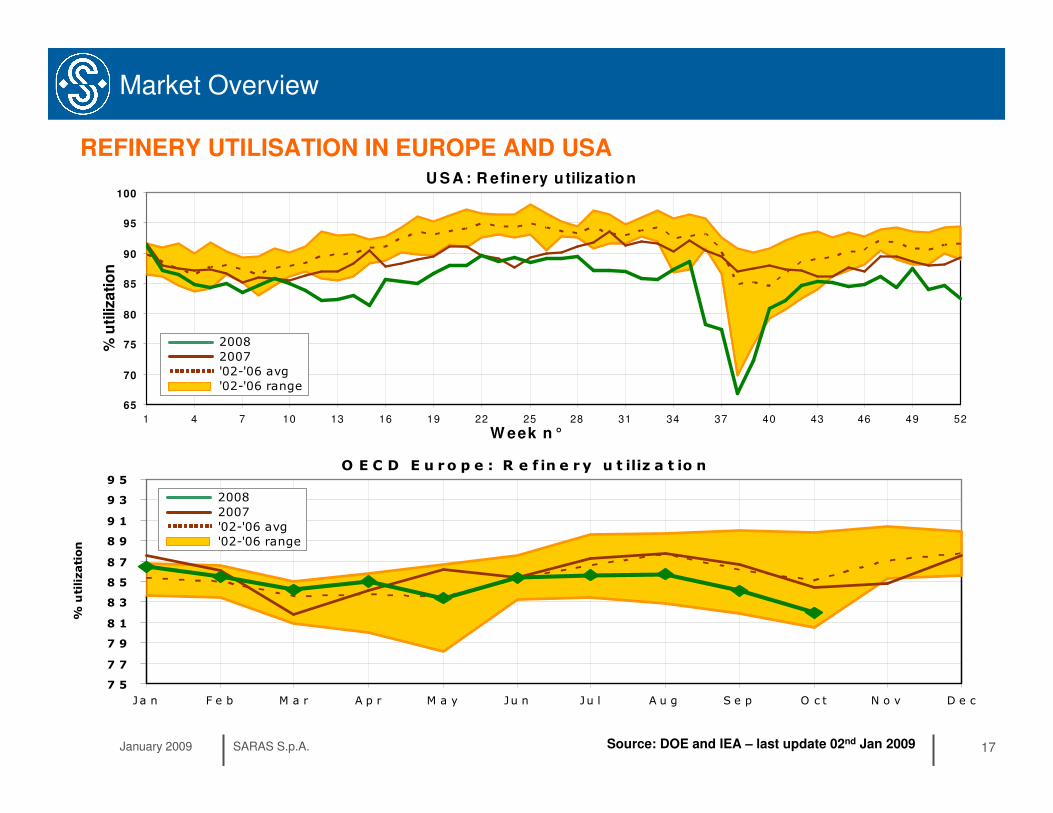
REFINERY UTILISATION IN EUROPE AND USA
2008
2007
'02-'06 avg
'02-'06 range
Source: DOE and IEA – last update 02nd Jan 2009
January 2009 SARAS S.p.A. 18
Market Overview
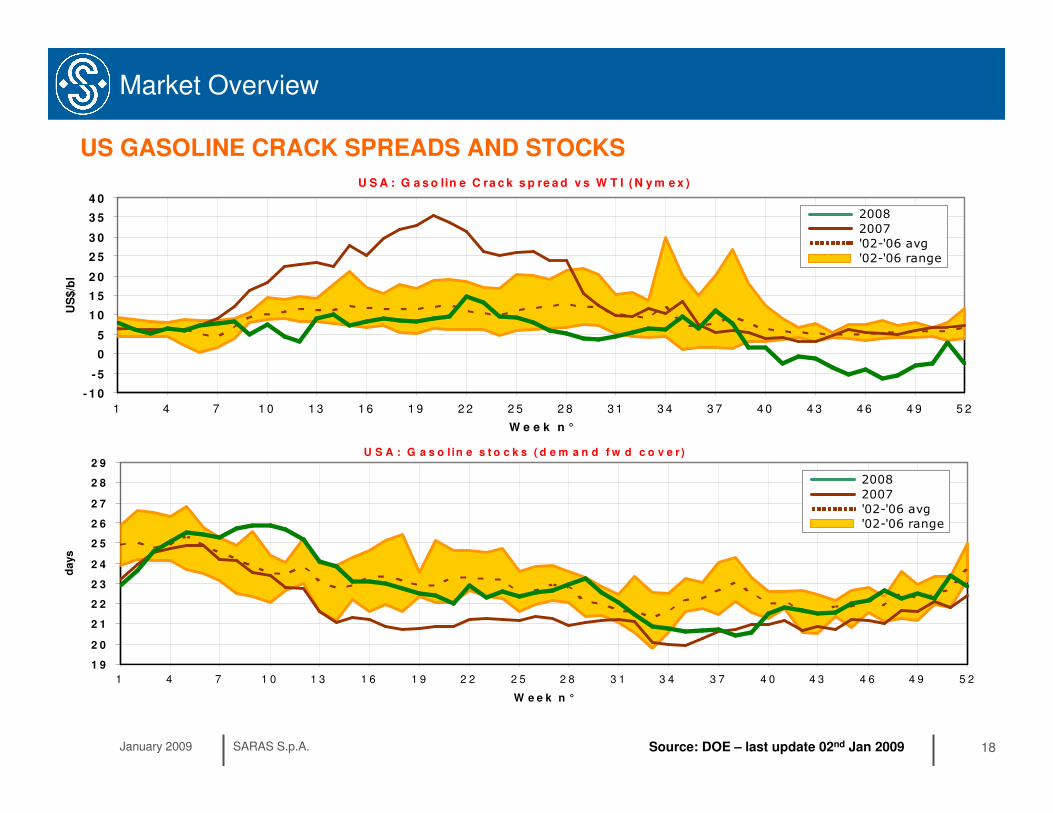
US GASOLINE CRACK SPREADS AND STOCKS
U S A : G a s o l in e s t o c k s ( d e m a n d f w d c o v e r )
1 9
2 0
2 1
2 2
2 3
2 4
2 5
2 6
2 7
2 8
2 9
1 4 7 1 0 1 3 1 6 1 9 2 2 2 5 2 8 3 1 3 4 3 7 4 0 4 3 4 6 4 9 5 2
W e e k n °
days
2008
2007
'02-'06 avg
'02-'06 range
U S A : G a s o lin e C ra c k s p re a d v s W T I ( N y m e x )
- 1 0
- 5
0
5
1 0
1 5
2 0
2 5
3 0
3 5
4 0
1 4 7 1 0 1 3 1 6 1 9 2 2 2 5 2 8 3 1 3 4 3 7 4 0 4 3 4 6 4 9 5 2
W e e k n °
US
$/b
l
2008
2007
'02-'06 avg
'02-'06 range
Source: DOE – last update 02nd Jan 2009
January 2009 SARAS S.p.A. 19
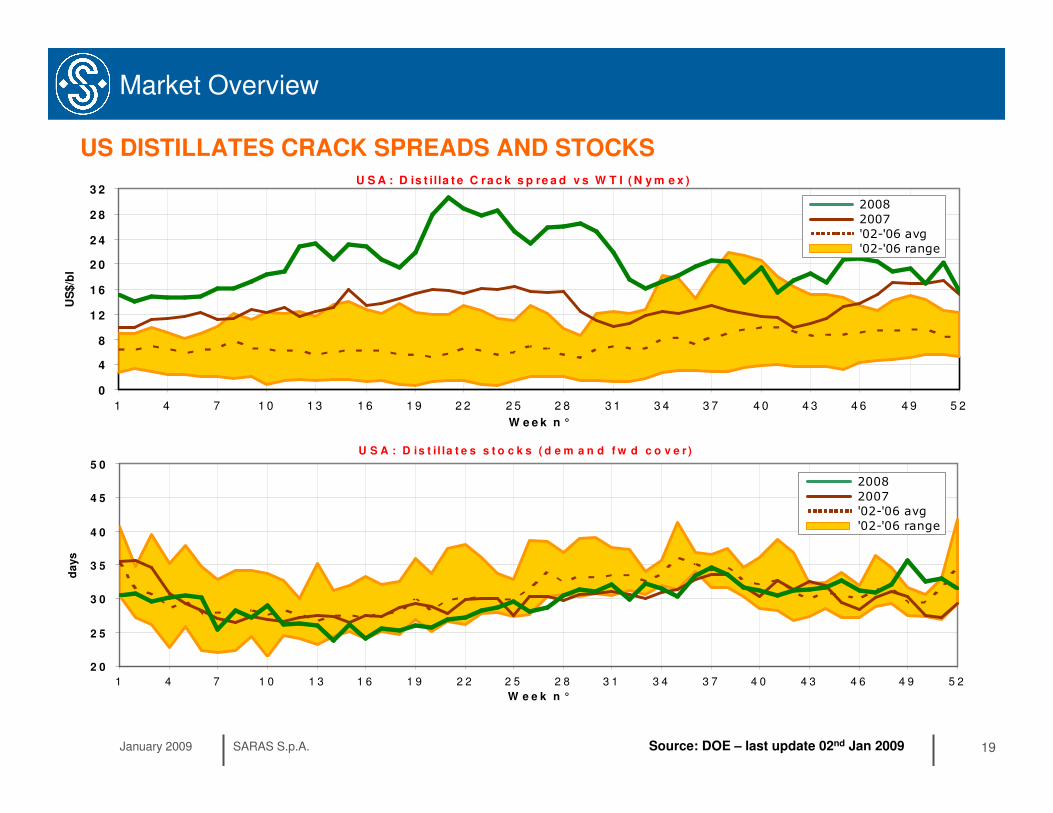
Market Overview
US DISTILLATES CRACK SPREADS AND STOCKSU S A : D is t il la t e C ra c k s p re a d v s W T I ( N y m e x )
0
4
8
1 2
1 6
2 0
2 4
2 8
3 2
1 4 7 1 0 1 3 1 6 1 9 2 2 2 5 2 8 3 1 3 4 3 7 4 0 4 3 4 6 4 9 5 2
W e e k n °
US
$/b
l
2008
2007
'02-'06 avg
'02-'06 range
U S A : D is t i l la t e s s t o c k s ( d e m a n d f w d c o v e r )
2 0
2 5
3 0
3 5
4 0
4 5
5 0
1 4 7 1 0 1 3 1 6 1 9 2 2 2 5 2 8 3 1 3 4 3 7 4 0 4 3 4 6 4 9 5 2
W e e k n °
da
ys
2008
2007
'02-'06 avg
'02-'06 range
Source: DOE – last update 02nd Jan 2009

January 2009 SARAS S.p.A. 20
M e d : G a s o lin e C r a c k s p r e a d v s B r e n t
m o n t h ly a v e r a g e s
- 5
0
5
1 0
1 5
2 0
2 5
J a n F e b M a r A p r M a y J u n J u l A u g S e p O c t N o v D e c
US
$/b
l
M e d : D ie s e l C r a c k s p r e a d v s B r e n t
m o n t h ly a v e r a g e s
0
5
1 0
1 5
2 0
2 5
3 0
3 5
4 0
J a n F e b M a r A p r M a y J u n J u l A u g S e p O c t N o v D e c
US
$/b
l
Market Overview
EUROPEAN GASOLINE AND DIESEL CRACK SPREADS
Source: Platt’s – last update 02nd Jan 2009
2008
2007
'02-'06 avg
'02-'06 range
2008
2007
'02-'06 avg
'02-'06 range
January 2009 SARAS S.p.A. 21
Market Overview
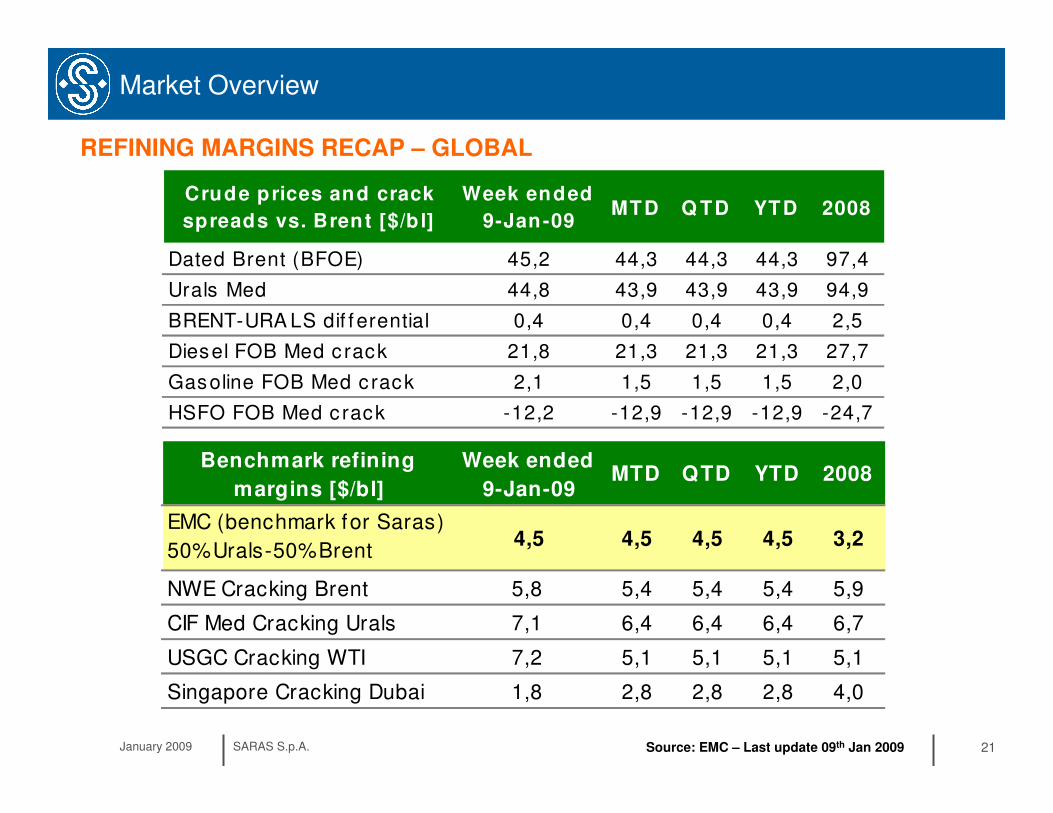
REFINING MARGINS RECAP – GLOBAL
Source: EMC – Last update 09th Jan 2009
Crude prices and crack
spreads vs. Brent [$/b l]
Week ended
9-Jan-09MTD Q TD YTD 2008
Dated Brent (BFOE) 45,2 44,3 44,3 44,3 97,4
Urals Med 44,8 43,9 43,9 43,9 94,9
BRENT-URA LS dif f erential 0,4 0,4 0,4 0,4 2,5
Diesel FOB Med c rack 21,8 21,3 21,3 21,3 27,7
Gasoline FOB Med c rack 2,1 1,5 1,5 1,5 2,0
HSFO FOB Med c rack -12,2 -12,9 -12,9 -12,9 -24,7
Benchmark refining
margins [$/bl]
Week ended
9-Jan-09MTD QTD YTD 2008
EMC (benchmark for Saras)
50%Urals-50%Brent4,5 4,5 4,5 4,5 3,2
NWE Cracking Brent 5,8 5,4 5,4 5,4 5,9
CIF Med Cracking Urals 7,1 6,4 6,4 6,4 6,7
USGC Cracking WTI 7,2 5,1 5,1 5,1 5,1
Singapore Cracking Dubai 1,8 2,8 2,8 2,8 4,0
•• Saras in a SnapshotSaras in a Snapshot
•• Market OverviewMarket Overview
• Competitive Positioning
•• Business SegmentsBusiness Segments
•• Investment Plan 2008Investment Plan 2008--20112011
•• FinancialsFinancials
•• OthersOthers

January 2009 SARAS S.p.A. 23
• Continuous investments in organic growth allowed Saras to become a very complex refinery, with high conversion of fuel oil in middle and light distillates
Competitive Positioning
SARAS COMPLEXITY AND HIGH CONVERSION CAPACITY
7,095
49.5%
7,540
51.7%7,350
51.4%55%
3,873
27.0%
3,893
27.3%
4,039
27.7%
29%
15,30014,341 14,59314,286
10,968
76.5%
11,243
78.7%
11,579
79.4%
84%
01,000
2,0003,000
4,0005,000
6,000
7,000
8,000
9,000
10,000
11,000
12,000
13,000
14,00015,000
16,00017,000
18,000
2005 2006 2007 2012+
'000 tons
Middle Distillates Gasoline&Naphtha other products
Crude runs

January 2009 SARAS S.p.A. 24
• Large differentials between middle distillates and fuel oil prices play in favour of Saras
• Over the past years, the above mentioned differential has progressively widened, thus enhancing Saras competitive advantage vs. less complex refiners
Competitive Positioning
EXPOSURE TO THE DIFFERENTIAL BETWEEN DIESEL AND FUEL OIL CRACKS
Source: Platt’s – last update 13th Jan 2009
-40
-35
-30
-25
-20
-15
-10
-5
0
5
10
15
20
25
30
35
40
Jan-
99M
ar-9
9M
ay-9
9Ju
l-99
Sep
-99
Nov
-99
Jan-
00M
ar-0
0M
ay-0
0Ju
l-00
Sep
-00
Nov
-00
Jan-
01M
ar-0
1M
ay-0
1Ju
l-01
Sep
-01
Nov
-01
Jan-
02M
ar-0
2M
ay-0
2Ju
l-02
Sep
-02
Nov
-02
Jan-
03M
ar-0
3M
ay-0
3Ju
l-03
Sep
-03
Nov
-03
Jan-
04M
ar-0
4M
ay-0
4Ju
l-04
Sep
-04
Nov
-04
Jan-
05M
ar-0
5M
ay-0
5Ju
l-05
Sep
-05
Nov
-05
Jan-
06M
ar-0
6M
ay-0
6Ju
l-06
Sep
-06
Nov
-06
Jan-
07M
ar-0
7M
ay-0
7Ju
l-07
Sep
-07
Nov
-07
Jan-
08M
ar-0
8M
ay-0
8Ju
l-08
Sep
-08
Nov
-08
Jan-
09
$/b
l
ULSD crack vs Brent
Gasoline crack vs Brent
HSFO crack vs Brent

January 2009 SARAS S.p.A. 25
Competitive Positioning
EMC BENCHMARK
• In order to monitor and compare its performance, Saras has chosen a refining margin benchmark produced by EMC(*)
• This EMC benchmark represents the profitability of a mid-complexity coastal refinery in the Med, and is based on the following assumptions:
� crude slate: 50% Urals, 50% Brent � crude oil pricing: Urals MED and Brent DTD quotations� products pricing: FOB MED quotations� yields: EMC estimate for a mid-complexity refinery in the MED area� variable costs: EMC estimate for a mid-complexity refinery in the MED area
• It is important to highlight that the EMC benchmark is a refining margin after variable costs
(*) EMC Energy Market Consultants, is a company based in London and founded in 1989 by a group of dedicated consultants with extensive experience in their respective fields (www.fgenergy.com)

January 2009 SARAS S.p.A. 26
3.5
3.9
3.7
3.9
3.73.9
4.3
4.1
8.0
11.3
7.6
5.6
7.16.2
2.6
7.3
2.0
4.2
2.9
2.1
3.32.8
4.74.5
12.1
6.1
9.5
10.810.1
11.011.5
15.6
0
2
4
6
8
10
12
14
16
2003 2004 2005 2006 2007 Q1/08 Q2/08 Q3/08
$/bl
Saras refining margin Power IGCC margin SARAS EMC Benchmark Total
• Premium above benchmark has been increasing over the years• Power generation and processing contracts provide stability of returns
0.5
1.12.4
3.4
4.05.6
Competitive Positioning
SARAS PERFORMANCE VS. EMC BENCHMARK
7.1
5.1
January 2009 SARAS S.p.A. 27
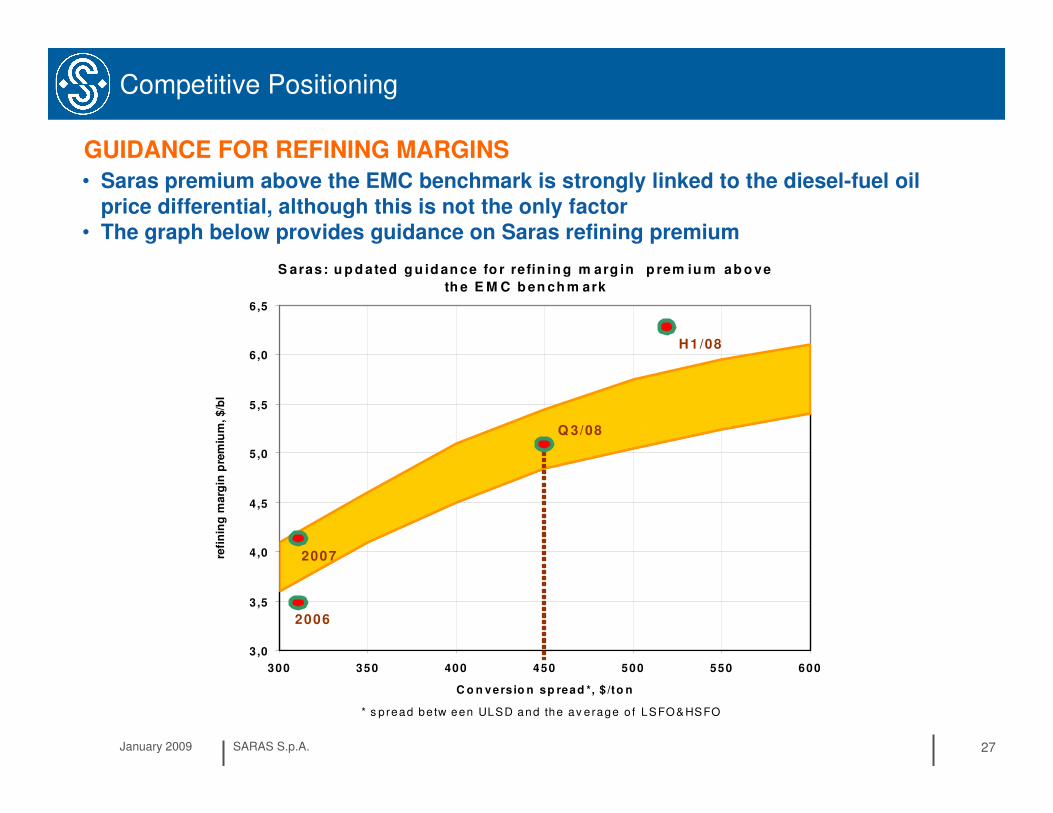
GUIDANCE FOR REFINING MARGINS
• Saras premium above the EMC benchmark is strongly linked to the diesel-fuel oil price differential, although this is not the only factor
• The graph below provides guidance on Saras refining premium
Competitive Positioning
S aras: u p d ated g u id an ce fo r refin in g m arg in p rem iu m ab o ve
th e E M C b en ch m ark
3,0
3,5
4,0
4,5
5,0
5,5
6,0
6,5
300 350 400 450 500 550 600
C o n vers io n sp read *, $ /to n
refi
nin
g m
arg
in p
rem
ium
, $/b
l
2006
2007
H 1/08
* s p read be tw een ULSD and the av e rage o f LSFO&HSFO
Q 3/08
January 2009 SARAS S.p.A. 28
Competitive Positioning
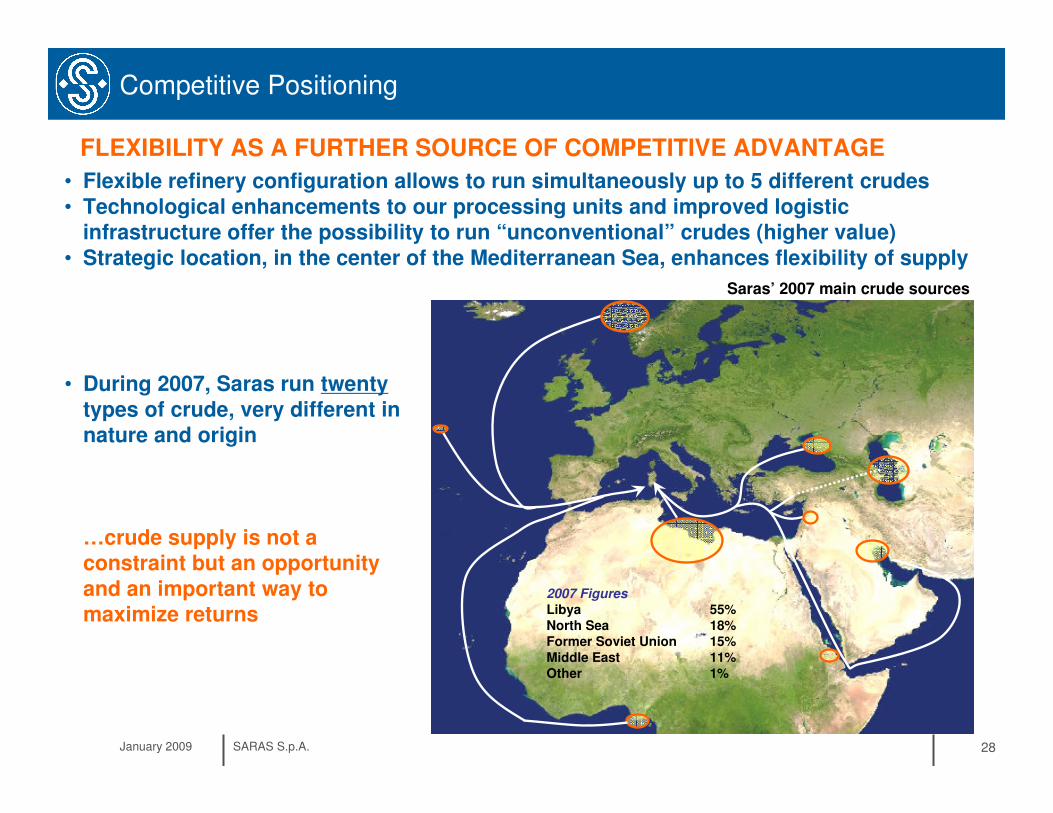
• Flexible refinery configuration allows to run simultaneously up to 5 different crudes• Technological enhancements to our processing units and improved logistic
infrastructure offer the possibility to run “unconventional” crudes (higher value)• Strategic location, in the center of the Mediterranean Sea, enhances flexibility of supply
• During 2007, Saras run twentytypes of crude, very different in nature and origin
…crude supply is not a constraint but an opportunity and an important way to maximize returns
Saras’ 2007 main crude sources
2007 Figures
1%Other11%Middle East15%Former Soviet Union18%North Sea55%Libya
FLEXIBILITY AS A FURTHER SOURCE OF COMPETITIVE ADVANTAGE
•• Saras in a SnapshotSaras in a Snapshot
•• Market OverviewMarket Overview
•• Competitive PositioningCompetitive Positioning
• Business Segments
•• Investment Plan 2008Investment Plan 2008--20112011
•• FinancialsFinancials
•• OthersOthers

January 2009 SARAS S.p.A. 30
1
3 CDU
(Crude DistillationUnit)
2 VDU
(VacuumDistillationUnit)
2 MHC
(MildHydrocracking)
1 FCC
(Fluid CatalyticCracker)
HeavydistillatesT1
T2
T3
V1
V2
Heavyresidue
MHC1
MHC2
FCC
2 REFORMERCCR1
CCR2(Polimeri)
TAR
1 VSB
(Visbreaker)VSB
3 GASIFIERS
G1G2
G3SYNGAS
3 GAS-STEAM TURBINES
ELECTRICITY
1 ETHERIFICATION
1 ALKYLATION
5 DESULPHURIZATION UNITS
DIESEL
GASOLINE
Hydrogen
Hy
dro
ge
n
CRUDE OIL
Athmosferic and Vacuumdistillation
Conversionunits
Desulphurization & finishing
IGCC Power plant
Business Segments – Refining
REFINERY CONFIGURATION

January 2009 SARAS S.p.A. 31
Business Segments – Refining
2,693,2509.0TOTAL with Gasification
180,00015.012,000BTX Plant
85,0005.017,000Semi-rigenerative Reformer
2,453,2508.2TOTAL COMPLEXITY
9.9
12.0
1.0
10.0
10.0
2.5
6.0
5.0
6.0
2.75
2.0
1.0
Nelson Complexity Index (*)
240,00020,000Gasification
62,000
7,000
8,000
107,000
115,000
29,000
86,000
41,000
105,000
300,000
Capacity (barrels per calendar day)
70,000Oxygenates (TAME)
62,000Hydrogen/PSA (MMcfd)
267,500Hydrotreating
80,000Alkylation
145,000Cat Reforming (CCR)
2,958,250TOTAL with Gasification & PetChem
690,000Distillate Hydrocracking
516,000Distillate Cracking (FCC)
112,750Visbreaking
210,000Vacuum Distillation
300,000Atmospheric Distillation
Complexity barrels
Process Unit
REFINERY STRUCTURE AND NELSON COMPLEXITY INDEX
(*) Nelson Complexity Index is a measure of secondary conversion capacity in comparison to the primary distillation capacity of any refinery. It is an indicator of the investment intensity of a refinery (and consequently its value addition potential). Atmospheric distillation units have a factor of one, while all other units are rated in terms of their costs relative to the primary distillation

January 2009 SARAS S.p.A. 32
Business Segments – Refining
24,122,800
375,500
5,541,490
4,365,260
713,900
5,012,500
8,114,100
barrels
3,835,100162TOTAL
59,700
881,000
694,000
113,500
796,900
1,290,000
Cubic metres
37
31
35
11
35
13
Nr. of tanks
FUEL OIL
LPG AND PENTANES
GASOIL
KEROSENE
GASOLINE
CRUDE OIL
11 BERTHS :• 9 berths for product loadings &
discharge• 2 deep sea berths (crude oil vessels
up to 300,000 SDWT)
STORAGE AND MARINE TERMINAL

January 2009 SARAS S.p.A. 33
Business Segments – Refining
The 10th largest European refinery with its 300,000 bcd capacity, more than twice the average European size
REFINERY RANKING BY CAPACITY
European Refineries
0
50
100
150
200
250
300
350
400
450
Cap
acit
y, kb
d
Average = 140 kbd
ERG coastal
SARAS
HEP Aspropyrgos
NESTE Porvoo
PKN Plock
MotorOilPetroplus Ingolstadt

January 2009 SARAS S.p.A. 34
Business Segments – Refining
REFINERY RANKING BY COMPLEXITY
The 18th most complex refinery according to Nelson Complexity Index (9.0), among European refineries with above-average capacity (>140,000 bcd)
Nelson Index for European refineries with at least 140 kbd capacity (i.e. European average)
0
2
4
6
8
10
12
14
16
18
20
Ne
lso
n C
om
ple
xit
y In
de
x
ERG coastal
SARAS
HEP AspropyrgosNESTE Porvoo
PKN Plock
Petroplus Coryton

January 2009 SARAS S.p.A. 35
Refining
242,400
48,000
92,000
16,400
86,000
FCC Equivalent barrels
240
80
40
100
FCC Equivalent Factor %
16.020,000Gasification
115,000
41,000
86,000
Capacity (bpcd)
80.8TOTAL
30.7Distillate Hydrocracking
5.5Visbreaking
28.6FCC
FCC Equivalent % on Distillation
Process Unit
Source: WoodMackenzie
REFINERY RANKING BY “FCC EQUIVALENT” INDEX
Residue conversion capacity of European refineries
0
25
50
75
100
125
150
175
200
225
250
FC
C e
qu
iva
len
t b
arr
els
, k
bd
ERG coastal
SARAS
HEP Aspropyrgos
NESTE Porvoo
PKN Plock
MotorOil
Petroplus Ingolstadt
Conoco Killingholme
Petroplus Coryton
(*) The FCC complexity index is a more appropriate representation of a refinery’s conversion capacity

January 2009 SARAS S.p.A. 36
Advantages of processing:
� Access to special crude oils otherwise difficult to acquire
� Long term stability of supply
� Reduced Working Capital
� Stabilization of returns (equivalent to a put option on the refining margins at fraction of cost)
Approximate split of the value for third party runs
Profit Share
Optimization
Base Fee
Business Segments – Refining
PROCESSING CONTRACTS REDUCE WC AND STABILISE RETURNS
• A processing contract is an agreement to process 3rd party crude oil under predetermined conditions (i.e. product yields, processing fee, storage & delivery terms)
• Saras’ processing contracts are grade specific and focused on certain families for which Saras has specific need/interest

January 2009 SARAS S.p.A. 37
2.0
3.0
4.0
5.0
6.0
7.0
8.0
9.0
10.0
0.0 0.5 1.0 1.5 2.0 2.5 3.0 3.5 4.0 4.5 5.0
EMC benchmark, $/bl
Sara
s m
arg
in,
$/b
l
equivalent PUT Option
Processing
Saras' own crude
Business Segments – Refining
EFFICIENT PROTECTION IN CASE OF MARGIN DOWNTURN

January 2009 SARAS S.p.A. 38
Business Segments – Refining
14.0 14.2 14.0 14.4 14.3 14.615.1 15.3
112
106102
104 102 105 104110
0.0
2.0
4.0
6.0
8.0
10.0
12.0
14.0
16.0
18.0
2002 2003 2004 2005 2006 2007 2008E 2012+
million tons
0
13
26
39
53
66
79
92
105
118
131
million bbl
Processing for third parties Own crude Total runs tot
HISTORICAL RUNS AND 2008 ESTIMATES

January 2009 SARAS S.p.A. 39
Business Segments – Refining
15
20
25
30
35
40
45
50
-1 0 1 2 3
%S
°API
light extra sweet
light sweet
medium sour
heavy sour
heavy sweet
Brent
Urals
Saras avg.
CRUDE OIL SLATE BY GRADE AND BY ORIGIN (2007 data)
Other 1%
Lybia 55%
FSU 15%
Middle East
11%
North Sea 18%

January 2009 SARAS S.p.A. 40
Business Segments – Refining
2.62.4 2.4
0.00.30.50.81.01.31.51.82.02.32.52.83.03.33.5
2005
2006
2007
2008
2009
2010
2011
2012
emissions allocated
Million tons
REFINERY CO2 EMISSIONS AND ALLOCATED QUOTAS
January 2009 SARAS S.p.A. 41
Business Segments – Refining
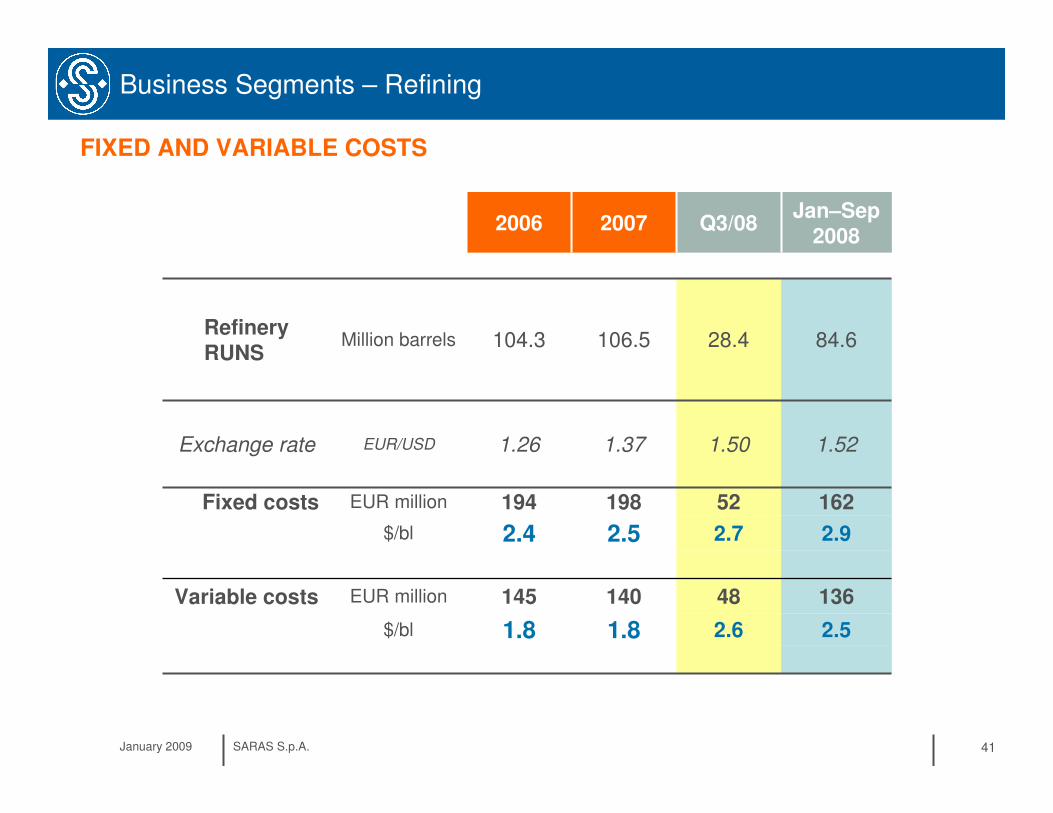
FIXED AND VARIABLE COSTS
1.8
140
2.5
198
1.37
106.5
2007
1.8
145
2.4
194
1.26
104.3
2006
2.6
48
2.7
52
1.50
28.4
Q3/08
2.5
136
2.9
162
1.52
84.6
Jan–Sep2008
EUR millionVariable costs
EUR millionFixed costs
$/bl
$/bl
EUR/USD
Million barrels
Exchange rate
RefineryRUNS

January 2009 SARAS S.p.A. 42
Business Segments – Refining and Power
IGCC
2 Gasifiers2 Turbines
1 Gasifier1 Turbine
1 Gasifier1 Turbine
PLANT
4.42 - 4.471.05-1.101.1641.0841.121Million of MWhEstimated power production
3030USD million
Loss on EBITDA due to lower conversion capacity
REFINERY
15.3-15.4112-113
3.75-3.8527.4-28.1
3.8928.4
3.7827.6
3.9228.6
million tonsmillion bbl
Estimated runs
MHC2, Alky, VisbreakingPLANT
2008expected
Q4/08expected
Q3/08Q2/08Q1/08
REFINING & POWER – MAJOR MAINTENANCE SCHEDULE for 2008

January 2009 SARAS S.p.A. 43
Business Segments – Refining and Power
REFINING & POWER – MAJOR MAINTENANCE SCHEDULE for 2009
Topping 1, FCC, Tame,
Alky
IGCC
2 Gasifiers2 Turbines
1 Gasifier1 Turbine
1 Gasifier1 Turbine
PLANT
4.30-4.601.05-1.101.10-1.201.10-1.201.05-1.10Million of
MWh
Estimated power production
60152520USD millionLoss on EBITDA due to lower conversion capacity
REFINERY
14.4-14.8105-108
3.75-3.8527.4-28.1
3.85-3.9528.1-28.8
3.10-3.2022.6-23.4
3.70-3.8027.0-27.7
million tonsmillion bbl
Estimated runs
Reforming, MHC1
MHC2, Visbreaking
PLANT
2009expected
Q4/09expected
Q3/09expected
Q2/09expected
Q1/09expected
2009 Maintenance in line with schedule previously communicated during presentation of 2009-2011 industrial plan (impact on conversion capacity approx. 0.6 $/bl and reduction of runs during the growth plan)
FCC, Alky and Tame maintenance will enhance refinery performance as per growth plan (flexibility to run unconventional crudes, process optimisation and increase in throughput)
No impact on Power Generation IFRS results, due to linearization procedure

January 2009 SARAS S.p.A. 44
Business Segments – IGCC Power Generation
HEAVY VISBROKEN RESIDUE
OXYGEN FROMAIR LIQUIDEPLANT
Hydrogento refinery
Deep conversion unitGasification
20,000 bcd
Combined Cycle Gas Turbines
575 MW
SY
NG
AS
Steamto refinery
GAS 1
POWER TO GRID
GT1
GAS 2
GAS 3
GT3
GT2
Syngas purification and sulphur removal
Hydrogen separation
POWER PLANT CONFIGURATION

January 2009 SARAS S.p.A. 45
7.05
2.69
2.74
2.80
2.85
3.48
3.54
3.61
3.68
7.316.07 5.97
12.24
13.59
12.38
13.58
0
2
4
6
8
10
12
14
16
2005 2006 2007 H1/08
Eu
r c
en
t/K
Wh
ou
r
Fuel (indexed to Brent) Capex+operations (indexed to inflation)
Incentive (up to 2009) Italian average electricity price
CIP6/92 AND THE SARLUX IGCC PLANT
IGCC Power Generation
1.3705
72.4
2007
1.2560
65.2
2006
109.154.6BRENT DTD
1.53041.2450USD/EUR exchange rate
2005 H1/08
SARLUX economics based on regulated
incentive scheme (CIP6/92 tariff). 20 year
sale contract with National Grid operator
(GSE) and priority of dispatching
The tariff has 3 components:
� CAPEX+Operations Costs: inflation
indexed and valid until 2021
� Incentive Fee: indexed with inflation
and valid until beginning of 2009
� Fuel Cost: indexed with oil prices, and
valid until 2021
In Nov ‘06, the Authority for Electric & Gas
Energy (AEEG) changed the indexation
mechanism of the Fuel Cost component
Consequently, in 2007 the Fuel Cost
component was down to 59.7 EUR/MWh,
versus 70.3 EUR/MWh based on the old
formula, with the following impact:
� 2007 IT GAAP EBITDA: negative
impact of EUR 47 ml
� 2007 IFRS EBITDA: negative impact of
EUR 29 ml (linearisation revised with
new tariff methodology & updated crude
oil forward curve)

January 2009 SARAS S.p.A. 46
IGCC Power Generation
GUIDANCE FOR FUTURE YEARS
Sarlux activities have been classified under IFRS as an
operating lease. Results are “linearised” for the duration of
the contract, and are therefore very steady, not reflecting the
proper cash generation
2008 IFRS EBITDA: expected to be around EUR 180-185
million, in line with 2007 (on the basis of a 80-85$/bl crude oil
price)
2008 IFRS EBIT: around EUR 105-110 million, improved by
abt EUR 6-7 ml vs 2007 (depreciation reduced by approx
EUR 6-7 ml per year, due to the reduction in the fair value of
the power purchase agreement between Sarlux and the
Italian grid operator)
100108136Total Avg. Tariff, EUR/MWh
828285Crude oil price ($/bl)
707170Fuel component, EUR/MWh
275-285
2008
IT GAAP EBITDA, EUR ml
estimates
115-125135-145
2010+2009
Power IFRS EBITDA
213 220182
180 - 185
0
50
100
150
200
250
2005 2006 2007 2008+
EUR million
IT GAAP EBITDA: in the table below we have projected the Fuel Cost component of the tariff and the EBITDA on
the basis of a 80-85$/bl crude oil price
� total tariff is expected to be significantly higher than 2007 (about EUR +20 ml in 2008) and in the following years; this
explains why the impact of the new tariff on 2007 IT GAAP EBITDA (EUR 47 ml) is significantly higher than that on
IFRS EBITDA (EUR 29 ml) considering that the linearization procedure takes into account the tariff expected for
future years
January 2009 SARAS S.p.A. 47
Business Segments – IGCC Power Generation
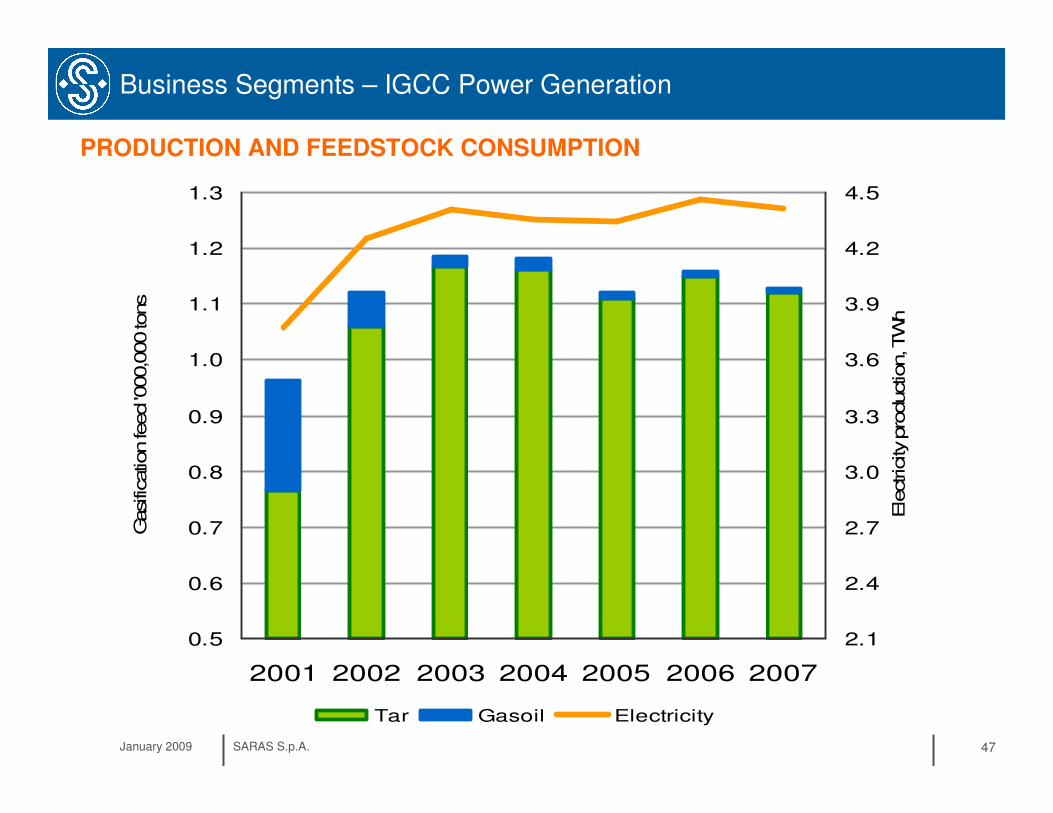
0.5
0.6
0.7
0.8
0.9
1.0
1.1
1.2
1.3
2001 2002 2003 2004 2005 2006 2007
Gasific
ation feed '0
00,0
00 tons
2.1
2.4
2.7
3.0
3.3
3.6
3.9
4.2
4.5
Ele
ctric
ity p
roduction, TW
h
Tar Gasoil Electricity
PRODUCTION AND FEEDSTOCK CONSUMPTION

January 2009 SARAS S.p.A. 48
Business Segments – IGCC Power Generation
75%
80%
85%
90%
95%
100%
2001 2002 2003 2004 2005 2006 2007
MECHANICAL AVAILABILITY

January 2009 SARAS S.p.A. 49
Business Segments – IGCC Power Generation
Million tons
3.7 3.9 3.9
0.0
0.5
1.0
1.5
2.0
2.5
3.0
3.5
4.0
4.5
2005
2006
2007
2008
2009
2010
2011
2012
allocatedemissions
• Article 7bis of CIP6/92 law state: “the sale price of electricity will be updated in case of changes of regulations implying higher or additional costs for the producers”
• The Energy Authority subsequently confirmed reimbursement of CO2 costs, for the entire duration of the CIP6 contract, with the Resolution n. 77/08 issued on 11th Jun 2008
POWER PLANT CO2 EMISSIONS AND ALLOCATED QUOTAS

January 2009 SARAS S.p.A. 50
Business Segments – IGCC Power Generation
FIXED AND VARIABLE COSTS – IT GAAP
15
0.8
65
24
1.2
107
1.26
104.3
4,467
2006
15
0.9
67
24
1.3
104
1.37
106.5
4,414
2007
19
1.2
22
21
1.3
24
1.50
28.4
1,164
Q3/08
18
1.1
61
23
1.4
78
1.52
84.6
3,369
Jan–Sep2008
EUR million
Variable costs
EUR/MWh
EUR millionFixed costs
$/bl
$/bl
EUR/MWh
Millionbarrels
MWh/1000
Exchange rate
Refinery RUNS
Power production

January 2009 SARAS S.p.A. 51
Business Segments – IGCC Power Generation
60.9
(12.1)
73.0
(24.0)
(14.6)
(38.1)
13.7
35.4
100.5
135.9
2006
46.3
(12.2)
58.5
(23.5)
(15.2)
(38.0)
11.4
36.1
87.7
123.8
2007
36.7
100.3
€ /MWh
€ /MWh
Incentive (up to 2009)
Other tariff components
23.8€ /MWhREVENUES FROM UTILITIES
(51.9)€ /MWhFEEDSTOCKS FOR GASIFICATION
137.0€/MWhREVENUES FROM POWER
(18.1)€ /MWhVARIABLE COSTS
(23.2)€ /MWhFIXED COSTS
67.6€ /MWhEBITDA
(12.1)€ /MWhD&A
55.5€ /MWhEBIT
Jan–Sep2008
REVENUES AND COSTS PER Megawatt-hour – IT GAAP

January 2009 SARAS S.p.A. 52
Business Segments – Marketing
LOGISTIC OF WHOLESALE/RETAIL OPERATIONS IN ITALY & SPAIN
Owned depot
Third party depot
1,999
560
1,438
H1/08
986
292
694
Q3/08
3,906
1,102
2,804
2007
1,032
286
746
Q1/08
967
275
692
Q2/08
994
261
733
Q3/07
1,057
318
740
Q4/07
920
268
652
Q2/07
934
255
680
Q1/07
3,219
1,013
2,206
2006
ITALY
TOTAL
SPAIN
Sales (thousand tons)
37 service stations
other inland depot
wholesale market
share in Italy: ~5.5%
Arcola Petrolifera
2 time chartered product vessels
wholesale market share
in Spain: ~ 3.5%
January 2009 SARAS S.p.A. 53
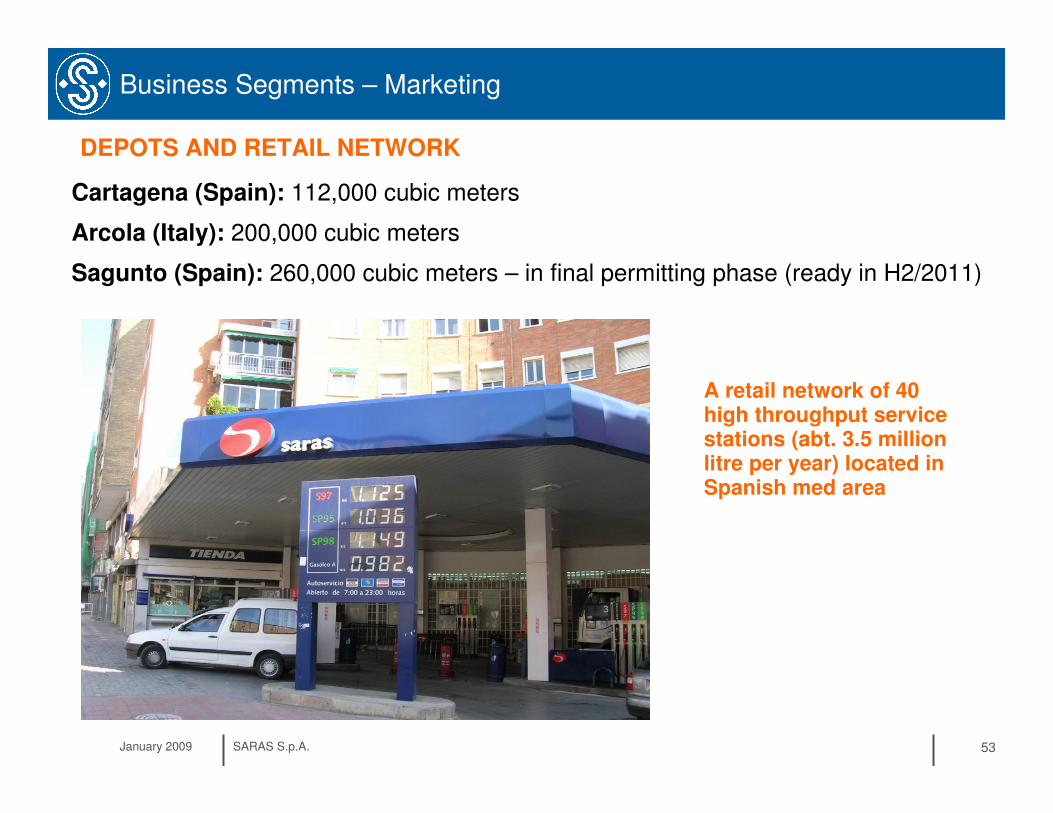
Business Segments – Marketing
Cartagena (Spain): 112,000 cubic meters
Arcola (Italy): 200,000 cubic meters
Sagunto (Spain): 260,000 cubic meters – in final permitting phase (ready in H2/2011)
A retail network of 40 high throughput service stations (abt. 3.5 million litre per year) located in Spanish med area
DEPOTS AND RETAIL NETWORK
January 2009 SARAS S.p.A. 54
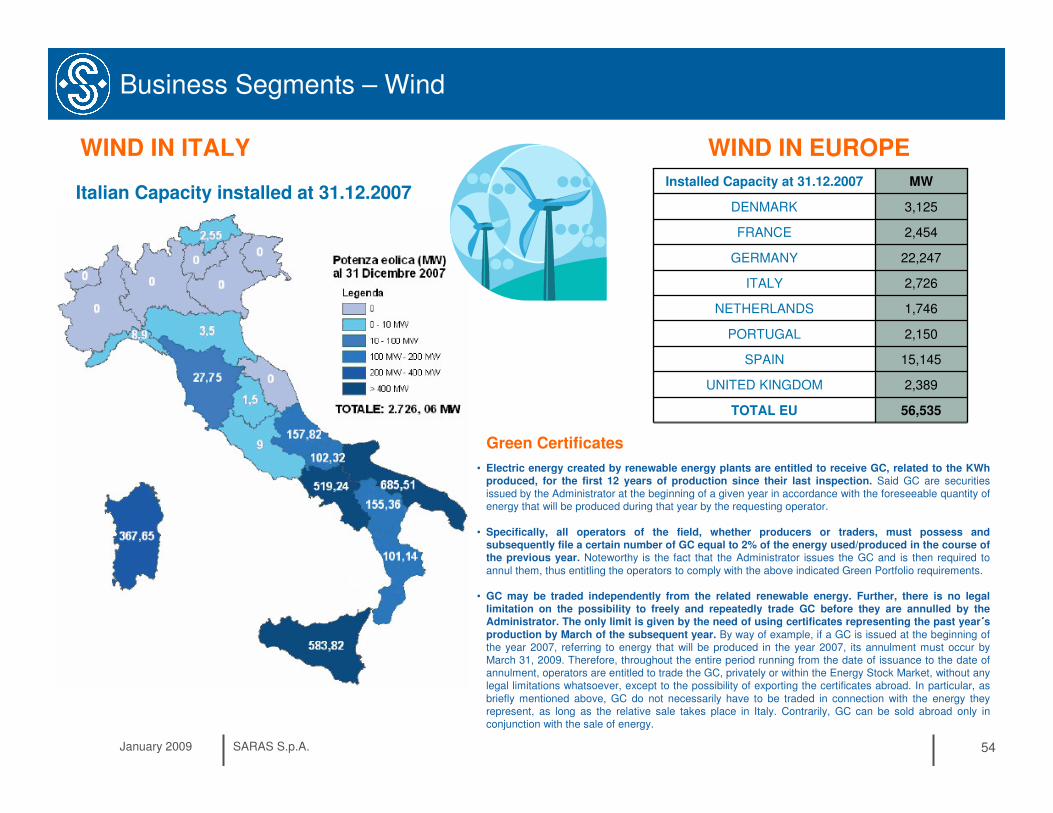
Business Segments – Wind
Italian Capacity installed at 31.12.2007
2,150PORTUGAL
22,247GERMANY
2,454FRANCE
3,125DENMARK
15,145SPAIN
2,389UNITED KINGDOM
MWInstalled Capacity at 31.12.2007
56,535
1,746
2,726
NETHERLANDS
TOTAL EU
ITALY
• Electric energy created by renewable energy plants are entitled to receive GC, related to the KWh produced, for the first 12 years of production since their last inspection. Said GC are securities issued by the Administrator at the beginning of a given year in accordance with the foreseeable quantity of energy that will be produced during that year by the requesting operator.
• Specifically, all operators of the field, whether producers or traders, must possess and subsequently file a certain number of GC equal to 2% of the energy used/produced in the course of the previous year. Noteworthy is the fact that the Administrator issues the GC and is then required to annul them, thus entitling the operators to comply with the above indicated Green Portfolio requirements.
• GC may be traded independently from the related renewable energy. Further, there is no legal limitation on the possibility to freely and repeatedly trade GC before they are annulled by the Administrator. The only limit is given by the need of using certificates representing the past year ´́́́sproduction by March of the subsequent year. By way of example, if a GC is issued at the beginning of the year 2007, referring to energy that will be produced in the year 2007, its annulment must occur by March 31, 2009. Therefore, throughout the entire period running from the date of issuance to the date of annulment, operators are entitled to trade the GC, privately or within the Energy Stock Market, without any legal limitations whatsoever, except to the possibility of exporting the certificates abroad. In particular, as briefly mentioned above, GC do not necessarily have to be traded in connection with the energy they represent, as long as the relative sale takes place in Italy. Contrarily, GC can be sold abroad only in conjunction with the sale of energy.
Green Certificates
WIND IN ITALY WIND IN EUROPE

January 2009 SARAS S.p.A. 55
Business Segments – Wind
Ulassai wind farmSardinia
• production started end 2005
• GC granted until 2016
• 72 MW (42 Vestas aero generators)
• upgradeable to 96 MW
• production of approx 160,000 MWh per year
• investment of EUR 100 million
• fully owned from 30/06/2008Sardeolica
7.1
8.9
97,534
H1/08
6.3
8.8
19,820
Q3/08
9.7
8.6
168,185
2007
8.0
8.5
49,773
Q1/08
7.1
9.4
47,761
Q2/08
9.7
8.2
51,631
Q4/07
9.7
8.4
29,885
Q3/07
9.7
9.9
31,789
Q2/07
9.7
7.6
54,910
Q1/07
12.1
7.4
157,292
2006
Power tariff(€cent/KWh)
Green certificates(€cent/KWh)
Electricityproduction (MWh)
ULASSAI WIND FARM

•• Saras in a SnapshotSaras in a Snapshot
•• Market OverviewMarket Overview
•• Competitive PositioningCompetitive Positioning
•• Business SegmentsBusiness Segments
• Investment Plan 2008-2011
•• FinancialsFinancials
•• OthersOthers

January 2009 SARAS S.p.A. 57
Investment Plan 2008-11
SARROCH SITE: SIGNIFICANT GROWTH OPPORTUNITIES
Our approach will remain based on:
• continuous improvement
• integrated but independent projects
• mitigated investment risk
• operational and HSE excellence
In line with our long term vision, the investment plan for 2008-2011 will focus on:
• increasing conversion capacity,
switching fuel oil to diesel
• improving energy efficiency
• exploiting unconventional crudes
• enhancing overall refinery performance

January 2009 SARAS S.p.A. 58
Med: Diesel Crack spread vs Brent
monthly averages
0
5
10
15
20
25
30
35
40
Jan Feb Mar Apr May Jun Jul Aug Sep Oct Nov Dec
US
$/b
l
Med: Gasoline Crack spread vs Brent
monthly averages
-5
0
5
10
15
20
25
Jan Feb Mar Apr May Jun Jul Aug Sep Oct Nov Dec
US
$/b
l
2008
2007
'02-'06 avg
'02-'06
Investment Plan 2008-11
Eur/Usd
$/bl
$/ton
$/bl
$/bl
$/bl
$/bl
$/bl
500Diesel – Avg HS/LS FO
(conversion spread)
3.5EMC benchmark
1.50Exchange rate
25
4
-30
100
96
20082008--1212
Diesel crack
Gasoline crack
Fuel Oil crack
Brent dtd
Urals Med
2008
2007
'02-'06 avg
'02-'06
REFERENCE MARKET SCENARIO
Conversion Spread
0
100
200
300
400
500
600
700
Jan-
02M
ay-0
2Sep
-02
Jan-
03M
ay-0
3Sep
-03
Jan-
04M
ay-0
4Sep
-04
Jan-
05M
ay-0
5Sep
-05
Jan-
06M
ay-0
6Sep
-06
Jan-
07M
ay-0
7Sep
-07
Jan-
08M
ay-0
8Sep
-08
$/t
on

January 2009 SARAS S.p.A. 59
Investment Plan 2008-11 – Refining
Visbreaking Revamping� conversion increased by about 5%
MildHydroCracking2 revamping &
new Steam Reforming Unit � MHC 2 increase capacity from
60,000 to 65,000 b/d
� MHC 2 increase conversion by
about 5%
INCREASE CONVERSION CAPACITY
+5,500 b/d of diesel
(270 kton/year)
+2,000 b/d of diesel
(100 kton/year)
CAPEX: EUR 190 ml
DELIVERY: H2 2010
CAPEX: EUR 155 ml
DELIVERY: H2 2011
January 2009 SARAS S.p.A. 60
Investment Plan 2008-11 – Refining
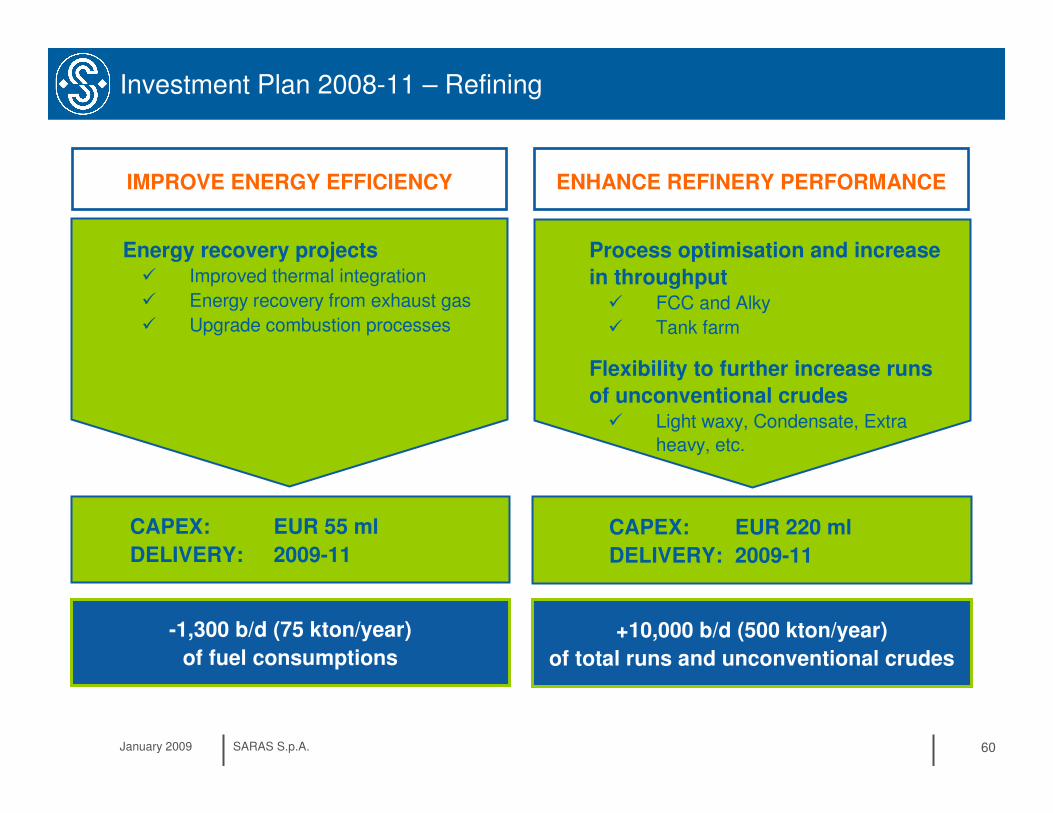
Energy recovery projects� Improved thermal integration
� Energy recovery from exhaust gas
� Upgrade combustion processes
IMPROVE ENERGY EFFICIENCY ENHANCE REFINERY PERFORMANCE
Process optimisation and increase
in throughput� FCC and Alky
� Tank farm
Flexibility to further increase runs
of unconventional crudes� Light waxy, Condensate, Extra
heavy, etc.
-1,300 b/d (75 kton/year)
of fuel consumptions
+10,000 b/d (500 kton/year)
of total runs and unconventional crudes
CAPEX: EUR 55 ml
DELIVERY: 2009-11
CAPEX: EUR 220 ml
DELIVERY: 2009-11
January 2009 SARAS S.p.A. 61
Investment Plan 2008-11 – Refining
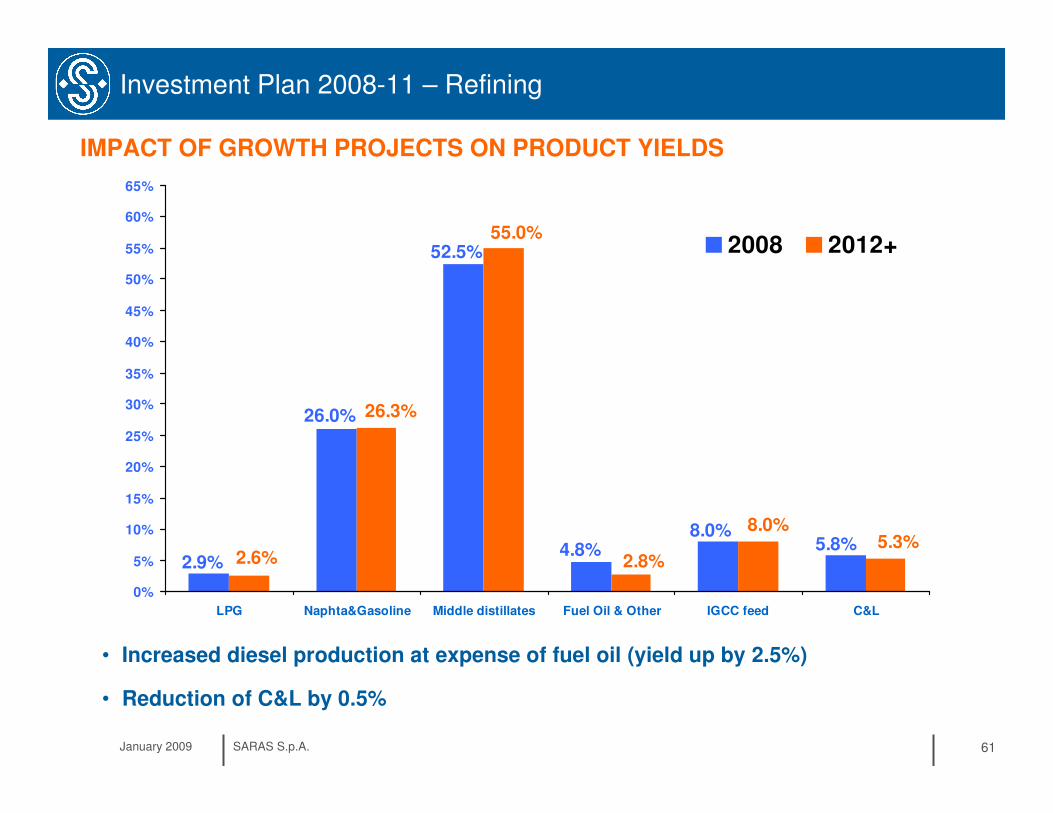
8.0%4.8%
2.9%
52.5%
26.0%
5.8%8.0%
2.6%
55.0%
26.3%
2.8%5.3%
0%
5%
10%
15%
20%
25%
30%
35%
40%
45%
50%
55%
60%
65%
LPG Naphta&Gasoline Middle distillates Fuel Oil & Other IGCC feed C&L
2008 2012+
• Increased diesel production at expense of fuel oil (yield up by 2.5%)
• Reduction of C&L by 0.5%
IMPACT OF GROWTH PROJECTS ON PRODUCT YIELDS
January 2009 SARAS S.p.A. 62
Investment Plan 2008-11 – Refining
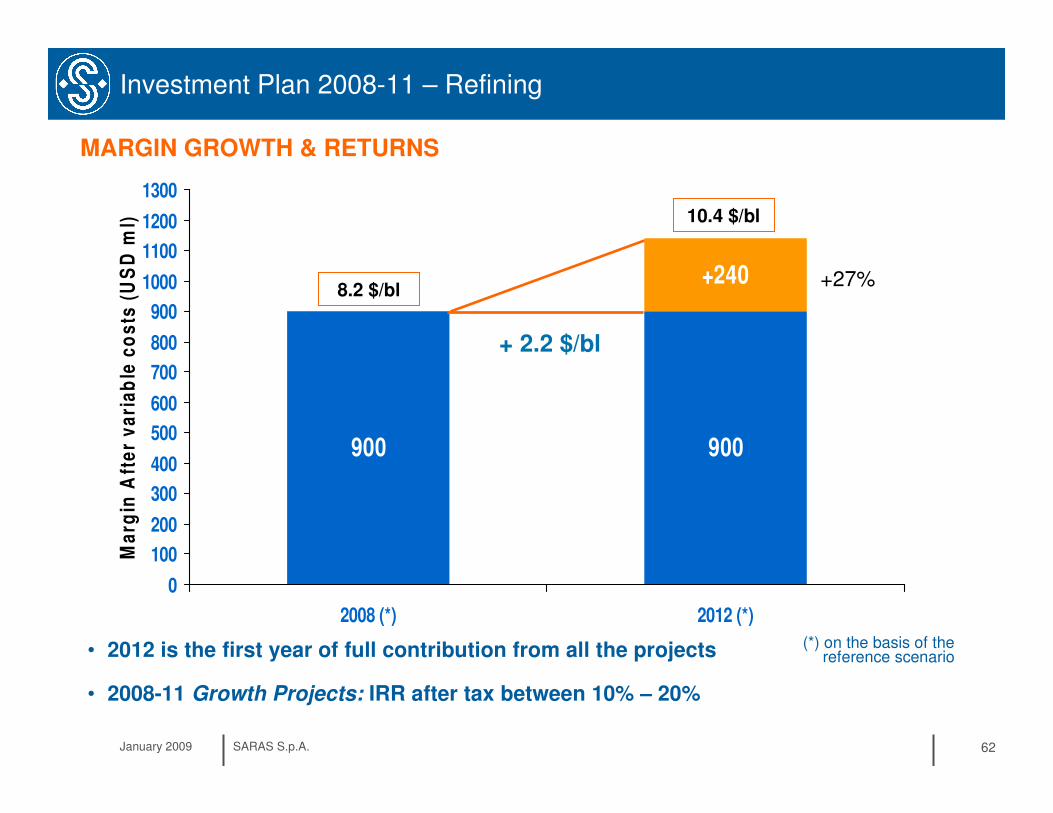
• 2012 is the first year of full contribution from all the projects
• 2008-11 Growth Projects: IRR after tax between 10% – 20%
MARGIN GROWTH & RETURNS
900 900
+240
0
100
200
300
400
500
600
700
800
900
1000
1100
1200
1300
2008 (*) 2012 (*)
Ma
rgin
Aft
er
va
ria
ble
co
sts
(U
SD
ml)
+ 2.2 $/bl
8.2 $/bl
(*) on the basis of the reference scenario
10.4 $/bl
+27%

January 2009 SARAS S.p.A. 63
Investment Plan 2008-11 – Refining
Total
+ USD 240 ml
Total
+2.2 $/bl
Impact on Refining Margins(After Variable Costs)
0.0
0.5
1.0
1.5
2.0
2.5
2009 2010 2011 2012
Avg
. m
arg
in in
cre
ase (
$/b
l)
Impact on Gross Margin(After Variable Costs)
0
50
100
150
200
250
300
2009 2010 2011 2012
US
D m
illio
n
MARGIN GROWTH: TIMING
+ 0.1
+ 0.6
+ 0.9
+ 0.6
January 2009 SARAS S.p.A. 64
Investment Plan 2008-11 – Refining
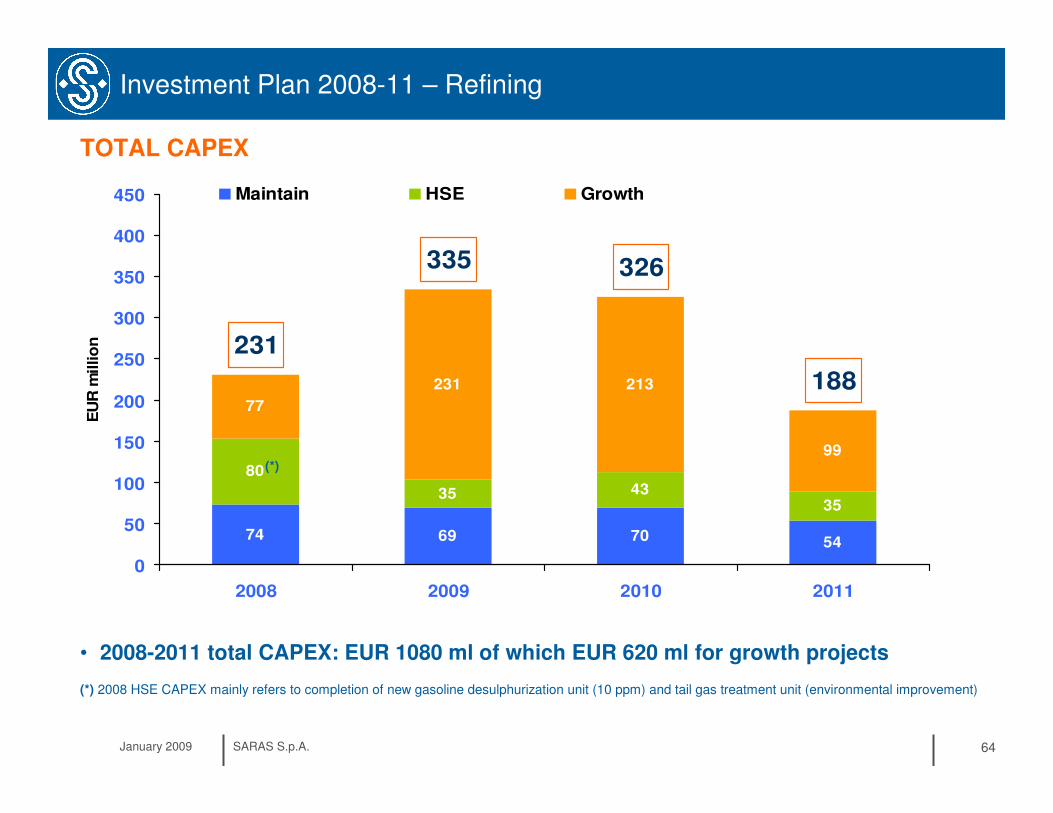
74 69 70 54
35 4335
77
231 213
99
80
231
335 326
188
0
50
100
150
200
250
300
350
400
450
2008 2009 2010 2011
EU
R m
illio
n
Maintain HSE Growth
TOTAL CAPEX
• 2008-2011 total CAPEX: EUR 1080 ml of which EUR 620 ml for growth projects
(*) 2008 HSE CAPEX mainly refers to completion of new gasoline desulphurization unit (10 ppm) and tail gas treatment unit (environmental improvement)
(*)

January 2009 SARAS S.p.A. 65
Investment Plan 2008-11 – Refining
REFERENCE LONG TERM RUNS AND CAPEX
• Refinery average throughput 2012+ about 15.3 million t/y (306,000 bpd) up 0.5 million t/y (10,000 bpd) when compared to the 2006-08 average
• 2009-2011: scheduled turnarounds
and growth projects will reduce:
� average throughput
� refining margins by 0.5-0.7 $/bl
• 2012+: Long term CAPEX at EUR 80 ml per year (maintain & HSE)
Refinery runs (million tons)
14.0
14.2
14.4
14.6
14.8
15.0
15.2
15.4
2006 2007 2008 2009-11 2012+
Maintain capacity & HSE CAPEX
0
50
100
150
200
2006 2007 2008 2009-11 2012 +
EU
R m
lHSE
Maintain

January 2009 SARAS S.p.A. 66
Investment Plan 2008-11 – Power Generation
FURTHER UPGRADINGS AND MAINTAINING BEST IN CLASS EFFICIENCY
• CAPEX � 2008: increase H2 production
� 2010-11: upgrades for performance
improvement after 10-year inspection
� 2012+: EUR 10 million per year
• CO2 reimbursement confirmed� cost reimbursement for entire
duration of CIP6 contract confirmed
by Energy Authority(*)
19
2011
33
2008
10188EUR millionCAPEX
2012+20102009
(*) Resolution n. 77/08 issued on 11th Jun 2008

January 2009 SARAS S.p.A. 67
Investment Plan 2008-11 – Marketing
NEW DEPOT OF SAGUNTO IN SPAIN
Cartagena
MotrilHuelva
Barcelona
Retail stations
Owned depot
Third party depot
Sagunto
• Sagunto, 30 km from Valencia
• 30 years concession
• Capacity 260,000 mc, with 14 tanks
• High diesel demand area (12% of Spanish consumption)
• Limited logistics
• Final construction permits by Q1/2009
• Start of operations by H2/2011
• EBITDA contribution of about EUR 5 ml on yearly basis
• IRR after taxes 10-15%
3
2008
1022CAPEX
20102009EUR ml

January 2009 SARAS S.p.A. 68
Investment Plan 2008-11 – Marketing
BIODIESEL PLANT
CartagenaMotrilHuelva
Barcelona
Retail stations
Owned depot
Third party depot
Sagunto
• Integrated with existing Saras depot
• Production of 200,000 ton/year (4,500 kbd)
• Feedstock: palm, rapeseed, soy
• Consistent to EU targets
� 5.75% of bio-diesel into marketed diesel by 2010
• Start up in Q4/2008
• Economics still positive despite high feedstock prices
� favourable taxation in Spain
� low OPEX thanks to integration with existing logistics
• EBITDA contribution of about EUR 5 ml by 2009
8
2007
34
2008
CAPEX
EUR ml

January 2009 SARAS S.p.A. 69
Investment Plan 2008-11 – Wind
PEU FULLY OWNED FROM 30/06/2008
• On 30/06/2008, Saras acquired from Babcock & Brown Wind Energy Srl its 30% of the share capital of Parchi Eolici Ulassai Srl for a total consideration of around EUR 30 million
• Saras now owns 100% of Parchi Eolici Ulassai, which in turn fully owns Sardeolica Srl, whose wind parks in 2007 produced a total of 168 thousands MWh with an EBITDA of EUR 26 million. At end 2007 Sardeolica non recourse net debt amounted to EUR 77 million (reduced to EUR 60 million on 30.06.2008)
• A pipeline of projects in Sardinia and the South of Italy are in the permitting phase, and other investments in Eastern Europe are under consideration

January 2009 SARAS S.p.A. 70
Investment Plan 2008-11 – Gas Exploration
• On shore seismic tests completed
• Data processed with promising results
• Off-shore seismic tests in permitting phase
• Evaluating next steps
GAS EXPLORATION
GALSI Pipeline: new infrastructure connecting Algeria with Italy through Sardinia, total capacity of 8 bcm/y with start-up expected by 2012

•• Saras in a SnapshotSaras in a Snapshot
•• Market OverviewMarket Overview
•• Competitive PositioningCompetitive Positioning
•• Business SegmentsBusiness Segments
•• Investment Plan 2008Investment Plan 2008--20112011
• Financials
•• OthersOthers

January 2009 SARAS S.p.A. 72
Financials
17% 17% 17% 18%
0%
5%
10%
15%
20%
25%
2005 2006 2007 9M/08 2012+
ROACE – target between 10% to 15%
over the cycle
59%65%
0%
20%
40%
60%
80%
2005 2006 2007 2012+
Leverage - long term target 25-50%
18%
2%
12%
39%
0
0.25
0.5
2005 2006 2007 2008 2012+
Payout ratio - between 40% to 60%
ROACE: return on average capital employed after tax
Leverage: Net debt /(net debt + equity)
Payout: calculated on adjusted net income

January 2009 SARAS S.p.A. 73
Group Financials
34.430.928.9100.226.224.524.025.5131.7Power
34.430.928.912.3-85.832.931.833.4131.7Power
53.249.747.7182.147.044.844.545.8220.0Power
53.249.747.7182.122.953.252.353.7220.0Power
-0.1
9.2111.7151.7
-0.1
46.6198.2275.6
0.4
10.6131.4
192.1
0.4
48.0
217.9316.0
Q2/08
-0.9
5.276.8
110.0
-0.9
11.573.8
113.3
-0.4
6.494.4
148.1
-0.4
12.7
91.4151.4
Q1/08
-2.1
28.1297.5423.7
8.8
50.3437.4508.8
0.4
33.2371.6
587.5
11.1
55.4
511.5760.1
2007
121.975.289.8151.6107.1404.8Comparable EBIT79.541.355.1123.277.9255.4Refining9.08.89.16.04.221.5Marketing
-1.0Wind1.1
1.1
19.386.7
140.0
1.7
10.473.7
130.6
1.7
20.6
105.3180.8
Q3/07
-1.1
9.8
13.2100.437.6
-0.4
10.161.4
118.1
10.4
14.5
120.5168.3
Q4/07
-1.6
-1.6
16.1179.6225.9
-1.0
7.2140.8
191.7
-1.0
17.3
197.2265.7
Q2/07
-0.5
-0.5
1.770.7
105.3
0.1
5.595.7
147.1
0.1
3.0
88.5145.3
Q1/07
21.9363.4EBIT
0.0-3.7Other activities
0.0-3.7Other activities
164.2567.5Comparable EBITDA
98.8323.8Refining10.324.8Marketing
1.2Wind0.7-1.1Other activities
0.7-1.1Other activities
19.9223.8Refining-28.811.7Marketing
-3.6Wind
-1.4Wind
39.2292.2Refining
15.1
526.2
2006
-27.5Marketing
64.2EBITDA
Q3/08
INCOME STATEMENT (1)
EUR million
Comparable EBITDA : calculated evaluating inventories at LIFO and excluding non recurring itemsComparable EBIT equal to comparable EBITDA less depreciation & amortization
January 2009 SARAS S.p.A. 74
Group Financials
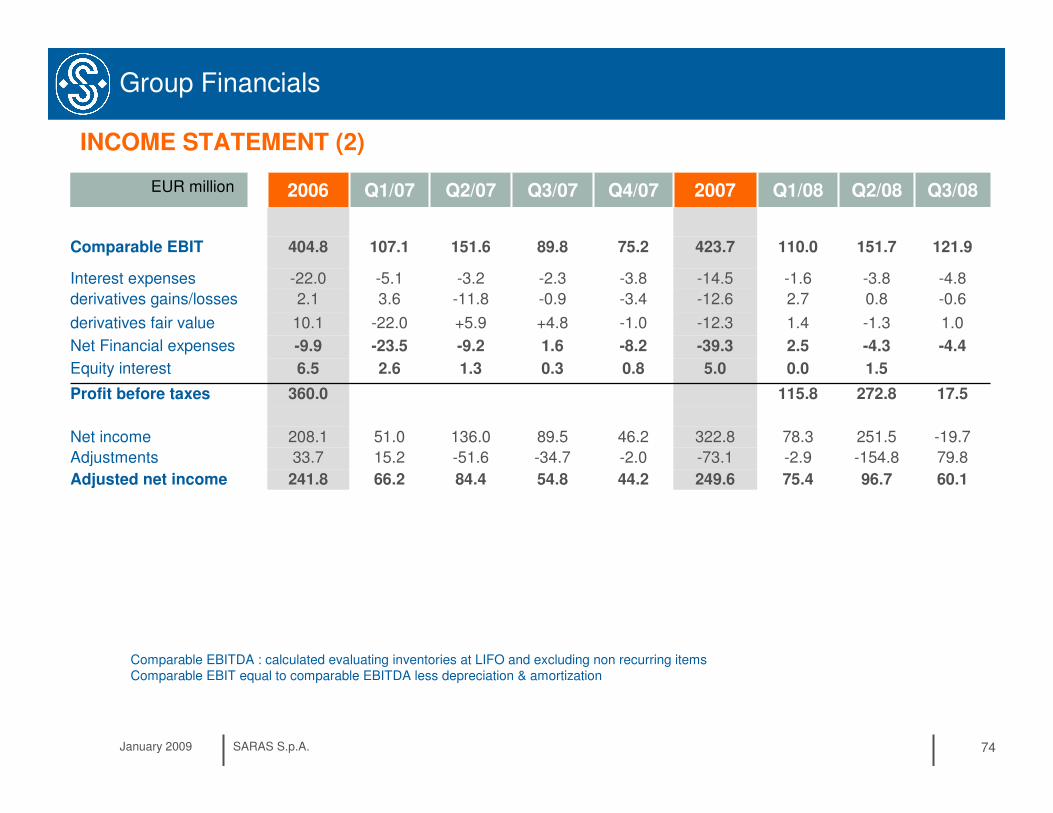
Comparable EBITDA : calculated evaluating inventories at LIFO and excluding non recurring itemsComparable EBIT equal to comparable EBITDA less depreciation & amortization
96.7
-154.8
251.5
272.8
1.5
-4.3
-1.3
0.8
-3.8
151.7
Q2/08
75.4
-2.9
78.3
115.8
0.0
2.5
1.4
2.7
-1.6
110.0
Q1/08
249.6
-73.1
322.8
5.0
-39.3
-12.3
-12.6
-14.5
423.7
2007
44.2
-2.0
46.2
0.8
-8.2
-1.0
-3.4
-3.8
75.2
Q4/07
54.8
-34.7
89.5
0.3
1.6
+4.8
-0.9
-2.3
89.8
Q3/07
84.4
-51.6
136.0
1.3
-9.2
+5.9
-11.8
-3.2
151.6
Q2/07
-4.8-5.1-22.0Interest expenses
-0.63.62.1derivatives gains/losses
1.0-22.010.1derivatives fair value
-4.4-23.5-9.9Net Financial expenses
2.66.5Equity interest
17.5360.0Profit before taxes
-19.751.0208.1Net income
79.815.233.7Adjustments
60.166.2241.8Adjusted net income
107.1
Q1/07
121.9
Q3/08
404.8Comparable EBIT
2006EUR million
INCOME STATEMENT (2)

January 2009 SARAS S.p.A. 75
Group Financials
BALANCE SHEET AND NET FINANCIAL POSITION
-223
2.5
3,862
1,616
381
1,864
3,862
1,820
1,886
155
2,041
Q2/08
77
3.3
3,693
1,545
410
1,739
3,693
1,688
1,522
484
2,006
Q1/08
-27
7.4
3,442
1,466
357
1,618
3,442
1,669
1,450
323
1,773
2007
-136
6.3
3,624
1,420
472
1,732
3.624
1,737
1,557
330
1,887
Q3/07
12
5.6
3,396
1,331
466
1,598
3.396
1,723
1,200
472
1,672
Q2/07
-135
12.6
3,386
1,336
542
1,507
3.386
1,705
1,287
395
1,682
Q1/07
-221
2.5
3,818
1,575
408
1,834
3,818
1,832
1,801
185
1,986
Q3/08
C
B
A
525Interest bear liabilities
1,410Non interest bear liabilities
1,285Equity
3,220TOTAL LIABILITIES
8.5Intercompany to unconsolidated subsidiaries
-285Net Financial Position
(A-B+C)
3,220TOTAL ASSETS
1,707Non current assets
1,282Other current assets
1,514Current assets
231Cash and other cash equivalents
2006EUR million
January 2009 SARAS S.p.A. 76
Group Financials
-223-61
-240
-161
-21
0
-182
-32
-69
-101
-183
43
77
Q2/08
-220000000buyback own shares
77
104
0
0
0
0
-59
-59
20
162
-27
Q1/08
-27
258
-143
0
-143
0
-210
-210
-72
610
-285
2007
-136
-148
0
0
0
0
-54
-54
-272
-82
12
Q3/07
-27
109
0
0
0
0
-63
-63
80
172
-136
Q4/07
12
147
-143
0
-143
0
-57
-57
54
347
-135
Q2/07
-135
149
0
0
0
0
-36
-36
78
185
-285
Q1/07
-221
3
0
0
-22
0
-48
-48
10
72
-223
Q3/08
-133in tangible&intangible assets
-170dividends
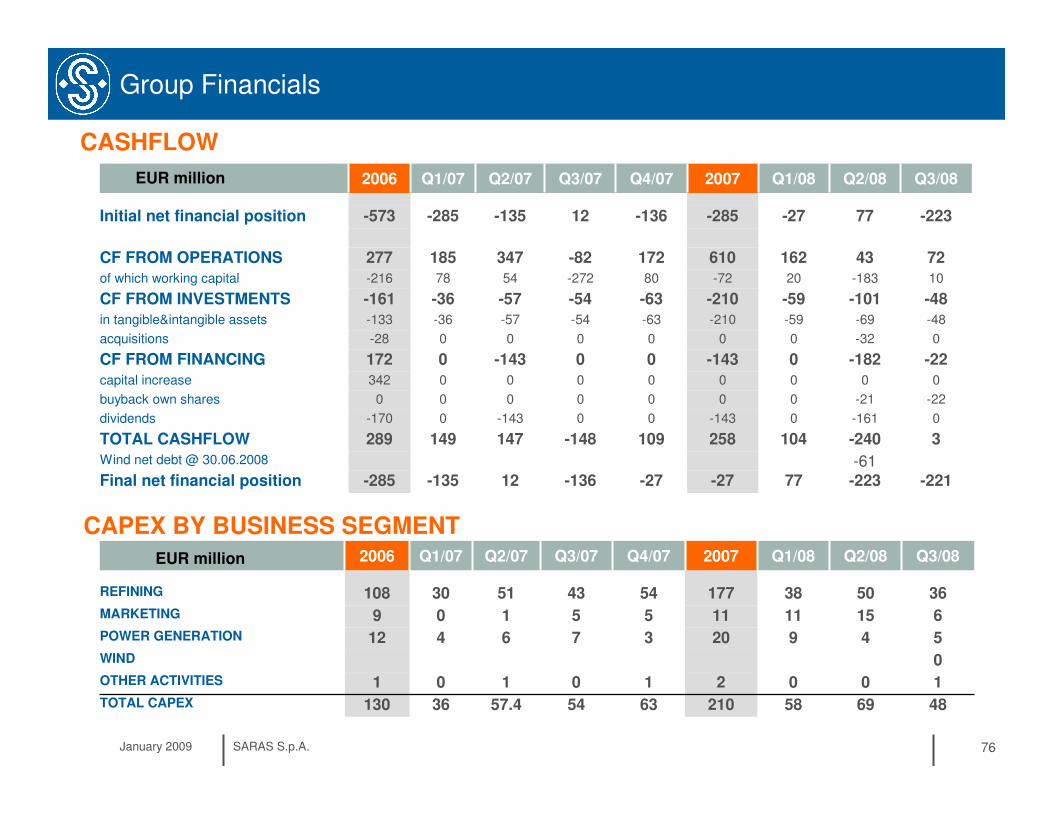
172CF FROM FINANCING
342capital increase
289TOTAL CASHFLOW
Wind net debt @ 30.06.2008
-285Final net financial position
-28acquisitions
-161CF FROM INVESTMENTS
277CF FROM OPERATIONS
-216of which working capital
-573Initial net financial position
2006
CASHFLOW
EUR million
CAPEX BY BUSINESS SEGMENT
0WIND
69
0
4
15
50
Q2/08
58
0
9
11
38
Q1/08
210
2
20
11
177
2007
54
0
7
5
43
Q3/07
63
1
3
5
54
Q4/07
57.4
1
6
1
51
Q2/07
36
0
4
0
30
Q1/07
48
1
5
6
36
Q3/08
1OTHER ACTIVITIES
12POWER GENERATION
130TOTAL CAPEX
108REFINING
9MARKETING
2006EUR million

January 2009 SARAS S.p.A. 77
Additional information
11.3
4.2
39%
303
27.6
3,777
50
111.7
198.2
131.4
217.9
Q2/08
7.6
2.0
31%
314
28.6
3,920
38
76.8
73.8
94.4
91.4
Q1/08
7.3
3.3
38%
292
106.5
14,593
177
297.5
437.4
371.6
511.5
2007
8.0
2.9
36%
308
28.4
3,887
36
79.5
19.9
98.8
39.2
Q3/08
7.0
2.4
43%
280
25.8
3,530
54
41.3
100.4
61.4
120.5
Q4/07
5.9
2.5
32%
305
28.0
3,839
43
55.1
86.7
73.7
105.3
Q3/07
9.9
5.4
40%
274
24.9
3,415
51
123.2
179.6
140.8
197.2
Q2/07
36%Of which for third parties
3.0EMC benchmark
3,809Thousand tons
27.8Million barrels
309Barrels/day
REFINERY RUNS
6.7Saras refining margin
30CAPEX
77.9
70.7
95.7
88.5
Q1/07
Comparable EBIT
EBIT
Comparable EBITDA
EBITDA
EUR million
REFINING

January 2009 SARAS S.p.A. 78
Additional information
POWER GENERATION
4.3
13.7
1,084
4
17.8
49.7
63.3
30.9
49.7
Q2/08
3.9
13.42
1,121
9
37.4
57.0
70.5
28.9
47.7
Q1/08
3.7
12.34
4,414
20
120.7
204.4
258.2
100.2
182.1
2007
4.1
14.0
1,164
5
46.5
80.3
93.9
34.4
53.2
Q3/08
4.2
13.64
1,095
3
34.8
44.7
58.5
26.2
47.0
Q4/07
3.3
12.34
1,169
7
26.8
56.6
70.0
24.5
44.8
Q3/07
4.0
11.91
934
6
16.0
30.9
44.3
24.0
44.5
Q2/07
$/bl
€cent/Kwh
Mwh/1000
85.4EBITDA IT GAAP
72.2EBIT IT GAAP
11.61POWER TARIFF
3.3POWER IGCC MARGIN
1,215ELECTRICITY PRODUCTION
4CAPEX
43.1
25.5
45.8
Q1/07
Adj NET INCOME IT GAAP
Comparable EBIT
Comparable EBITDA
EUR million

January 2009 SARAS S.p.A. 79
Additional information
MARKETING
967
692
275
15
9.2
46.6
10.6
48.0
Q2/08
1,032
746
286
11
5.2
11.5
6.4
12.7
Q1/08
3,906
2,804
1,102
11
28.1
50.3
33.2
55.4
2007
986
694
292
6
9.0
(28.8)
10.3
(27.5)
Q3/08
994
733
261
5
9.1
19.3
10.4
20.6
Q3/07
1,057
740
318
5
8.8
13.2
10.1
14.5
Q4/07
920
652
268
1
6.0
16.1
7.2
17.3
Q2/07
255ITALY
680SPAIN
934TOTAL
SALES (THOUSAND TONS)
0CAPEX
4.2
1.7
5.5
3.0
Q1/07
Comparable EBIT
EBIT
Comparable EBITDA
EBITDA
EUR million

January 2009 SARAS S.p.A. 80
100% figure, Saras share is 70%
Additional information
WIND
OTHER
7.1
9.4
47,761
1.42.3
3.0
5.1
Q2/08
8.0
8.5
49,773
0.60.1
2.1
4.4
Q1/08
9.7
8.6
168,185
6.27.0
15.8
25.6
2007
6.3
8.8
19,820
(2.0)(4.0)
(1.0)
1.2
Q3/08
9.7
8.4
29,885
0.40.2
3.1
5.0
Q3/07
9.7
8.2
51,631
1.01.0
2.0
5.4
Q4/07
9.7
9.9
31,789
1.42.0
3.6
5.9
Q2/07
€cent/Kwh
€cent/Kwh
Mwh
3.8NET INCOME3.4Adjusted NET INCOME
7.6POWER TARIFF
9.7GREEN CERTIFICATES
54,910
ELECTRICITY PRODUCTION
7.1
9.4
Q1/07
Comparable EBIT
Comparable EBITDA
EUR million
0
-0.1
0.4
Q2/08
0
-0.9
-0.4
Q1/08
2
-2.1
0.4
2007
1
0.0
0.7
Q3/08
0
1.1
1.7
Q3/07
1
-1.1
-0.4
Q4/07
1
-1.6
-1.0
Q2/07
0CAPEX
-0.5
0.1
Q1/07
EBIT comparable
EBITDA comparable
EUR million
January 2009 SARAS S.p.A. 81
Financials
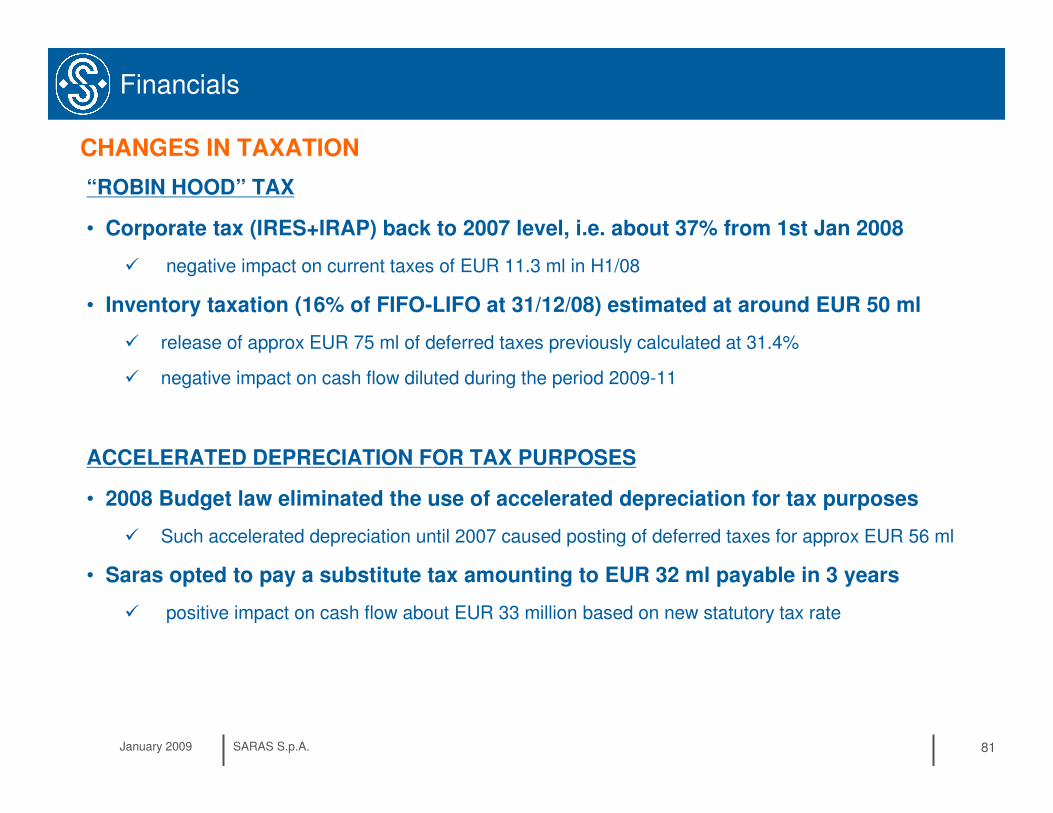
CHANGES IN TAXATION
“ROBIN HOOD” TAX
• Corporate tax (IRES+IRAP) back to 2007 level, i.e. about 37% from 1st Jan 2008
� negative impact on current taxes of EUR 11.3 ml in H1/08
• Inventory taxation (16% of FIFO-LIFO at 31/12/08) estimated at around EUR 50 ml
� release of approx EUR 75 ml of deferred taxes previously calculated at 31.4%
� negative impact on cash flow diluted during the period 2009-11
ACCELERATED DEPRECIATION FOR TAX PURPOSES
• 2008 Budget law eliminated the use of accelerated depreciation for tax purposes
� Such accelerated depreciation until 2007 caused posting of deferred taxes for approx EUR 56 ml
• Saras opted to pay a substitute tax amounting to EUR 32 ml payable in 3 years
� positive impact on cash flow about EUR 33 million based on new statutory tax rate
January 2009 SARAS S.p.A. 82
Financials
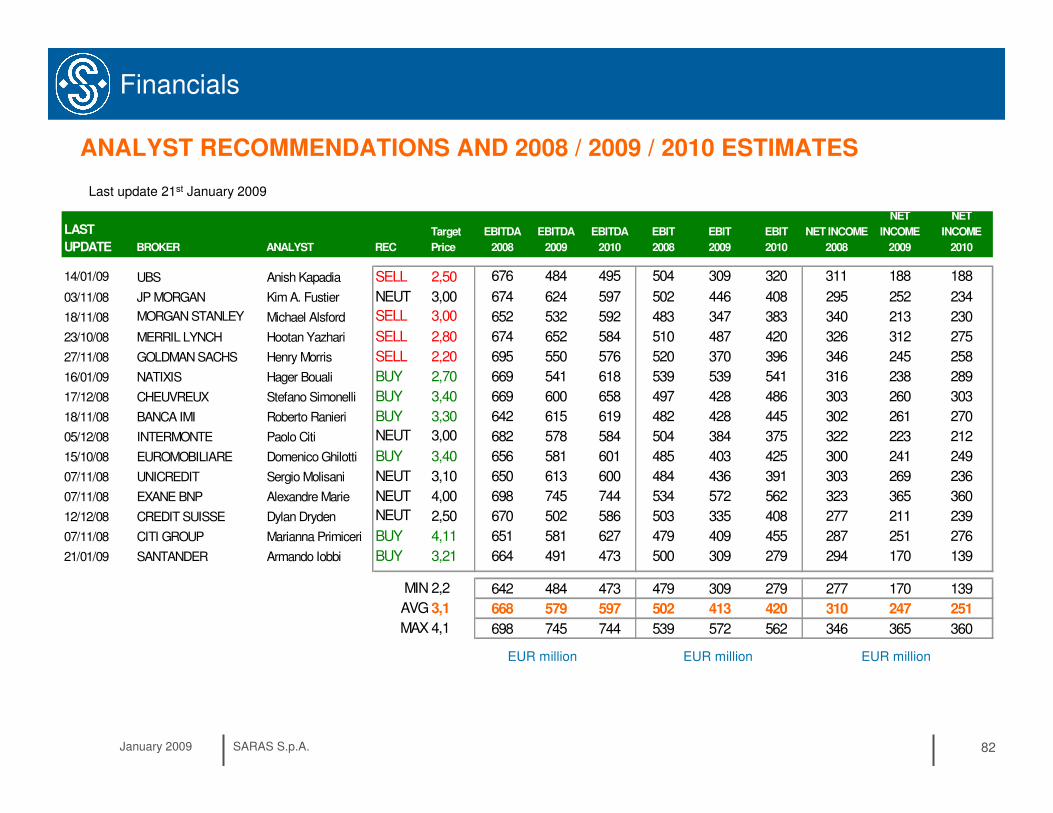
ANALYST RECOMMENDATIONS AND 2008 / 2009 / 2010 ESTIMATES
Last update 21st January 2009
EUR million EUR million EUR million
LAST
UPDATE BROKER ANALYST REC
Target
Price
EBITDA
2008
EBITDA
2009
EBITDA
2010
EBIT
2008
EBIT
2009
EBIT
2010
NET INCOME
2008
NET
INCOME
2009
NET
INCOME
2010
14/01/09 UBS Anish Kapadia SELL 2,50 676 484 495 504 309 320 311 188 188
03/11/08 JP MORGAN Kim A. Fustier NEUT 3,00 674 624 597 502 446 408 295 252 234
18/11/08 MORGAN STANLEY Michael Alsford SELL 3,00 652 532 592 483 347 383 340 213 230
23/10/08 MERRIL LYNCH Hootan Yazhari SELL 2,80 674 652 584 510 487 420 326 312 275
27/11/08 GOLDMAN SACHS Henry Morris SELL 2,20 695 550 576 520 370 396 346 245 258
16/01/09 NATIXIS Hager Bouali BUY 2,70 669 541 618 539 539 541 316 238 289
17/12/08 CHEUVREUX Stefano Simonelli BUY 3,40 669 600 658 497 428 486 303 260 303
18/11/08 BANCA IMI Roberto Ranieri BUY 3,30 642 615 619 482 428 445 302 261 270
05/12/08 INTERMONTE Paolo Citi NEUT 3,00 682 578 584 504 384 375 322 223 212
15/10/08 EUROMOBILIARE Domenico Ghilotti BUY 3,40 656 581 601 485 403 425 300 241 249
07/11/08 UNICREDIT Sergio Molisani NEUT 3,10 650 613 600 484 436 391 303 269 236
07/11/08 EXANE BNP Alexandre Marie NEUT 4,00 698 745 744 534 572 562 323 365 360
12/12/08 CREDIT SUISSE Dylan Dryden NEUT 2,50 670 502 586 503 335 408 277 211 239
07/11/08 CITI GROUP Marianna Primiceri BUY 4,11 651 581 627 479 409 455 287 251 276
21/01/09 SANTANDER Armando Iobbi BUY 3,21 664 491 473 500 309 279 294 170 139
MIN 2,2 642 484 473 479 309 279 277 170 139
AVG 3,1 668 579 597 502 413 420 310 247 251
MAX 4,1 698 745 744 539 572 562 346 365 360

January 2009 SARAS S.p.A. 83
EV/DACF 2008source: Saras elaboration on Bloomberg data
6,96,6
5,9 5,6
4,3 4,1
2,4
6,9
0
2
4
6
8
10
ERG
MO
H
HEP
NES
TE
SARAS
PKN
PPHN
LOTO
S
average = 5.3
Financials
MARKET MULTIPLES
Last update 13th January 2009; Saras share price EUR 2,60
EV/EBITDA 2008source: Saras elaboration on Bloomberg data
5,2 5,04,7
4,0 3,9 3,8
2,2
5,4
0
2
4
6
8
HEP
MOH
ERG
NESTE
SARA
S
PKN
PPHN
LOTO
S
average = 4,3
P/E 2008
source: Bloomberg10,9
3,3
5,55,86,06,0
6,6
7,9
0
2
4
6
8
10
12
14
ERG
SAR
AS
HEP
NES
TE
PKN
MO
H
LOTO
S
PPH
N
average= 6,5

•• Saras in a SnapshotSaras in a Snapshot
•• Market OverviewMarket Overview
•• Competitive PositioningCompetitive Positioning
•• Business SegmentsBusiness Segments
•• Investment Plan 2008Investment Plan 2008--20112011
•• FinancialsFinancials
• Others
January 2009 SARAS S.p.A. 85
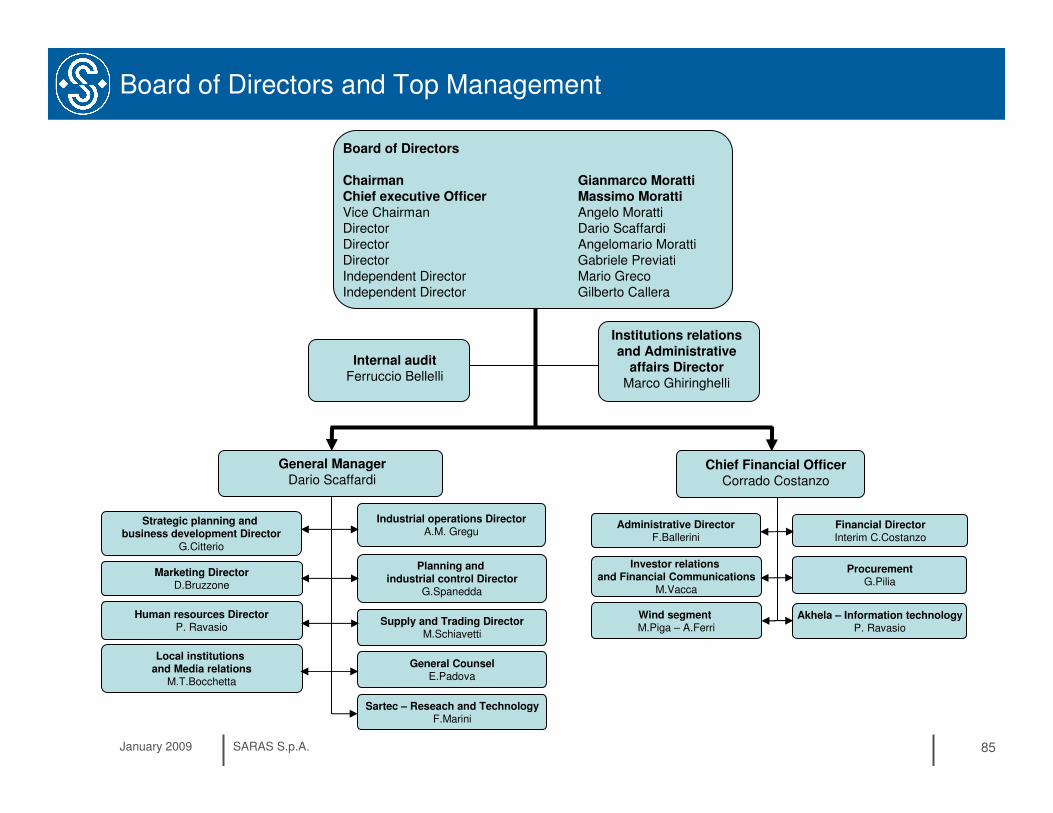
Board of Directors and Top Management
Board of Directors
Chairman Gianmarco MorattiChief executive Officer Massimo MorattiVice Chairman Angelo MorattiDirector Dario ScaffardiDirector Angelomario MorattiDirector Gabriele PreviatiIndependent Director Mario GrecoIndependent Director Gilberto Callera
Marketing DirectorD.Bruzzone
General ManagerDario Scaffardi
Internal auditFerruccio Bellelli
Institutions relations and Administrative
affairs DirectorMarco Ghiringhelli
Chief Financial OfficerCorrado Costanzo
Strategic planning and business development Director
G.Citterio
Human resources DirectorP. Ravasio
Industrial operations DirectorA.M. Gregu
Supply and Trading DirectorM.Schiavetti
Planning and industrial control Director
G.Spanedda
Local institutions and Media relations
M.T.Bocchetta
General CounselE.Padova
Administrative DirectorF.Ballerini
Financial DirectorInterim C.Costanzo
Sartec – Reseach and TechnologyF.Marini
ProcurementG.Pilia
Wind segment M.Piga – A.Ferri
Investor relations and Financial Communications
M.Vacca
Akhela – Information technologyP. Ravasio
January 2009 SARAS S.p.A. 86
Management compensation
• Annual salary and fringe benefits
• Annual incentive bonuses• based on both Company’s financial performance vs. budget and
individual performance
• Medium term Stock grant incentive plan• period 2007-2009• based on Saras’ stock performance vs. peers and Company’s
financial performance

January 2009 SARAS S.p.A. 87
Corporate Governance
The Company is structured according to the traditional business administration and audit model as follows:
Board of Directors charged with overseeing business management within which various committees have been set up, namely
• remuneration committee• internal control committee
the Board includes two independent non-executive directors, Mr Mario Greco and Mr Gilberto Callera, who, together with another non-executive director, Mr Gabriele Previati, make up the above mentioned remuneration committee and the internal control committee.
Board of Statutory Auditors charged with supervising the compliance with laws and statutes, and monitoring the adequacy of the organisational structure, the internal control system and the Company’s accounting-administrative system.The Board has nominated the Chairman of the Board of Directors as the executive in charge of surveying internal control system functions.
January 2009 SARAS S.p.A. 88
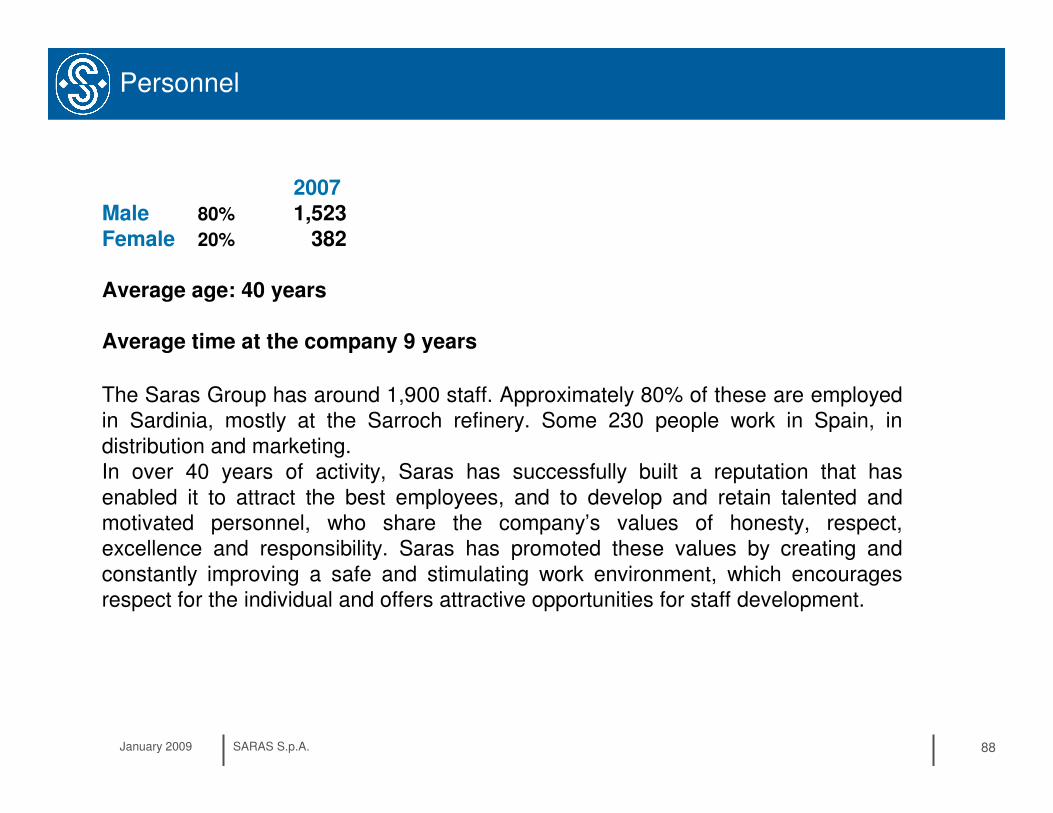
Personnel
2007Male 80% 1,523Female 20% 382
Average age: 40 years
Average time at the company 9 years
The Saras Group has around 1,900 staff. Approximately 80% of these are employed in Sardinia, mostly at the Sarroch refinery. Some 230 people work in Spain, in distribution and marketing.In over 40 years of activity, Saras has successfully built a reputation that has enabled it to attract the best employees, and to develop and retain talented and motivated personnel, who share the company’s values of honesty, respect, excellence and responsibility. Saras has promoted these values by creating and constantly improving a safe and stimulating work environment, which encourages respect for the individual and offers attractive opportunities for staff development.
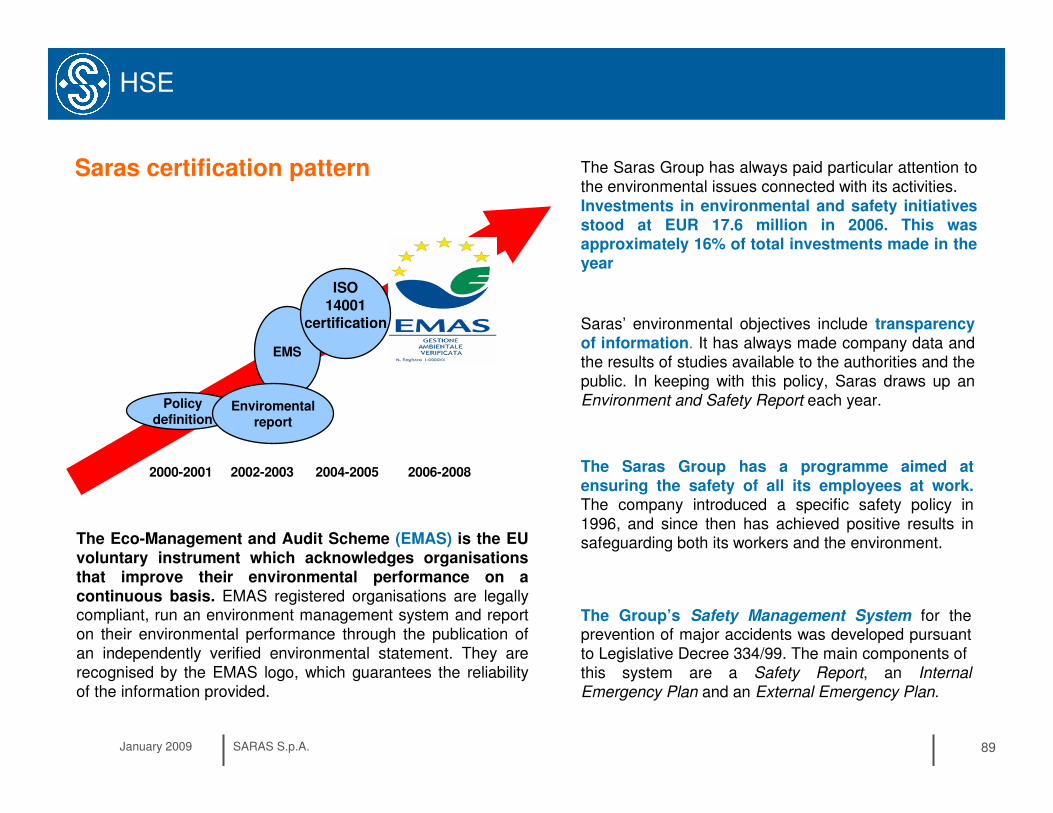
January 2009 SARAS S.p.A. 89
HSE
2000-2001 2002-2003 2004-2005 2006-2008
Policy definition
EMS
Enviromentalreport
ISO14001
certification
The Eco-Management and Audit Scheme (EMAS) is the EU voluntary instrument which acknowledges organisations that improve their environmental performance on a continuous basis. EMAS registered organisations are legally compliant, run an environment management system and report on their environmental performance through the publication of an independently verified environmental statement. They are recognised by the EMAS logo, which guarantees the reliability of the information provided.
Saras certification pattern The Saras Group has always paid particular attention to the environmental issues connected with its activities.Investments in environmental and safety initiatives stood at EUR 17.6 million in 2006. This was approximately 16% of total investments made in the year
The Saras Group has a programme aimed at ensuring the safety of all its employees at work.The company introduced a specific safety policy in 1996, and since then has achieved positive results in safeguarding both its workers and the environment.
Saras’ environmental objectives include transparency of information. It has always made company data and the results of studies available to the authorities and the public. In keeping with this policy, Saras draws up an Environment and Safety Report each year.
The Group’s Safety Management System for the prevention of major accidents was developed pursuant to Legislative Decree 334/99. The main components ofthis system are a Safety Report, an Internal
Emergency Plan and an External Emergency Plan.
January 2009 SARAS S.p.A. 90
WEBSITE
NEW WEBSITE
www.saras.it
Including a comprehensive market section updated weekly:
- EMC margin benchmark- Crude oil and products prices- Crack spreads
Saras Investor Relations

IR contacts
General email: [email protected]
IR Manager: Massimo Vacca +39 02 7737 376
IR Officer & Financial Comms: Rafaella Casula +39 02 7737 495
IR Assistants: Michele Crisci & Alessandra Gelmini +39 02 7737 642


