28
Presentation to Municipal Government Board and Assessment Review Boards Bob Ascah Ph.D. Fellow, Institute for Public Economics Edmonton 14 September 2016

Presentation to Municipal Government Board and Assessment Review Boards
Bob Ascah Ph.D.
Fellow, Institute for Public Economics
Edmonton 14 September 2016

AGENDA
• ALBERTA’S BOOM AND BUST ECONOMY
• KEY DRIVERS OF COMMERCIAL AND RESIDENTIAL REAL ESTATE VALUES
• ECONOMIC DATA
• AREAS TO MONITOR
• ALBERTA’S FUTURE ECONOMIC PROSPECTS
Albertarecessionwatch.com
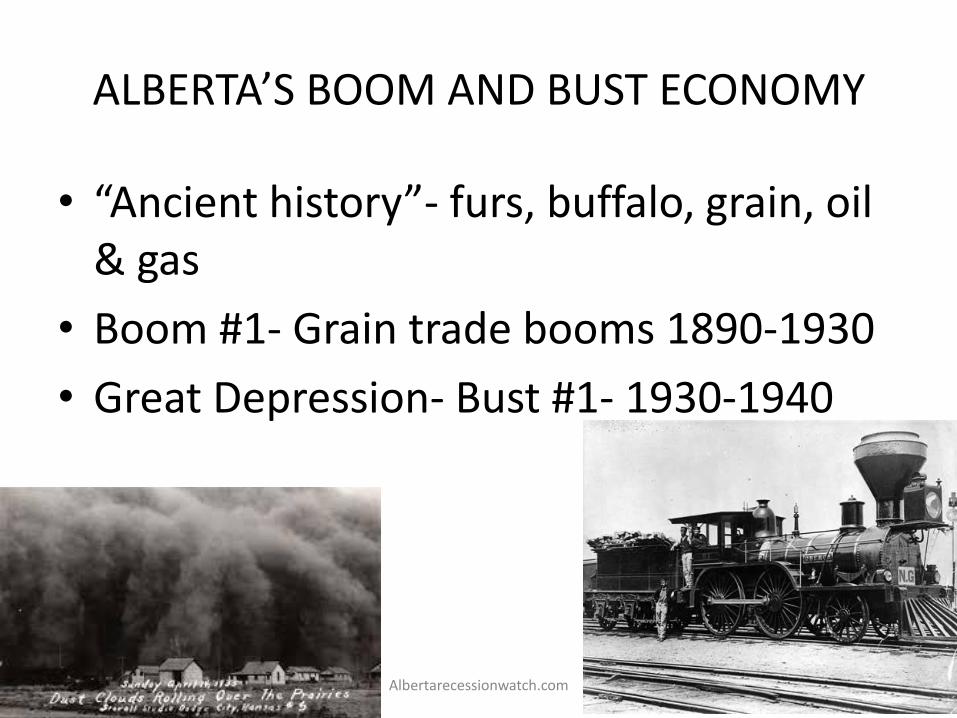
ALBERTA’S BOOM AND BUST ECONOMY
• “Ancient history”- furs, buffalo, grain, oil & gas
• Boom #1- Grain trade booms 1890-1930
• Great Depression- Bust #1- 1930-1940
Albertarecessionwatch.com
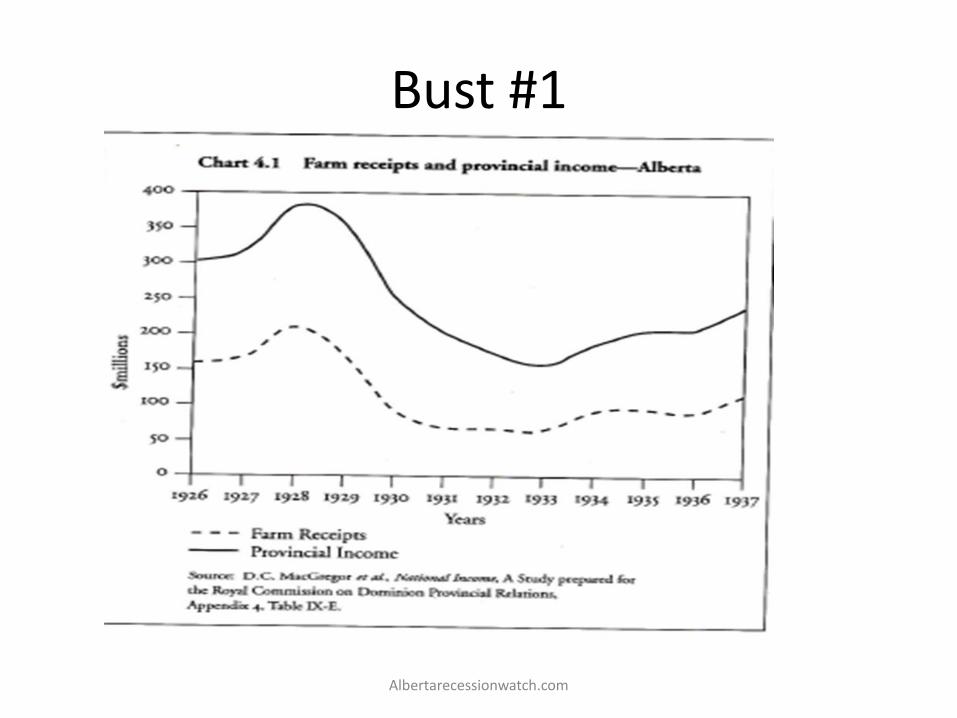
Bust #1
Albertarecessionwatch.com
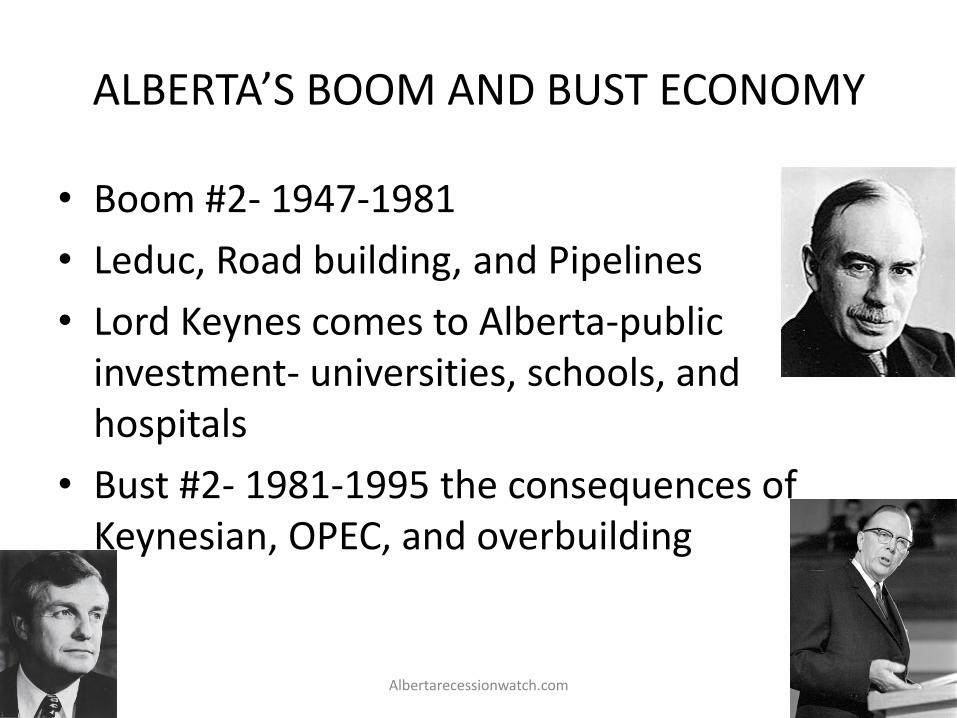
ALBERTA’S BOOM AND BUST ECONOMY
• Boom #2- 1947-1981
• Leduc, Road building, and Pipelines
• Lord Keynes comes to Alberta-public investment- universities, schools, and hospitals
• Bust #2- 1981-1995 the consequences of Keynesian, OPEC, and overbuilding
Albertarecessionwatch.com

ALBERTA’S BOOM AND BUST ECONOMY
• Boom #3- 1995-2014- Klein, McLellan and Newell- oilsands, markets, and over-investment
• Bust #3- 2014- the consequences of neo-liberalism, over-investment, and Lord Keynes (again)
Albertarecessionwatch.com

ECONOMIC DATA Oil Prices- Real 1946-2016
Albertarecessionwatch.com
Source: Macrotrends, http://www.macrotrends.net/1369/crude-oil-price-history-chart
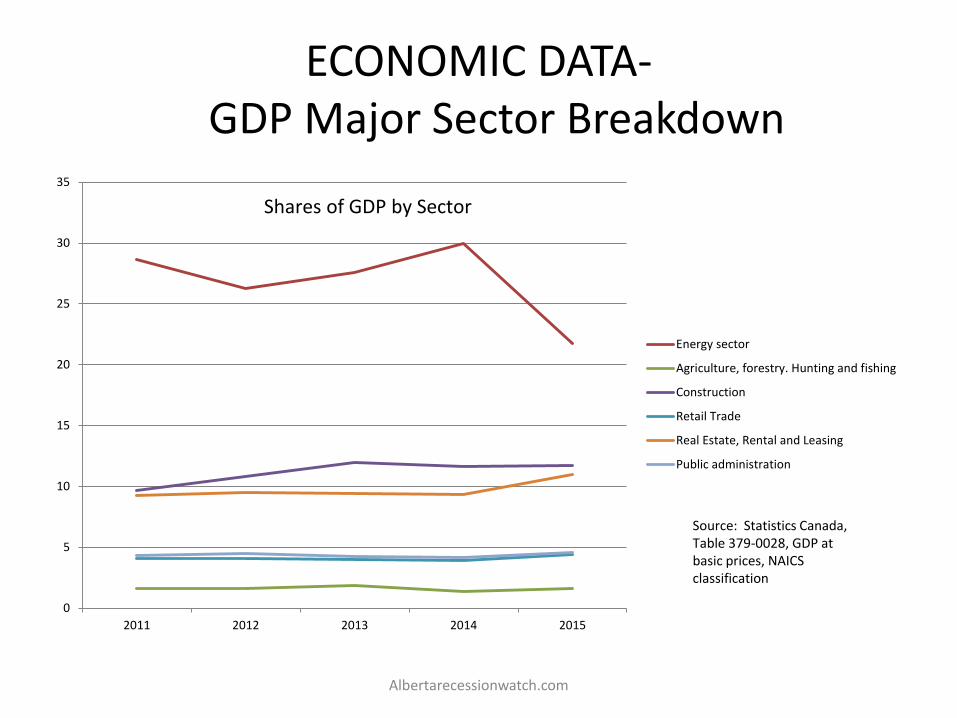
ECONOMIC DATA- GDP Major Sector Breakdown
Albertarecessionwatch.com
0
5
10
15
20
25
30
35
2011 2012 2013 2014 2015
Energy sector
Agriculture, forestry. Hunting and fishing
Construction
Retail Trade
Real Estate, Rental and Leasing
Public administration
Shares of GDP by Sector
Source: Statistics Canada, Table 379-0028, GDP at basic prices, NAICS classification
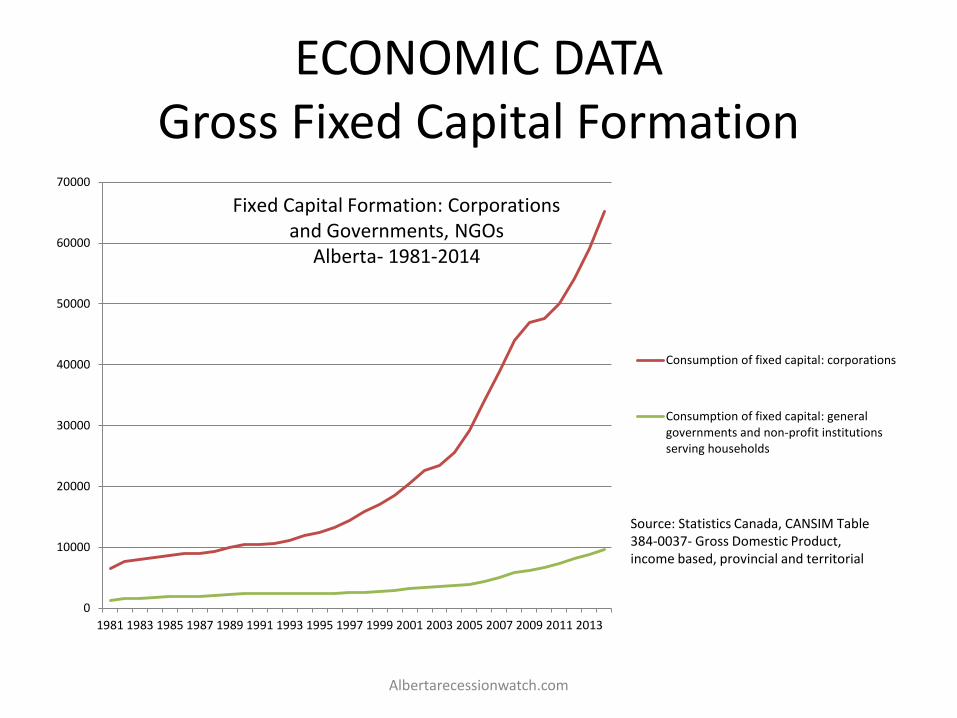
ECONOMIC DATA Gross Fixed Capital Formation
Albertarecessionwatch.com
0
10000
20000
30000
40000
50000
60000
70000
1981 1983 1985 1987 1989 1991 1993 1995 1997 1999 2001 2003 2005 2007 2009 2011 2013
Consumption of fixed capital: corporations
Consumption of fixed capital: generalgovernments and non-profit institutionsserving households
Fixed Capital Formation: Corporations and Governments, NGOs
Alberta- 1981-2014
Source: Statistics Canada, CANSIM Table 384-0037- Gross Domestic Product, income based, provincial and territorial
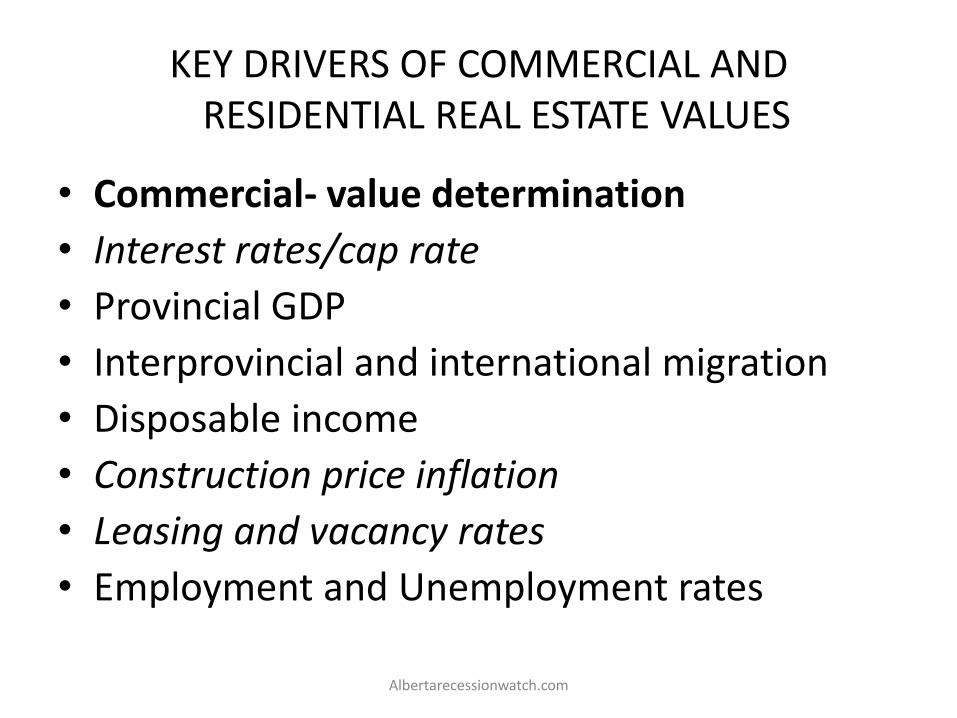
KEY DRIVERS OF COMMERCIAL AND RESIDENTIAL REAL ESTATE VALUES
• Commercial- value determination
• Interest rates/cap rate
• Provincial GDP
• Interprovincial and international migration
• Disposable income
• Construction price inflation
• Leasing and vacancy rates
• Employment and Unemployment rates
Albertarecessionwatch.com

KEY DRIVERS OF COMMERCIAL AND RESIDENTIAL REAL ESTATE VALUES
• Residential- value determination
• Interest rates/cap rate
• Provincial GDP
• Interprovincial and international migration
• Disposable income
• Construction price inflation
• Employment and Unemployment rates
Albertarecessionwatch.com

ECONOMIC DATA- Interest Rates
Albertarecessionwatch.com
0
5
10
15
20
25
Jan
-34
May
-36
Sep
-38
Jan
-41
May
-43
Sep
-45
Jan
-48
May
-50
Sep
-52
Jan
-55
May
-57
Sep
-59
Jan
-62
May
-64
Sep
-66
Jan
-69
May
-71
Sep
-73
Jan
-76
May
-78
Sep
-80
Jan
-83
May
-85
Sep
-87
Jan
-90
May
-92
Sep
-94
Jan
-97
May
-99
Sep
-01
Jan
-04
May
-06
Sep
-08
Jan
-11
May
-13
Sep
-15
Canadian Bank Rate 1935-2016 Monthly
Bank rate
Source: CANSIM Table 176-0043 Financial
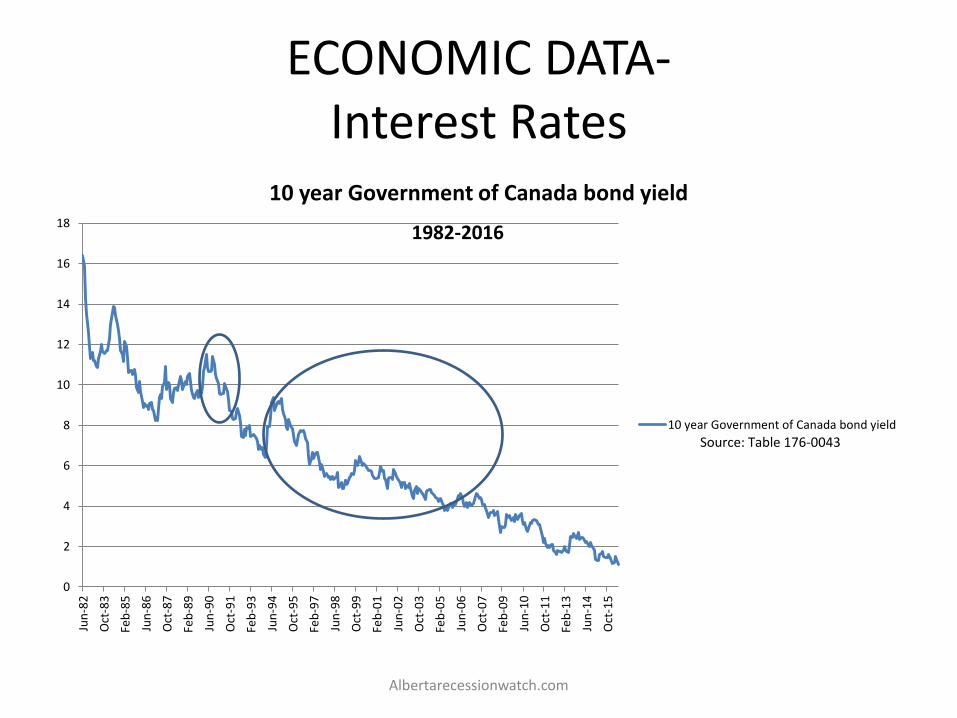
ECONOMIC DATA- Interest Rates
Albertarecessionwatch.com
0
2
4
6
8
10
12
14
16
18
Jun
-82
Oct
-83
Feb
-85
Jun
-86
Oct
-87
Feb
-89
Jun
-90
Oct
-91
Feb
-93
Jun
-94
Oct
-95
Feb
-97
Jun
-98
Oct
-99
Feb
-01
Jun
-02
Oct
-03
Feb
-05
Jun
-06
Oct
-07
Feb
-09
Jun
-10
Oct
-11
Feb
-13
Jun
-14
Oct
-15
10 year Government of Canada bond yield
10 year Government of Canada bond yield
1982-2016
Source: Table 176-0043
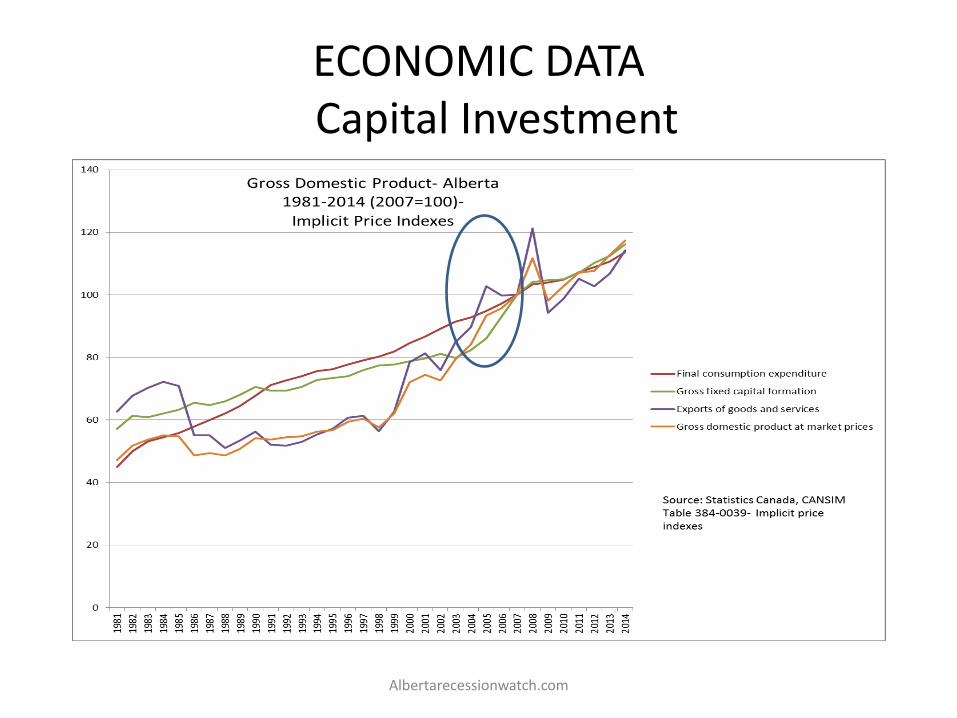
ECONOMIC DATA Capital Investment
Albertarecessionwatch.com
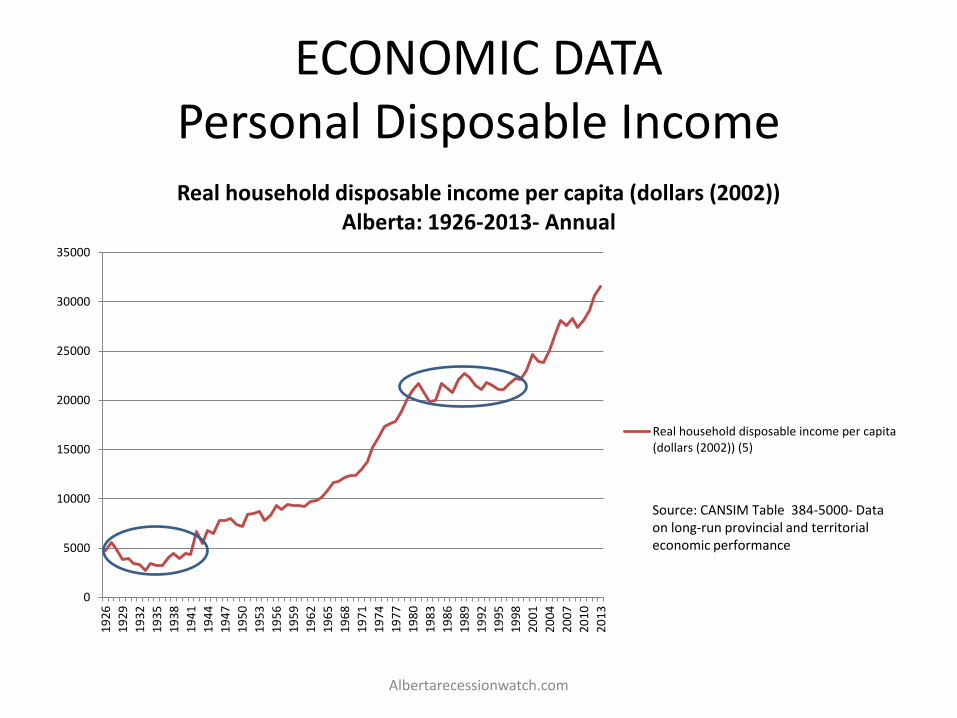
ECONOMIC DATA Personal Disposable Income
Albertarecessionwatch.com
0
5000
10000
15000
20000
25000
30000
35000
19
26
19
29
19
32
19
35
19
38
19
41
19
44
19
47
19
50
19
53
19
56
19
59
19
62
19
65
19
68
19
71
19
74
19
77
19
80
19
83
19
86
19
89
19
92
19
95
19
98
20
01
20
04
20
07
20
10
20
13
Real household disposable income per capita (dollars (2002)) Alberta: 1926-2013- Annual
Real household disposable income per capita(dollars (2002)) (5)
Source: CANSIM Table 384-5000- Data on long-run provincial and territorial economic performance
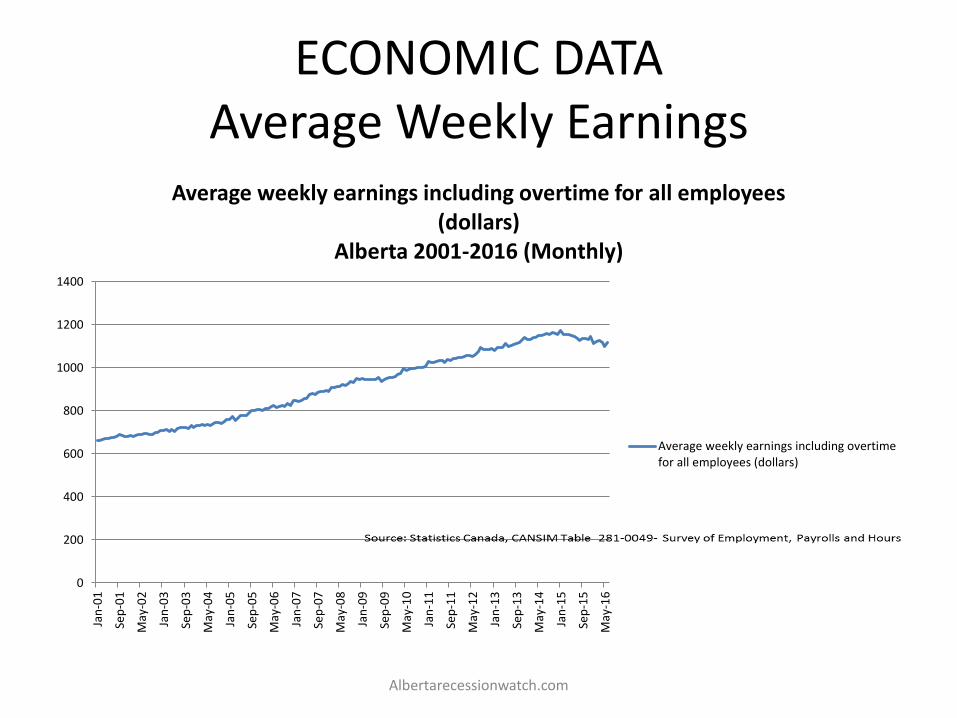
ECONOMIC DATA Average Weekly Earnings
Albertarecessionwatch.com
0
200
400
600
800
1000
1200
1400
Jan
-01
Sep
-01
May
-02
Jan
-03
Sep
-03
May
-04
Jan
-05
Sep
-05
May
-06
Jan
-07
Sep
-07
May
-08
Jan
-09
Sep
-09
May
-10
Jan
-11
Sep
-11
May
-12
Jan
-13
Sep
-13
May
-14
Jan
-15
Sep
-15
May
-16
Average weekly earnings including overtime for all employees (dollars)
Alberta 2001-2016 (Monthly)
Average weekly earnings including overtimefor all employees (dollars)
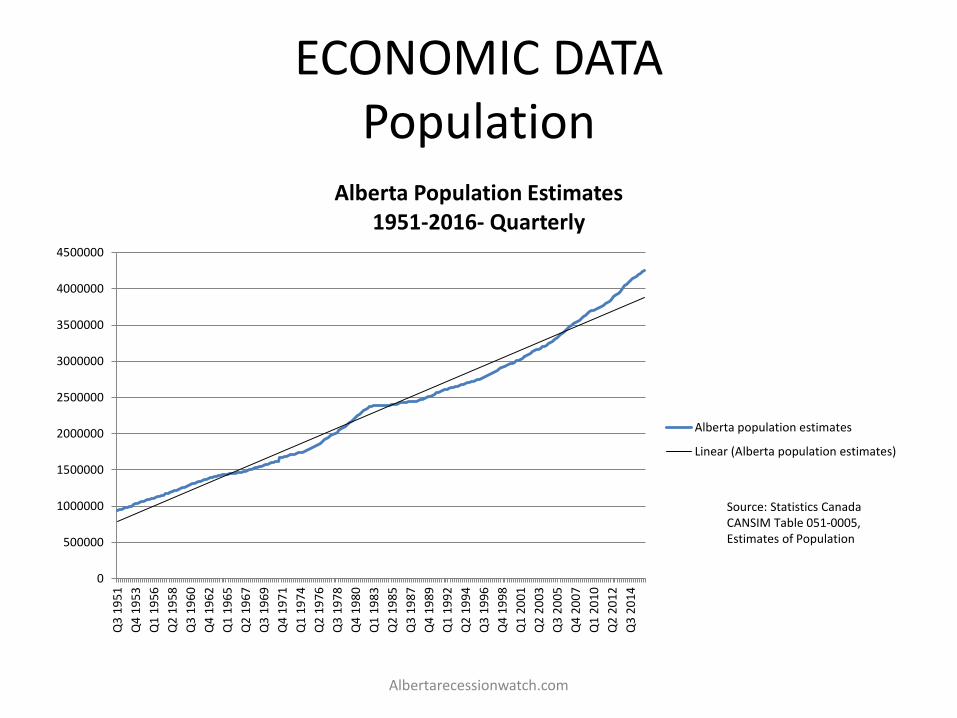
ECONOMIC DATA Population
Albertarecessionwatch.com
0
500000
1000000
1500000
2000000
2500000
3000000
3500000
4000000
4500000
Q3
19
51
Q4
19
53
Q1
19
56
Q2
19
58
Q3
19
60
Q4
19
62
Q1
19
65
Q2
19
67
Q3
19
69
Q4
19
71
Q1
19
74
Q2
19
76
Q3
19
78
Q4
19
80
Q1
19
83
Q2
19
85
Q3
19
87
Q4
19
89
Q1
19
92
Q2
19
94
Q3
19
96
Q4
19
98
Q1
20
01
Q2
20
03
Q3
20
05
Q4
20
07
Q1
20
10
Q2
20
12
Q3
20
14
Alberta Population Estimates 1951-2016- Quarterly
Alberta population estimates
Linear (Alberta population estimates)
Source: Statistics Canada CANSIM Table 051-0005, Estimates of Population
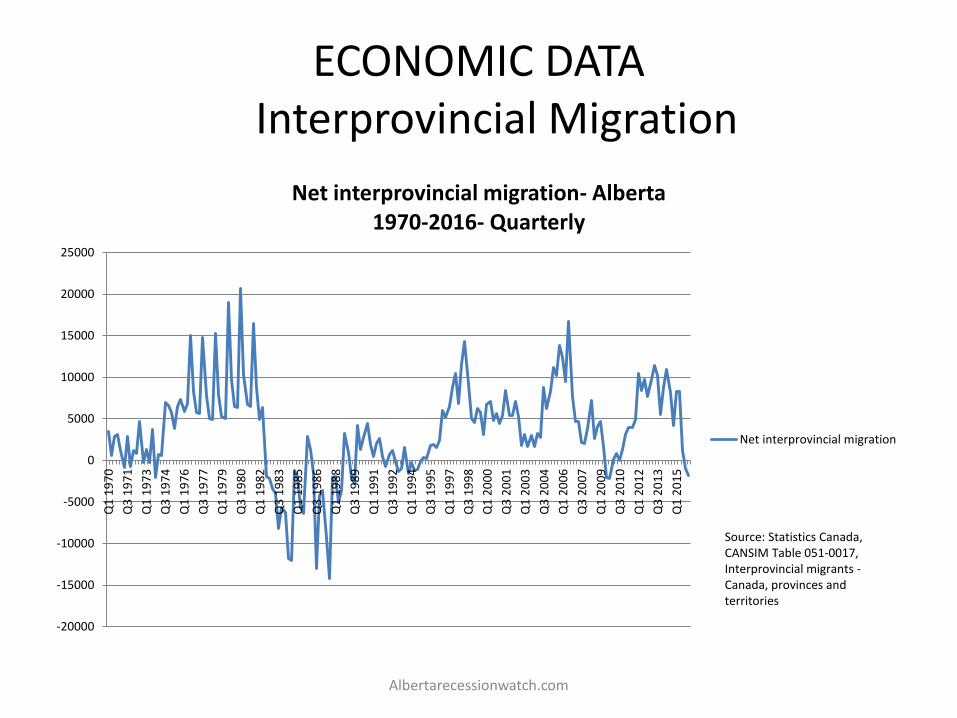
ECONOMIC DATA Interprovincial Migration
Albertarecessionwatch.com
-20000
-15000
-10000
-5000
0
5000
10000
15000
20000
25000
Q1
19
70
Q3
19
71
Q1
19
73
Q3
19
74
Q1
19
76
Q3
19
77
Q1
19
79
Q3
19
80
Q1
19
82
Q3
19
83
Q1
19
85
Q3
19
86
Q1
19
88
Q3
19
89
Q1
19
91
Q3
19
92
Q1
19
94
Q3
19
95
Q1
19
97
Q3
19
98
Q1
20
00
Q3
20
01
Q1
20
03
Q3
20
04
Q1
20
06
Q3
20
07
Q1
20
09
Q3
20
10
Q1
20
12
Q3
20
13
Q1
20
15
Net interprovincial migration- Alberta 1970-2016- Quarterly
Net interprovincial migration
Source: Statistics Canada, CANSIM Table 051-0017, Interprovincial migrants - Canada, provinces and territories

ECONOMIC DATA Employment
Albertarecessionwatch.com
0
500000
1000000
1500000
2000000
2500000
Jan
-01
Sep
-01
May
-02
Jan
-03
Sep
-03
May
-04
Jan
-05
Sep
-05
May
-06
Jan
-07
Sep
-07
May
-08
Jan
-09
Sep
-09
May
-10
Jan
-11
Sep
-11
May
-12
Jan
-13
Sep
-13
May
-14
Jan
-15
Sep
-15
May
-16
Employment for all employees (persons) Alberta 2001- 2016 Monthly
Employment for all employees (persons) (13)
Source: Statistics Canada, CANSIM Table 281-0049- Survey of Employment, Payrolls and Hours
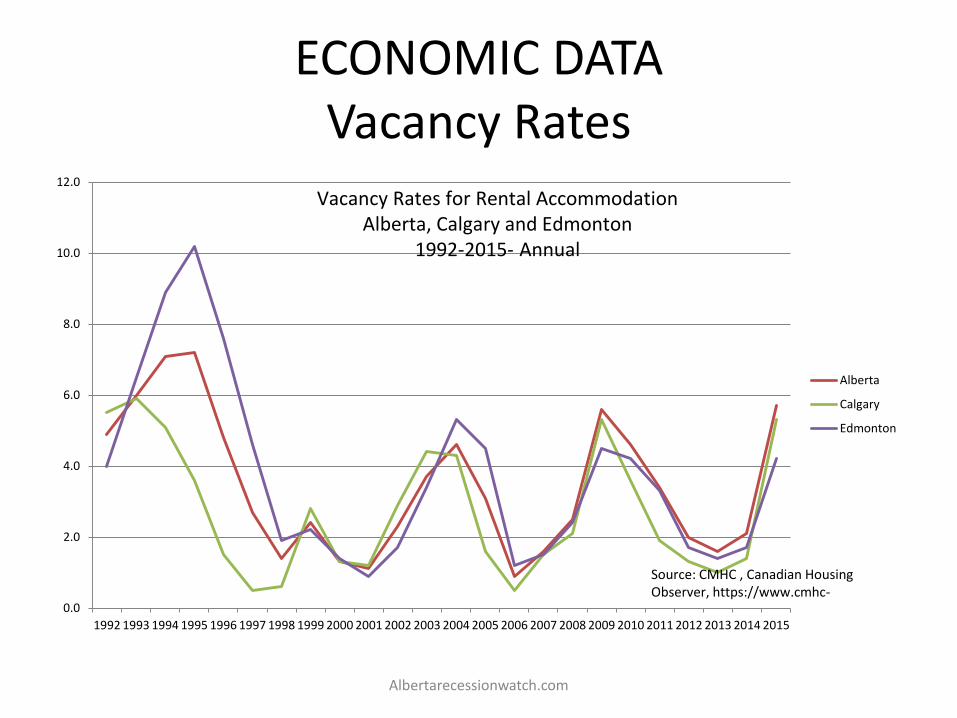
ECONOMIC DATA Vacancy Rates
Albertarecessionwatch.com
0.0
2.0
4.0
6.0
8.0
10.0
12.0
1992 1993 1994 1995 1996 1997 1998 1999 2000 2001 2002 2003 2004 2005 2006 2007 2008 2009 2010 2011 2012 2013 2014 2015
Alberta
Calgary
Edmonton
Vacancy Rates for Rental Accommodation Alberta, Calgary and Edmonton
1992-2015- Annual
Source: CMHC , Canadian Housing Observer, https://www.cmhc-
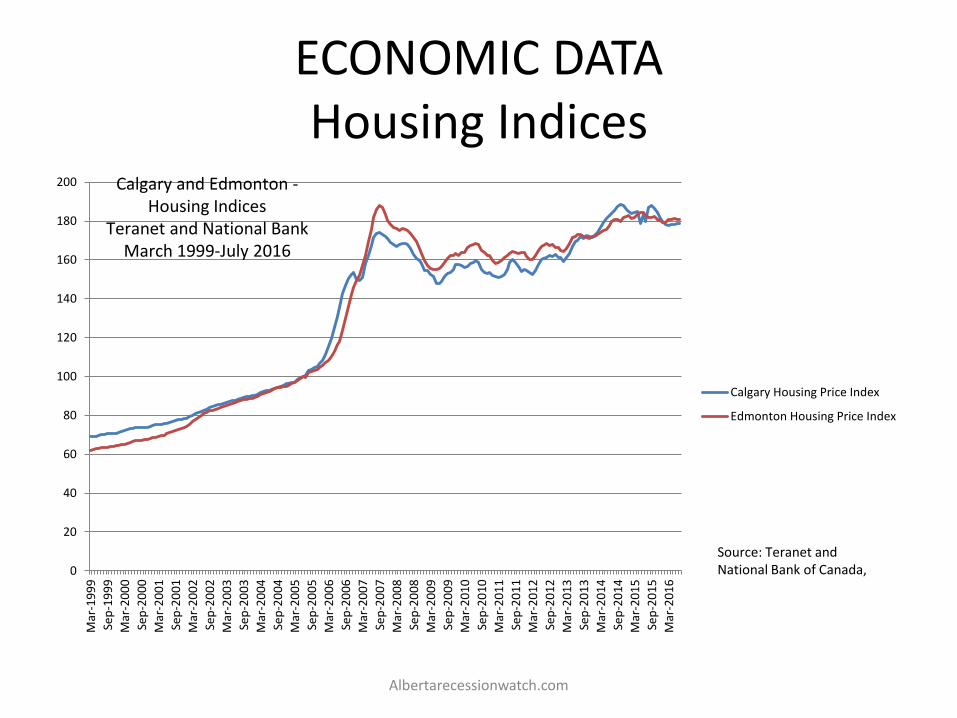
ECONOMIC DATA Housing Indices
Albertarecessionwatch.com
0
20
40
60
80
100
120
140
160
180
200
Mar
-19
99
Sep
-19
99
Mar
-20
00
Sep
-20
00
Mar
-20
01
Sep
-20
01
Mar
-20
02
Sep
-20
02
Mar
-20
03
Sep
-20
03
Mar
-20
04
Sep
-20
04
Mar
-20
05
Sep
-20
05
Mar
-20
06
Sep
-20
06
Mar
-20
07
Sep
-20
07
Mar
-20
08
Sep
-20
08
Mar
-20
09
Sep
-20
09
Mar
-20
10
Sep
-20
10
Mar
-20
11
Sep
-20
11
Mar
-20
12
Sep
-20
12
Mar
-20
13
Sep
-20
13
Mar
-20
14
Sep
-20
14
Mar
-20
15
Sep
-20
15
Mar
-20
16
Calgary Housing Price Index
Edmonton Housing Price Index
Source: Teranet and National Bank of Canada,
Calgary and Edmonton - Housing Indices
Teranet and National Bank March 1999-July 2016
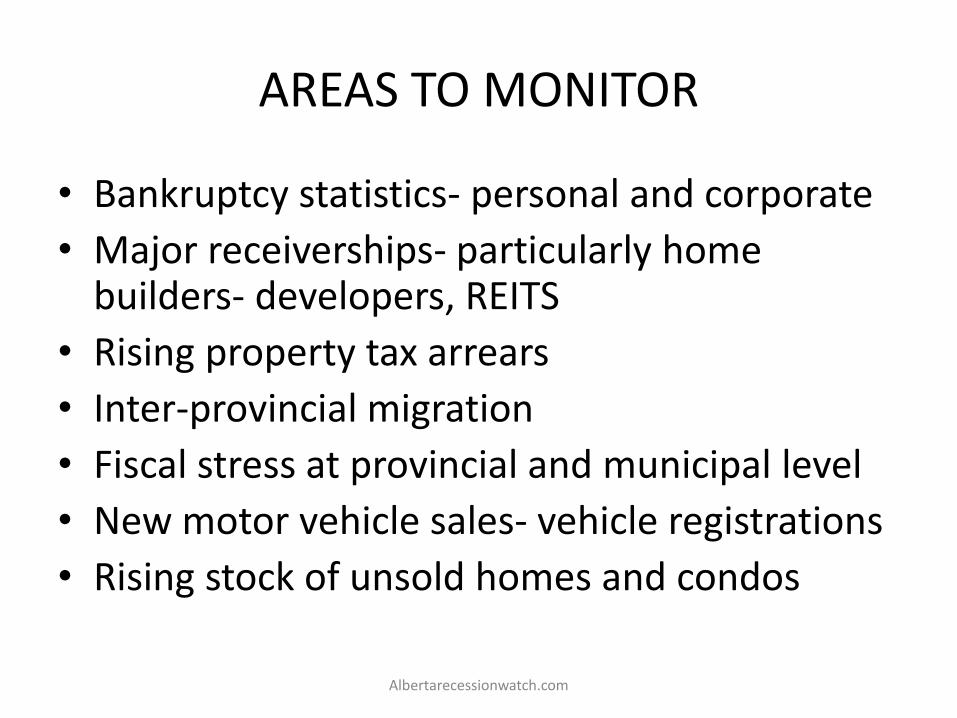
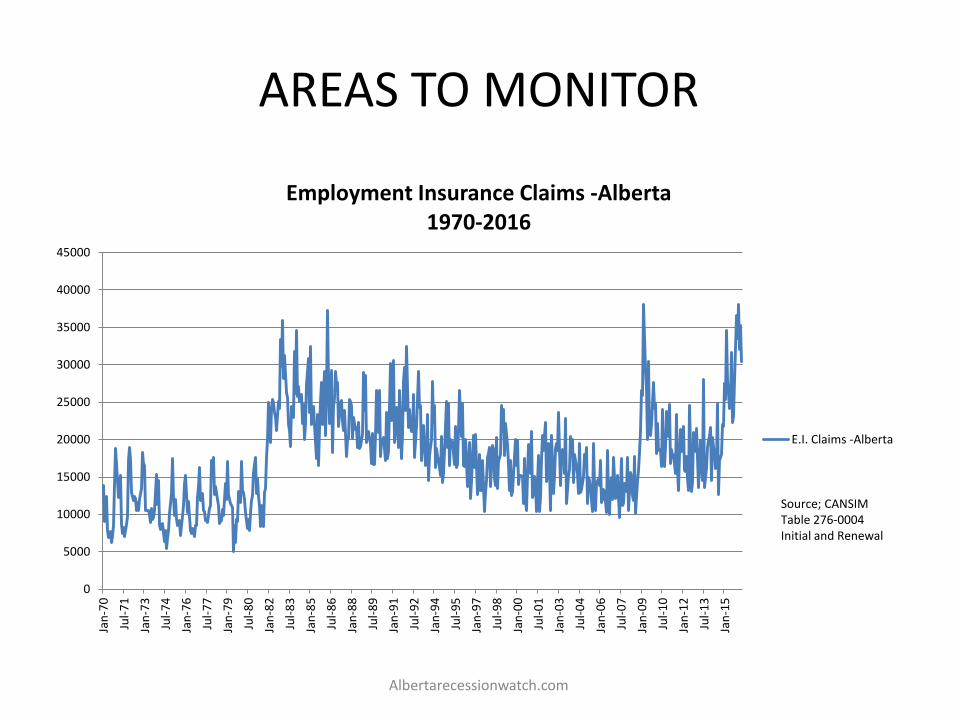
AREAS TO MONITOR
Albertarecessionwatch.com
• Bankruptcy statistics- personal and corporate
• Major receiverships- particularly home builders- developers, REITS
• Rising property tax arrears
• Inter-provincial migration
• Fiscal stress at provincial and municipal level
• New motor vehicle sales- vehicle registrations
• Rising stock of unsold homes and condos
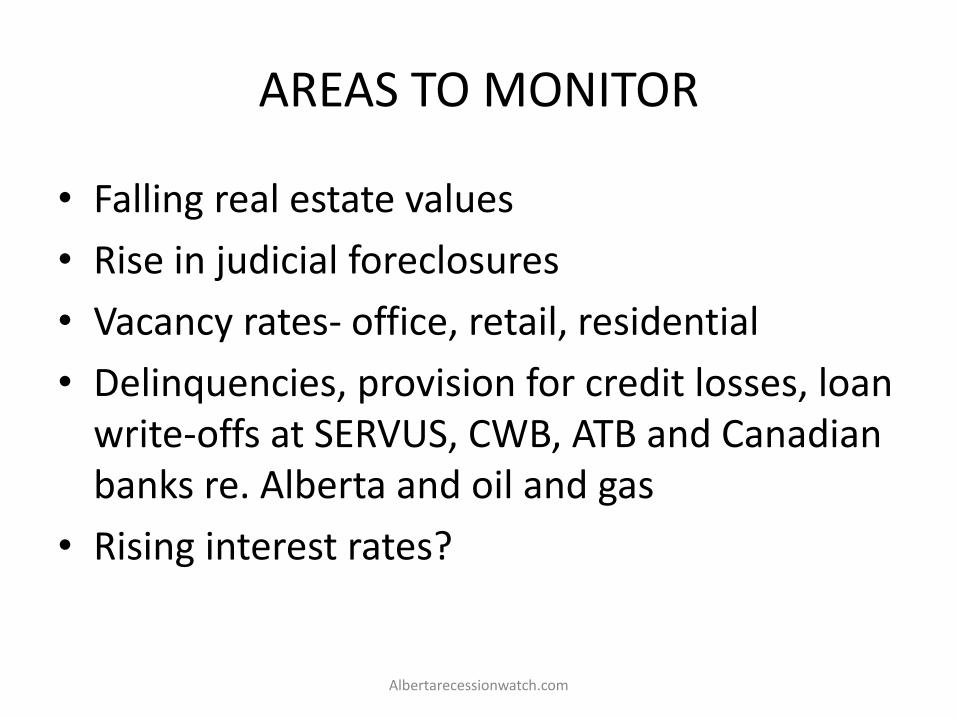
AREAS TO MONITOR
Albertarecessionwatch.com
• Falling real estate values
• Rise in judicial foreclosures
• Vacancy rates- office, retail, residential
• Delinquencies, provision for credit losses, loan write-offs at SERVUS, CWB, ATB and Canadian banks re. Alberta and oil and gas
• Rising interest rates?
AREAS TO MONITOR
Albertarecessionwatch.com
0
5000
10000
15000
20000
25000
30000
35000
40000
45000
Jan
-70
Jul-
71
Jan
-73
Jul-
74
Jan
-76
Jul-
77
Jan
-79
Jul-
80
Jan
-82
Jul-
83
Jan
-85
Jul-
86
Jan
-88
Jul-
89
Jan
-91
Jul-
92
Jan
-94
Jul-
95
Jan
-97
Jul-
98
Jan
-00
Jul-
01
Jan
-03
Jul-
04
Jan
-06
Jul-
07
Jan
-09
Jul-
10
Jan
-12
Jul-
13
Jan
-15
Employment Insurance Claims -Alberta 1970-2016
E.I. Claims -Alberta
Source; CANSIM Table 276-0004 Initial and Renewal

AREAS TO MONITOR
Albertarecessionwatch.com
0
2
4
6
8
10
12
14
Jan
-76
May
-77
Sep
-78
Jan
-80
May
-81
Sep
-82
Jan
-84
May
-85
Sep
-86
Jan
-88
May
-89
Sep
-90
Jan
-92
May
-93
Sep
-94
Jan
-96
May
-97
Sep
-98
Jan
-00
May
-01
Sep
-02
Jan
-04
May
-05
Sep
-06
Jan
-08
May
-09
Sep
-10
Jan
-12
May
-13
Sep
-14
Jan
-16
Official Unemployment Rate-Alberta 1976- August 2016
Unemployment Rate-Alberta
Source: CANSIM Table 282-0085- Labur Force Survey- Unemployment Rate- 15 years

Albertarecessionwatch.com
ALBERTA’S FUTURE ECONOMIC PROSPECTS
• Remains highly dependent on oil and natural gas prices
• Climate change, economics of oil sands development, pipeline development (or lack thereof) will determine economic growth over next 5 years
• Calgary and Edmonton commercial real estate market will continue to weaken
• Residential property values will decline in Calgary and Edmonton
• Too early to tell about rebuilding in Fort McMurray
• Bottom line- dismal outlook
Albertarecessionwatch.com

QUESTIONS?
Albertarecessionwatch.com


