26
PRESENTATION TO PARLIAMENTARY PORTFOLIO COMMITTEE ON WATER AFFAIRS AND FORESTRY 06 th MAY 2008
| Date post: | 28-Dec-2015 |
| Category: |
Documents |
| Upload: | jeffry-clark |
| View: | 221 times |
| Download: | 1 times |

PRESENTATION TO
PARLIAMENTARY PORTFOLIO
COMMITTEE ON WATER
AFFAIRS AND FORESTRY
06th MAY 2008
Contents
• Area of supply
• Financial performance
• State of Water quality
• Infrastructure roll out plan
• Challenges
• Way forward
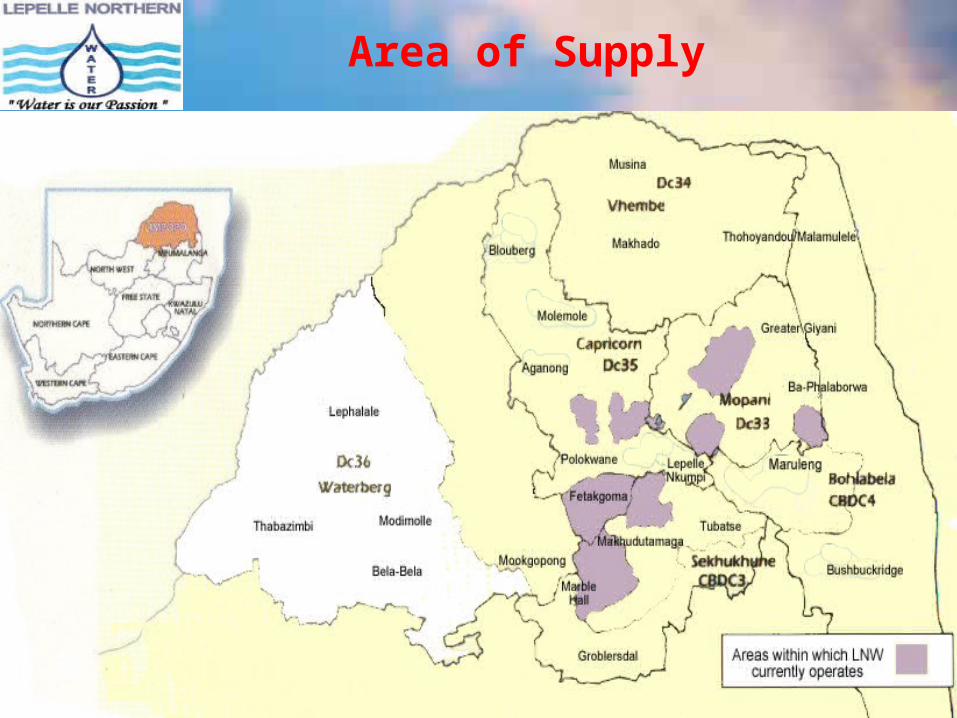
Area of Supply
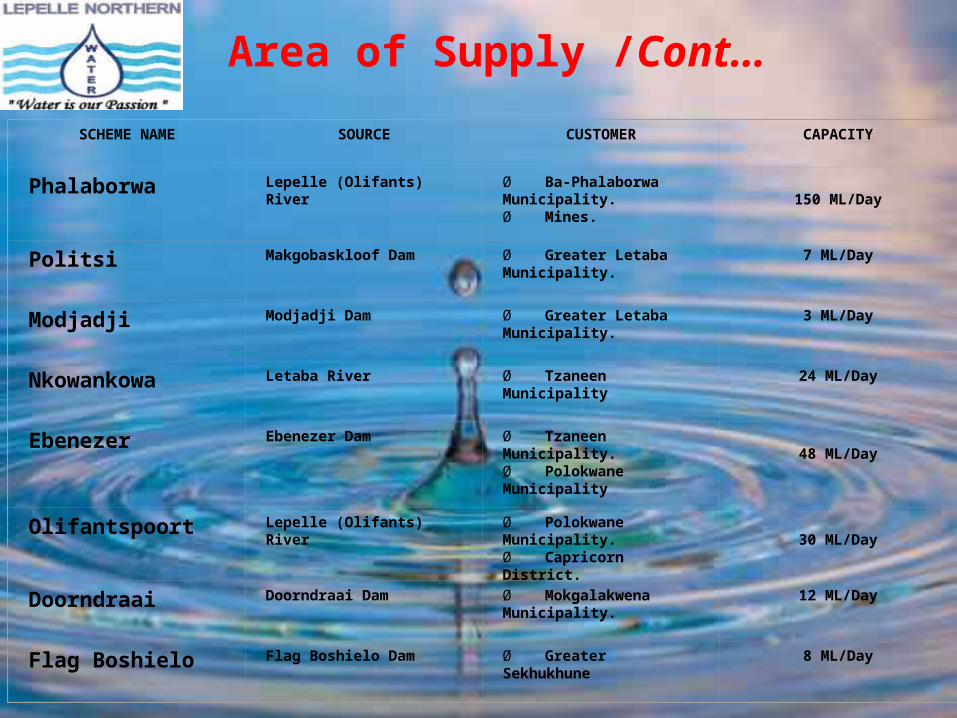
Area of Supply /Cont…
SCHEME NAME SOURCE CUSTOMER CAPACITY
Phalaborwa Lepelle (Olifants) River Ø Ba-Phalaborwa Municipality.Ø Mines.
150 ML/Day
Politsi Makgobaskloof Dam Ø Greater Letaba Municipality.
7 ML/Day
Modjadji Modjadji Dam Ø Greater Letaba Municipality.
3 ML/Day
Nkowankowa Letaba River Ø Tzaneen Municipality 24 ML/Day
Ebenezer Ebenezer Dam Ø Tzaneen Municipality.Ø Polokwane Municipality
48 ML/Day
Olifantspoort Lepelle (Olifants) River Ø Polokwane Municipality.Ø Capricorn District.
30 ML/Day
Doorndraai Doorndraai Dam Ø Mokgalakwena Municipality.
12 ML/Day
Flag Boshielo Flag Boshielo Dam Ø Greater Sekhukhune 8 ML/Day
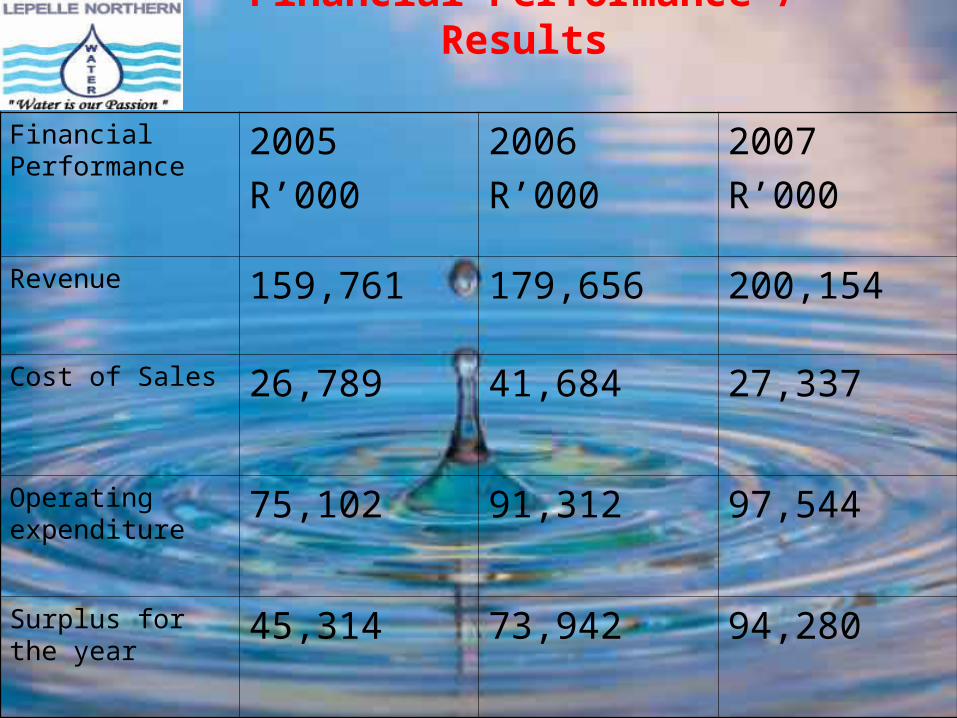
Financial Performance / Results
Financial Performance
2005
R’000
2006
R’000
2007
R’000
Revenue 159,761 179,656 200,154
Cost of Sales 26,789 41,684 27,337
Operating expenditure
75,102 91,312 97,544
Surplus for the year
45,314 73,942 94,280
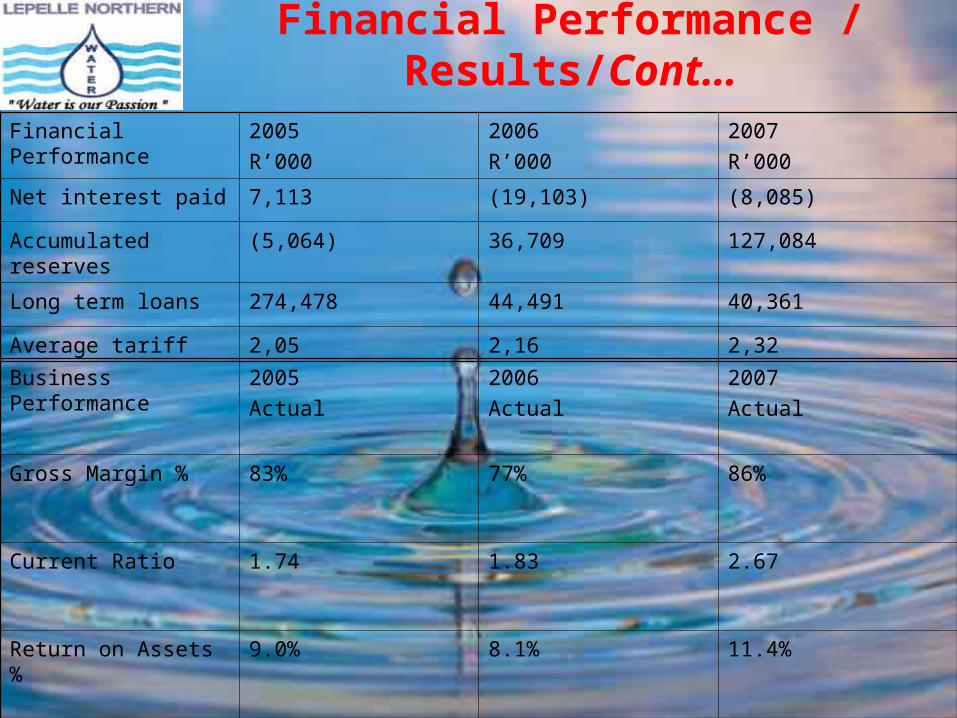
Financial Performance / Results/Cont…
Financial Performance 2005
R’000
2006
R’000
2007
R’000
Net interest paid 7,113 (19,103) (8,085)
Accumulated reserves (5,064) 36,709 127,084
Long term loans 274,478 44,491 40,361
Average tariff 2,05 2,16 2,32
Business Performance 2005
Actual
2006
Actual
2007
Actual
Gross Margin % 83% 77% 86%
Current Ratio 1.74 1.83 2.67
Return on Assets % 9.0% 8.1% 11.4%
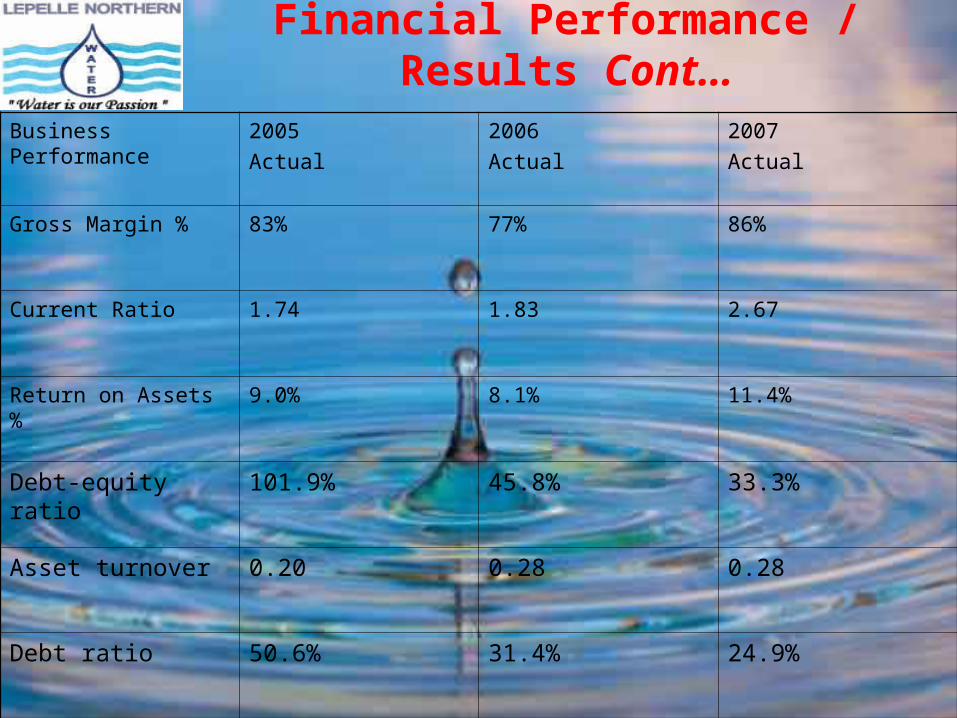
Financial Performance / Results Cont…
Business Performance 2005
Actual
2006
Actual
2007
Actual
Gross Margin % 83% 77% 86%
Current Ratio 1.74 1.83 2.67
Return on Assets % 9.0% 8.1% 11.4%
Debt-equity ratio 101.9% 45.8% 33.3%
Asset turnover 0.20 0.28 0.28
Debt ratio 50.6% 31.4% 24.9%

Market Development
WATER SERVICE AUTHORITY % MARKET STATUS
Capricorn District Municipality14%
Negotiations are at an advanced stage. Conclusion by January 2007.
Polokwane Local Municipality10%
Agreement of 25 years has been entered into on 01 February 2005
Mopani District Municipality22%
Negotiations are at an advanced stage. Conclusion by March 2007.
Greater Sekukhune District Municipality 22%
Appointment has been confirmed, finalizing the term of the contract.
Vhembe District Municipality0%
Negotiations are at an advanced stage. Conclusion by January 2007.
Mokgalakwena Local Municipality 6% Agreement of 30 years has been entered into on 01 May 2003.

Water Resource Availability Source June 2006 June 2007
Ebenezer 65% 53%
Tzaneen 67% 49%
Magoebaskloof 100% 100%
Blyderivierpoort 100% 97%
Loskop 100% 76%
Flag Boshielo 131% 76%
Doorndraai 81% 53%
Water Sources Sufficiency
•Below average rainfall in the reporting period than previous
•No major interruptions in water production and supply
•Negative impact due to high temperatures and below average rainfall
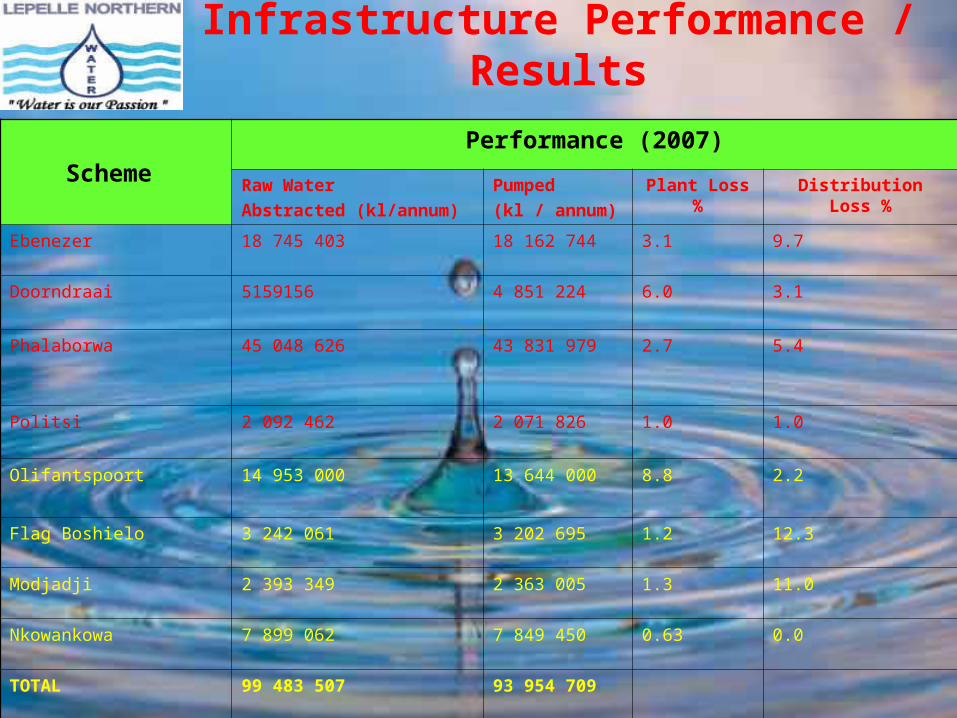
Service Delivery and Infrastructure Performance / Results
Scheme Performance (2007)
Raw Water
Abstracted (kl/annum)
Pumped
(kl / annum)
Plant Loss% Distribution Loss %
Ebenezer 18 745 403 18 162 744 3.1 9.7
Doorndraai 5159156 4 851 224 6.0 3.1
Phalaborwa 45 048 626 43 831 979 2.7 5.4
Politsi 2 092 462 2 071 826 1.0 1.0
Olifantspoort 14 953 000 13 644 000 8.8 2.2
Flag Boshielo 3 242 061 3 202 695 1.2 12.3
Modjadji 2 393 349 2 363 005 1.3 11.0
Nkowankowa 7 899 062 7 849 450 0.63 0.0
TOTAL 99 483 507 93 954 709
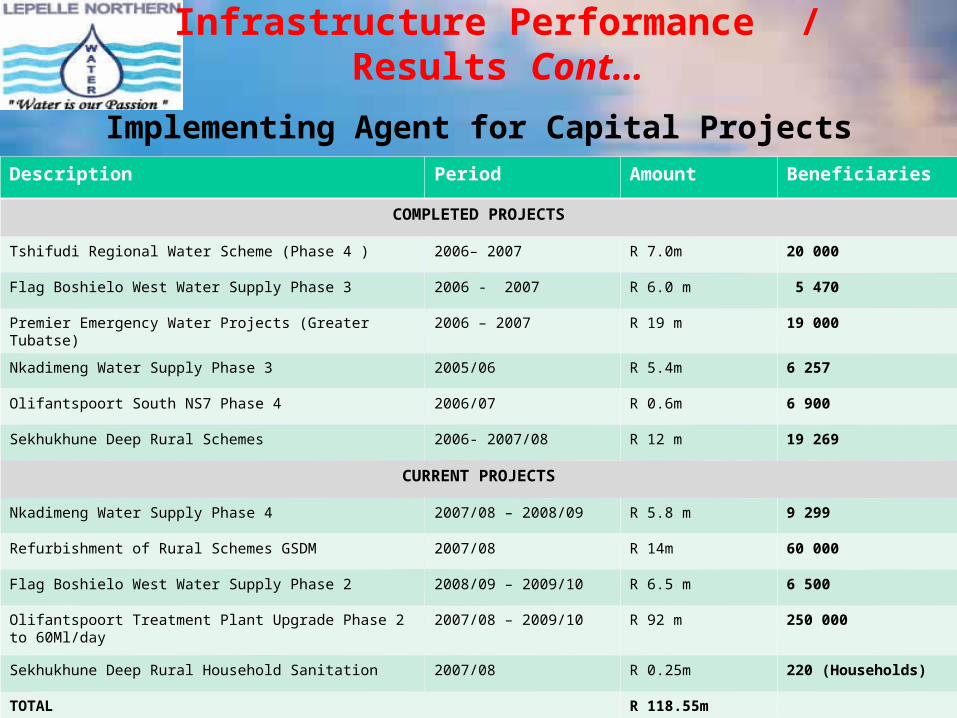
Service Delivery and Infrastructure Performance / Results Cont…
Description Period Amount Beneficiaries
COMPLETED PROJECTS
Tshifudi Regional Water Scheme (Phase 4 ) 2006– 2007 R 7.0m 20 000
Flag Boshielo West Water Supply Phase 3 2006 - 2007 R 6.0 m 5 470
Premier Emergency Water Projects (Greater Tubatse) 2006 – 2007 R 19 m 19 000
Nkadimeng Water Supply Phase 3 2005/06 R 5.4m 6 257
Olifantspoort South NS7 Phase 4 2006/07 R 0.6m 6 900
Sekhukhune Deep Rural Schemes 2006- 2007/08 R 12 m 19 269
CURRENT PROJECTS
Nkadimeng Water Supply Phase 4 2007/08 – 2008/09 R 5.8 m 9 299
Refurbishment of Rural Schemes GSDM 2007/08 R 14m 60 000
Flag Boshielo West Water Supply Phase 2 2008/09 – 2009/10 R 6.5 m 6 500
Olifantspoort Treatment Plant Upgrade Phase 2 to 60Ml/day 2007/08 – 2009/10 R 92 m 250 000
Sekhukhune Deep Rural Household Sanitation 2007/08 R 0.25m 220 (Households)
TOTAL R 118.55m
Implementing Agent for Capital Projects
Support to Municipalities
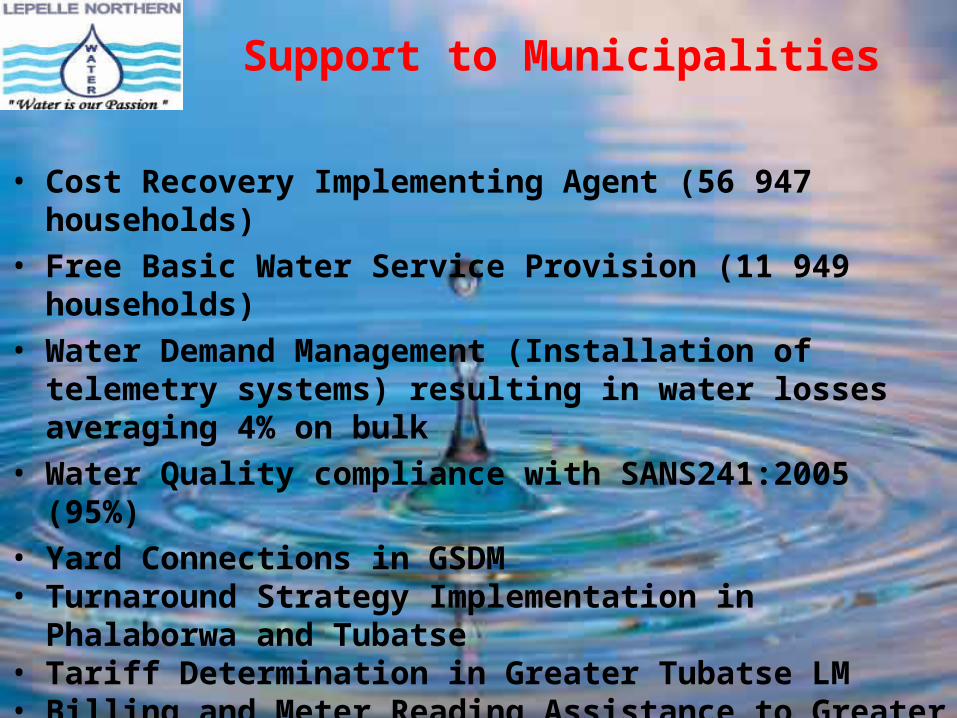
• Cost Recovery Implementing Agent (56 947 households)• Free Basic Water Service Provision (11 949 households)• Water Demand Management (Installation of telemetry
systems) resulting in water losses averaging 4% on bulk• Water Quality compliance with SANS241:2005 (95%) • Yard Connections in GSDM• Turnaround Strategy Implementation in Phalaborwa and
Tubatse• Tariff Determination in Greater Tubatse LM• Billing and Meter Reading Assistance to Greater Tubatse
LM• Recommissioning of underground water supply in Lepelle
Nkumpi Municipality

Service Delivery and Infrastructure Performance / Results
Scheme Available / Installed Capacity (2007)
Raw Water Purification Pumping Distribution Storage
Ebenezer 73 Ml/d 56 Ml/d 72 Ml/d 55 Ml/d 40 Ml
Doorndraai 38 Ml/d 14 Ml/d 16 Ml/d 16 Ml/d 25 Ml
Phalaborwa 201 Ml/d 76 Ml/d (pot)
72 Ml/d (Ind)
136 Ml/d (Pot)
163 Ml/d (Ind)
136 Ml/d (Pot)
163 Ml/d(Ind)
88.6 Ml (pot)
115 Ml (ind)
Politsi 6.5 Ml/d 6.1 Ml/d 6.5 Ml/d 6 Ml/d 14.4 Ml
Olifantspoort 44 Ml/d 45 Ml/d 118 Ml/d 113 Ml/d 85 Ml
Flag Boshielo 32 Ml/d 8.3 Ml/d 8 Ml/d 17 Ml/d 24 Ml
Modjadji 10 Ml/d 7 Ml/d 4.4 Ml/d 17.7 Ml/d 7.23 Ml
Nkowankowa 30Ml/d 26Ml/d 25Ml/d 25 Ml/d 54.3 Ml
TOTAL 434.5 Ml/d 310.4Ml/d 548.9Ml/d 548.7Ml/d 453.5 Ml/d
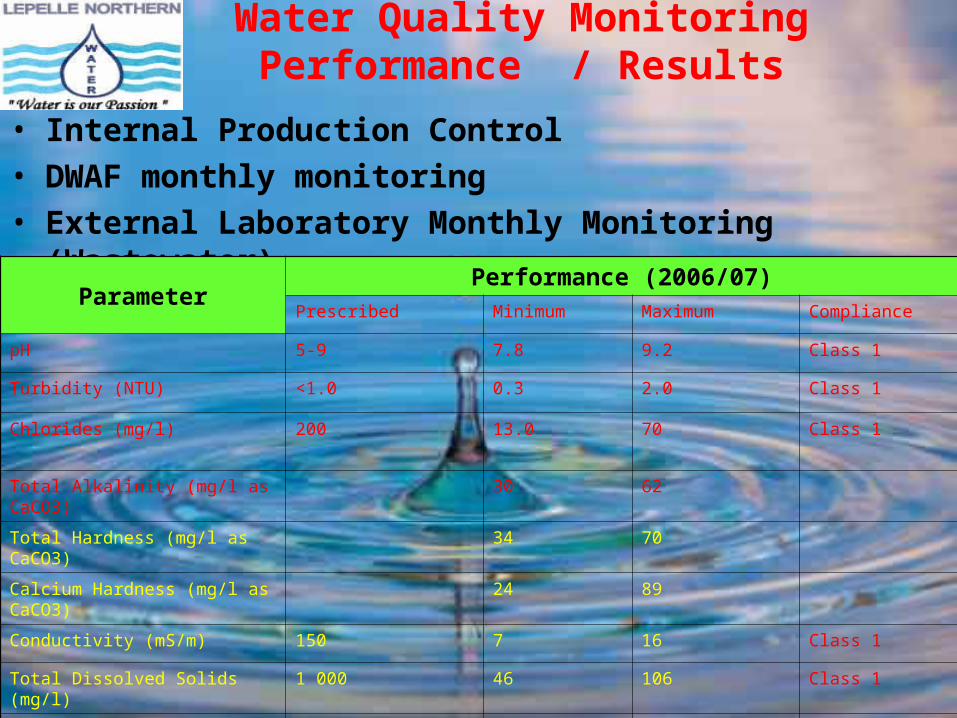
Water Quality Monitoring Performance / Results
• Internal Production Control• DWAF monthly monitoring• External Laboratory Monthly Monitoring (Wastewater)
ParameterPerformance (2006/07)
Prescribed Minimum Maximum Compliance
pH 5-9 7.8 9.2 Class 1
Turbidity (NTU) <1.0 0.3 2.0 Class 1
Chlorides (mg/l) 200 13.0 70 Class 1
Total Alkalinity (mg/l as CaCO3) 30 62
Total Hardness (mg/l as CaCO3) 34 70
Calcium Hardness (mg/l as CaCO3)
24 89
Conductivity (mS/m) 150 7 16 Class 1
Total Dissolved Solids (mg/l) 1 000 46 106 Class 1
Aluminium (g/l) 300 0.08 290 Class 1
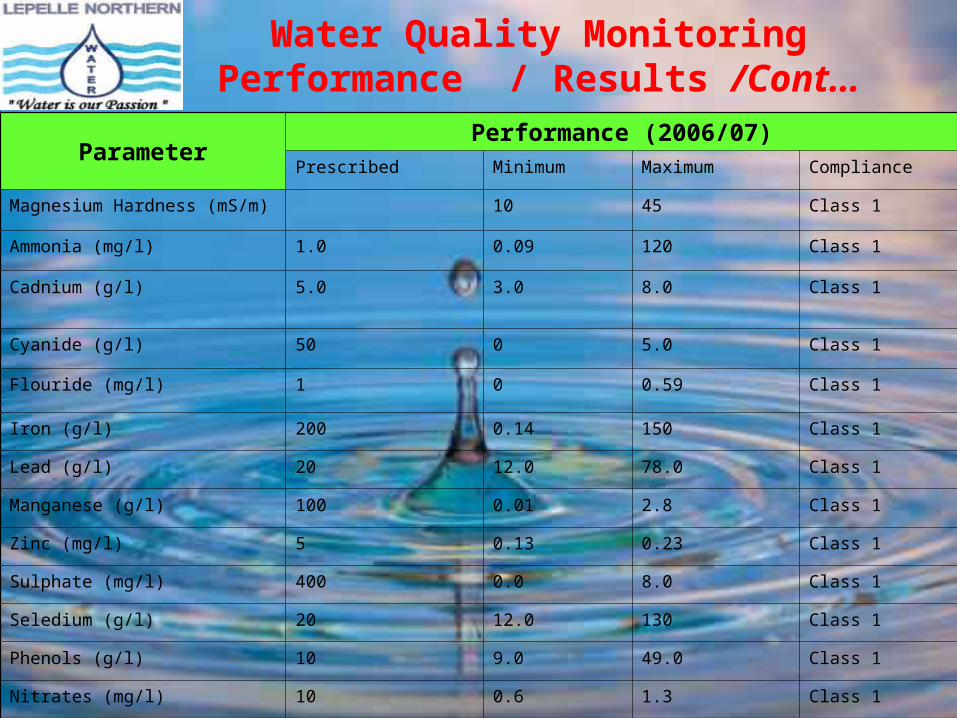
Water Quality Monitoring Performance / Results /Cont…
ParameterPerformance (2006/07)
Prescribed Minimum Maximum Compliance
Magnesium Hardness (mS/m) 10 45 Class 1
Ammonia (mg/l) 1.0 0.09 120 Class 1
Cadnium (g/l) 5.0 3.0 8.0 Class 1
Cyanide (g/l) 50 0 5.0 Class 1
Flouride (mg/l) 1 0 0.59 Class 1
Iron (g/l) 200 0.14 150 Class 1
Lead (g/l) 20 12.0 78.0 Class 1
Manganese (g/l) 100 0.01 2.8 Class 1
Zinc (mg/l) 5 0.13 0.23 Class 1
Sulphate (mg/l) 400 0.0 8.0 Class 1
Seledium (g/l) 20 12.0 130 Class 1
Phenols (g/l) 10 9.0 49.0 Class 1
Nitrates (mg/l) 10 0.6 1.3 Class 1
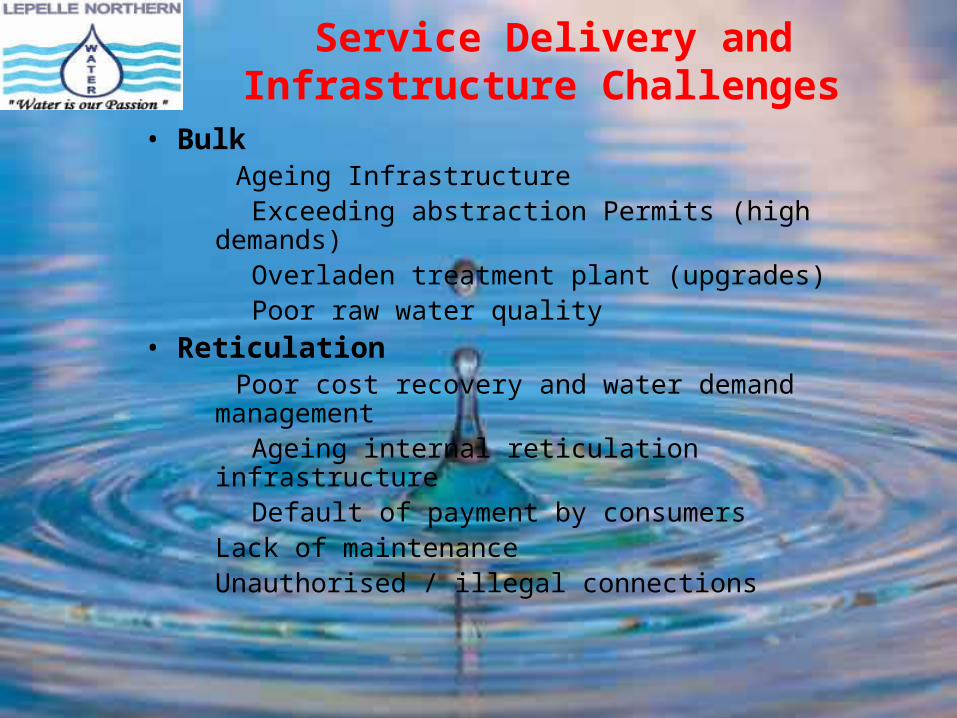
Service Delivery and Infrastructure Challenges
• Bulk Ageing Infrastructure Exceeding abstraction Permits (high demands) Overladen treatment plant (upgrades) Poor raw water quality
• Reticulation Poor cost recovery and water demand
management Ageing internal reticulation infrastructure Default of payment by consumers
Lack of maintenanceUnauthorised / illegal connections
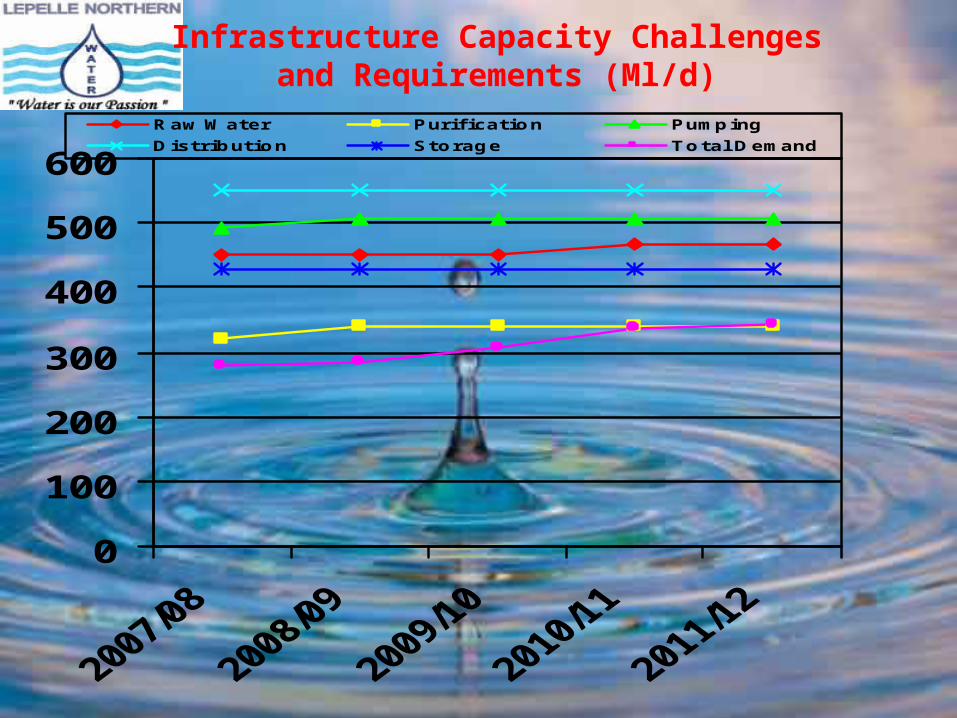
Infrastructure Capacity Challenges and Requirements (Ml/d)
0
100
200
300
400
500
600Raw Water Purification Pumping
Distribution Storage Total Demand
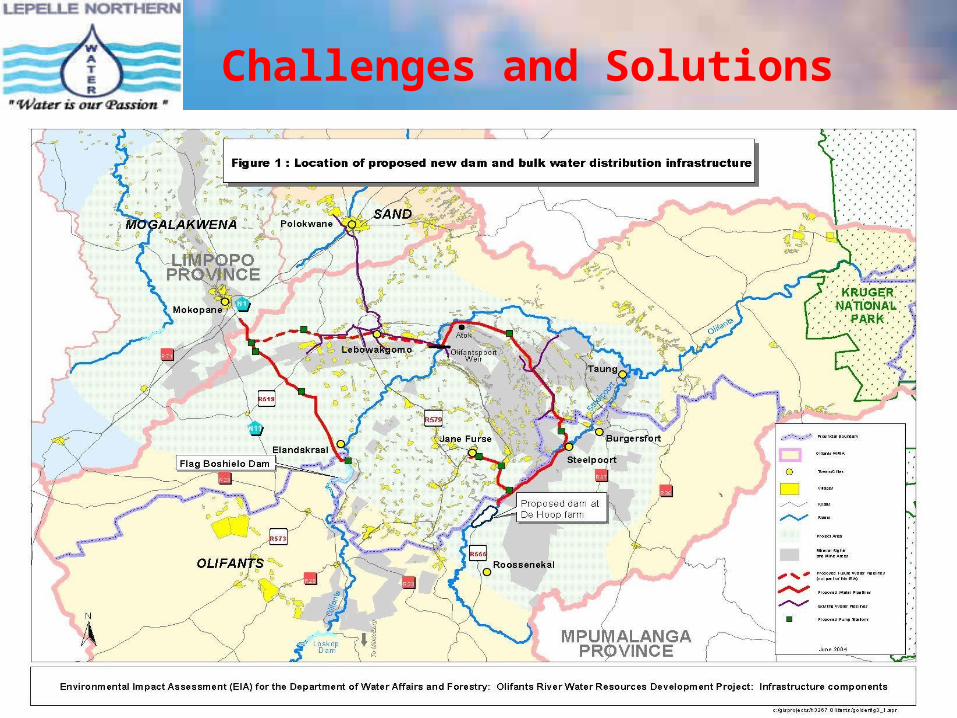
Challenges and Solutions

Infrastructure Rollout Plan
Description Funder 2007/08 2008/09 2009/10
Capital Projects 2007/08
Cathodic Protection Doorndraai and Ebenezer Pipelines LNW R 3 500 000.00 R 1 500 000.00 R 250 000.00
Cathodic Protection Olifantspoort Pipeilines LNW R 3 000 000.00 R 1 000 000.00 R 200 000.00
Bulk Pipeline Survey Phalaborwa LNW R 3 500 000.00 R 500 000.00 R 200 000.00
Olifantspoort Upgrade to 60 Ml/d Phase 2 DWAF/Anglo R 85 000 000.00 R 70 000 000.00 R 7 750 000.00
Supply and Installation of Generators at plants LNW R 4 500 000.00 R 5 000 000.00 R 0.00
Supply and Installation of Sewerage Package Plant at Politsi LNW R 1 500 000.00 R 75 000.00 R 0.00
Phalaborwa Refurbishment and Capital Projects LNW R 32 937 075.00 R 1 937 475.00 R 0.00
Greater Tubatse LM Refurbishment and Capital Projects LNW R 6 517 630.00 R 383 390.00 R0.00
Implementation of GSDM Rural Water and Sanitation Project Flanders/DWAF R 250 000.00 R 625 000.00 R 0.00
Refurbishment of GSDM Water and Sanitation Schemes LNW R 4 000 000.00 R 5 000 000.00 R 5 000 000.00
Upgrading of the Filters at Ebenezer Treatment Plant LNW R 3 500 000.00 R 175 000.00 R 0.00
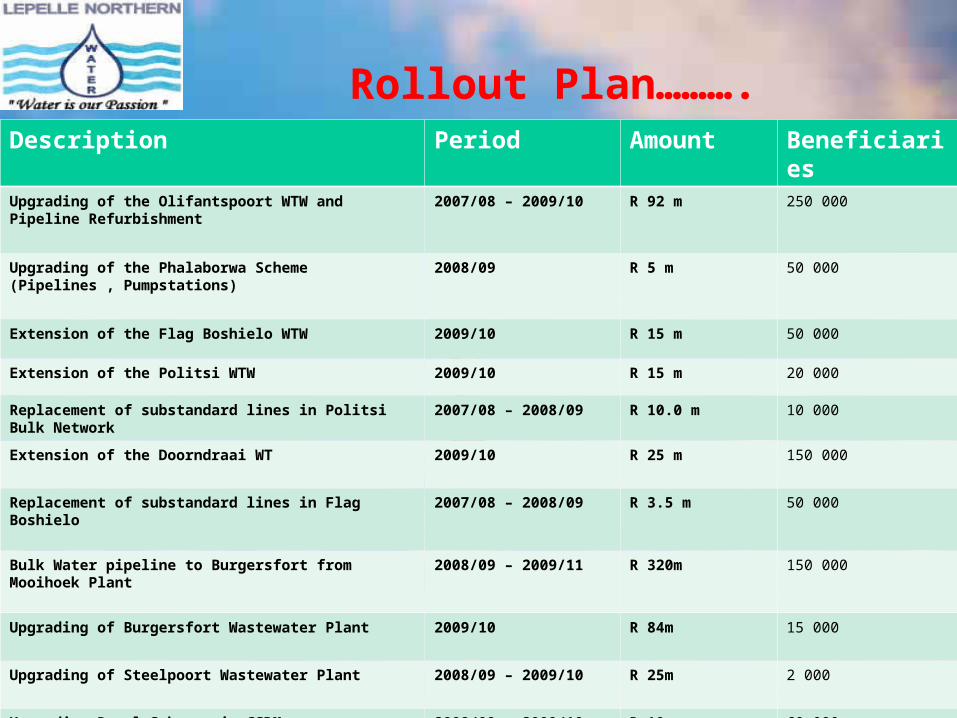
Description Period Amount BeneficiariesUpgrading of the Olifantspoort WTW and Pipeline Refurbishment
2007/08 – 2009/10 R 92 m 250 000
Upgrading of the Phalaborwa Scheme (Pipelines , Pumpstations)
2008/09 R 5 m 50 000
Extension of the Flag Boshielo WTW 2009/10 R 15 m 50 000
Extension of the Politsi WTW 2009/10 R 15 m 20 000
Replacement of substandard lines in Politsi Bulk Network 2007/08 – 2008/09 R 10.0 m 10 000
Extension of the Doorndraai WT 2009/10 R 25 m 150 000
Replacement of substandard lines in Flag Boshielo 2007/08 – 2008/09 R 3.5 m 50 000
Bulk Water pipeline to Burgersfort from Mooihoek Plant 2008/09 – 2009/11 R 320m 150 000
Upgrading of Burgersfort Wastewater Plant 2009/10 R 84m 15 000
Upgrading of Steelpoort Wastewater Plant 2008/09 – 2009/10 R 25m 2 000
Upgrading Rural Schemes in GSDM 2008/09 – 2009/10 R 10 m 60 000
TOTAL R 512.5m
Rollout Plan……….
Roll out Plan…………..
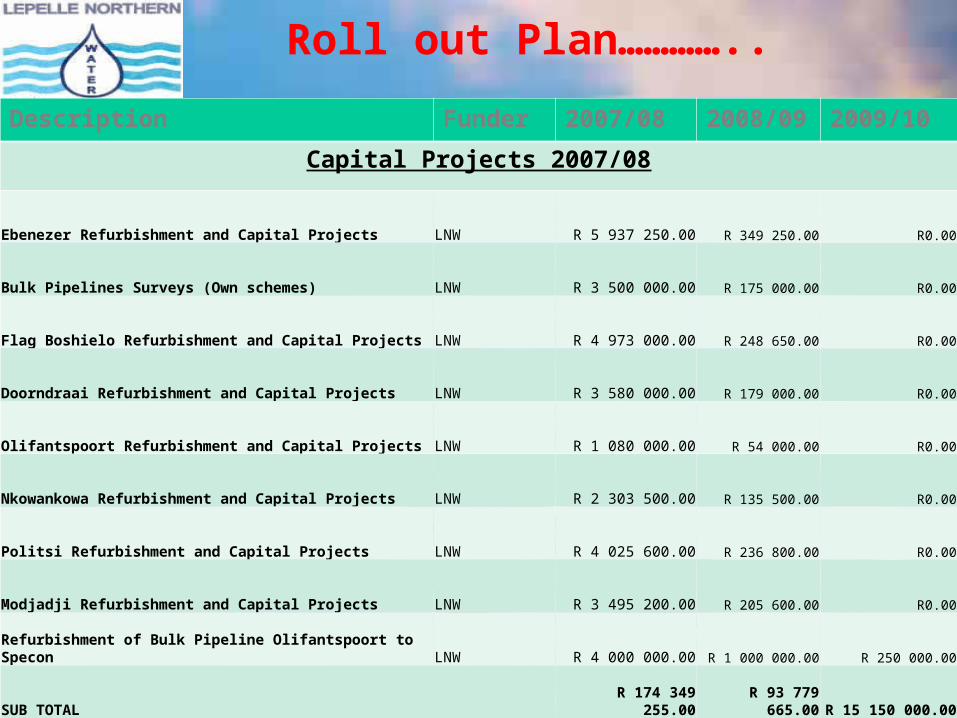
Description Funder 2007/08 2008/09 2009/10
Capital Projects 2007/08
Ebenezer Refurbishment and Capital Projects LNW R 5 937 250.00 R 349 250.00 R0.00
Bulk Pipelines Surveys (Own schemes) LNW R 3 500 000.00 R 175 000.00 R0.00
Flag Boshielo Refurbishment and Capital Projects LNW R 4 973 000.00 R 248 650.00 R0.00
Doorndraai Refurbishment and Capital Projects LNW R 3 580 000.00 R 179 000.00 R0.00
Olifantspoort Refurbishment and Capital Projects LNW R 1 080 000.00 R 54 000.00 R0.00
Nkowankowa Refurbishment and Capital Projects LNW R 2 303 500.00 R 135 500.00 R0.00
Politsi Refurbishment and Capital Projects LNW R 4 025 600.00 R 236 800.00 R0.00
Modjadji Refurbishment and Capital Projects LNW R 3 495 200.00 R 205 600.00 R0.00
Refurbishment of Bulk Pipeline Olifantspoort to Specon LNW R 4 000 000.00 R 1 000 000.00 R 250 000.00
SUB TOTAL R 174 349 255.00 R 93 779 665.00 R 15 150 000.00
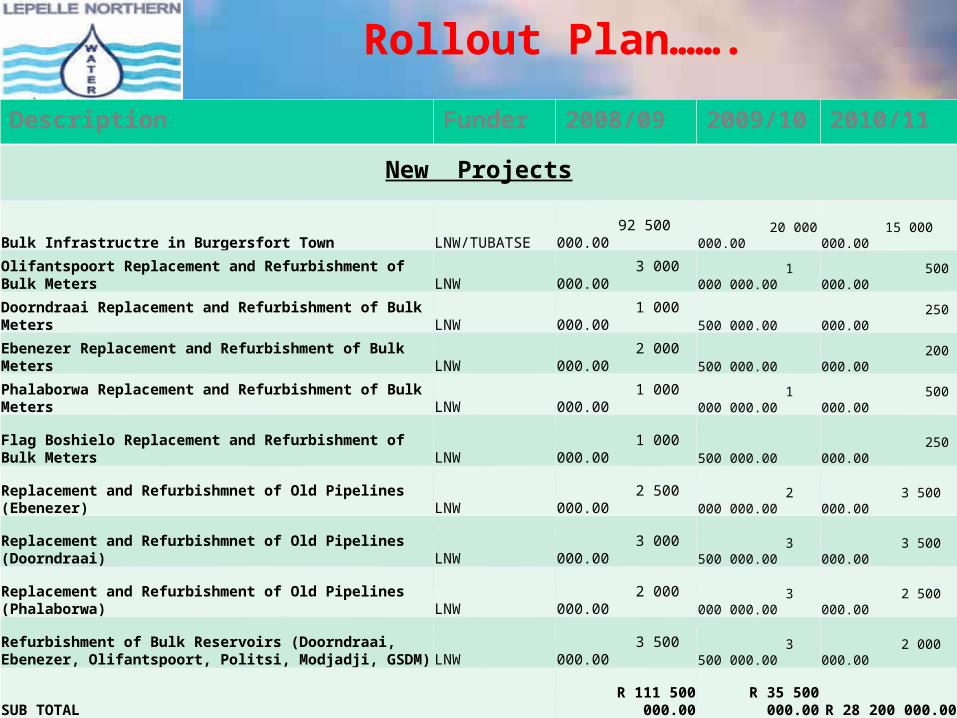
Rollout Plan…….
Description Funder 2008/09 2009/10 2010/11
New Projects
Bulk Infrastructre in Burgersfort Town LNW/TUBATSE 92 500 000.00 20 000 000.00 15 000 000.00
Olifantspoort Replacement and Refurbishment of Bulk Meters LNW 3 000 000.00 1 000 000.00 500 000.00
Doorndraai Replacement and Refurbishment of Bulk Meters LNW 1 000 000.00 500 000.00 250 000.00
Ebenezer Replacement and Refurbishment of Bulk Meters LNW 2 000 000.00 500 000.00 200 000.00
Phalaborwa Replacement and Refurbishment of Bulk Meters LNW 1 000 000.00 1 000 000.00 500 000.00
Flag Boshielo Replacement and Refurbishment of Bulk Meters LNW 1 000 000.00 500 000.00 250 000.00
Replacement and Refurbishmnet of Old Pipelines (Ebenezer) LNW 2 500 000.00 2 000 000.00 3 500 000.00
Replacement and Refurbishmnet of Old Pipelines (Doorndraai) LNW 3 000 000.00 3 500 000.00 3 500 000.00
Replacement and Refurbishment of Old Pipelines (Phalaborwa) LNW 2 000 000.00 3 000 000.00 2 500 000.00
Refurbishment of Bulk Reservoirs (Doorndraai, Ebenezer, Olifantspoort, Politsi, Modjadji, GSDM) LNW 3 500 000.00 3 500 000.00 2 000 000.00
SUB TOTAL R 111 500 000.00 R 35 500 000.00 R 28 200 000.00
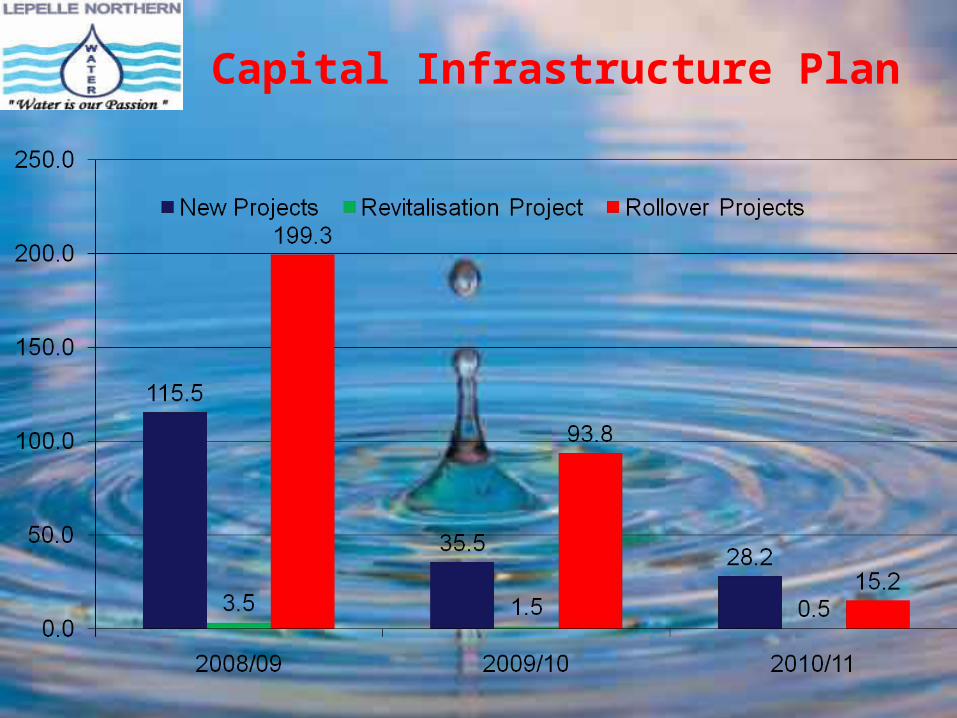
Capital Infrastructure Plan
Challenges
• Outstanding WSLAs• Debtors outstanding• Drinking Water quality (Source compliant and what comes out of
the tap should be compliant as well)• Ageing Infrastructure • Protracted Section 78 processes• Water license • Increased demand for water• Retention of technical capacity
Wayforward
- Improve governance
- Rehabilitation and maintenance of infrastructure (effective asset management)
- Support municipalities with regard to their cost recovery strategies
- Capacity building, retention and succession planning
- Finalise outstanding Water Service Level Agreements with WSAs
- Intensify technical support to municipalities
THANK YOU


