Presentation to the Commission on Fiscal Stability & Economic Growth Lori Pelletier, President, Connecticut AFL-CIO Don Williams, Executive Director, CEA Sal Luciano, Executive Director, AFSCME Council 4 Dan Livingston, Chief Negotiator, SEBAC
Transcript
Presentation to the Commission on Fiscal
Stability & Economic Growth
Lori Pelletier, President, Connecticut AFL-CIO
Don Williams, Executive Director, CEA
Sal Luciano, Executive Director, AFSCME Council 4
Dan Livingston, Chief Negotiator, SEBAC
The Commission’s Mission To recommend a path to fiscal stability that works for businesses AND families.
Connecticut must compete on the High Road to economic development.
• Living wages
• Livable Communities
• Good education and high quality services
• Public infrastructure
• A place where good businesses want to come and stay, and families can grow and thrive
Connecticut Must Reform and
Stabilize its Revenue Stream
• A stable revenue stream is vital to the
delivery of important public services.
• Our tax system was designed in the
last century, and in an entirely different
economic world.
• Revenues have declined even as the
state economy has improved.
Connecticut is at a Crossroads
Similar to 1991
• In 1991, Connecticut’s tax system was
broken and unreliable.
• Connecticut needed broad-based tax
reform.
• The governor and the business
community helped lead the successful
fight to enact tax reform.
Bring Connecticut’s Revenue
System Into the 21st Century In order to reliably fund our schools and other critical services, we must:
• Reform the sales tax and income tax to capture Internet sales and close loopholes.
• Eliminate unnecessary tax credits and expenditures, and make remaining credits transparent.
• Capture savings through economies of scale, such as integrating municipal employees into the state health insurance system.
Rights of Working Men and Women
• The freedom to negotiate for wages, benefits, and working conditions helped create the middle class in America.
• These rights and freedoms contribute to economic growth and security, and are needed more than ever in an era of great economic inequality.
Transition to Lori
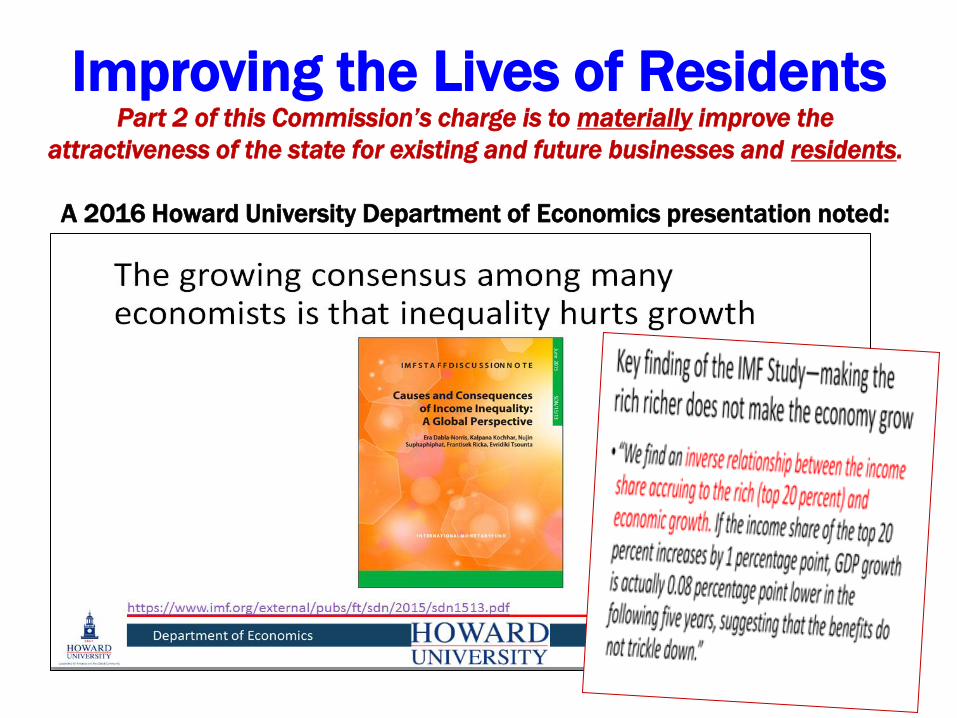
Part 2 of this Commission’s charge is to materially improve the
attractiveness of the state for existing and future businesses and residents.
A 2016 Howard University Department of Economics presentation noted:
Improving the Lives of Residents
OECD: Reducing Inequality Helps Growth
“It follows that policies to reduce income
inequalities should not only be pursued to
improve social outcomes but also to
sustain long-term growth.”
An econometric analysis of 30 years of data from OECD countries suggests that income inequality has a negative and statistically significant impact on subsequent growth.
What matters most is the gap between low income households and the rest of the population.
Cingano, F. (2014), "Trends in Income Inequality and its Impact on Economic Growth", OECD Social, Employment and
Migration Working Papers, No. 163, OECD Publishing, Paris.
http://dx.doi.org/10.1787/5jxrjncwxv6j-en
“Increased income disparities depress skills
development among individuals with poorer
parental education background, both in terms of
the quantity of education attained (e.g. years of
schooling) and in terms of its quality (i.e. skill proficiency).”
Workers who join together to collectively bargain for wages, hours and working
conditions make more money on average, thereby paying more in taxes1, utilize
fewer safety net services, and have less turnover than nonunion workers.
1 The Relationship between Union Membership and Net Fiscal Impact Sojourner-Pacas 2018
FACT – So-called “Right to Work” lowers the quality of life for women and working families. Right to
Work states spend less on public education and other public services, have a higher proportion of
low-wage workers and have greater wage gaps between men and women, all of which put
tremendous pressure on the social safety net and put families at risk.
2. Connecticut’s economy, based on a loss of $5,584/member, could suffer over $1 billion loss to our economy. (264,000 union members)
2
“Right to Work”
Equals
$1 BILLION
negative impact
to Connecticut’s
Economy
MYTH: Making Connecticut “Right to Work”
will improve our economy
Reduce Inequality to Spur Growth
• Raise the minimum wage to $15/hour
• Close the gender pay gap with
meaningful enforcements
• Establish a low-wage employer fee to
fine employers who enroll their
employees in Husky and SNAP
• End worker misclassification
Inside Game?
Previous presenters are so confident that this
Commission will cut and paste their
recommendations that they’ve already
publicly endorsed them in advance of the
report due March 1.
You have the opportunity to be better and
more deliberative than that.
• Disinvestment undermines Connecticut’s:
Transition to Sal • Economic advantages
• Opportunities for future growth
• High quality of life
• Attractiveness to business
Myths Presented Thus Far
Much of what has been presented to this
Commission in previous presentations
has not been accurate.
Let’s clarify the record.
MYTH - Collective bargaining has created the
SERS unfunded liability and should be
eliminated for pensions & healthcare.
FACT - It was through the collective bargaining
process that the state finally began
contributing to SERS and through which state
employees have negotiated concessions
savings the state and SERS tens of billions of
dollars.
MYTH - Collective bargaining is an
impediment to regionalization
FACT - Management has the right to
determine if municipal functions will be
shared or regionalized. Employees have the
right to bargain the impact of those decisions.
Home rule is an impediment to
regionalization.
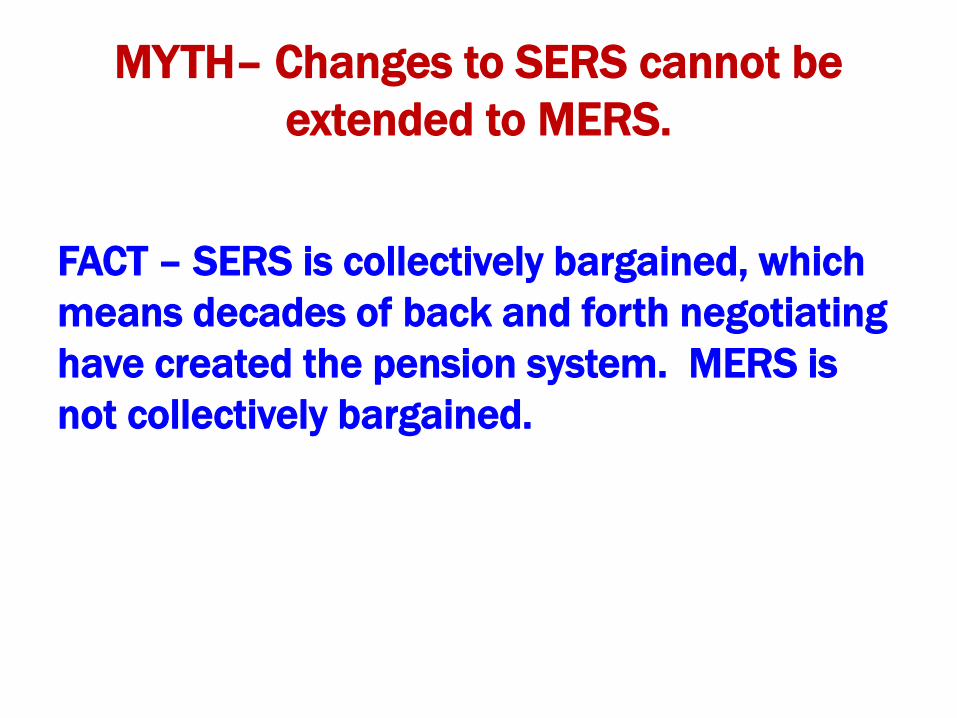
MYTH– Changes to SERS cannot be
extended to MERS.
FACT – SERS is collectively bargained, which
means decades of back and forth negotiating
have created the pension system. MERS is
not collectively bargained.
MYTH – Municipal advocates want to
establish coalition bargaining.
FACT – Municipal coalition bargaining, where
multiple bargaining units in multiple cities
and towns would negotiate common subjects
together, has been proposed many times by
Labor advocates. All such proposals were
opposed by municipal advocates.
MYTH – State oversight is the solution
for distressed municipalities.
FACT – Not only is state oversight an
undemocratic process, but it does not address
the factors that created the financial distress,
i.e. fiscal mismanagement by municipal
officials.
Waterbury was not saved by state oversight.
MYTH – Binding arbitration is unfair to
municipalities.
FACT – Binding arbitration is the process by which public employers and employees settle disputes that they haven’t been able to negotiate or mediate.
- Only about 10% of contracts go to binding arbitration and management wins 59% of those arbitrations. Binding arbitration does not drive up labor costs.
- Prior to binding arbitration, public employees had the right to strike, which is destabilizing to public service delivery.
MYTH – The binding arbitration statute
should be changed to allow a single
neutral arbitrator by mutual agreement.
FACT – This change was made in the October
2017 bipartisan budget.
MYTH – Prevailing wage
needs to be raised.
FACT – This change was made in the October
2017 bipartisan budget. The prevailing wage
threshold was increased from $400,000 to
$1,000,000 for new construction projects.
MYTH– The State Partnership Plan
is too expensive.
FACT – Most municipalities have not even
provided the necessary data to the
Comptroller to determine what their savings
might be. In most cases, the State
Partnership Plan provides better coverage for
less money.
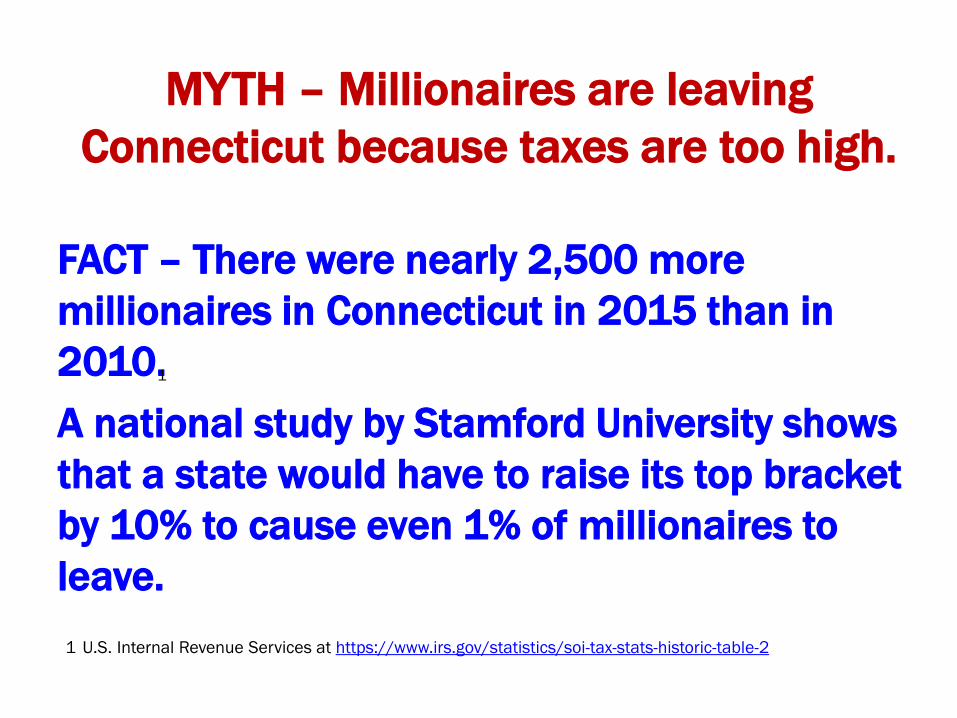
MYTH – Millionaires are leaving
Connecticut because taxes are too high.
FACT – There were nearly 2,500 more
millionaires in Connecticut in 2015 than in
2010.
A national study by Stamford University shows
that a state would have to raise its top bracket
by 10% to cause even 1% of millionaires to
leave.
1 U.S. Internal Revenue Services at https://www.irs.gov/statistics/soi-tax-stats-historic-table-2
• The state must honor its commitment to teachers. Their retirement benefit levels are reasonable and similar to that of other states.
• Teachers have paid more than their fair share into their retirement fund.
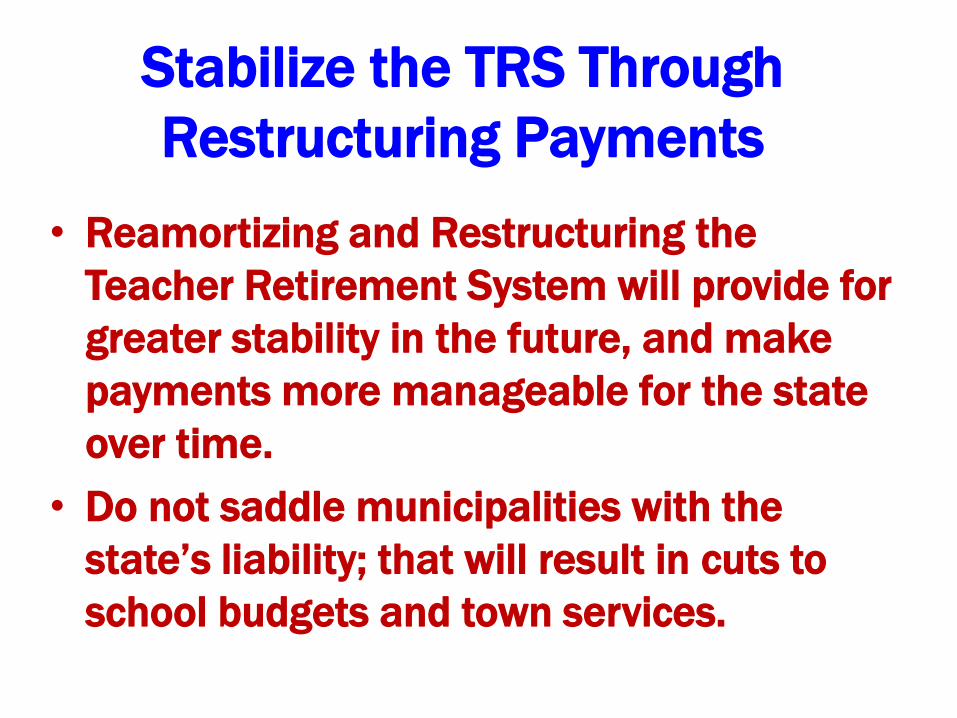
Stabilize the TRS Through
Restructuring Payments
• Reamortizing and Restructuring the
Teacher Retirement System will provide for
greater stability in the future, and make
payments more manageable for the state
over time.
• Do not saddle municipalities with the
state’s liability; that will result in cuts to
school budgets and town services.
Transition to Sal
SEBAC 2017
SEBAC 2017 –
Savings that are Fair, Effective,
And Long Term
Savings that are Fair, Effective,
and Long-Term
ng Term
State Employee Pensions
SERS’ current benefits are moderate and well funded.
The unfunded liability is a problem created by the General Assembly and prior governors and has been resolved by an affordable payment plan created by collective bargaining.
State Employee Pensions
The unfunded liability is isolated to the
Tier I pension plan that closed in 1984.
It is being resolved by an affordable
payment plan and lower-benefit pension
tiers, created by collective bargaining.
State Employee Pensions SERS recognizes workers as an asset.
• SEBAC has bargained for low turnover, high longevity and productivity.
• By negotiating a pension plan that encourages long service, we reduce recruitment and training costs, and improve service.
• By keeping workers healthier, we save healthcare costs, and improve productivity and services.
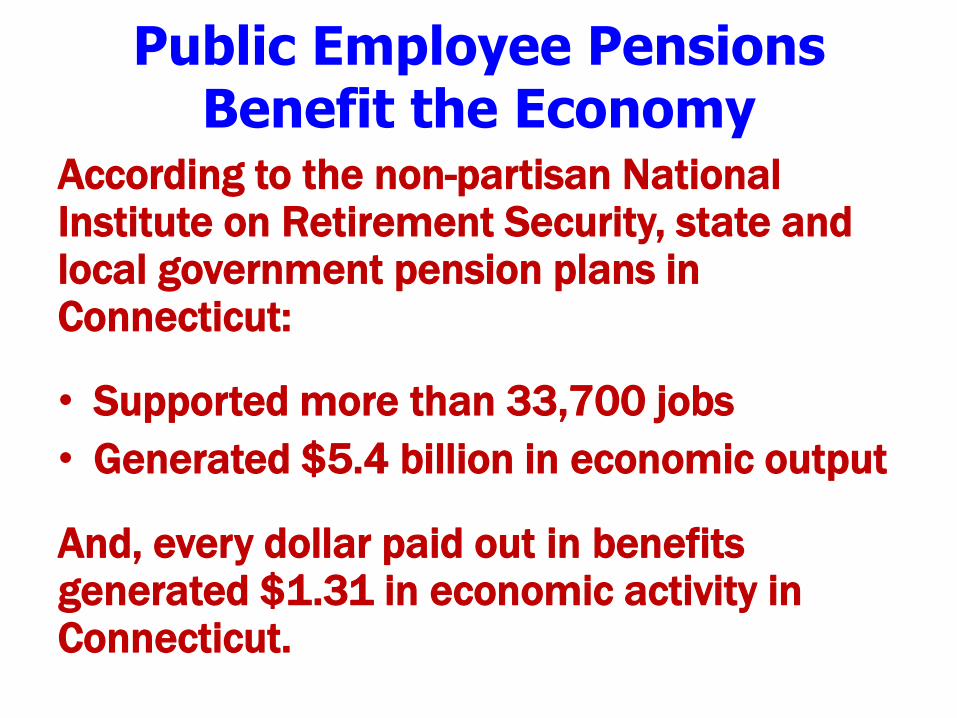
Public Employee Pensions Benefit the Economy
According to the non-partisan National Institute on Retirement Security, state and local government pension plans in Connecticut:
• Supported more than 33,700 jobs
• Generated $5.4 billion in economic output
And, every dollar paid out in benefits generated $1.31 in economic activity in Connecticut.
Municipal
Solutions for Economic Growth • Mandate regional government to end
duplicative, inefficient municipal government taxpayers can no longer afford. Explore annexation and/or county government.
• Require municipalities that receive state aid to access the state Healthcare Partnership Plan
• Establish a Municipal Employee Bargaining Agent Coalition (MEBAC) and empower it to bargain municipal employee pensions and healthcare.
Transition to Danny
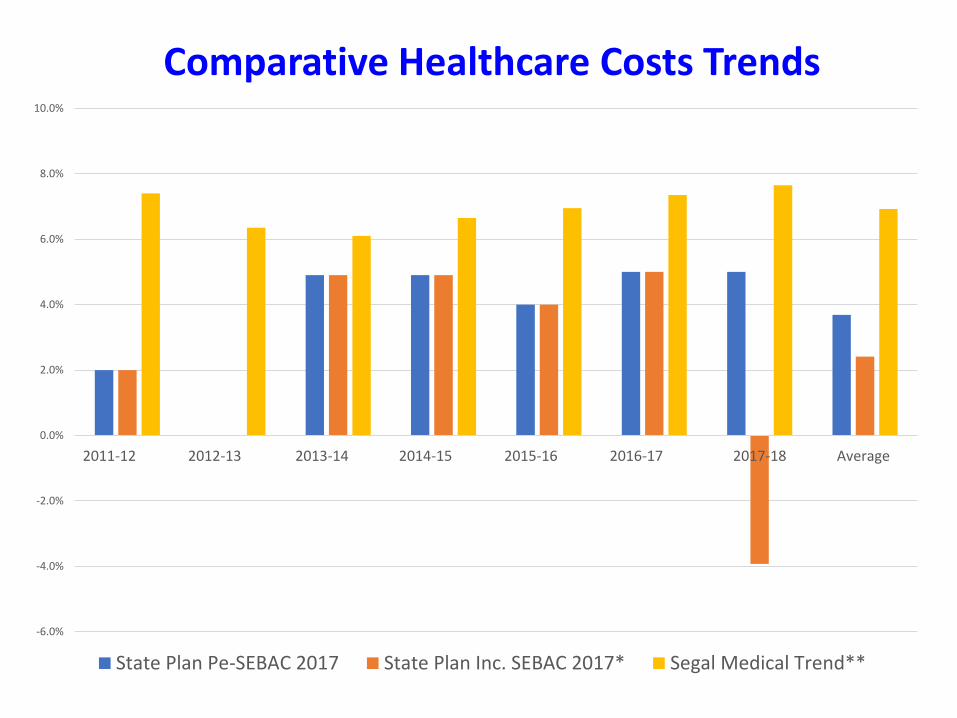
-6.0%
-4.0%
-2.0%
0.0%
2.0%
4.0%
6.0%
8.0%
10.0%
2011-12 2012-13 2013-14 2014-15 2015-16 2016-17 2017-18 Average
Comparative Healthcare Costs Trends
State Plan Pe-SEBAC 2017 State Plan Inc. SEBAC 2017* Segal Medical Trend**
To Inform Growth Decision Making, Fiscal
Notes Should Have Complete Analyses
Instead of having the Office of Fiscal Analysis (OFA) compute direct gains and losses related to legislation, direct them to consider long-term gains and losses, lost opportunities and economic impacts. For example:
• Cut early childhood, pay more later in remedial education
• Lay off workers, lose revenue later in slowed economy, or revenue they bring in directly through their jobs
• Raising the minimum wage would cost the state, but greatly impact the economy and overall revenue collections
Transition to Lori
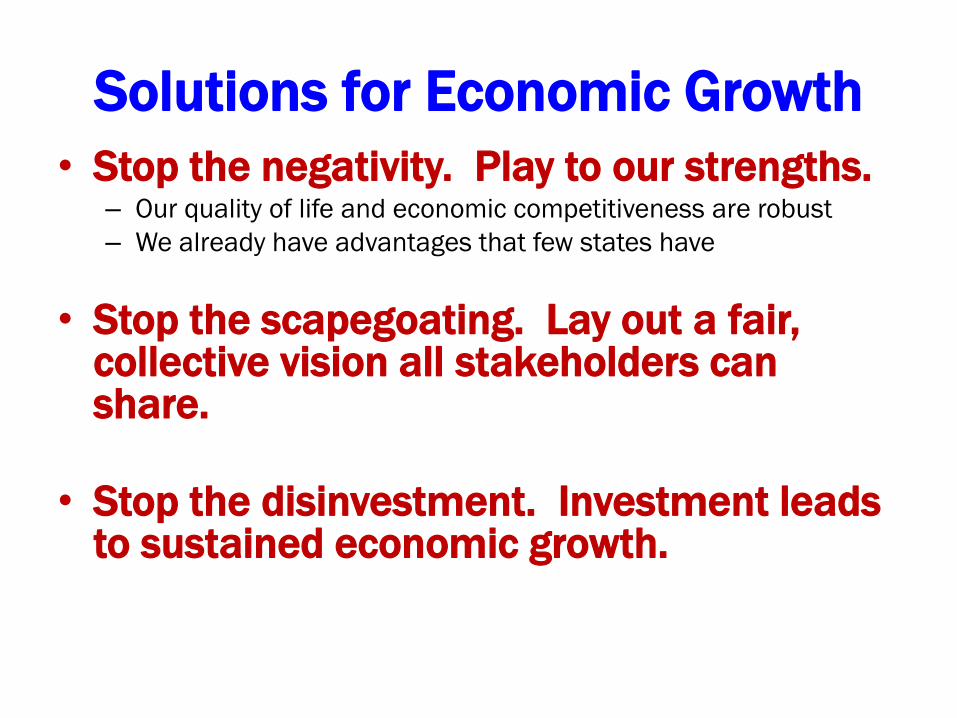
Solutions for Economic Growth
• Stop the negativity. Play to our strengths. – Our quality of life and economic competitiveness are robust
– We already have advantages that few states have
• Stop the scapegoating. Lay out a fair, collective vision all stakeholders can share.
• Stop the disinvestment. Investment leads to sustained economic growth.
Solutions to Retain Millennials
The NYS Solution
• $15/hour minimum wage
• 12 weeks paid family leave
• Free in-state public tuition
• Accessible and affordable public transportation
• Vibrant cities
• Infrastructure development
Solutions for Economic Growth
Scrutinize tax expenditures.
Businesses already get a great deal in
Connecticut.
7.5
6.4
5.3
5.1
4.6
4.1 4.1
3.4
0
1
2
3
4
5
6
7
8
Vermont Maine Rhode Island New England US New Hampshire Massachusetts Connecticut
Total Effective Business Tax Rate
FY 2014
Total Effective Business Tax Rate
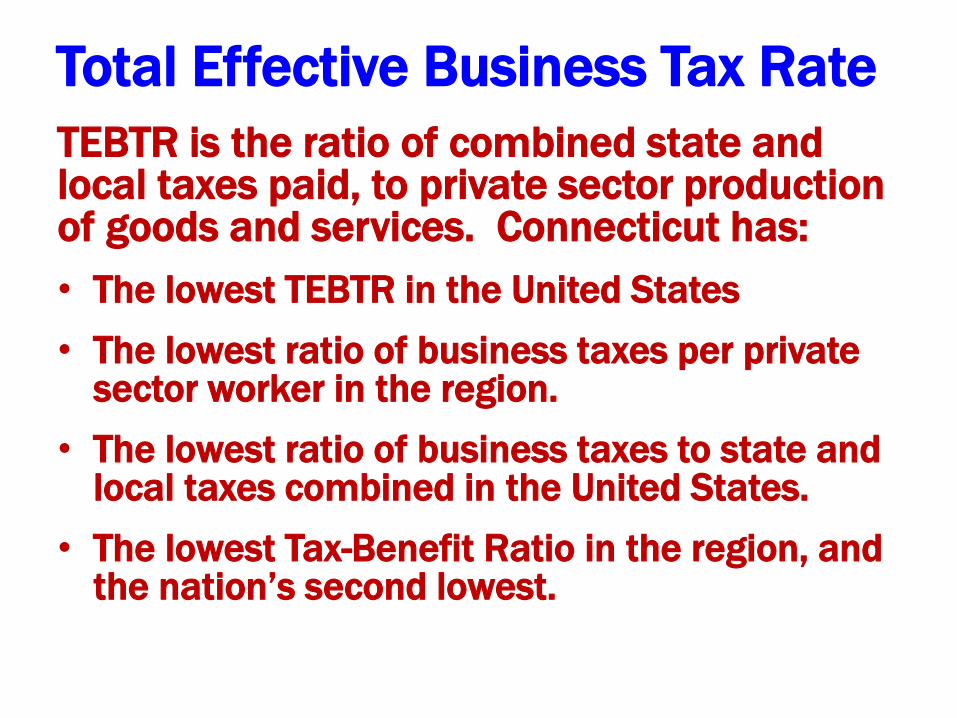
TEBTR is the ratio of combined state and local taxes paid, to private sector production of goods and services. Connecticut has:
• The lowest TEBTR in the United States
• The lowest ratio of business taxes per private sector worker in the region.
• The lowest ratio of business taxes to state and local taxes combined in the United States.
• The lowest Tax-Benefit Ratio in the region, and the nation’s second lowest.
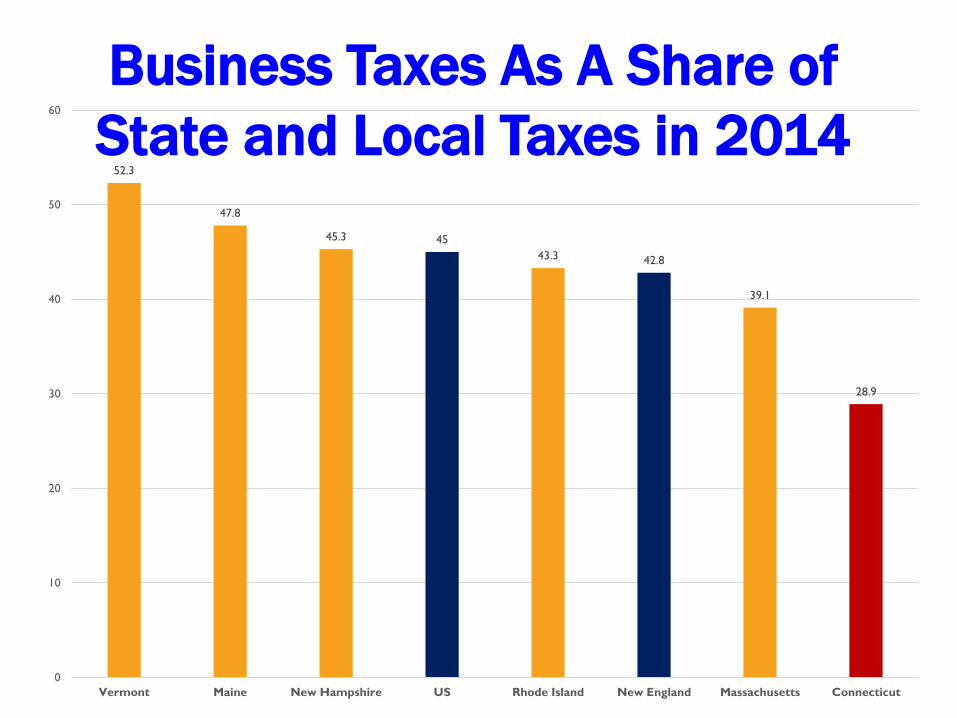
52.3
47.8
45.3 45
43.3 42.8
39.1
28.9
0
10
20
30
40
50
60
Vermont Maine New Hampshire US Rhode Island New England Massachusetts Connecticut
Business Taxes As A Share of
State and Local Taxes in 2014
Connecticut Business Does Well
In addition to favorable tax policy, businesses enjoy other competitive advantages that make Connecticut an attractive place to do business, including a highly skilled and educated workforce and a high quality of life. Connecticut has:
• The third highest rate of educational attainment at both the Bachelor’s degree and advanced degree levels.
• The fourth highest median household income (adjusted for inflation) in the United States.
Massachusetts 39.3% Oregon 29.9% South Dakota 26.3%
Colorado 37.5% Delaware 29.5% New Mexico 26.1%
Connecticut 37.1% Montana 29.4% Michigan 26.0%
Maryland 36.9% United States 29.1% Idaho 25.5%
New Jersey 36.2% Nebraska 29.0% Ohio 25.2%
Vermont 35.8% Georgia 28.2% South Carolina 25.1%
Virginia 35.5% Maine 28.0% Wyoming 24.7%
New Hampshire 34.6% Alaska 28.0% Tennessee 24.3%
New York 33.4% North Dakota 27.9% Oklahoma 23.8%
Minnesota 33.2% Pennsylvania 27.8% Indiana 23.4%
Washington 31.7% North Carolina 27.4% Alabama 23.3%
Illinois 31.6% Arizona 27.3% Nevada 22.4%
Rhode Island 31.4% Wisconsin 27.1% Louisiana 22.0%
California 30.9% Florida 26.8% Kentucky 21.8%
Utah 30.7% Texas 26.7% Arkansas 21.0%
Kansas 30.4% Missouri 26.4% Mississippi 20.7%
Hawaii 30.1% Iowa 26.3% West Virginia 18.6%
Source: American Community Survey
People 25 and Older With a Completed
Bachelor’s Degree in 2012
Massachusetts 17.1% Pennsylvania 10.9% South Carolina 9.1%
Maryland 16.9% Kansas 10.9% Texas 9.0%
Connecticut 16.6% United States 10.9% Kentucky 8.9%
Virginia 14.9% Minnesota 10.8% Alabama 8.6%
New York 14.4% Hawaii 10.5% Tennessee 8.6%
Vermont 13.9% Utah 10.4% North Dakota 8.4%
New Jersey 13.8% Georgia 10.4% Indiana 8.4%
Colorado 13.7% Arizona 10.2% Idaho 8.2%
Rhode Island 12.8% Michigan 10.0% Iowa 8.2%
New Hampshire 12.6% Maine 9.8% South Dakota 8.1%
Illinois 12.0% Nebraska 9.7% Oklahoma 7.9%
Delaware 11.4% Missouri 9.7% Wyoming 7.8%
Oregon 11.3% Florida 9.6% Mississippi 7.6%
California 11.3% North Carolina 9.3% Louisiana 7.5%
Washington 11.3% Ohio 9.3% Nevada 7.5%
New Mexico 11.2% Wisconsin 9.3% West Virginia 7.3%
Alaska 10.9% Montana 9.2% Arkansas 7.2%
Source: American Community Survey
People 25 and Older With a Completed
Advanced Degree in 2012
The High Road to Economic
Growth Doesn’t Disinvestment
Disinvestment undermines Connecticut’s:
• Economic advantages
• Opportunities for future growth
• High quality of life
• Attractiveness to business
Balanced Solutions
for Economic Growth Any legitimate and viable product of this Commission will be comprehensive in its review and recommendations regarding all sectors of our economy, including: