207
04/06/11 1 STRATEGIC COST MANAGEMENT By A Aruldoss Vithakan
| Date post: | 08-Apr-2018 |
| Category: |
Documents |
| Upload: | anshul-singh-gehlot |
| View: | 222 times |
| Download: | 0 times |
8/7/2019 Presentation3 for CSM
http://slidepdf.com/reader/full/presentation3-for-csm 1/207
04/06/11 1
STRATEGIC COST MANAGEMENT
By A Aruldoss Vithakan
8/7/2019 Presentation3 for CSM
http://slidepdf.com/reader/full/presentation3-for-csm 2/207
04/06/11 2
Strategic Management
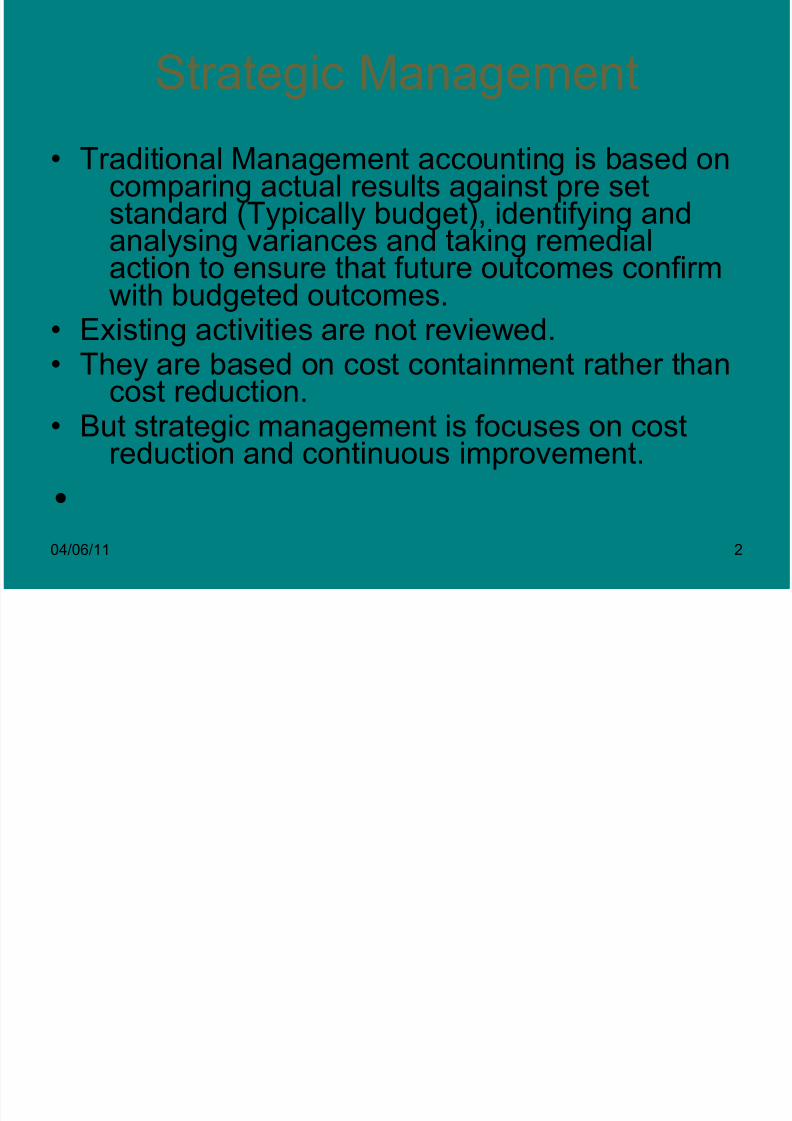
• Traditional Management accounting is based oncomparing actual results against pre setstandard (Typically budget), identifying andanalysing variances and taking remedial
action to ensure that future outcomes confirmwith budgeted outcomes.• Existing activities are not reviewed.• They are based on cost containment rather than
cost reduction.• But strategic management is focuses on cost
reduction and continuous improvement.
•

8/7/2019 Presentation3 for CSM
http://slidepdf.com/reader/full/presentation3-for-csm 3/207
04/06/11 3
Cost Management And Strategy-
An Overview• Wall Mart- The world’s largest retail Chain- hasgrown to that stage by scrupulously followingtheir mission-”We exist to provide value to thecustomer”
• They achieved such a growth by following astringy of using extensively the technologyand opportunity oriented management stylethat values change and experimentation
• It focus on friendly customer service andaggressive efforts to grow the businessglobally.

8/7/2019 Presentation3 for CSM
http://slidepdf.com/reader/full/presentation3-for-csm 4/207
04/06/11 4
Strategic Cost Management:Strategic Cost Management:Basic ConceptsBasic Concepts
Strategic decision making is choosing amongalternative strategies with the goal of selectinga strategy, or strategies, that provides acompany with reasonable assurance of long-
term growth and survival.The key to achieving this goal is to gain acompetitive advantage.Strategic cost management is the use of cost
data to develop and identify superior strategiesthat will produce a sustainable competitiveadvantage.
•

8/7/2019 Presentation3 for CSM
http://slidepdf.com/reader/full/presentation3-for-csm 5/207
04/06/11 5
General StrategiesGeneral Strategies
• There are three general strategies thathave been identified:
ücost leadership
üproduct differentiation
üfocusing
•
8/7/2019 Presentation3 for CSM
http://slidepdf.com/reader/full/presentation3-for-csm 6/207
04/06/11 6
General StrategiesGeneral Strategies
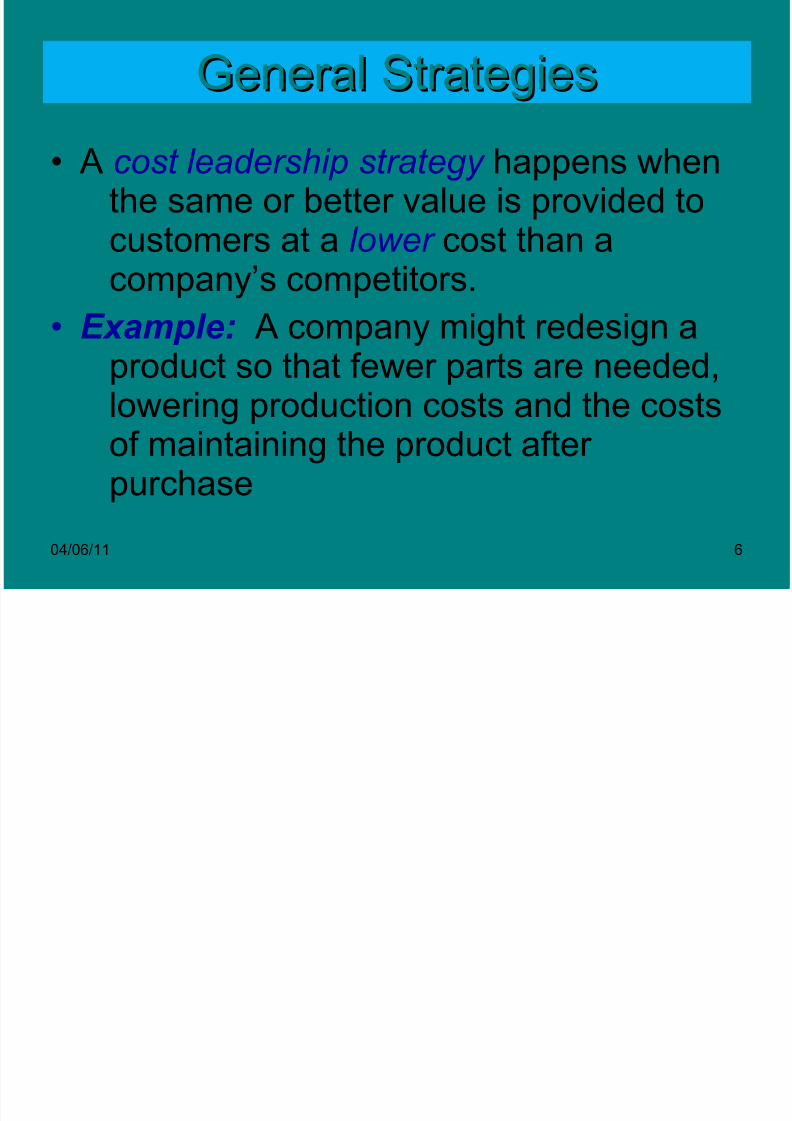
• A cost leadership strategy happens whenthe same or better value is provided tocustomers at a lower cost than a
company’s competitors.• Example: A company might redesign a
product so that fewer parts are needed,
lowering production costs and the costsof maintaining the product after purchase
8/7/2019 Presentation3 for CSM
http://slidepdf.com/reader/full/presentation3-for-csm 7/207
04/06/11 7
General StrategiesGeneral Strategies
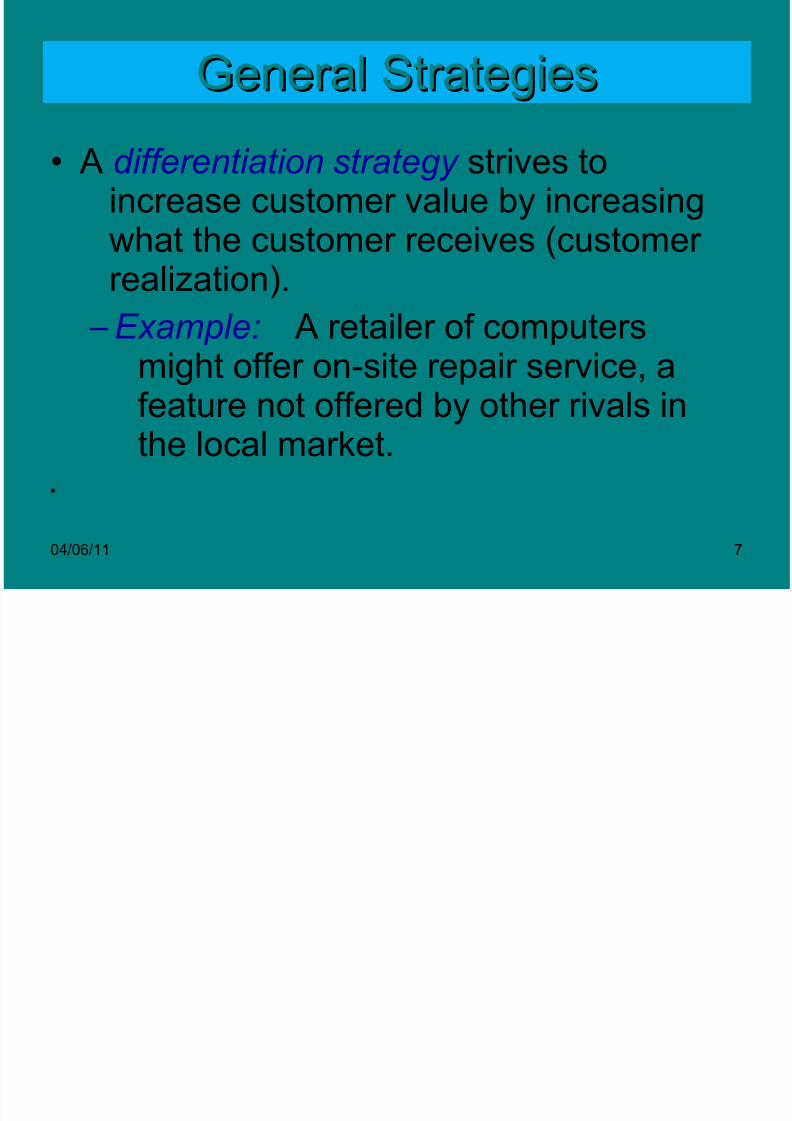
• A differentiation strategy strives toincrease customer value by increasingwhat the customer receives (customer
realization).– Example: A retailer of computers
might offer on-site repair service, a
feature not offered by other rivals inthe local market.
8/7/2019 Presentation3 for CSM
http://slidepdf.com/reader/full/presentation3-for-csm 8/207
04/06/11 8
General StrategiesGeneral Strategies
A focusing strategy happens when a firmselects or emphasizes a market or customer segment in which to compete.
Example: Paging Network, Inc., apaging services provider, hastargeted particular kinds of customers and is in the
process of weeding out thenontargeted customers.
8/7/2019 Presentation3 for CSM
http://slidepdf.com/reader/full/presentation3-for-csm 9/207
04/06/11 9
COST MANAGEMENT SYSTEM
• Cost management is focusing on not on the measurement per se but on the identification these measures that are criticalto future success of the firm.
• Phases of the development of the cost management system:
1. CMS are basic information reporting system.2. Focus on external financial reporting objectives are reliable
financial reporting, accordingly the usefulness of CMS islimited.
3. CMS track key operating data and develop more accurate and
relevant cost information.4. Strategically relevant cost management information is integral
part of the system.
8/7/2019 Presentation3 for CSM
http://slidepdf.com/reader/full/presentation3-for-csm 10/207
04/06/11 10
CONTEMPORARY MANAGEMENTTECHNIQUES
• Bench marking.
• Total quality management (TQM).
• Activity based costing and management.
• Reengineering.
• The theory of constraints (TOC)- eliminateobstacles/constraints to effectively improve the cycletime.
• Mass customization-a larger number of smaller production units in manufacturing and speciallydeigned marketing and service functions.
• Just-in Time system
•
•
8/7/2019 Presentation3 for CSM
http://slidepdf.com/reader/full/presentation3-for-csm 11/207
04/06/11 11
• Computer aided design and manufacturing.
• Automation
• Target costing.
• Life cycle costing.• The value chain.
• Balanced score card \Financial performance
-customer satisfaction. -internal business processes. -Innovation and training

8/7/2019 Presentation3 for CSM
http://slidepdf.com/reader/full/presentation3-for-csm 12/207
04/06/11 12
COSTING FOR DECISIONMAKING
• Managerial decision making is the process of makingchoices.
• Relevant information has to be used for evaluatingalternatives and making decisions.
• Relevant information implies relevant costs( refers toincrease or decrease in cost expected from aparticular decision or course of action) and relevantrevenue (refers to increase or decrease in revenue
expected from a particular decision or course of action)
8/7/2019 Presentation3 for CSM
http://slidepdf.com/reader/full/presentation3-for-csm 13/207
04/06/11 13
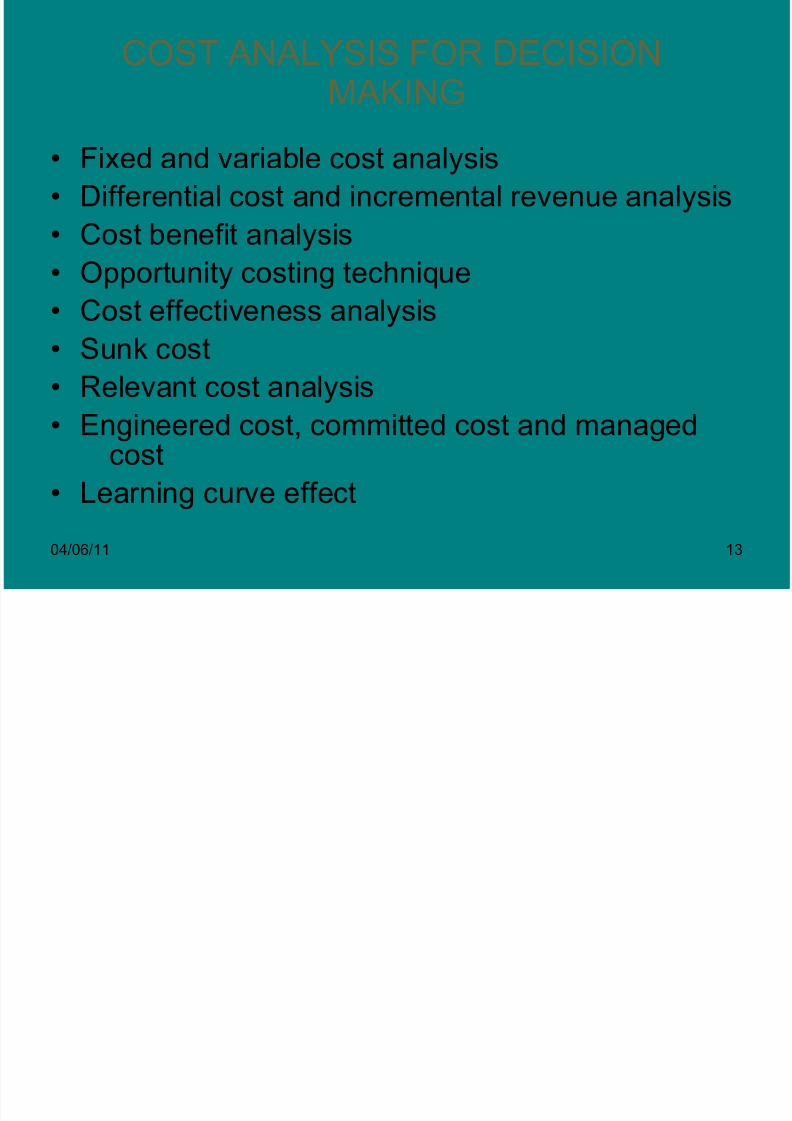
COST ANALYSIS FOR DECISIONMAKING
• Fixed and variable cost analysis
• Differential cost and incremental revenue analysis
• Cost benefit analysis
• Opportunity costing technique• Cost effectiveness analysis
• Sunk cost
• Relevant cost analysis
• Engineered cost, committed cost and managedcost
• Learning curve effect
8/7/2019 Presentation3 for CSM
http://slidepdf.com/reader/full/presentation3-for-csm 14/207
04/06/11 14
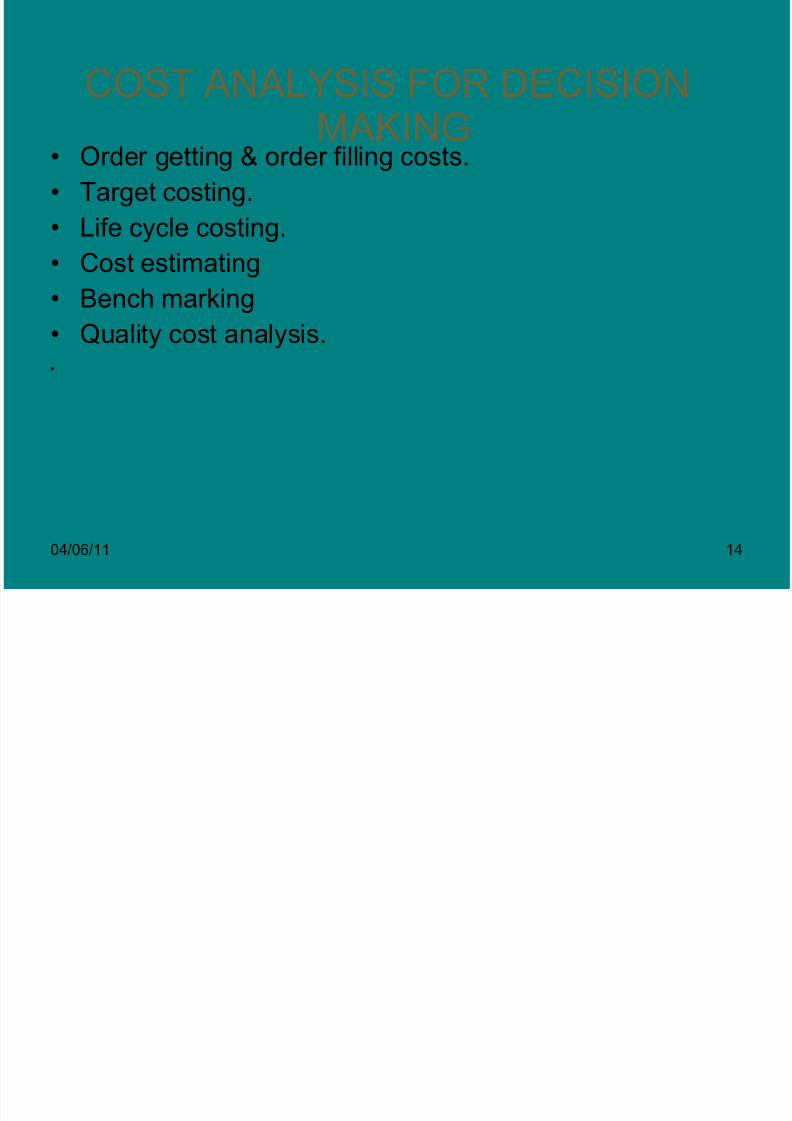
COST ANALYSIS FOR DECISION
MAKING• Order getting & order filling costs.
• Target costing.
• Life cycle costing.
• Cost estimating
• Bench marking
• Quality cost analysis.

8/7/2019 Presentation3 for CSM
http://slidepdf.com/reader/full/presentation3-for-csm 15/207
04/06/11 15
COSTS FOR DECISION MAKING<PLANNING ANF CONTROL
• Opportunity cost- it is the cost of opportunity lost.It isthe benefit given uo or sacrificed when one alternativeis chosen over another
• Sunk costs- cost already incurred.
• Relevant costs are costs which is a s result of adecision /course of action ot the difference betweenvarious alternatives.
• Differential cost: It is the total costs between any two
alternatives and it is equal to: Additional variableexpenses incurred in respect of additional output+increase in fixed cost, if any.

8/7/2019 Presentation3 for CSM
http://slidepdf.com/reader/full/presentation3-for-csm 16/207
04/06/11 16
Example : A printer is planning to replace an oldmachine purchased at Rs.1,50,000. The oldmachine is 3 years old and being depreciated atRs.50000 per year. There is two machines in the
market suitable at a cost of Rs.250000 withoperating cost of Rs. 50000 and the other alternative is priced at Rs.280000 with anoperating cost of Rs.45000.
1. What are the incremental cost ,if any, in thealternative choice of the equipment?
2. What are the sunk costs , if any, in this solution?
8/7/2019 Presentation3 for CSM
http://slidepdf.com/reader/full/presentation3-for-csm 17/207
04/06/11 17
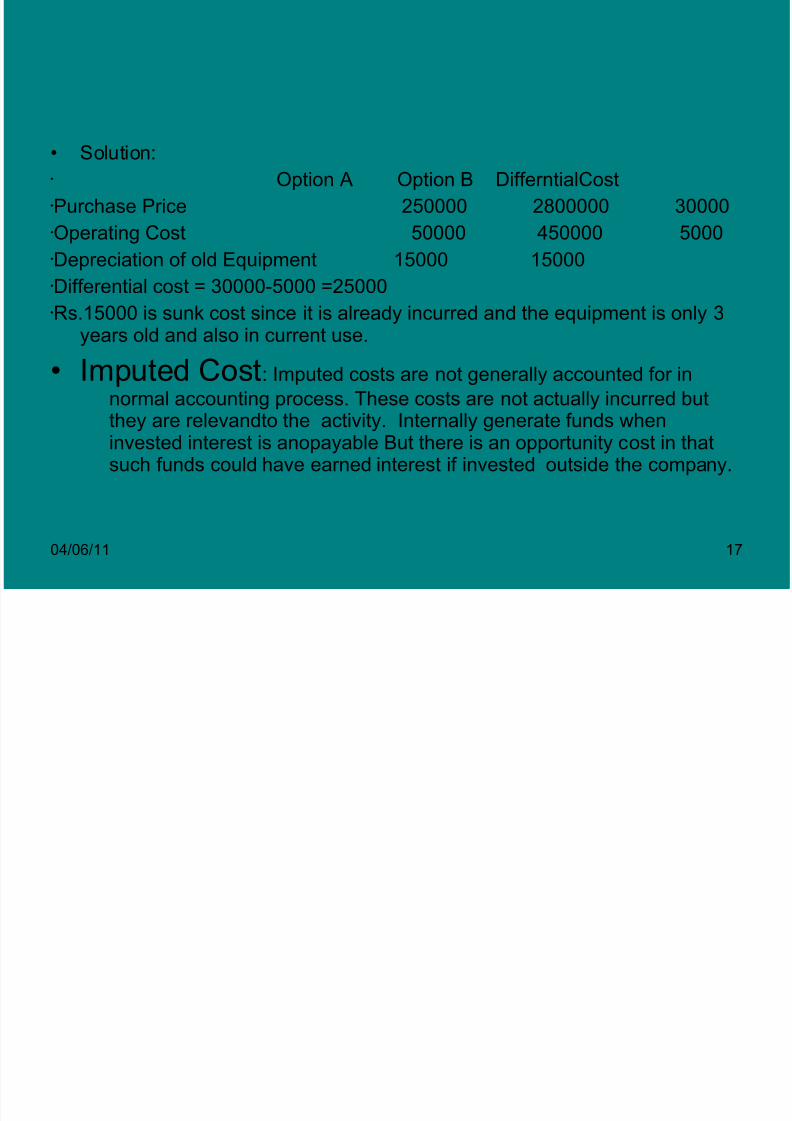
• Solution: Option A Option B DifferntialCostPurchase Price 250000 2800000 30000Operating Cost 50000 450000 5000Depreciation of old Equipment 15000 15000Differential cost = 30000-5000 =25000Rs.15000 is sunk cost since it is already incurred and the equipment is only 3
years old and also in current use.
• Imputed Cost: Imputed costs are not generally accounted for in
normal accounting process. These costs are not actually incurred but
they are relevandto the activity. Internally generate funds wheninvested interest is anopayable But there is an opportunity cost in thatsuch funds could have earned interest if invested outside the company.

8/7/2019 Presentation3 for CSM
http://slidepdf.com/reader/full/presentation3-for-csm 18/207
04/06/11 18
• Out –of-Pocket cost : If a companyaccepts a special order, it maynecessitate consideration of out-of-
pocket costs that need not be incurred incase the order is not accepted. For example if a restaurant takes specialorder involving additional transport cost,such cost is considered as out of pocketcost.
8/7/2019 Presentation3 for CSM
http://slidepdf.com/reader/full/presentation3-for-csm 19/207
04/06/11 19
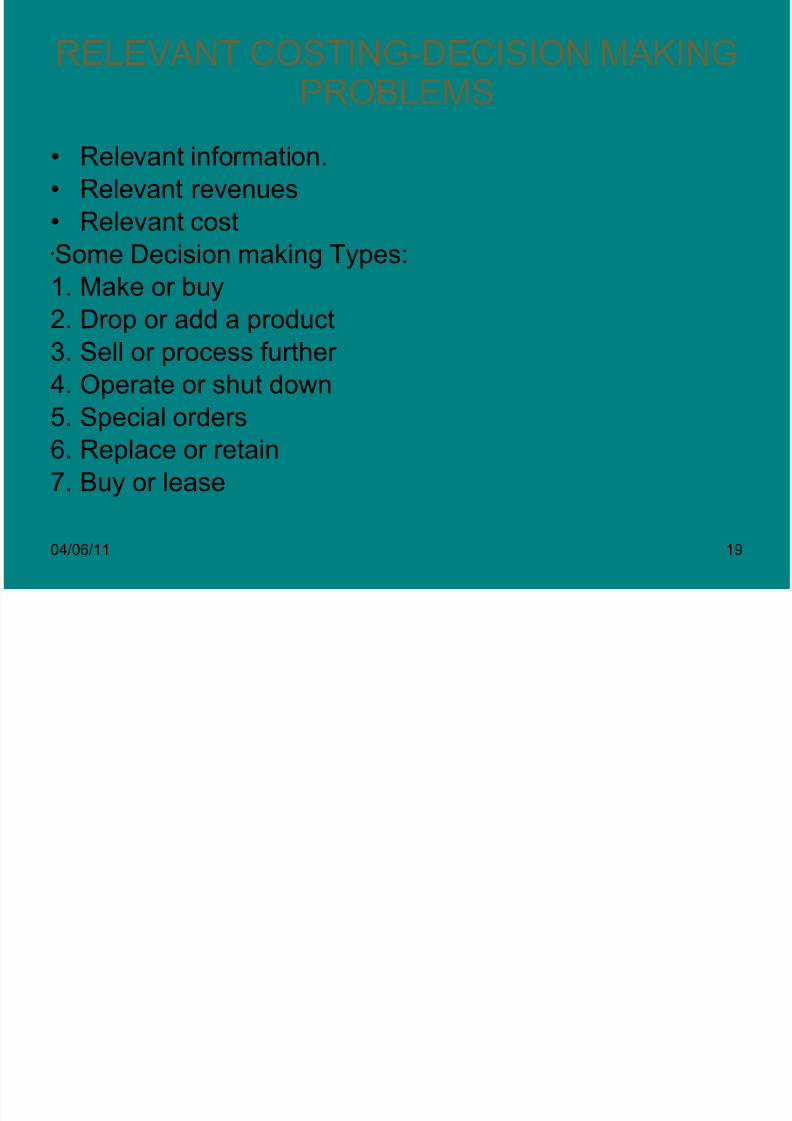
RELEVANT COSTING-DECISION MAKINGPROBLEMS
• Relevant information.
• Relevant revenues
• Relevant costSome Decision making Types:
1. Make or buy2. Drop or add a product
3. Sell or process further
4. Operate or shut down
5. Special orders6. Replace or retain
7. Buy or lease

8/7/2019 Presentation3 for CSM
http://slidepdf.com/reader/full/presentation3-for-csm 20/207
04/06/11 20
Make or Buy Decision
• When a company has unused capacities the followingalternatives are considered:
-To maximize production e capacity utilisation andfinaancialresources available to them they may consider
producing required raw materials or sub assemblies OR - to buy them from outside suppliers
• Such decision also depends on other than financial gainsuch as – strategic importance/quality/reliability of
supplies etc.

8/7/2019 Presentation3 for CSM
http://slidepdf.com/reader/full/presentation3-for-csm 21/207
04/06/11 21
Drop or Add A product
• The decision to eliminate non profitable product istob primarily based on its impact on futureincome if the firm.
• therefore one has to develop appropriate cost and
profit measures either to drop or add a product.• It is also necessary to evaluate how the sales of
other products will get adversely affected if oneproduct is removed.
• A customer may buy a highly profitable productsince the unprofitable product is also availablefrom the same company.
8/7/2019 Presentation3 for CSM
http://slidepdf.com/reader/full/presentation3-for-csm 22/207
04/06/11 22
SELL OR PROCESS FURTHER
• It is a decision to sell a product at spin oo point or toprocess further.
• Further process adds value tom the product and will getmore price.
• Further process may incur additional cost.
• Therefore the increase in revenue should be more thanthe additional cost incurred.
8/7/2019 Presentation3 for CSM
http://slidepdf.com/reader/full/presentation3-for-csm 23/207
04/06/11 23
• There are generally two conditions prevail : a)Additional process may call for additional
equipment and/or fixed costs.
b) Company already processes beyond spin-off point and invested in equipments andrequired personnel.
•
8/7/2019 Presentation3 for CSM
http://slidepdf.com/reader/full/presentation3-for-csm 24/207
04/06/11 24
OPERATE OR SHUTDOWN
• A company may face a situation that even when they areoperating at lesser percentage of installed capacitythey expect further fall in sales volume or reduction inprofit margin due to:
• Reduction in demand.• Economic slow down
• Stiff domestic or international competition.
• Political instability
• Increase in cost of inputs•

8/7/2019 Presentation3 for CSM
http://slidepdf.com/reader/full/presentation3-for-csm 25/207
04/06/11 25
SPECIAL ORDERS
• Such an option is considered by a company when theyhave surplus or unutilized production capacity isavilable.
• Special orders should not affect existing sales of the
product.• Pricing for special order may not take into account fixed
costs unless incurred for such orders a sotherwise thefirm may lose the order.
• Contribution approach may be an useful technique inpricec determination for special orders.

8/7/2019 Presentation3 for CSM
http://slidepdf.com/reader/full/presentation3-for-csm 26/207
04/06/11 26
Replace or Retain
• It is capital investment decision to be takencarefully.
• Differential cost and benefits are critical inputs
for making this decision.• Relevant cost and relevant revenue are to be
considered.
• Replacement cost to include cost of equipment
at site, cost of capital, training cost of operators etc.
8/7/2019 Presentation3 for CSM
http://slidepdf.com/reader/full/presentation3-for-csm 27/207
04/06/11 27
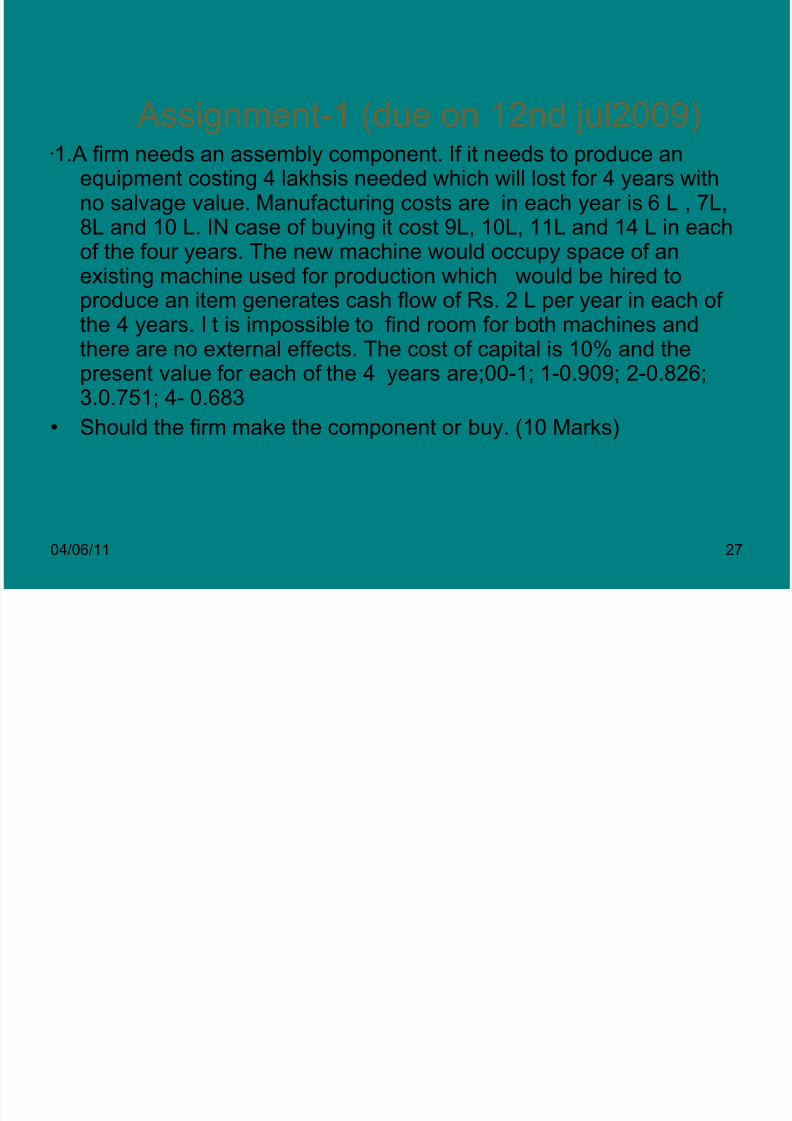
Assignment-1 (due on 12nd jul2009)1.A firm needs an assembly component. If it needs to produce an
equipment costing 4 lakhsis needed which will lost for 4 years withno salvage value. Manufacturing costs are in each year is 6 L , 7L,8L and 10 L. IN case of buying it cost 9L, 10L, 11L and 14 L in eachof the four years. The new machine would occupy space of an
existing machine used for production which would be hired toproduce an item generates cash flow of Rs. 2 L per year in each of the 4 years. I t is impossible to find room for both machines andthere are no external effects. The cost of capital is 10% and thepresent value for each of the 4 years are;00-1; 1-0.909; 2-0.826;3.0.751; 4- 0.683
• Should the firm make the component or buy. (10 Marks)

8/7/2019 Presentation3 for CSM
http://slidepdf.com/reader/full/presentation3-for-csm 28/207
04/06/11 28
2.Based on the following data you are required to advice themanagement the area of cultivation which would maximize theprofits of the company:
Particulars Apple Lemons Oranges PeachesSelling Price/unit1 15 15 30 45Yield/acre(Boxes) 500 150 100 200Cost/acre(Materials) 270 105 50 150Labour-Cultivation 300225 150 195Pick-up & Packing 1.50 1.50 3 4.50
Transport cost 3.00 3.00 1.50 4.50
8/7/2019 Presentation3 for CSM
http://slidepdf.com/reader/full/presentation3-for-csm 29/207
04/06/11 29
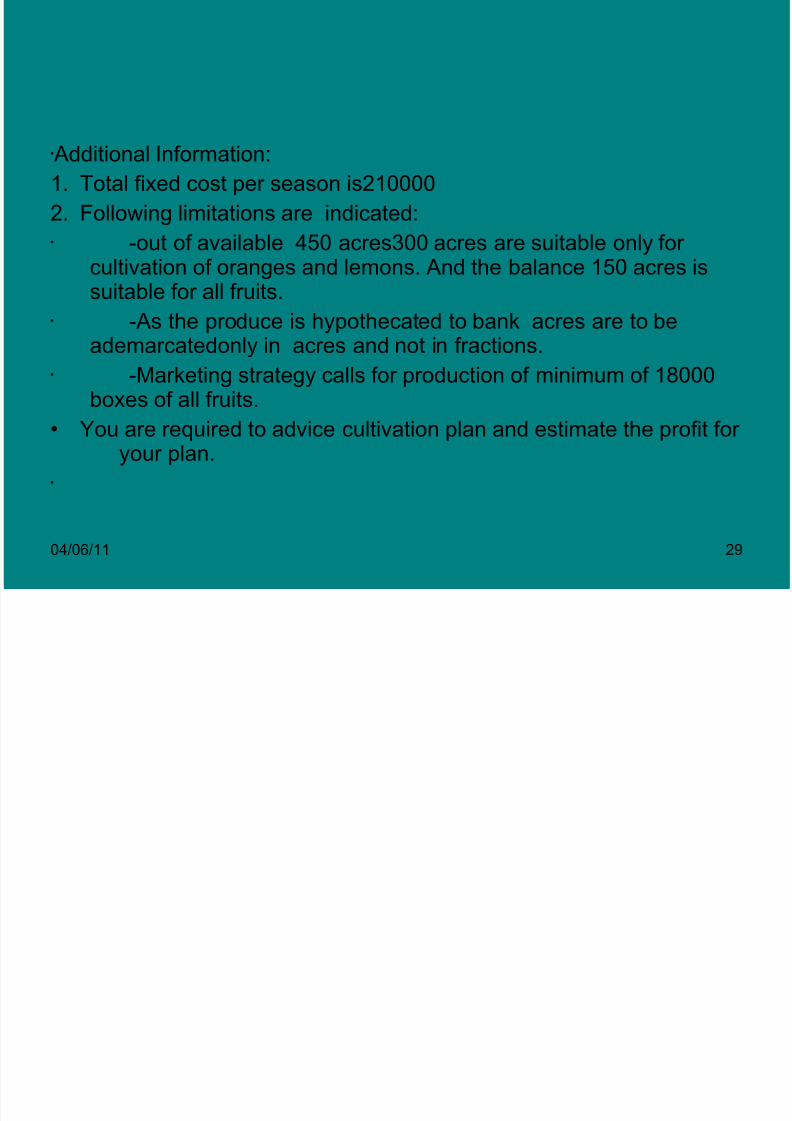
Additional Information:
1. Total fixed cost per season is210000
2. Following limitations are indicated: -out of available 450 acres300 acres are suitable only for
cultivation of oranges and lemons. And the balance 150 acres issuitable for all fruits.
-As the produce is hypothecated to bank acres are to beademarcatedonly in acres and not in fractions.
-Marketing strategy calls for production of minimum of 18000boxes of all fruits.
• You are required to advice cultivation plan and estimate the profit for your plan.
8/7/2019 Presentation3 for CSM
http://slidepdf.com/reader/full/presentation3-for-csm 30/207
04/06/11 30
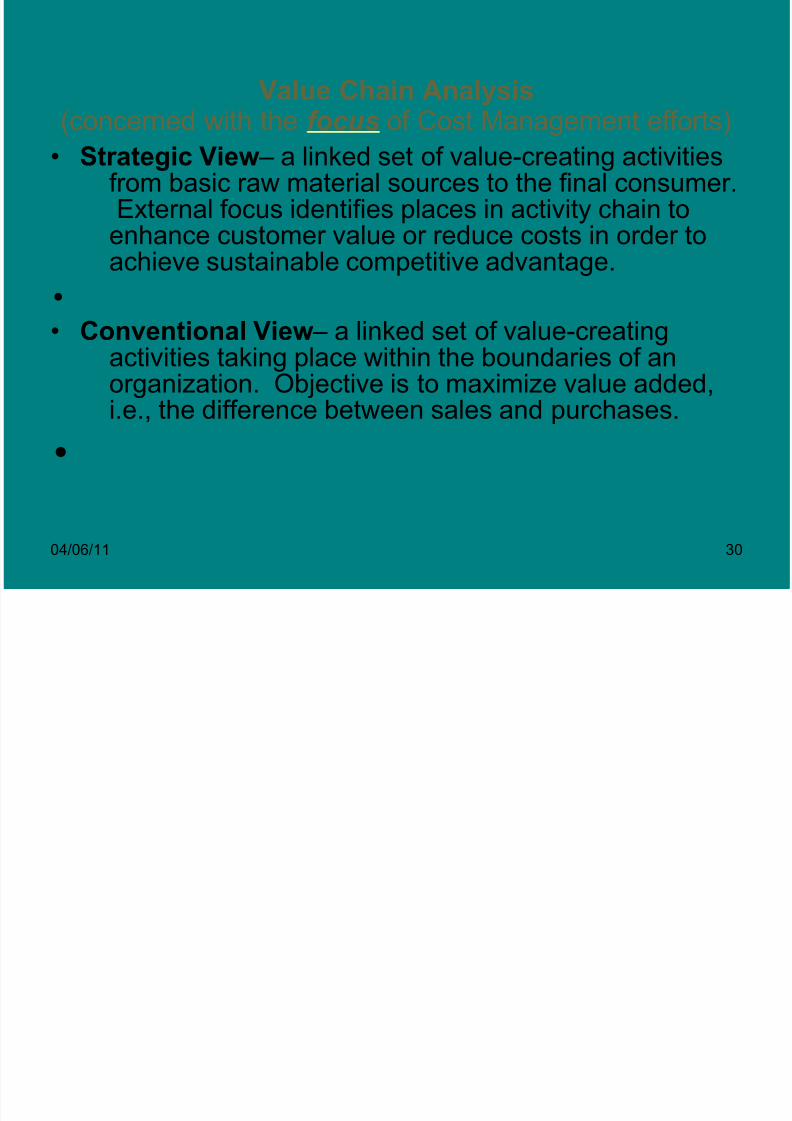
Value Chain Analysis(concerned with the focus of Cost Management efforts)
• Strategic View– a linked set of value-creating activitiesfrom basic raw material sources to the final consumer.External focus identifies places in activity chain to
enhance customer value or reduce costs in order toachieve sustainable competitive advantage.
•
• Conventional View– a linked set of value-creatingactivities taking place within the boundaries of anorganization. Objective is to maximize value added,
i.e., the difference between sales and purchases.•

8/7/2019 Presentation3 for CSM
http://slidepdf.com/reader/full/presentation3-for-csm 31/207
04/06/11 31
Value Chain Analysis
• A strategic analytical tool used to identify wherevalue to customers can be increased or costsreduced.
• To enable better understanding of the linkages
with suppliers, customers and other.• Value chain in PC Industry: Personal Computers---Software—Peripherals—
service
Operating Margins 5 20 10 15(revenue- Cost)

8/7/2019 Presentation3 for CSM
http://slidepdf.com/reader/full/presentation3-for-csm 32/207
04/06/11 32
STEPS INVOLVED IN VALUEANALYSIS
• Identify the value chain activities
• Develop a competitive advantage by reducing cost or adding value.
• Identify competitive advantage (cost leadership or
differentiation.• Identify opportunities for added value.
• Identify opportunities for reduced cost.
• Exp[lain linkges among activities in the value chain

8/7/2019 Presentation3 for CSM
http://slidepdf.com/reader/full/presentation3-for-csm 33/207
04/06/11 33
Value Chain for a Computer Manufacturing Industry
Step-1 Design Research &Development Product designStep-2 Raw Materialsacquisition
Mining,, developing& refining
Silicon, plastics &various materialsStep-3 Materials
assembled into partsConversion process Desired components
and partsStep-4 Intermediateassembly
Conversion process Boards andcomponentsStep-5 Computer
Manufacturing
Final assembly Completed computer
Step-^ Wholesaling,Warehousing &Distribution
Moving products Truck, rail & air
Step-7 Retail sales Making sale Cash Received
Step-8 Customer Service
Provide service Serviced units &customer Satisfaction

8/7/2019 Presentation3 for CSM
http://slidepdf.com/reader/full/presentation3-for-csm 34/207
04/06/11 34
BALANCED SCORECARD
• BSC provides a system for measuring andmanaging all aspects of the Company’sperformance.
• Score card balances traditional financialmeasure of success, such as profits andreturns on capital with non financial measuresof drivers of future financial performance.
•
8/7/2019 Presentation3 for CSM
http://slidepdf.com/reader/full/presentation3-for-csm 35/207
04/06/11 35
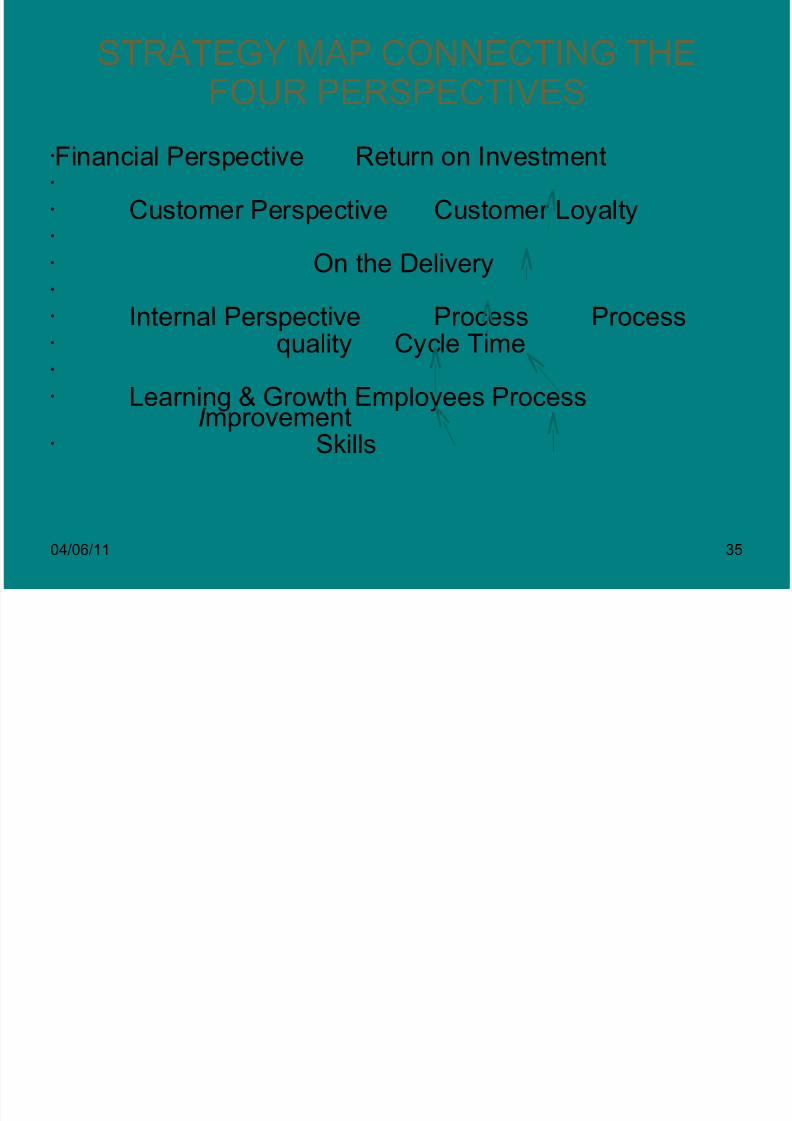
STRATEGY MAP CONNECTING THEFOUR PERSPECTIVES
Financial Perspective Return on Investment
Customer Perspective Customer Loyalty
On the Delivery
Internal Perspective Process Process quality Cycle Time
Learning & Growth Employees Process
I mprovement Skills

8/7/2019 Presentation3 for CSM
http://slidepdf.com/reader/full/presentation3-for-csm 36/207
04/06/11 36
ILLUSTRATIVE EXAMPLE OF LOW COSTAIRLINE
Financial Profits, Return On Assets
Grow Revenues Fewer
aircrafts
Customer Attract, retain More customers
On time services Lowest prices Internal Fast Ground Turnout Learning Trained motivated Ground Crew
•
8/7/2019 Presentation3 for CSM
http://slidepdf.com/reader/full/presentation3-for-csm 37/207
8/7/2019 Presentation3 for CSM
http://slidepdf.com/reader/full/presentation3-for-csm 38/207
BALANCED SCORE CARD AN EXAMPLE
8/7/2019 Presentation3 for CSM
http://slidepdf.com/reader/full/presentation3-for-csm 39/207
04/06/11 39
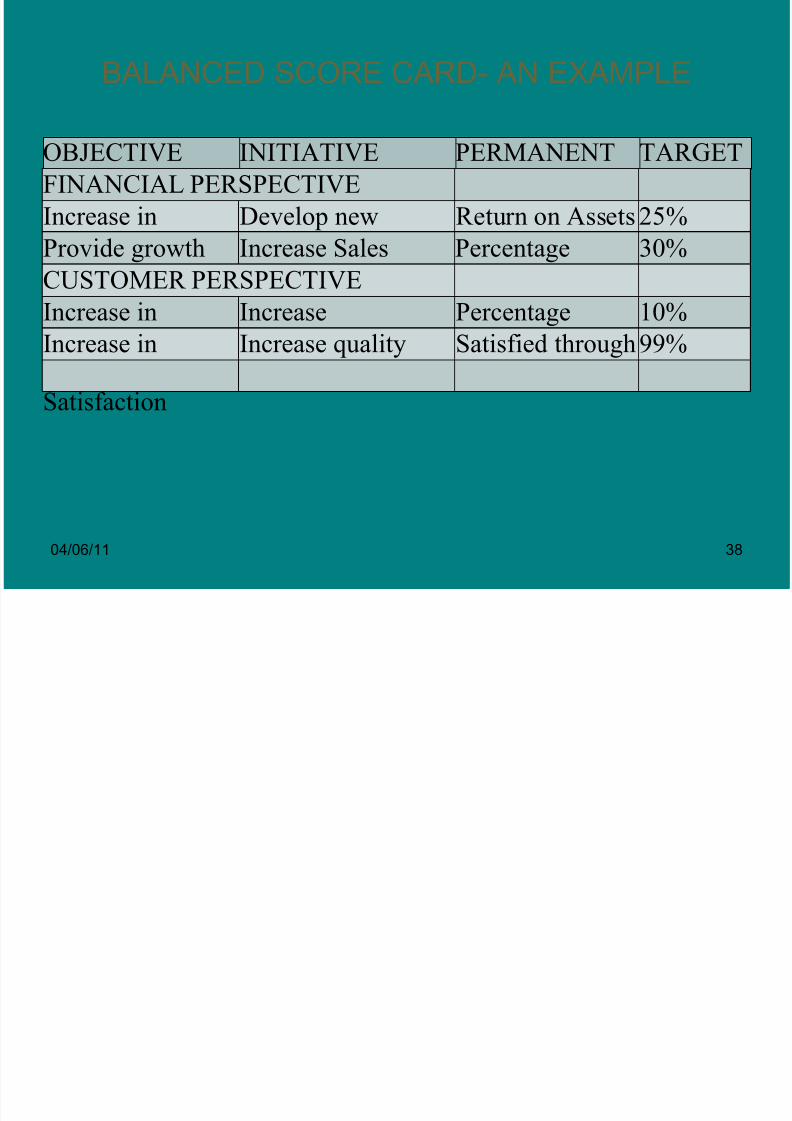
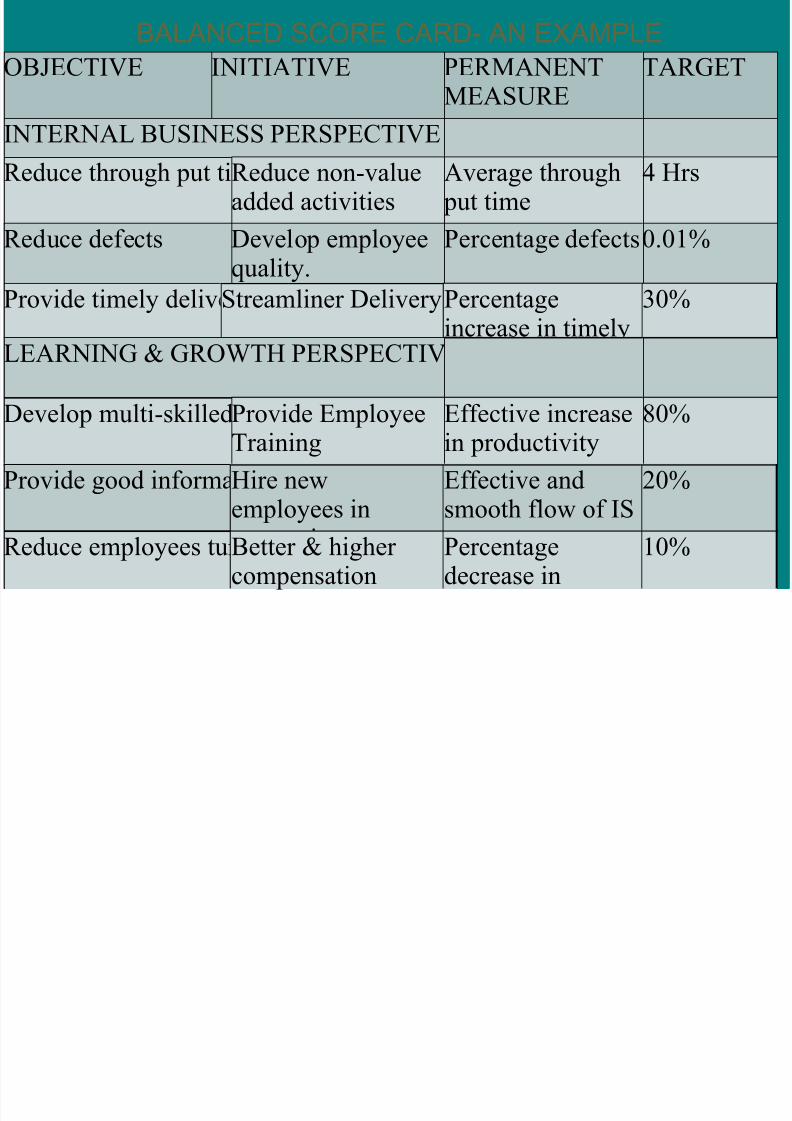
BALANCED SCORE CARD- AN EXAMPLE
OBJECTIVE INITIATIVE PERMANENTMEASURE
TARGET
INTERNAL BUSINESS PERSPECTIVEReduce through put timeReduce non-value
added activitiesAverage throughput time
4 Hrs
Reduce defects Develop employeequality.
Percentage defects0.01%
Provide timely deliveryStreamliner Delivery ProcessPercentageincrease in timelydelivery
30%
LEARNING & GROWTH PERSPECTIVE
Develop multi-skilled workforceProvide EmployeeTraining
Effective increasein productivity
80%
Provide good information systemHire newemployees incomputing
Effective andsmooth flow of IS
20%
Reduce employees turnover Better & higher compensation Percentagedecrease in 10%
8/7/2019 Presentation3 for CSM
http://slidepdf.com/reader/full/presentation3-for-csm 40/207
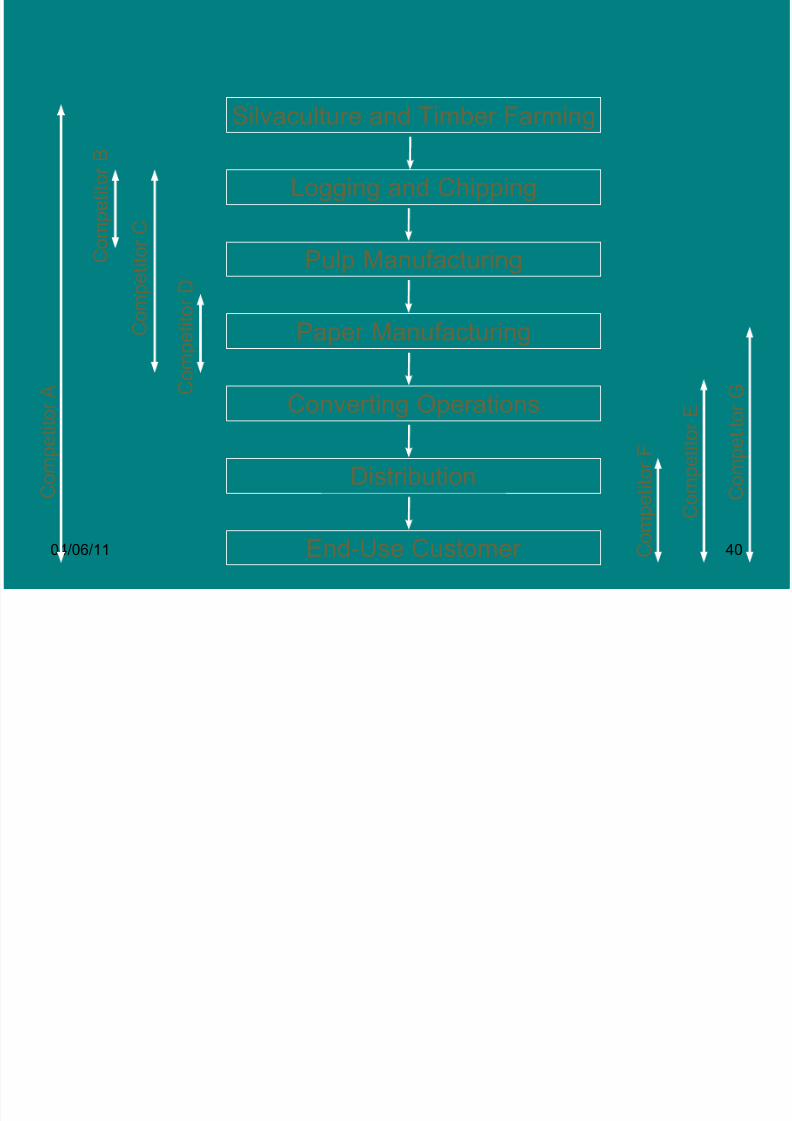
04/06/11 40
Silvaculture and Timber Farming
Logging and Chipping
Pulp Manufacturing
Paper Manufacturing
Converting Operations
Distribution
End-Use Customer
Compe
titorD
Compe
titorC
CompetitorB
Compe
titorA
Compe
tito
rG
Compe
titorE
Compe
titorF
8/7/2019 Presentation3 for CSM
http://slidepdf.com/reader/full/presentation3-for-csm 41/207
04/06/11 41
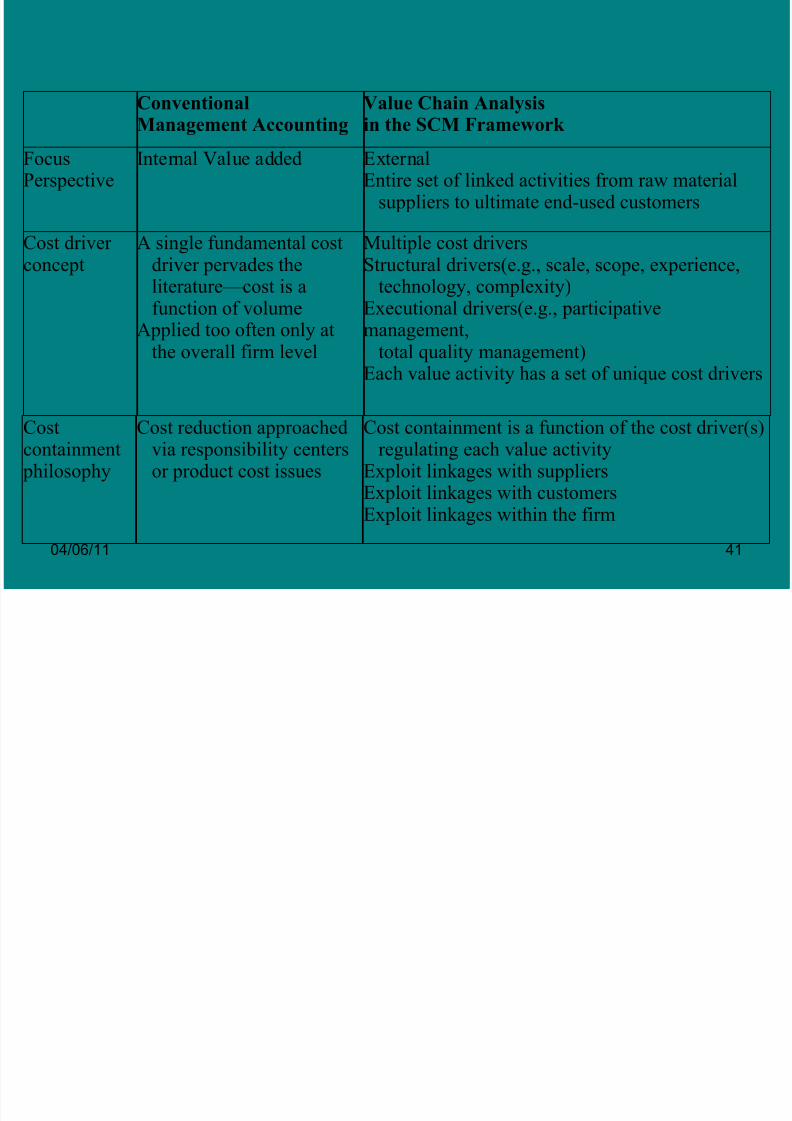
ConventionalManagement Accounting
Value Chain Analysisin the SCM Framework
FocusPerspective
Internal Value added ExternalEntire set of linked activities from raw material
suppliers to ultimate end-used customers
Cost driver concept
A single fundamental costdriver pervades the
literature—cost is afunction of volume
Applied too often only atthe overall firm level
Multiple cost driversStructural drivers(e.g., scale, scope, experience,
technology, complexity)Executional drivers(e.g., participativemanagement,
total quality management)Each value activity has a set of unique cost drivers
Costcontainmentphilosophy
Cost reduction approachedvia responsibility centersor product cost issues
Cost containment is a function of the cost driver(s)regulating each value activity
Exploit linkages with suppliersExploit linkages with customersExploit linkages within the firm

8/7/2019 Presentation3 for CSM
http://slidepdf.com/reader/full/presentation3-for-csm 42/207
04/06/11 42
Conventional Management
Accounting
Value Chain Analysis
in the SCM Framework Insights for strategicdecisions
None are readily apparent.This is a major reasonwhy strategy consultingfirms typically throw awayconventional reports as they
begin their cost analysis
Identify cost drivers at the individual activitylevel; develop cost/differentiation advantageeither by controlling those drivers better thancompetitors or by reconfiguring the value chain
For each value activity, ask strategic questionspertaining to make versus buy and forwardversus backward integration
Quantify and assess supplier power and buyer power; exploit linkages with suppliers and
buyers
8/7/2019 Presentation3 for CSM
http://slidepdf.com/reader/full/presentation3-for-csm 43/207
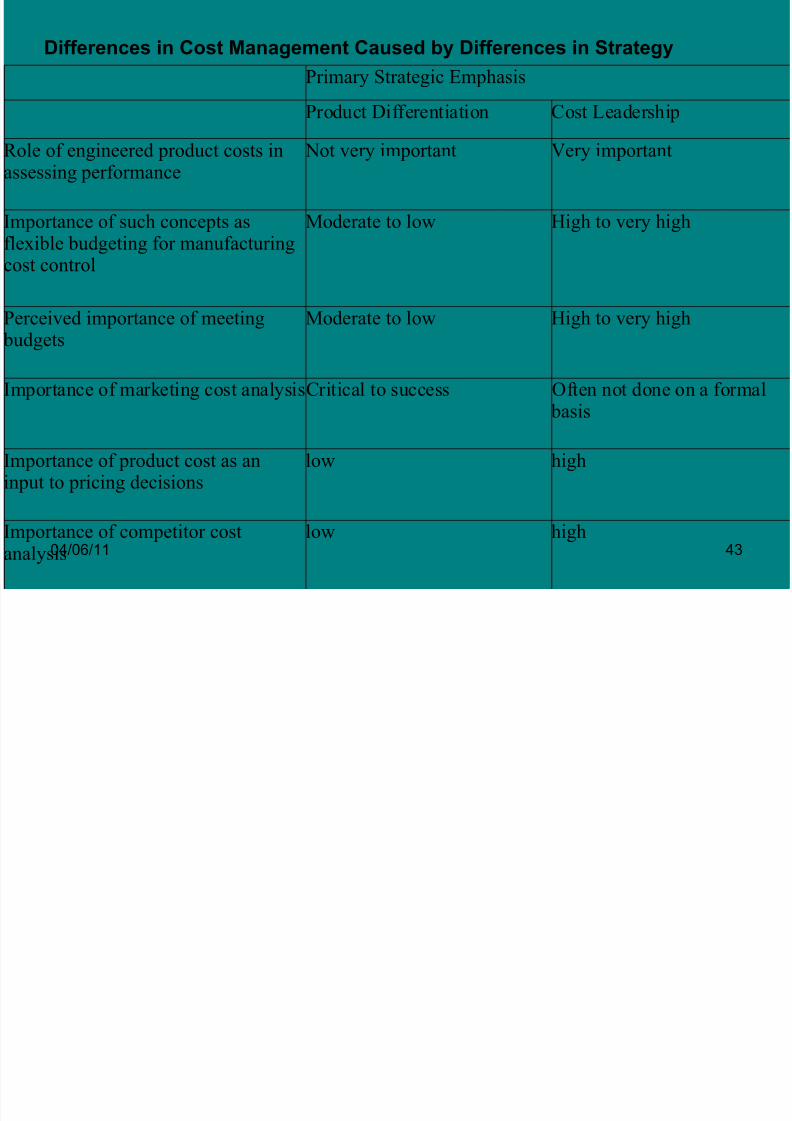
04/06/11 43
Differences in Cost Management Caused by Differences in Strategy
Primary Strategic Emphasis
Product Differentiation Cost Leadership
Role of engineered product costs inassessing performance
Not very important Very important
Importance of such concepts asflexible budgeting for manufacturingcost control
Moderate to low High to very high
Perceived importance of meetingbudgets
Moderate to low High to very high
Importance of marketing cost analysisCritical to success Often not done on a formal
basis
Importance of product cost as aninput to pricing decisions
low high
Importance of competitor cost
analysis
low high

8/7/2019 Presentation3 for CSM
http://slidepdf.com/reader/full/presentation3-for-csm 44/207
04/06/11 44
ABC Costing Technique
• Focuses on activity than on productsproduced.
• Costs are first traced to activities then toProducts.
• ABC assumes that activities are responsiblefor incurrence of costs and products createdemand for activities..
• Costs are charged to products based on
usage of activities. Traditional systemtraces costs to products and ABC tracescosts to activities.
•
8/7/2019 Presentation3 for CSM
http://slidepdf.com/reader/full/presentation3-for-csm 45/207
04/06/11 45
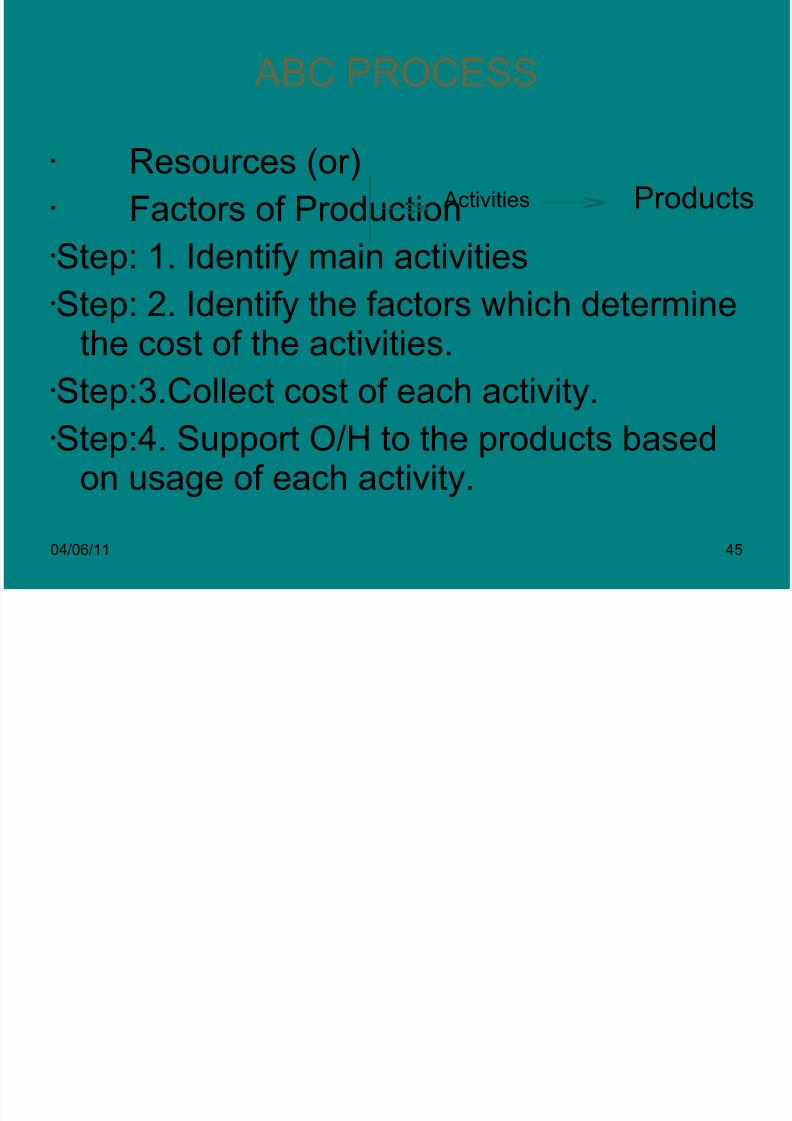
ABC PROCESS
Resources (or) Factors of ProductionStep: 1. Identify main activitiesStep: 2. Identify the factors which determine
the cost of the activities.Step:3.Collect cost of each activity.Step:4. Support O/H to the products based
on usage of each activity.
Activities Products
8/7/2019 Presentation3 for CSM
http://slidepdf.com/reader/full/presentation3-for-csm 46/207
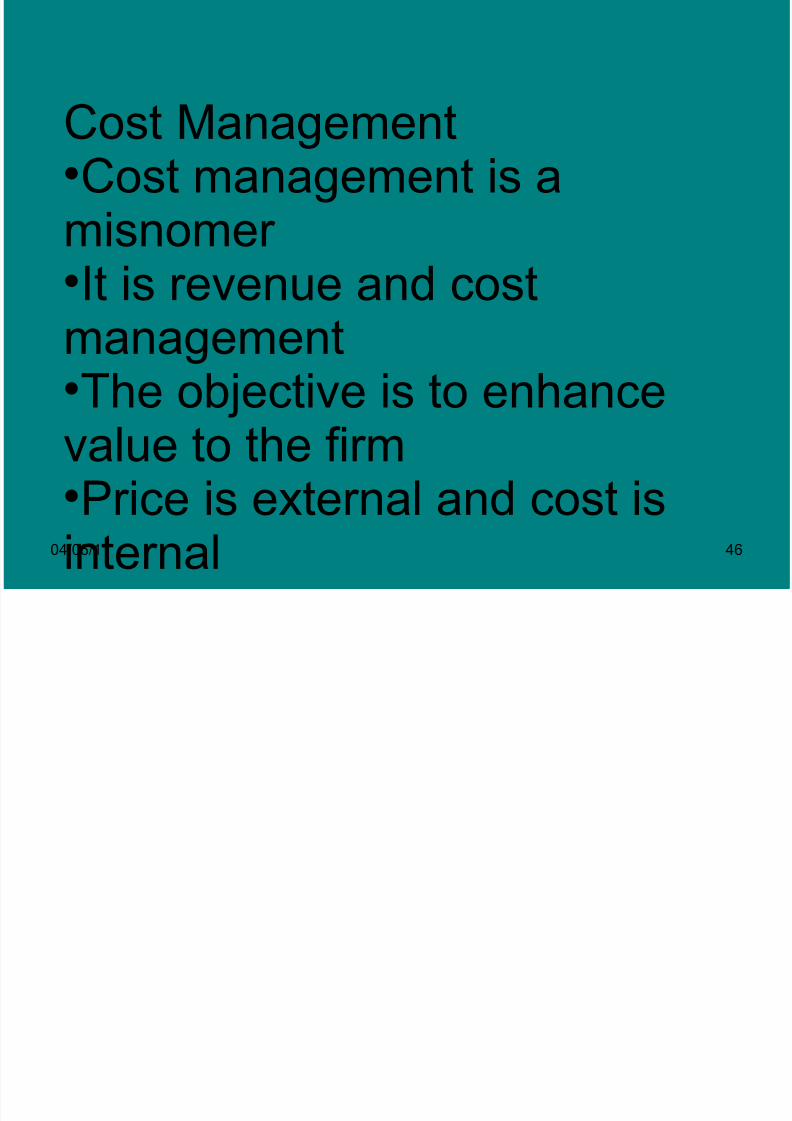
04/06/11 46
Cost ManagementCost management is amisnomer
It is revenue and costmanagementThe objective is to enhancevalue to the firmPrice is external and cost is
internal

8/7/2019 Presentation3 for CSM
http://slidepdf.com/reader/full/presentation3-for-csm 47/207
04/06/11 47
Contemporary Cost Management
TechniquesManage cost at the point of commitmentand not at the point of incidence
Trace cost and revenue to cost objectsasmuch as possible
Cost management should be allpervasiveCost management should be made a
culture within the organisation

8/7/2019 Presentation3 for CSM
http://slidepdf.com/reader/full/presentation3-for-csm 48/207
04/06/11 48
Survival triplet
Survival Zone
Cost/Price
QualityAttributes

8/7/2019 Presentation3 for CSM
http://slidepdf.com/reader/full/presentation3-for-csm 49/207
04/06/11 49
COST DRIVERS
• Business Definition for: Cost Driver
• a factor that determines the cost of an activity.Cost drivers are analyzed as part of activitybased costing and can be used in continuous
improvement programs. They are usuallyassessed together as multiple drivers rather than singly. There are two main types of costdriver: the first is a resource driver, which refersto the contribution of the quantity of resourcesused to the cost of an activity; the second is anactivity driver, which refers to the costs incurredby the activities required to complete aparticular task or project.

8/7/2019 Presentation3 for CSM
http://slidepdf.com/reader/full/presentation3-for-csm 50/207
04/06/11 50
COST DRIVER ANALYSIS
C t D i

8/7/2019 Presentation3 for CSM
http://slidepdf.com/reader/full/presentation3-for-csm 51/207
04/06/11 51
Cost Drivers
• Manage cost drivers to manage costs
• Location of cost drivers might be differentfrom the location of cost incidence
• Map cost drivers
8/7/2019 Presentation3 for CSM
http://slidepdf.com/reader/full/presentation3-for-csm 52/207
04/06/11 52
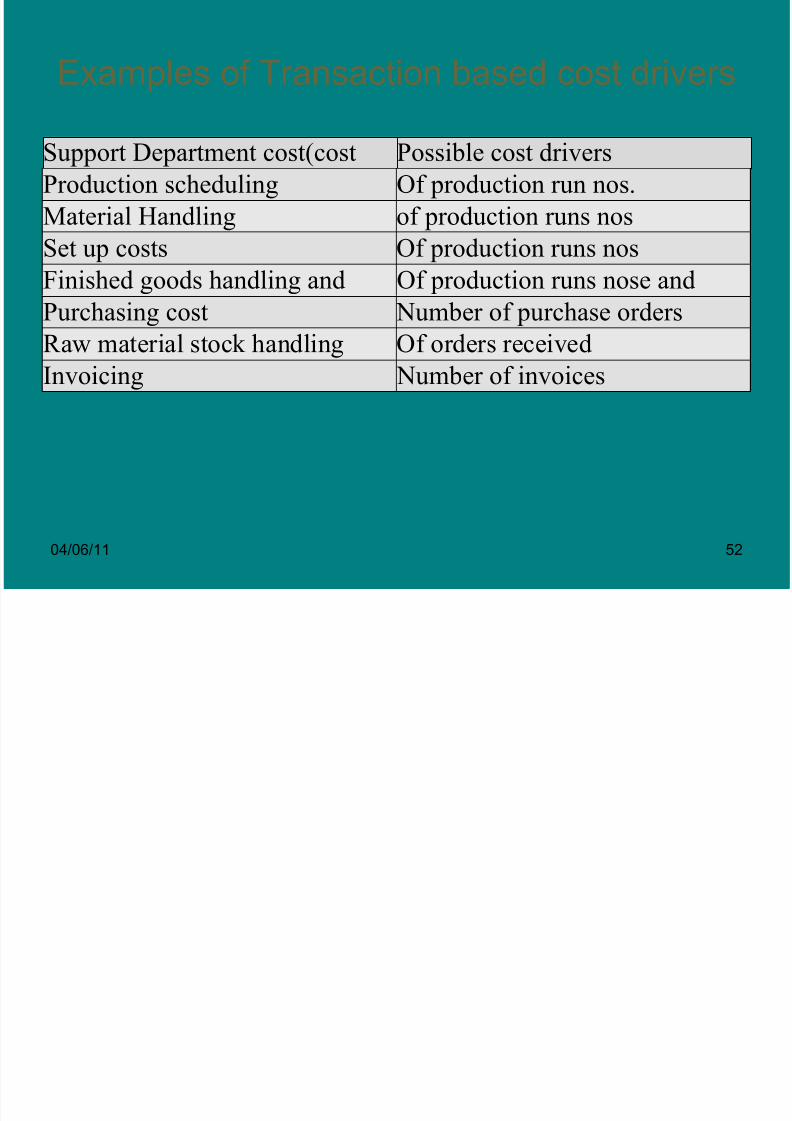
Examples of Transaction based cost drivers
Support Department cost(costpool)
Possible cost driversProduction scheduling Of production run nos.
Material Handling of production runs nos
Set up costs Of production runs nos
Finished goods handling anddispatch of goods
Of production runs nose andnumber of destinations anddeliver ordesr
Purchasing cost Number of purchase orders
Raw material stock handling Of orders received
Invoicing Number of invoices

8/7/2019 Presentation3 for CSM
http://slidepdf.com/reader/full/presentation3-for-csm 53/207
04/06/11 53
CLASSIFICATION OF ACTIVITIES IN AMANUFACTURING ORGANISATION
1. Unit level activities- activities performed wheneach unit is produced.
2. Batch level activities-. activities performed wheneach batch is produced.
3. Product level activities- activities to supportproduction of each different types of products ;maintenance and operation of equipments andtesting / engineering charges.
4. Facility level cost-general manufacturing process.These activities are common to variety of products
Cost Driver Analysis
8/7/2019 Presentation3 for CSM
http://slidepdf.com/reader/full/presentation3-for-csm 54/207
04/06/11 54
Cost Driver Analysis(concerned with analyzing cost behavior in a manner supportive to strategic choices)
Understanding cost behavior requiresidentifying the cost drivers present in anygiven situationUnderstanding cost behavior depends on
understanding the complex interplay amongthe relevant cost drivers in any givensituation
Cost Driver Categories

8/7/2019 Presentation3 for CSM
http://slidepdf.com/reader/full/presentation3-for-csm 55/207
04/06/11 55
Structural -- related to strategicchoices that drive costsExecutional – related to anorganization’s ability to executesuccessfully
Structural Cost Drivers (Related to organizational choices)

8/7/2019 Presentation3 for CSM
http://slidepdf.com/reader/full/presentation3-for-csm 56/207
04/06/11 56
(Related to organizational choices)
Scale: Investment size in manufacturing,
R&D, and marketingScope: Degree of vertical integrationExperience: Previous repetitions of currentwork
Technology: Process technologies used ateach step in value chainComplexity: Broadness of product line
Executional Cost Drivers (Related to organizational skills)

8/7/2019 Presentation3 for CSM
http://slidepdf.com/reader/full/presentation3-for-csm 57/207
04/06/11 57
(Related to organizational skills)
Work Force Involvement: participation;
empowerment; commitment to continuousimprovementCapacity Utilization: given scale choices onplant construction
Plant Layout Efficiency: compared to currentnormsProduct Configuration: design or formulationeffectiveness
Exploiting Linkages withSuppliers/Customers: in relation to the valuechain
Cost Driver Analysis – Some Key Ideas

8/7/2019 Presentation3 for CSM
http://slidepdf.com/reader/full/presentation3-for-csm 58/207
04/06/11 58
Volume is usually not the best way to explain
cost behavior More useful to explain cost position in terms of structural choices and executional skills
Not all strategic cost drivers operable or
equally important all the time but some areprobably very important in every instance
Linkages Among Value Chain Analysis, Strategic PositioningAnalysis and Cost Driver Analysis
8/7/2019 Presentation3 for CSM
http://slidepdf.com/reader/full/presentation3-for-csm 59/207
04/06/11 59
Analysis and Cost Driver Analysis
Understanding the value chain
helps define the optimal positioningstrategy
Understanding the value chain andpositioning strategy helps identifythe relevant cost drivers
8/7/2019 Presentation3 for CSM
http://slidepdf.com/reader/full/presentation3-for-csm 60/207
04/06/11 60
Advantages of ABC
• Brings accuracy and reliability in product cost determination.
• ABC provides realistic product cost where advanced manufacturingenvironment and technologies were to support overhead costs.
• ABC identifies real cost behaviour and helps in reducing cost.
• Uses multiple cost drivers most of which are transaction based and
not volume based.
• Traces cost to areas of managerial responsibility, processes,customers,depart,ent beyond product cost.
• Improve manager’s decision making.
• Provides reliable and correct product cost.
• Provides cost for cost driversand information on transaction volume.
8/7/2019 Presentation3 for CSM
http://slidepdf.com/reader/full/presentation3-for-csm 61/207
04/06/11 61
De-merits of ABC
• More complex in nature.
• Difficult to implement.
• ABC has different level of activity for different organisation.ABC in Service Organisation:
• Unlike in manufacturing organation, in sevice organisation costs aremostly fixeed and indirect and therfore ABC seems irrelevent.
•

8/7/2019 Presentation3 for CSM
http://slidepdf.com/reader/full/presentation3-for-csm 62/207
04/06/11 62
Activity LevelsActivit level Reason for activity Examples of activityUnit level Performed for each
unit of productproduced or sold
-Raw material cost-Cost of inserting acomponentUtilities cost of operations
Batch Level Performed for eachunit of product
produced or sold
Cost of processingsales order
-cost of inspection
Product Level Performed to support
each different productthat can be produced
Cost of product
developmentCost of Special M/CFacility Level Performed tomaintain general mfg.facilities
Cost of maintenance.Cost of nonspecialisecd equiment

8/7/2019 Presentation3 for CSM
http://slidepdf.com/reader/full/presentation3-for-csm 63/207
04/06/11 63
Product Differentiation
• In form-size, colour, shape, physical structure, design, coating, actiontime.
• Features.
• Performance quality
• Conformance quality.
• Durability.• Reliability.
• Style.
• Service differentiation.
• Ordering ease
• Installation.
• Customer training.
• Maintenance &repair
• Customer consulting
•
8/7/2019 Presentation3 for CSM
http://slidepdf.com/reader/full/presentation3-for-csm 64/207
04/06/11 64
Positioning Analysis
• Organizational analysis
• Organizational structure design / structurealignment
• Staffing studies
• Job analysis / job description projects
• Long-range organization planning

8/7/2019 Presentation3 for CSM
http://slidepdf.com/reader/full/presentation3-for-csm 65/207
04/06/11 65
Positioning Analysis
• Strategic positioning analysis (SPA) is developed as aspecific analytical approach consisting of a productportfolio analysis,
• Shift-share analysis and a Diversification analysis.
• The SPA describes the performance of ports andtraffic categories within ports in terms of marketshare, growth rate, diversification and value added.
• The SPA needs to be used taking into account theport's position with regard to value-added createdby the different traffic categories.
• By using this integrative instrument, indications on theoverall strategic position of ports are provided andwill benefit strategy formulation and decision-makingon port development.
•
8/7/2019 Presentation3 for CSM
http://slidepdf.com/reader/full/presentation3-for-csm 66/207
04/06/11 66
Positioning Analysis
• Predicting Relative Competitive Position of anOrganization
• Commonly used methods for analyzingcompetitive strength including SWOT (Strength,
weakness, Opportunity ,Threat)VRIO( Valuable, Rare, Imitable , Organizationready)portfolio models and competitor ranking-key success factors (KSF).
• A method for predicting relative competitiveposition of an organization is proposed todetermine a numerical relative strength score for a firm.

8/7/2019 Presentation3 for CSM
http://slidepdf.com/reader/full/presentation3-for-csm 67/207
04/06/11 67
Positioning Analysis
• To achieve maximum profitability a firm must find a way toachieve meaningful competitive advantage over itscompetitors.
• Unequal command of valuable resources forms the basis of competitive advantage for a firm.
• Competitive advantage is connected to relative competitivestrength which is the net value of a firms strengths andweaknesses comparative to benchmarks usually thestrengths and weaknesses of key industry rivals.
• Competitive analysis involves the organization looking bothinward to its internal environment as well as outward to its
competitors and other forces in the external environment.The analysis will generally include the following elements:identifying potential competitors, economic growth of thecountry, financial markets, capital markets, customer etc.
8/7/2019 Presentation3 for CSM
http://slidepdf.com/reader/full/presentation3-for-csm 68/207
04/06/11 68
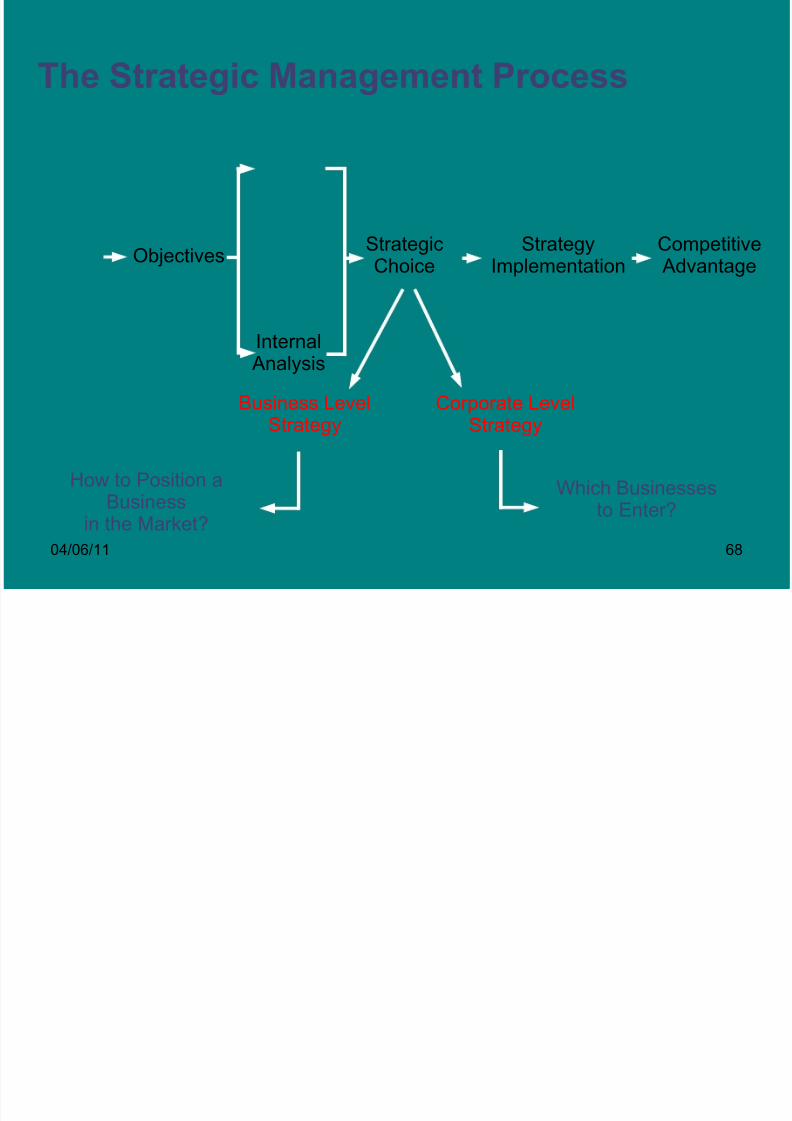
The Strategic Management Process
Objectives
InternalAnalysis
StrategicChoice
StrategyImplementation
CompetitiveAdvantage
Business Level
Strategy
Corporate Level
Strategy
How to Position aBusiness
in the Market?
Which Businessesto Enter?
8/7/2019 Presentation3 for CSM
http://slidepdf.com/reader/full/presentation3-for-csm 69/207
04/06/11 69
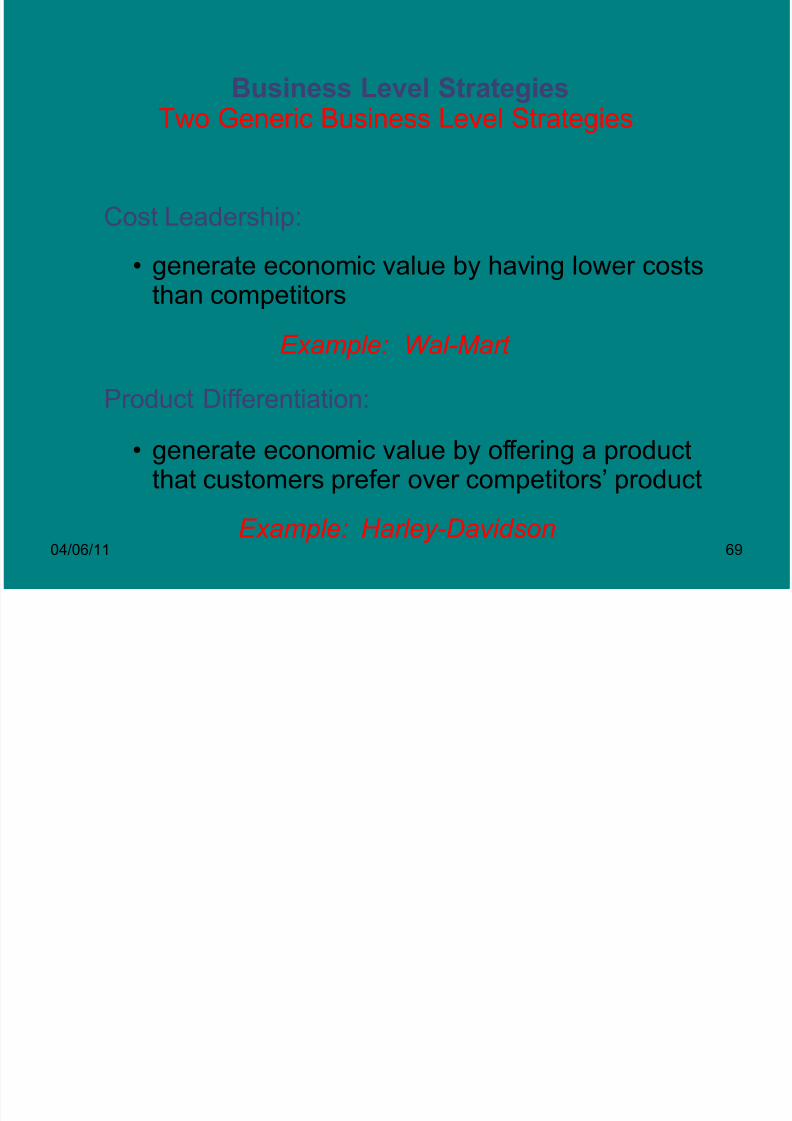
Business Level StrategiesTwo Generic Business Level Strategies
Cost Leadership:
• generate economic value by having lower costs
than competitors
Product Differentiation:
• generate economic value by offering a productthat customers prefer over competitors’ product
Example: Wal-Mart
Example: Harley-Davidson

8/7/2019 Presentation3 for CSM
http://slidepdf.com/reader/full/presentation3-for-csm 70/207
04/06/11 70
Understanding Cost Advantage
Managers need to understand who hasthe cost advantage in their market
• it could be the focal firm
• it could be a competitor
• develop a strategy to exploit the advantage
• develop a strategy to either capture theadvantage or compete on some other basis
Sources of Cost Advantage

8/7/2019 Presentation3 for CSM
http://slidepdf.com/reader/full/presentation3-for-csm 71/207
04/06/11 71
Sources of Cost Advantage
Economies of Scale
• average cost per unit falls as quantity increases-until the minimum efficient scale is reached
• are a cost advantage because competitors maynot be able to match the scale because of capitalrequirements (barrier to entry)
• international expansion may allow a firm to haveenough sales to justify investing in additionalcapacity to capture economies of scale
8/7/2019 Presentation3 for CSM
http://slidepdf.com/reader/full/presentation3-for-csm 72/207
04/06/11 72
• are an advantage for those who do not havediseconomies of scale
• are a risk of international expansion
Learning Curve Economies

8/7/2019 Presentation3 for CSM
http://slidepdf.com/reader/full/presentation3-for-csm 73/207
04/06/11 73
Learning Curve Economies
• a firm gets more efficient at a process with experience
• the more complicated/technical the process,the greater the experience advantage
Example: Fuel Injectors
• international expansion may propel a firm down theexperience curve because of higher volumes
Differential Low-Cost Access to Productive Inputs

8/7/2019 Presentation3 for CSM
http://slidepdf.com/reader/full/presentation3-for-csm 74/207
04/06/11 74
Differential Low Cost Access to Productive Inputs
• may result from:
• history—being in the right place at the right time
• being first into a market—esp. foreign markets
• natural endowment—owning a mineral deposit
• locking up a source—buying all of its output
Example: Quantity Carpet Buys
8/7/2019 Presentation3 for CSM
http://slidepdf.com/reader/full/presentation3-for-csm 75/207
04/06/11 75
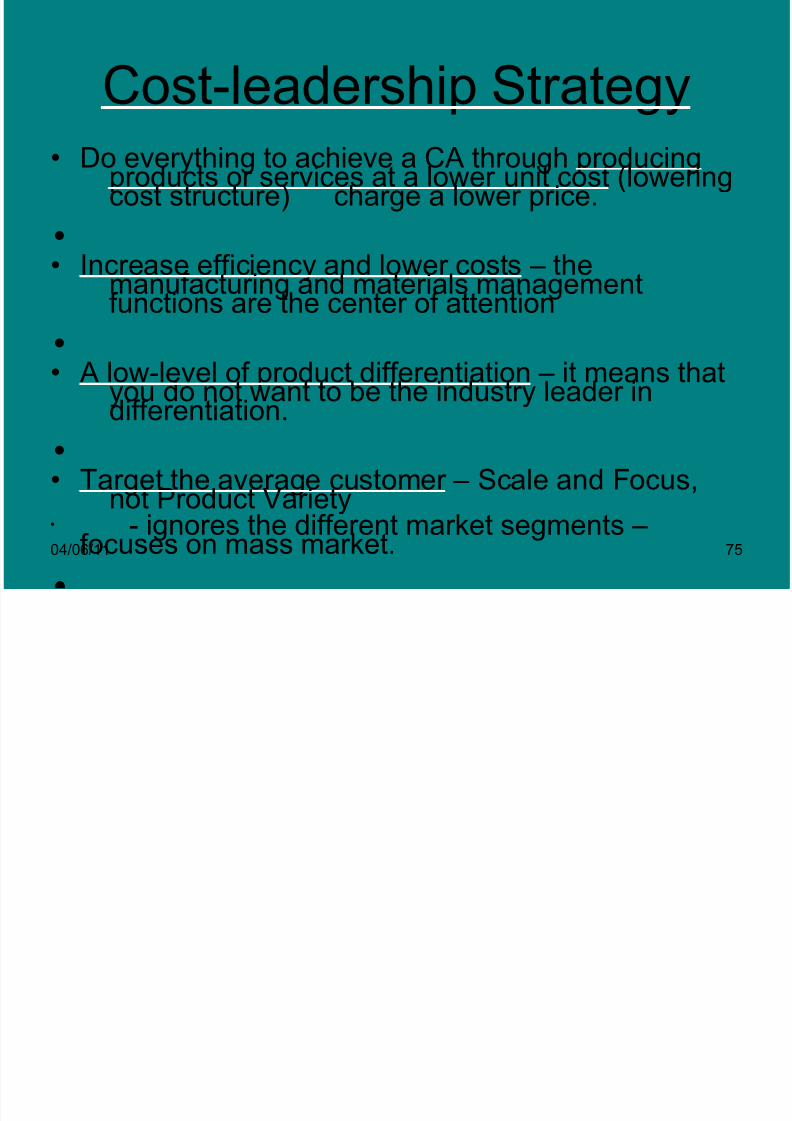
Cost-leadership Strategy
• Do everything to achieve a CA through producingproducts or services at a lower unit cost (loweringcost structure) charge a lower price.
•
• Increase efficiency and lower costs – the
manufacturing and materials managementfunctions are the center of attention
•
• A low-level of product differentiation – it means thatyou do not want to be the industry leader indifferentiation.
•
• Target the average customer – Scale and Focus,not Product Variety
- ignores the different market segments –focuses on mass market.
Technology Independent of Scale

8/7/2019 Presentation3 for CSM
http://slidepdf.com/reader/full/presentation3-for-csm 76/207
04/06/11 76
Technology Independent of Scale
Example: Vegetable Inspection
• may allow small firms to become cost competitive
• advantage typically accrues to the ‘owner’ of thetechnology—may or may not be the ones who actuallyuse the technology
• size of the advantage depends both on how valuableand protectable the technology is

8/7/2019 Presentation3 for CSM
http://slidepdf.com/reader/full/presentation3-for-csm 77/207
04/06/11 77
Policy Choices
• firms get to choose how they will serve the market
• we’ll offer level of quality that is inexpensive toproduce
• firms can make policy choices that give peopleincentives to reduce cost at every opportunity
Example: Deccan Airways

8/7/2019 Presentation3 for CSM
http://slidepdf.com/reader/full/presentation3-for-csm 78/207

8/7/2019 Presentation3 for CSM
http://slidepdf.com/reader/full/presentation3-for-csm 79/207
04/06/11 79
Value of a Cost Advantage
Rivalry
Entry Buyers
SuppliersSubstitutes
• increases capitalrequirementsfor entrants
• competitors rationallyavoid price competition
• limitsattractivenessof substitutes
• increasesimportance of the
focal firm to thesupplier
• lowers incentivesfor buyers to
verticallyintegrate

8/7/2019 Presentation3 for CSM
http://slidepdf.com/reader/full/presentation3-for-csm 80/207
04/06/11 80
Rareness of aCost Advantage The rareness of a source of cost advantage
depends heavily on the industry life cycle:
Economies of Scale
Diseconomies of Scale
Learning Curve Economies
Technology
Differential Input Access
Not Rare Rare
Emerging Mature
Rare Rare
Not RareRare
Rare Rare
Not RareRare
Rare Rare
Generally…
8/7/2019 Presentation3 for CSM
http://slidepdf.com/reader/full/presentation3-for-csm 81/207
04/06/11 81
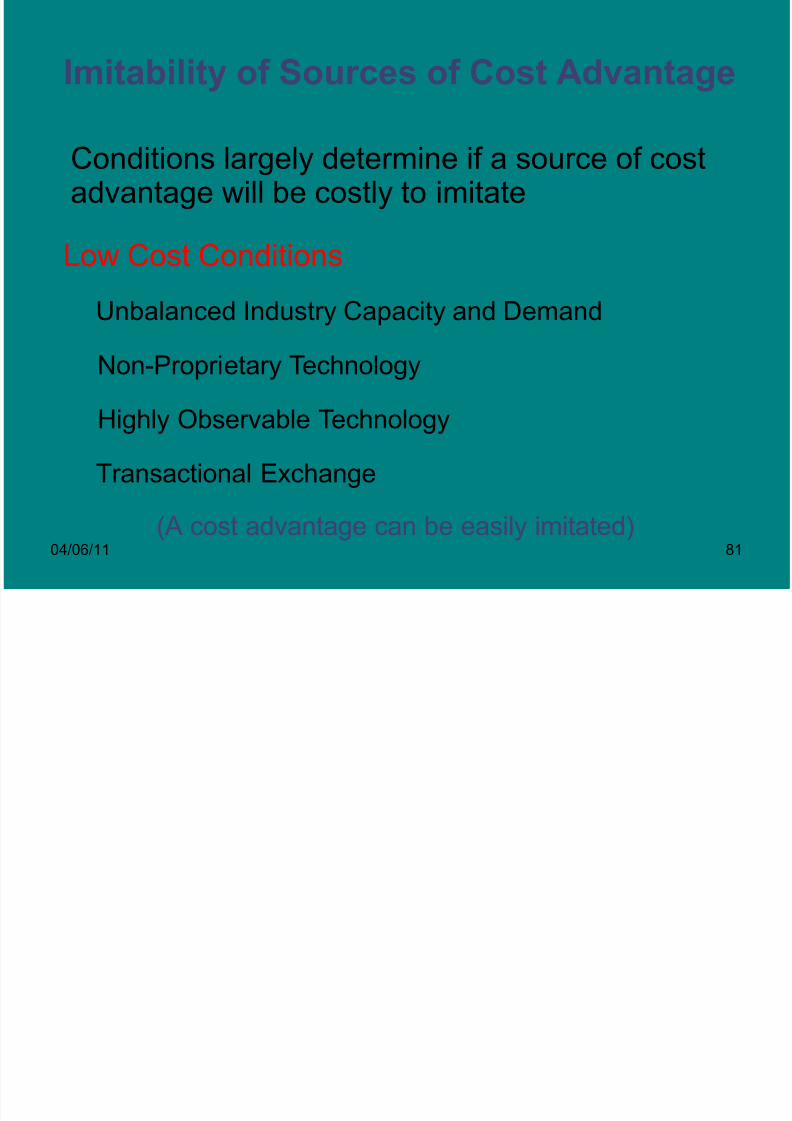
Imitability of Sources of Cost Advantage
Conditions largely determine if a source of costadvantage will be costly to imitate
Low Cost Conditions
Unbalanced Industry Capacity and Demand
Non-Proprietary Technology
Highly Observable Technology
Transactional Exchange
(A cost advantage can be easily imitated)
Implementing a Cost Leadership Strategy

8/7/2019 Presentation3 for CSM
http://slidepdf.com/reader/full/presentation3-for-csm 82/207
04/06/11 82
p g p gy
High Cost Conditions
Balanced Industry Capacity and Demand
Path Dependence (Historical Uniqueness)
Protected Technology
Highly Unobservable Technology (Causal Ambiguity)
Relational Exchange (Social Complexity)
(A cost advantage cannot be easily imitated)
A strategy is only as good as its
8/7/2019 Presentation3 for CSM
http://slidepdf.com/reader/full/presentation3-for-csm 83/207
04/06/11 83
A strategy is only as good as itsimplementation
Strategy is implemented through organizationalstructure and control:
• structure: 1) the division of managementresponsibilities, and 2) the establishment of reporting relationships
• control: policies intended to influence behavior—alignthe interests of the individual with the interests of theorganization
O i ti l St t
8/7/2019 Presentation3 for CSM
http://slidepdf.com/reader/full/presentation3-for-csm 84/207
04/06/11 84
Organizational Structure
Three Organizational Structures
Simple
Functional
Multi-Divisional

8/7/2019 Presentation3 for CSM
http://slidepdf.com/reader/full/presentation3-for-csm 85/207
04/06/11 85
Simple Structure
Owner / Manager
• Owner/Manager makes all major decisionsdirectly and monitors all activities
• difficult to maintain this structure as the firmgrows in size and complexity

8/7/2019 Presentation3 for CSM
http://slidepdf.com/reader/full/presentation3-for-csm 86/207
04/06/11 86
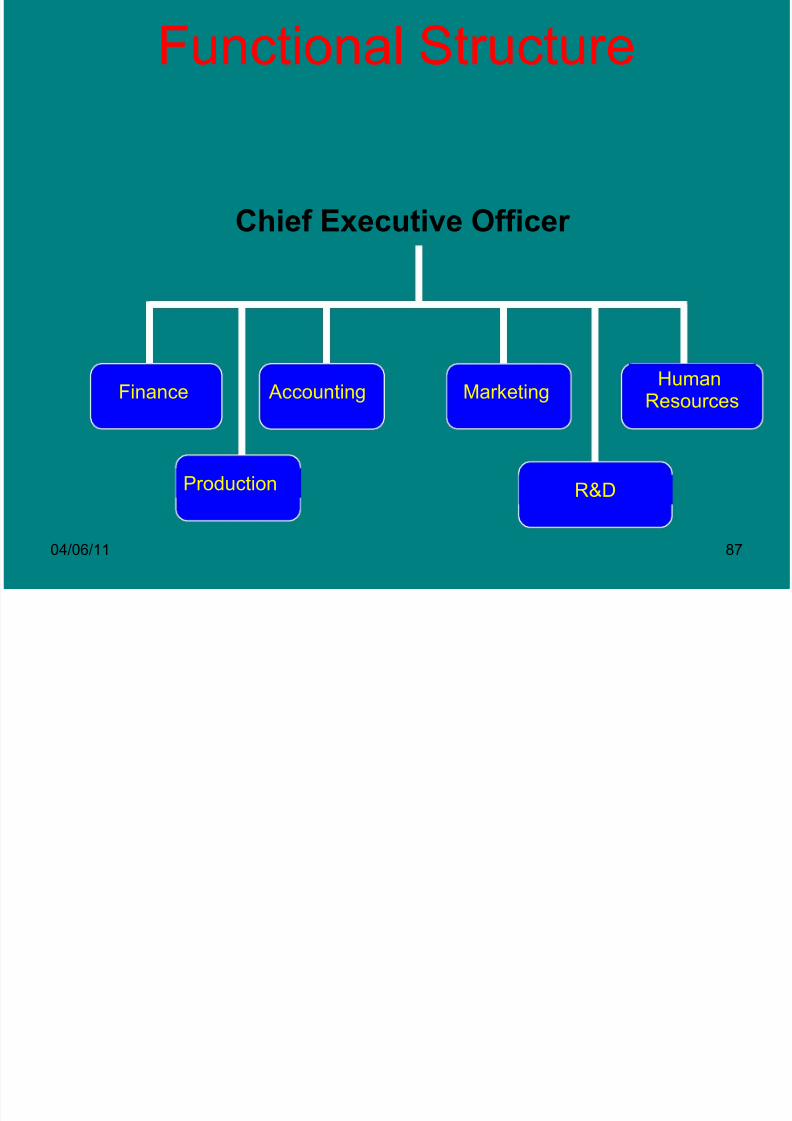
Functional Structure (U-Form: Unitary)
• divides management responsibilities by function
• marketing
• finance
• accounting
• procurement
• production
• R&D
• HR
• logistics
• etc.
• CEO is the only executive with enterprise-wideperspective
• CEO is responsible for strategy & coordinationof functions
Functional Structure
8/7/2019 Presentation3 for CSM
http://slidepdf.com/reader/full/presentation3-for-csm 87/207
04/06/11 87
Functional Structure
Production
Finance
R&D
Accounting MarketingHuman
Resources
Chief Executive Officer
8/7/2019 Presentation3 for CSM
http://slidepdf.com/reader/full/presentation3-for-csm 88/207
04/06/11 88
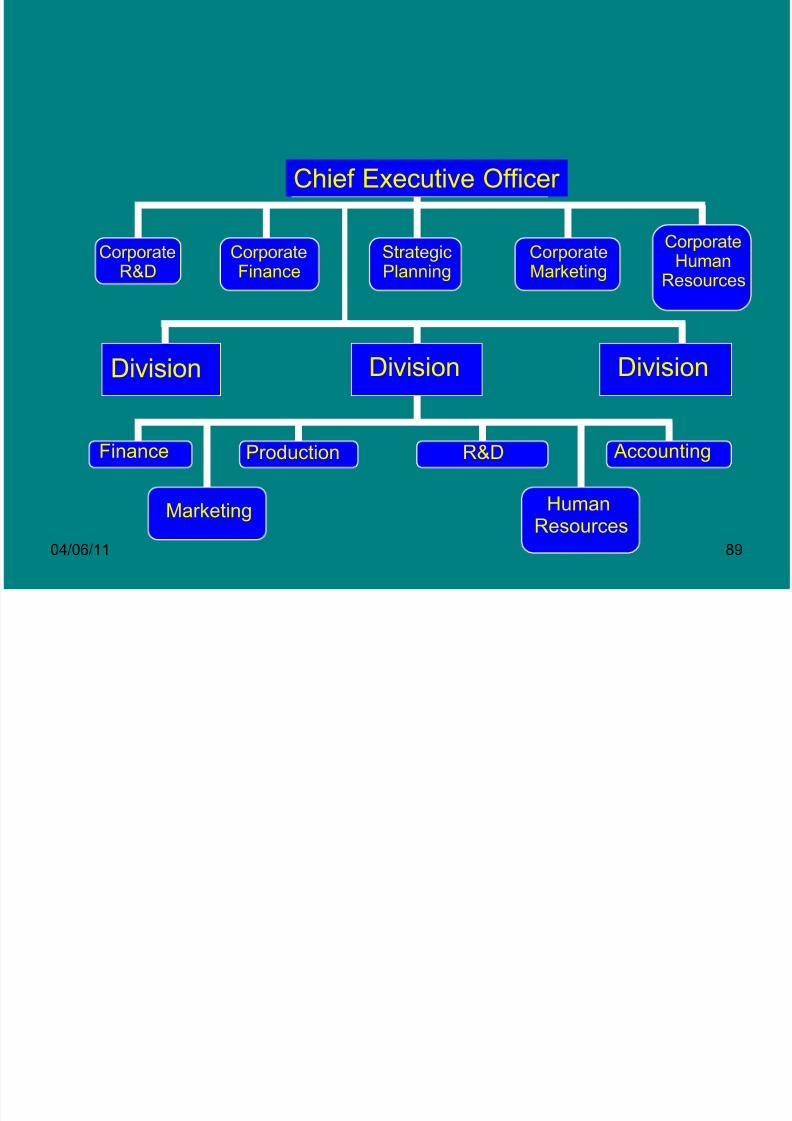
Multi-Divisional Structure (M-Form)
• functions are replicated in each division as appropriate
• this structure makes sense when the firm is involved
in more than one business or has grown large enoughto justify geographic divisions
• CEO balances coordination & competition amongdivisions
8/7/2019 Presentation3 for CSM
http://slidepdf.com/reader/full/presentation3-for-csm 89/207
04/06/11 89
StrategicPlanning
CorporateFinance
CorporateR&D
CorporateMarketing
ProductionFinance R&D Accounting
HumanResources
Division Division Division
Marketing
Chief Executive Officer
CorporateHuman
Resources
The Functional Structure and Cost
8/7/2019 Presentation3 for CSM
http://slidepdf.com/reader/full/presentation3-for-csm 90/207
04/06/11 90
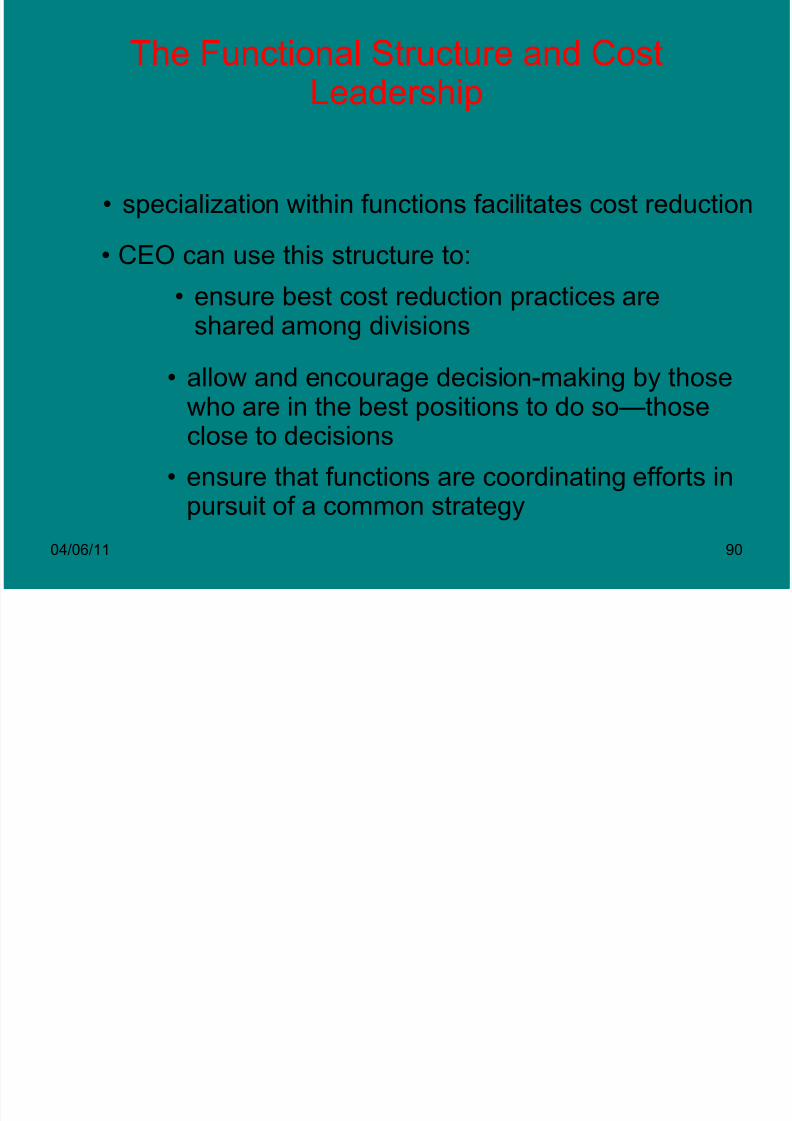
The Functional Structure and CostLeadership
• specialization within functions facilitates cost reduction
• CEO can use this structure to:
• ensure best cost reduction practices areshared among divisions
• allow and encourage decision-making by thosewho are in the best positions to do so—those
close to decisions
• ensure that functions are coordinating efforts inpursuit of a common strategy
O C

8/7/2019 Presentation3 for CSM
http://slidepdf.com/reader/full/presentation3-for-csm 91/207
04/06/11 91
Organizational Controls
Policies intended to influence behavior by aligningthe interests of the individual with the interests of the organization
Management Controls
Formal Informal
• culture• budgeting policies
• credit policies
• spending policies• travel policies
• purchasing policies
• attitudes
• leadership styles
8/7/2019 Presentation3 for CSM
http://slidepdf.com/reader/full/presentation3-for-csm 92/207
04/06/11 92
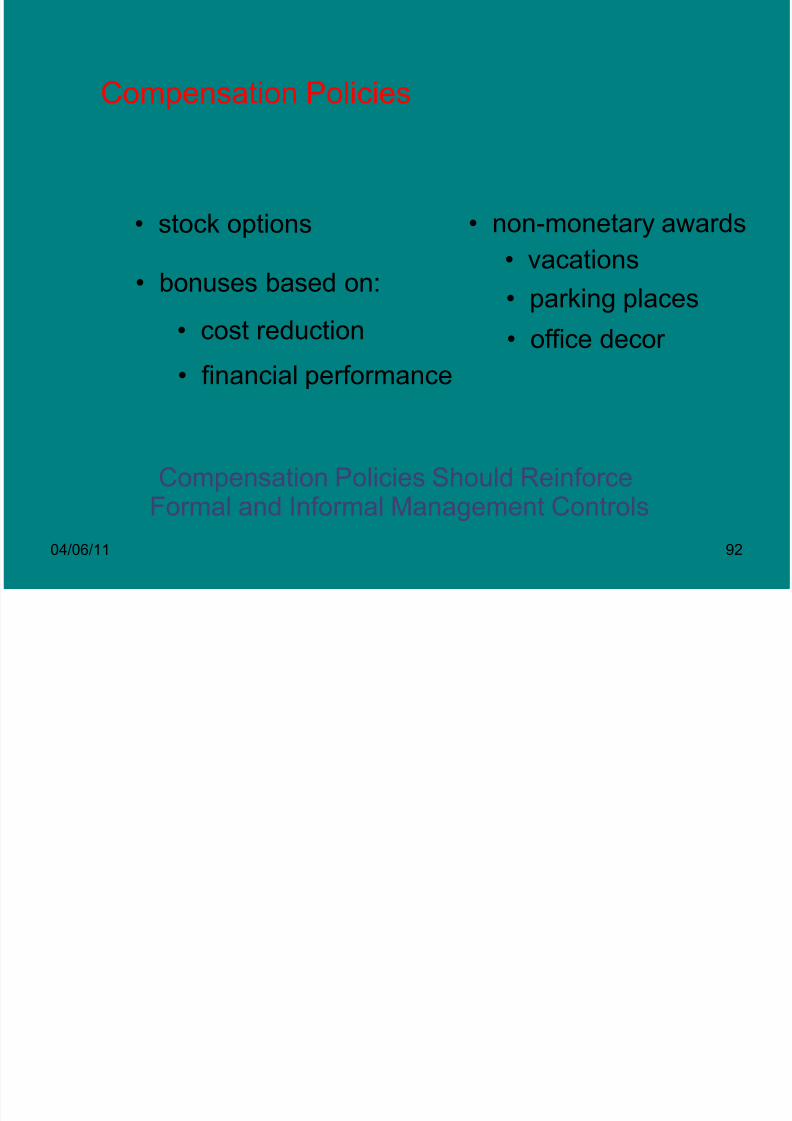
Compensation Policies
• stock options
• bonuses based on:• cost reduction
• financial performance
• non-monetary awards
• vacations
• parking places
Compensation Policies Should ReinforceFormal and Informal Management Controls
• office decor
8/7/2019 Presentation3 for CSM
http://slidepdf.com/reader/full/presentation3-for-csm 93/207
04/06/11 93
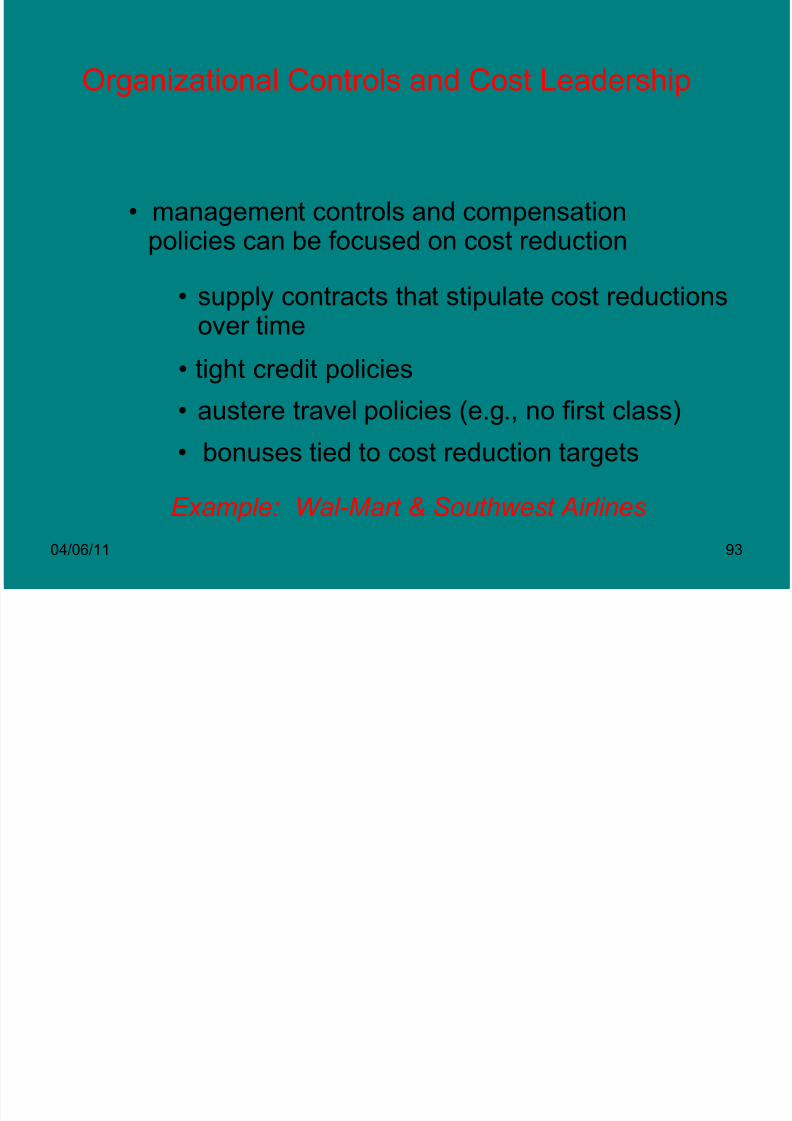
Organizational Controls and Cost Leadership
• management controls and compensationpolicies can be focused on cost reduction
• supply contracts that stipulate cost reductionsover time
• tight credit policies
• austere travel policies (e.g., no first class)
• bonuses tied to cost reduction targets
Example: Wal-Mart & Southwest Airlines
Summary
8/7/2019 Presentation3 for CSM
http://slidepdf.com/reader/full/presentation3-for-csm 94/207
04/06/11 94
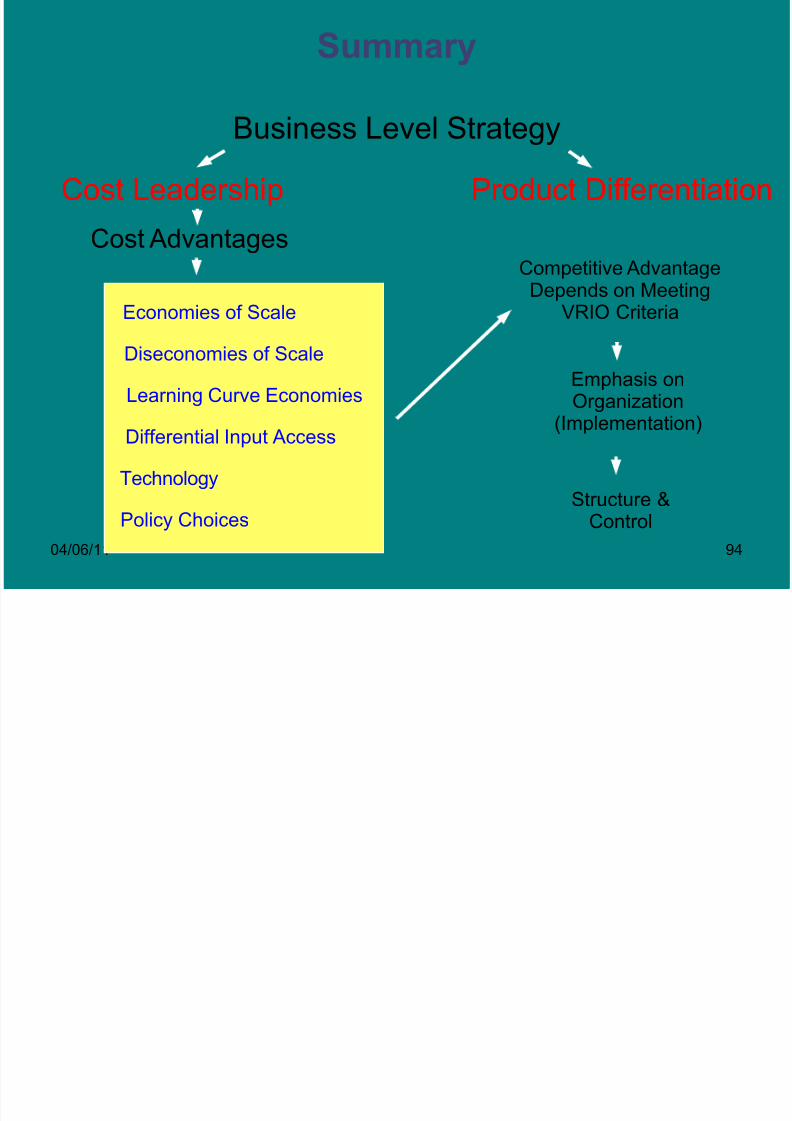
Business Level Strategy
Cost Leadership Product Differentiation
Cost Advantages
Economies of Scale
Diseconomies of Scale
Learning Curve Economies
Differential Input Access
Technology
Policy Choices
Competitive Advantage
Depends on MeetingVRIO Criteria
Emphasis onOrganization
(Implementation)
Structure &Control
Advantages and Disadvantages of

8/7/2019 Presentation3 for CSM
http://slidepdf.com/reader/full/presentation3-for-csm 95/207
04/06/11 95
g gCost-leadership Strategy
• Advantages - charge a lower price yet make the same
level of profit. - win in the price war. - low-cost as an entry barrier. - protected from rivals. - less affected by powerful buyers and
suppliers. - room to reduce its price to compete with
substitute products.
•

8/7/2019 Presentation3 for CSM
http://slidepdf.com/reader/full/presentation3-for-csm 96/207
04/06/11 96
• Disadvantages - technological advancement makes the low
cost advantage outdated. - imitation ability of competitors. - lose sight of changes in customers’ tastes
•
Differentiation Strategy
8/7/2019 Presentation3 for CSM
http://slidepdf.com/reader/full/presentation3-for-csm 97/207
04/06/11 97
Differentiation Strategy
• Do everything to achieve a CA through producingproducts or services that are unique to customers charge a premium price.
•
• Achieved in 3 principal ways – quality, innovation, &
responsiveness to customers•
• Try to differentiate along as many dimensions aspossible – the bases of differentiation are endless(prestige, status,…)
•
• R&D, Sales, & Marketing functions are center of attention.
•
• Serve many market segments (i.e., a broad
Advantages and Disadvantages of

8/7/2019 Presentation3 for CSM
http://slidepdf.com/reader/full/presentation3-for-csm 98/207
04/06/11 98
g gDifferentiation Strategy
• Advantages - Premium price.
- Protected from rivals. (i.e., brand loyalty,customer loyalty..)
- Brand loyalty as an entry barrier.
- Less affected by powerful buyers andsuppliers.
•
8/7/2019 Presentation3 for CSM
http://slidepdf.com/reader/full/presentation3-for-csm 99/207
04/06/11 99
• Disadvantages - Substitutes can be a possible threat.
- Difficult to maintain a product’s uniquenessin customers’ eyes for a long time.
Focus Strategy

8/7/2019 Presentation3 for CSM
http://slidepdf.com/reader/full/presentation3-for-csm 100/207
04/06/11 100
Focus Strategy
• Try to achieve a CA by serving the needs of a specificmarket segment or niche (i.e. geographically, productline, customer type,..).
•
• Pursue a focus strategy through either a low-cost
approach or a differentiation - focused cost-leadership - focused differentiation (i.e., a specialized
differentiator)
•
• Try to build market share in one or a few marketsegments and, if successful, then begin to serve moresegments.
•
• Pursue any distinctive competency
Advantages and Disadvantages of
8/7/2019 Presentation3 for CSM
http://slidepdf.com/reader/full/presentation3-for-csm 101/207
04/06/11 101
Focused Strategy
• Advantages - Exploration of a gap in the market
customer loyalty.
- Stay close to its customers and respond totheir changing needs. (faster in innovations).
- In general, a focused firm is O.K. againstthe threats of five forces.
•

8/7/2019 Presentation3 for CSM
http://slidepdf.com/reader/full/presentation3-for-csm 102/207
04/06/11 102
• Disadvantages - Cost disadvantage relative to low-cost
leader b/c of a small volume.
- Susceptible to attack from a broaddifferentiator.
- Technological change or changes incustomers’ tastes can make a niche marketdisappear.
•
Just-in time system
8/7/2019 Presentation3 for CSM
http://slidepdf.com/reader/full/presentation3-for-csm 103/207
04/06/11 103
Just-in time system
• The star recognition of Japan's distinguishing features.• The most distinctive feature of Japan is the lack of natural
resources, which makes it necessary to import vast amounts of materials
including food.
• The second distinctive feature is that Japanese concept of work,such
as consciousness and attitude, differed from that held by theEuropean and
American workers. The Japanese traits include: (
• 1) group consciousness, sense of equality, desire to improve, and
diligence born from !L long history of' a homogeneous race;• (2) high degree of ability resulting from higher education brought by desire to improve;
• (3) centering their daily living around work.
8/7/2019 Presentation3 for CSM
http://slidepdf.com/reader/full/presentation3-for-csm 104/207
04/06/11 104
• Upon recognition of the matters related above, Toyota planned andfollowed the following two basic concepts:
• Attain low cost production is "reduction of cost through elimination of waste".
• This involves making up a system that will thoroughly eliminatewaste by assuming that anything other than the minimum amount
of equipment, materials, parts, and workers (working time) whichare absolutely essential to production are merely surplus thatonly raises the cost.
• The second recognition of Japanese diligence, high degree of ability, and favoured labour environment is " to make full use of the workers' capabilities". In short, treat the workers as human
beings and with consideration. Build up a system that will allowthe workers to and with consideration. Build up a system that willallow the workers to display their full capabilities by themselves
•
•
•
8/7/2019 Presentation3 for CSM
http://slidepdf.com/reader/full/presentation3-for-csm 105/207
04/06/11 105
• Cost cutting by through removal of waste• Just in time production:
• shorten the lead time from the entry of materials
• to the completion of vehicle. by maintainingthe conformity to changes by having " allprocesses produce the necessary parts at
the necessary time and have on hand onlythe minimum stock necessary to hold theprocesses together".
• In addition, by checking the degree of
inventory quantity and production lead time
8/7/2019 Presentation3 for CSM
http://slidepdf.com/reader/full/presentation3-for-csm 106/207
04/06/11 106
• Withdrawal by subsequent processes: The first requirement of just-in-time production is to enableall processes to quickly gain accurate knowledgeof , timing and quantity required'.
• In order to materialize the first requirement, Toyota
adopted a reverse method of " the following processwithdrawing the parts from the preceding process "instead of the "the preceding process supplying theparts to the following process ".
• The reason for this is as follows: Just-in-timeproduction is production of parts by the variousprocesses in the necessary amounts at necessarytiming for assembling a vehicle as a final product of the company.
•
•

8/7/2019 Presentation3 for CSM
http://slidepdf.com/reader/full/presentation3-for-csm 107/207
04/06/11 107
• One piece production and conveyance:The second requirement of justin-timeproduction is that all processes
approach the condition where eachprocess can produce only one piece,can convey it one at a time, and inaddition, have only one piece in stock
both between the equipment and theprocesses.
• This means that no process for any
reason is allowed to produce extra
8/7/2019 Presentation3 for CSM
http://slidepdf.com/reader/full/presentation3-for-csm 108/207
04/06/11 108
• Leveling of production: Provided that all processes perform small lot process variesconsiderably, the processes within thecompany as well as the production and
conveyance, if the quantity to be withdrawnby the subsequent subcontractors willmaintain peak capacity or holdingexcessive inventory at subcontractors willmaintain peak capacity or holding
excessive inventory at all times.• Therefore, in order to make a just-in-time
production possible, the prerequisite will beto level the production at the. finalassembly line (the most important line that
ives out the roduction instructions to all

8/7/2019 Presentation3 for CSM
http://slidepdf.com/reader/full/presentation3-for-csm 109/207

8/7/2019 Presentation3 for CSM
http://slidepdf.com/reader/full/presentation3-for-csm 110/207
04/06/11 110
• Jidoka: The term' Jidoka' as used at Toyota means' to make the equipmentor operation stop whenever an abnorm
al or defective condition arises '.• In short, its distinctive feature lies in the
fact that when an equipment trouble or machining defect happens, the
equipment or entire line stops, and anyline with workers can be stopped bythem.
•
8/7/2019 Presentation3 for CSM
http://slidepdf.com/reader/full/presentation3-for-csm 111/207
04/06/11 111
• The reasons for' Jidoka ' being so important are asfollows:
• (1) To prevent making too much. If the equipment ismade to stop
when the required amount is produced, making too
much cannot arise.• Consequently, the just-in-time production can be
accurately carried out.
• (2) Control of abnormality becomes easy. It will only'be necessary to
make improvements by directing attention to thestopped equipment
• and the worker who did the stopping. This is animportant requirement when making up the systemof ' full utilization of workers'

8/7/2019 Presentation3 for CSM
http://slidepdf.com/reader/full/presentation3-for-csm 112/207
8/7/2019 Presentation3 for CSM
http://slidepdf.com/reader/full/presentation3-for-csm 113/207
04/06/11 113
• Considerations to workers' safety:• Self-display of workers' ability:
• Aim of Kanban System
• A production control system for just-in-time production and making full use of workers' capabilities is the Kanban
System• . Utilizing Kanban System, workshops of
Toyota have no longer relied upon anelectronic computer.
8/7/2019 Presentation3 for CSM
http://slidepdf.com/reader/full/presentation3-for-csm 114/207
04/06/11 114
• The reasons to have employedKanbanSystem instead. of computerizedsystem are as follows:
• (1) Reduction of cost processing information.
• (2) Rapid and precise acquisition of facts.
• (3) Limiting surplus
• 3.2 Description of Kanban system
• (I) In the Kanban System, a form of order card called Kanban is used. These come intwo kinds, one of which is called'conveyance Kanban ' that is carried when
going from one process to the preceding
8/7/2019 Presentation3 for CSM
http://slidepdf.com/reader/full/presentation3-for-csm 115/207
04/06/11 115
• , production Kanban' and is used to order production of the portion withdrawn by thesubsequent process.
• These two kinds of Kanban are always attached tothe containers holding parts.
• (2) When content of a container begins to beused, conveyance Kanban is removed from thecontainer. A worker takes this conveyanceKanban and goes to the stock point of thepreceding process to pick up this part.
• He then attaches this conveyance Kanban to thecontainer holding this part.

8/7/2019 Presentation3 for CSM
http://slidepdf.com/reader/full/presentation3-for-csm 116/207
04/06/11 116
• (3) Then, the' production Kanban 'attached to the container is removedand becomes a dispatching information
for the process. They produce the part toreplenish it withdrawn as early aspossible
• (4) Thus, the production activities of the
final assembly line are connected in amanner like a chain to the precedingprocesses or to the subcontractors and
materialize the just-in-time production of

8/7/2019 Presentation3 for CSM
http://slidepdf.com/reader/full/presentation3-for-csm 117/207
04/06/11 117
• In the past, economic assessment of alternative
designs, constructions, or other
investments has been based on initial (first) cost which ignores
the total cost
incurred for the investment throughout itslifetime.
• The concept of life cycle costing providesan
LIFE CYCLE COSTING

8/7/2019 Presentation3 for CSM
http://slidepdf.com/reader/full/presentation3-for-csm 118/207
04/06/11 118
• Life Cycle Costing (LCC) also called Whole Life Costing is atechnique to establish the total cost of ownership. It is astructured approach that addresses all the elements of this costand can be used to produce a spend profile of the product or service over its anticipated life-span. The results of an LCC
analysis can be used to assist management in the decisionmakingprocess where there is a choice of options. The accuracy
• of LCC analysis diminishes as it projects further into the future,so it is most valuable as a comparative tool when long termassumptions apply to all the options and consequently have thesame impact.This briefing provides general guidance on LCC.

8/7/2019 Presentation3 for CSM
http://slidepdf.com/reader/full/presentation3-for-csm 119/207

8/7/2019 Presentation3 for CSM
http://slidepdf.com/reader/full/presentation3-for-csm 120/207
04/06/11 120
• The life cycle costing can be defined asfollows:
an economic assessment of alternatives
designs,construction, or other investment
considering all
significant costs of initial costs andownership costsover economic life of each alternative,
expressed in

8/7/2019 Presentation3 for CSM
http://slidepdf.com/reader/full/presentation3-for-csm 121/207
04/06/11 121
Introduction Growth Maturity Saturation Decline
Small number of innovativecustomers
Imitators/customersunwilling to
change
Increase incompetitiveproducts
Pressure for new product
TechnologyChangePrefer security
of tried brandsMarketbroadened
Marketleadership
under pressure
Profit fall Change infashion/
tastesDifficulties ineffectivedistribution
Productimprovements
Costeconomiesused up
Intensifiedmarketingeffortprolong
ReducedprofitabilityTechnical
problemsDistributorsincrease.
Prices soften
LimitedCapacity
Product Life Cycle and Cost control
8/7/2019 Presentation3 for CSM
http://slidepdf.com/reader/full/presentation3-for-csm 122/207
04/06/11 122
y
• The life cycle costing analysis can not be carried out without considering the followings:
• A - Total Costs
• B - The concept of the time value of money
• A - Total Costs- Initial costs- Owner costs
• Initial costs. They include the followings:- initial construction costs- design costs-and costs-finance costs
Product Life Cycle and Cost control

8/7/2019 Presentation3 for CSM
http://slidepdf.com/reader/full/presentation3-for-csm 123/207
04/06/11 123
y
• Product life cycle costing is the process of enhancing control over manufacturing costs during different product life stages .
• It is therefore necessary to track and measure cost at every stage.LCCused to provide long term profitability of the product
• What are product life cycle cost?
1. Acquisition Cost- Research. Design testing, production, construction or
purchase of capital equipment.2. Transportation and handling costs.
3. Equipment maintenance cost.
4. Operation costs.
5. Training costs.
6. Inventory costs.
7. Technical costs.
8. Retirement and disposal costs.
9.
10.
11.
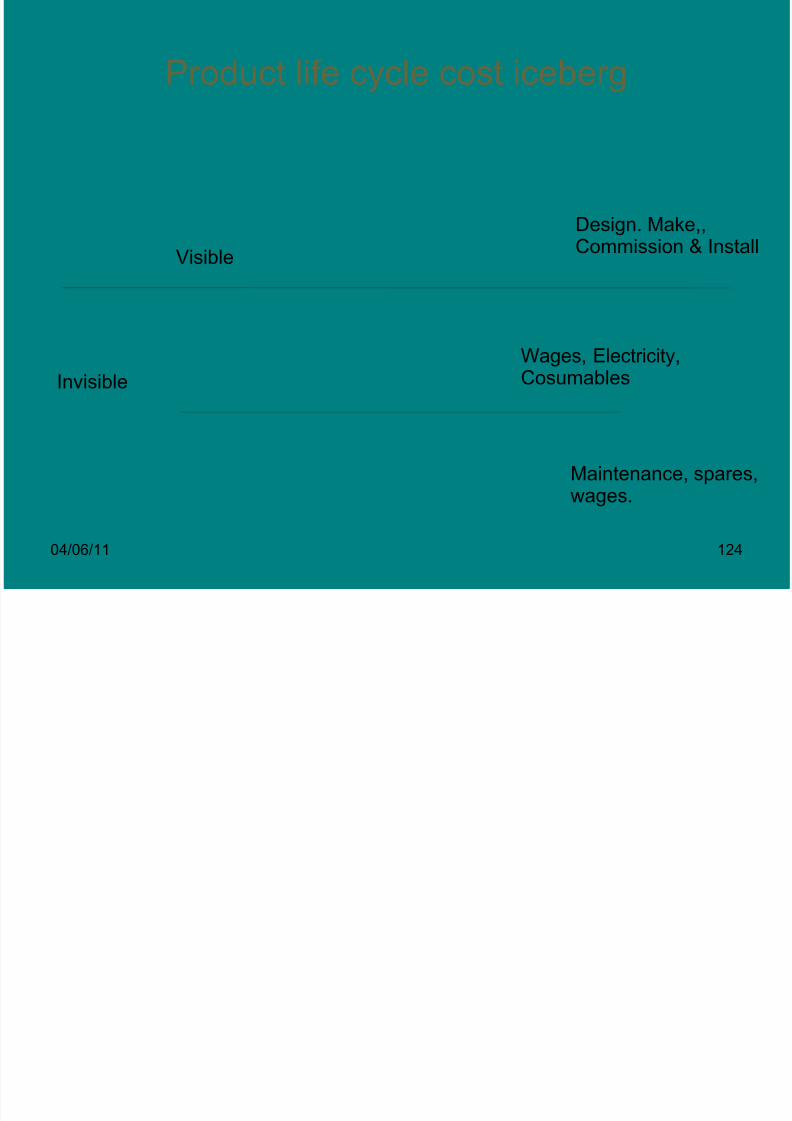
Product life cycle cost iceberg
8/7/2019 Presentation3 for CSM
http://slidepdf.com/reader/full/presentation3-for-csm 124/207
04/06/11 124
y g
Visible
Invisible
Design. Make,,Commission & Install
Wages, Electricity,Cosumables
Maintenance, spares,wages.
8/7/2019 Presentation3 for CSM
http://slidepdf.com/reader/full/presentation3-for-csm 125/207
04/06/11 125
•
•
• Life cycle cost: sum of money expended in termsof labor, materials, use of equipment, etc to
produce a product or service during the lifecycle
• Management related costs: research anddevelopment
• Design related costs
8/7/2019 Presentation3 for CSM
http://slidepdf.com/reader/full/presentation3-for-csm 126/207
04/06/11 126
• Design related costs (Cost Breakdown Structure)• Production and construction cost
• Manufacturing management, manufacturing, quality control,initial logistic support …
• Operation and support cost (the most significant andthe most difficult to predict)• Product operation, product distribution, product maintenance,inventory inventory…
• Retirement and disposal cost (difficult to assessquantitatively)
• Disposal of non non-repairable, product retirement, documentation
•
8/7/2019 Presentation3 for CSM
http://slidepdf.com/reader/full/presentation3-for-csm 127/207
8/7/2019 Presentation3 for CSM
http://slidepdf.com/reader/full/presentation3-for-csm 128/207
04/06/11 128
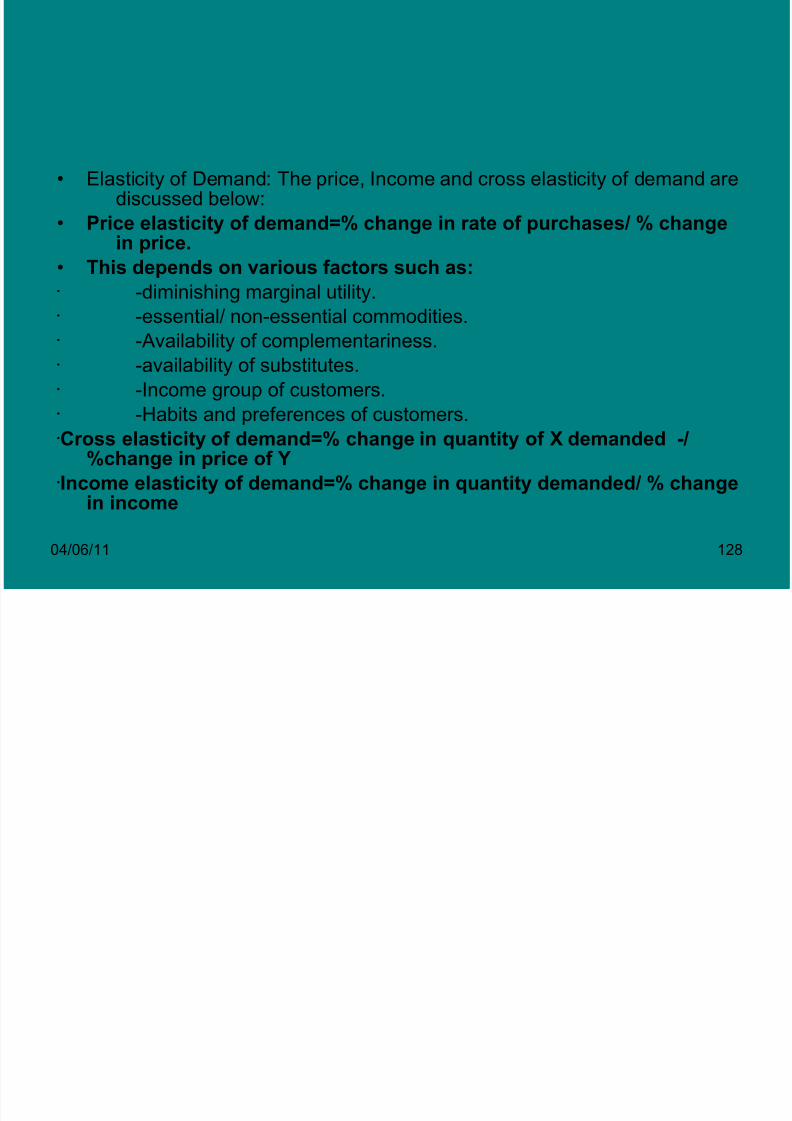
• Elasticity of Demand: The price, Income and cross elasticity of demand arediscussed below:
• Price elasticity of demand=% change in rate of purchases/ % changein price.
• This depends on various factors such as:
-diminishing marginal utility. -essential/ non-essential commodities. -Availability of complementariness. -availability of substitutes. -Income group of customers. -Habits and preferences of customers.Cross elasticity of demand=% change in quantity of X demanded -/
%change in price of YIncome elasticity of demand=% change in quantity demanded/ % change
in income

8/7/2019 Presentation3 for CSM
http://slidepdf.com/reader/full/presentation3-for-csm 129/207
8/7/2019 Presentation3 for CSM
http://slidepdf.com/reader/full/presentation3-for-csm 130/207
04/06/11 130
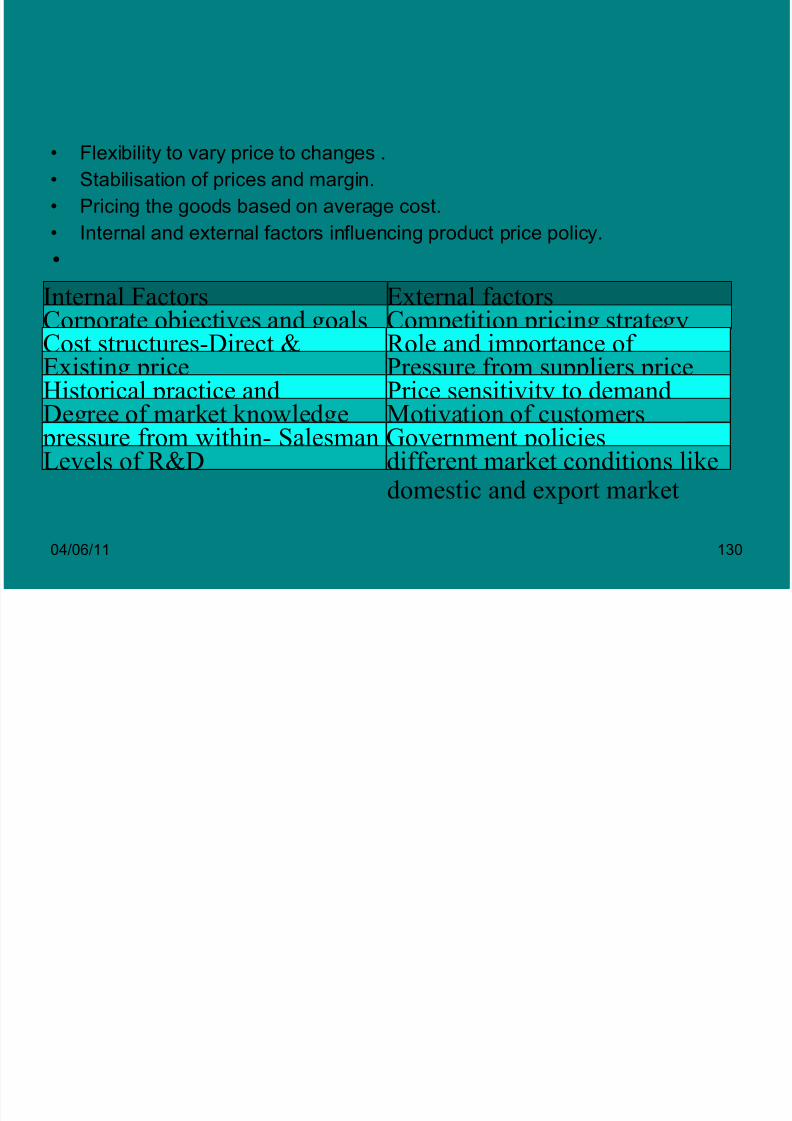
• Flexibility to vary price to changes .• Stabilisation of prices and margin.
• Pricing the goods based on average cost.
• Internal and external factors influencing product price policy.
•
Internal Factors External factorsCorporate objectives and goals Competition pricing strategyCost structures-Direct &Indirect
Role and importance of distributor Existing price Pressure from suppliers price
Historical practice andprecedent
Price sensitivity to demandDegree of market knowledge Motivation of customers
pressure from within- Salesman Government policiesLevels of R&D different market conditions like
domestic and export market
Role of Cost in Pricing
8/7/2019 Presentation3 for CSM
http://slidepdf.com/reader/full/presentation3-for-csm 131/207
04/06/11 131
• Cost is the fundamental element in pricing of a product.• Higher the cost higher the price.
• Cost of sales promotion, distribution etc also push up the priceupwards.
• Cost is considered as the floor below which a company normally willnot fix the price.
• If cost cannot be recovered in the price the company will have toconsider whether to retain such a product in the production line.
• What are relevant cost for pricing decision?
• Though in the long run all costs are to be considered , in the shortrun direct costs are relevant.
• In a multi product division direct cost is relevant cost, but the pricingshould result in contribution towards common costs and to therealisation of profit.
•
Cost based Pricing

8/7/2019 Presentation3 for CSM
http://slidepdf.com/reader/full/presentation3-for-csm 132/207
04/06/11 132
• Full cost pricing- This is most conventional and popular method of costing of a product or service.. Indirect taxes like Excise duty,forwarding charges are to be included in the price.
•
8/7/2019 Presentation3 for CSM
http://slidepdf.com/reader/full/presentation3-for-csm 133/207
8/7/2019 Presentation3 for CSM
http://slidepdf.com/reader/full/presentation3-for-csm 134/207
04/06/11 134
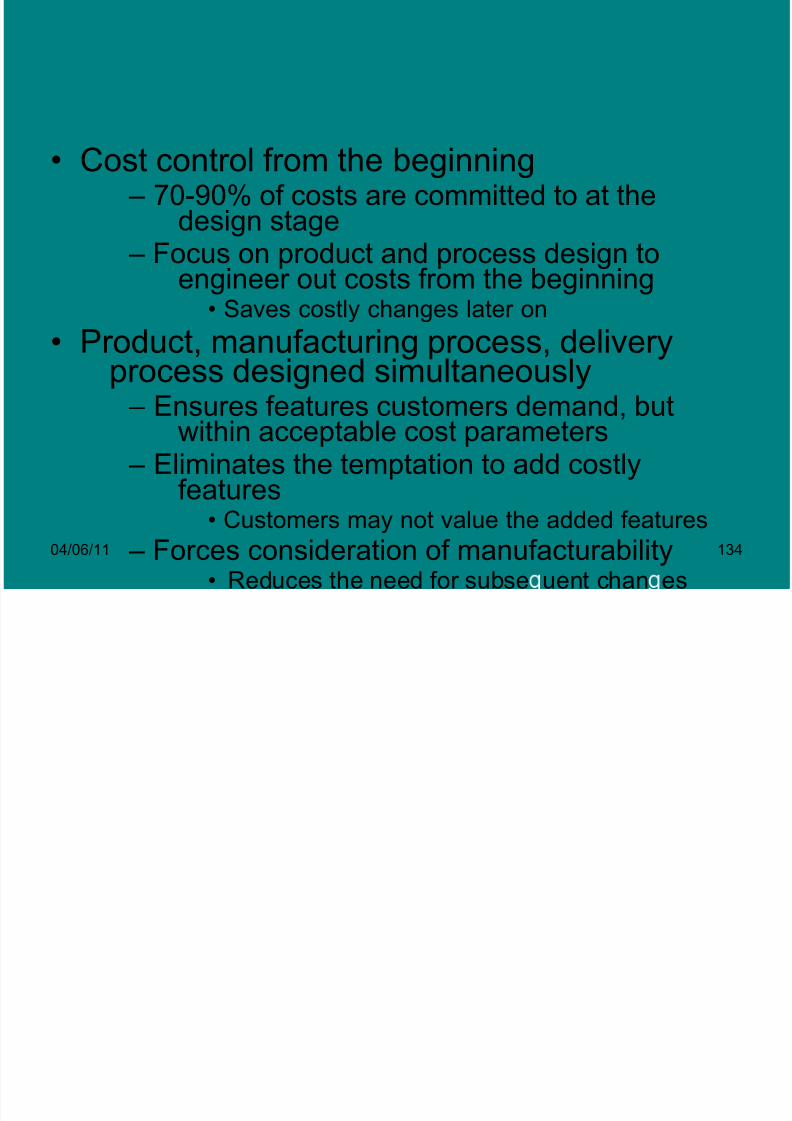
• Cost control from the beginning– 70-90% of costs are committed to at the
design stage– Focus on product and process design to
engineer out costs from the beginning• Saves costly changes later on
• Product, manufacturing process, deliveryprocess designed simultaneously
– Ensures features customers demand, but
within acceptable cost parameters– Eliminates the temptation to add costly
features• Customers may not value the added features
– Forces consideration of manufacturability• Reduces the need for subse uent chan es

8/7/2019 Presentation3 for CSM
http://slidepdf.com/reader/full/presentation3-for-csm 135/207
04/06/11 135
• Cost control at all phases of the productlife cycle
– Design
– Production
– Delivery/setup
– Customer’s cost of ownership
• Emphasizes future sales instead of currentcost savings
– Service and repair – Disposal and recycling
Cross Functional Team

8/7/2019 Presentation3 for CSM
http://slidepdf.com/reader/full/presentation3-for-csm 136/207
04/06/11 136
• Marketing
• Design/engineering
• Manufacturing• Purchasing
– Including suppliers
• Distribution
• Service/support
• Cost accounting
• Finance
• Legal
Target Costing Process
8/7/2019 Presentation3 for CSM
http://slidepdf.com/reader/full/presentation3-for-csm 137/207
04/06/11 137
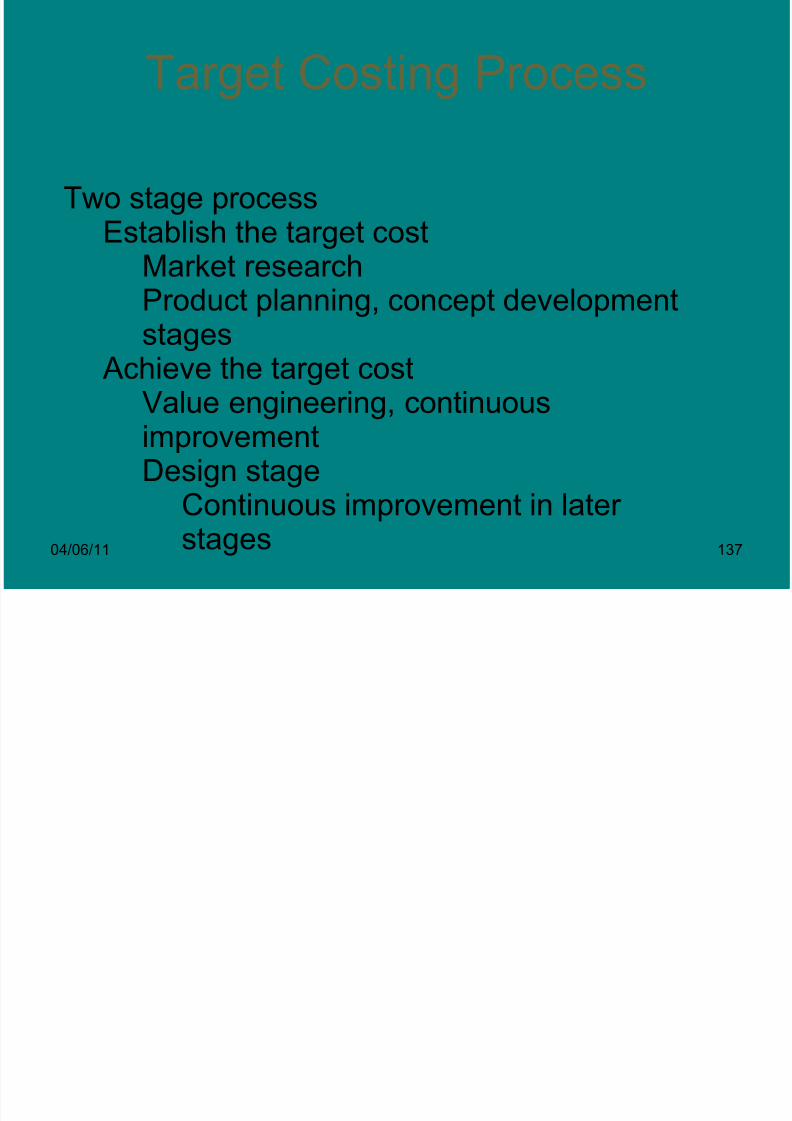
Two stage processEstablish the target cost
Market research
Product planning, concept developmentstages
Achieve the target costValue engineering, continuous
improvementDesign stage
Continuous improvement in later stages
Establishing the Target Cost

8/7/2019 Presentation3 for CSM
http://slidepdf.com/reader/full/presentation3-for-csm 138/207
04/06/11 138
• Determine the product and its market– Who is the target market?
– What do they want?
– What do competitors offer?• Introduce concept or prototype
– Evolutionary or revolutionary?
– Refine until it meets customer needs
8/7/2019 Presentation3 for CSM
http://slidepdf.com/reader/full/presentation3-for-csm 139/207
04/06/11 139
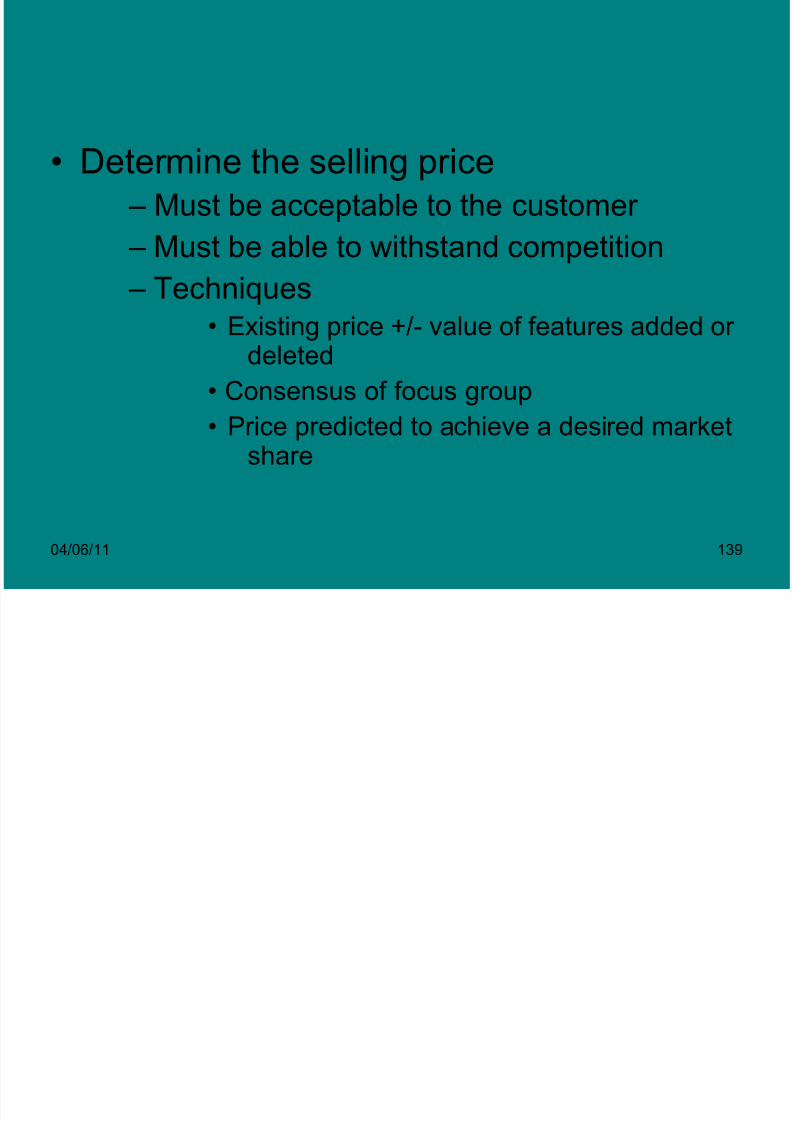
• Determine the selling price– Must be acceptable to the customer
– Must be able to withstand competition
– Techniques• Existing price +/- value of features added or
deleted
• Consensus of focus group
• Price predicted to achieve a desired marketshare

8/7/2019 Presentation3 for CSM
http://slidepdf.com/reader/full/presentation3-for-csm 140/207
04/06/11 140
• Determine the required profit– Return on sales
• Desired return
• Historical return for similar products
• Industry average for similar products
– Return on sales will fluctuate over the lifeof the product
• Price and costs fluctuate• Unit price, cost and profit are almost
meaningless because they fluctuate
– Life cycle totals are more meaningful
8/7/2019 Presentation3 for CSM
http://slidepdf.com/reader/full/presentation3-for-csm 141/207
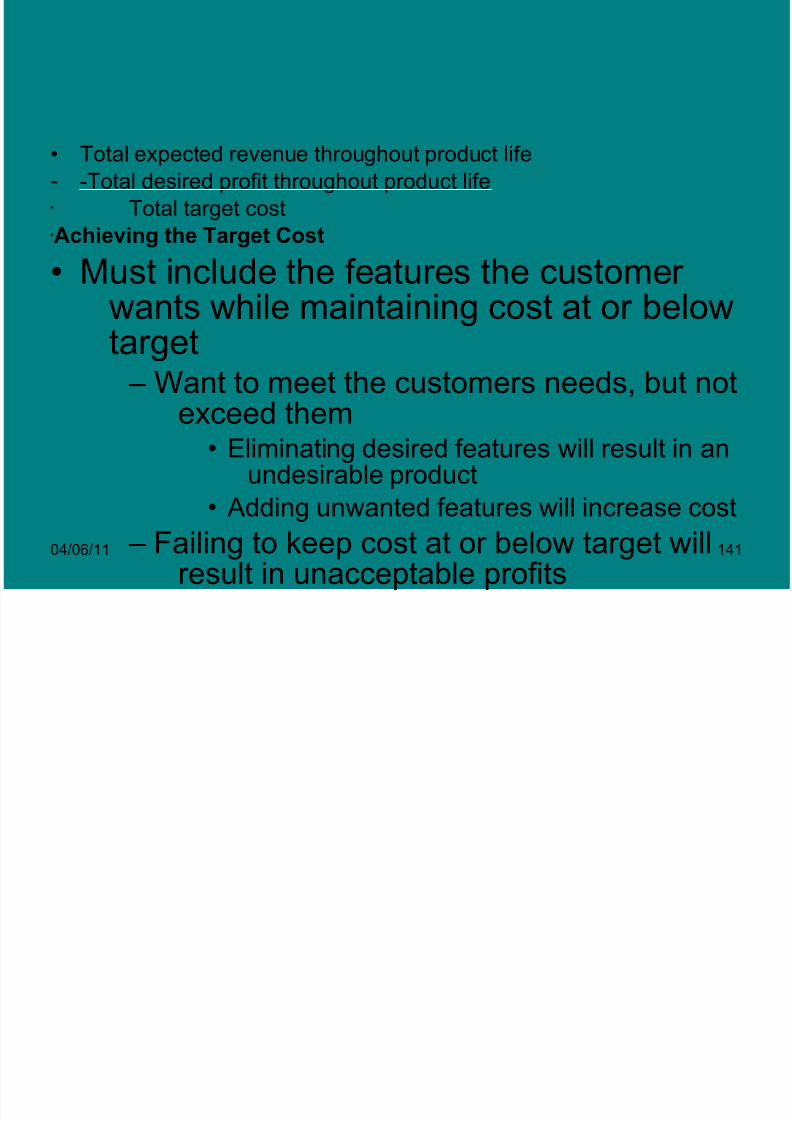
04/06/11 141
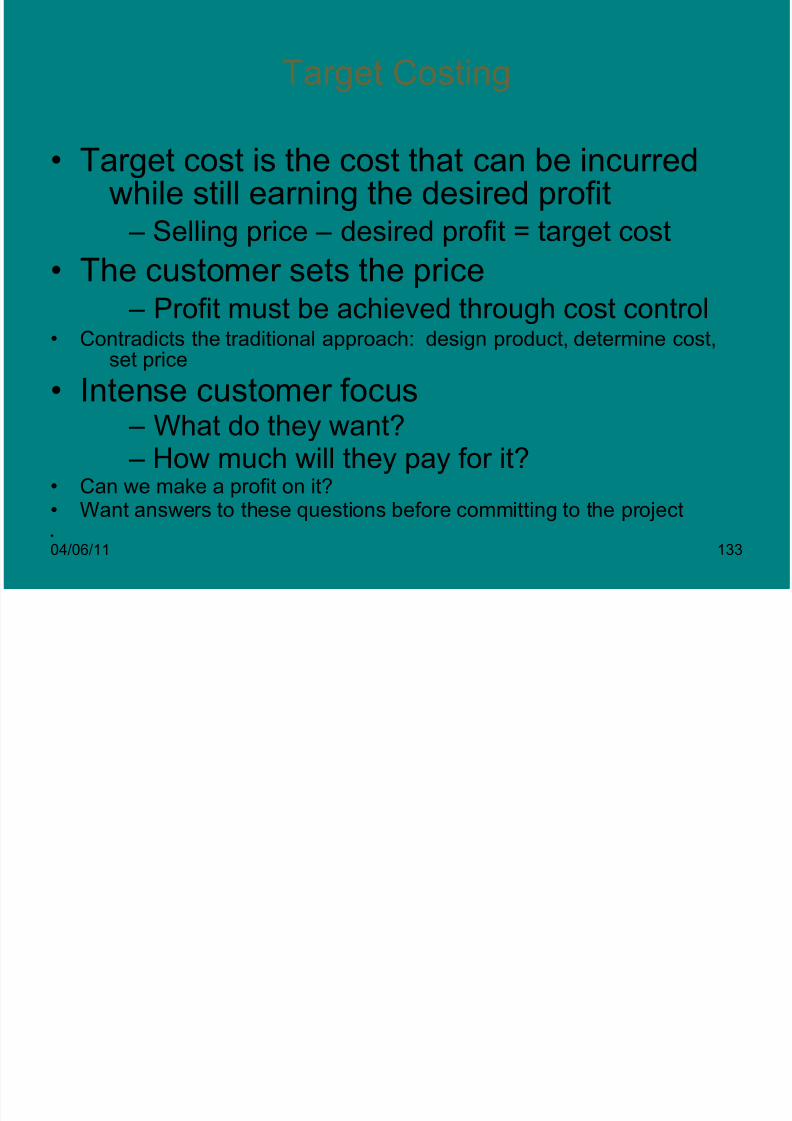
• Total expected revenue throughout product life- -Total desired profit throughout product life Total target costAchieving the Target Cost
• Must include the features the customer
wants while maintaining cost at or belowtarget
– Want to meet the customers needs, but notexceed them
• Eliminating desired features will result in anundesirable product
• Adding unwanted features will increase cost
– Failing to keep cost at or below target will
result in unacceptable profits

8/7/2019 Presentation3 for CSM
http://slidepdf.com/reader/full/presentation3-for-csm 142/207
04/06/11 142
EXHIBIT 1CUSTOMER REQUIREMENT RANKINGS
Less More Raw % of Total
Customer Requirement Important Score Raw Score
1 2 3 4 5 1 2 3 4 5
Multiple speeds 4 4 14.8%
Horizontal oscillation 3 3 11.1%
Vertical oscillation 1 1 3.7%Light weight 4 4 14.8%
Adjustable height 1 1 3.7%
Airflow capacity 4 4 14.8%
Quietness 5 5 18.5%
Compact size 3 3 11.1%
Looks nice 2 2 7.4%
Total 27 100%
Us
Competitor
Both
Important
Competitive
Comparison
Ranking
8/7/2019 Presentation3 for CSM
http://slidepdf.com/reader/full/presentation3-for-csm 143/207

8/7/2019 Presentation3 for CSM
http://slidepdf.com/reader/full/presentation3-for-csm 144/207
04/06/11 144
• Determine the cost gap between currentcost and allowable cost
– Current cost is based on
• Currently used components
• Current suppliers
• Current manufacturing processes
• Current distribution network
• Etc.

8/7/2019 Presentation3 for CSM
http://slidepdf.com/reader/full/presentation3-for-csm 145/207
04/06/11 145
• Decompose the cost gap(Exibit 2)– Life cycle decomposition
• Cost reduction goals are divided among thefunctions in the product’s life cycle
– Design/engineering– Manufacturing
– Sales/distribution
– Service/support
– General administration– Etc.
8/7/2019 Presentation3 for CSM
http://slidepdf.com/reader/full/presentation3-for-csm 146/207
04/06/11 146
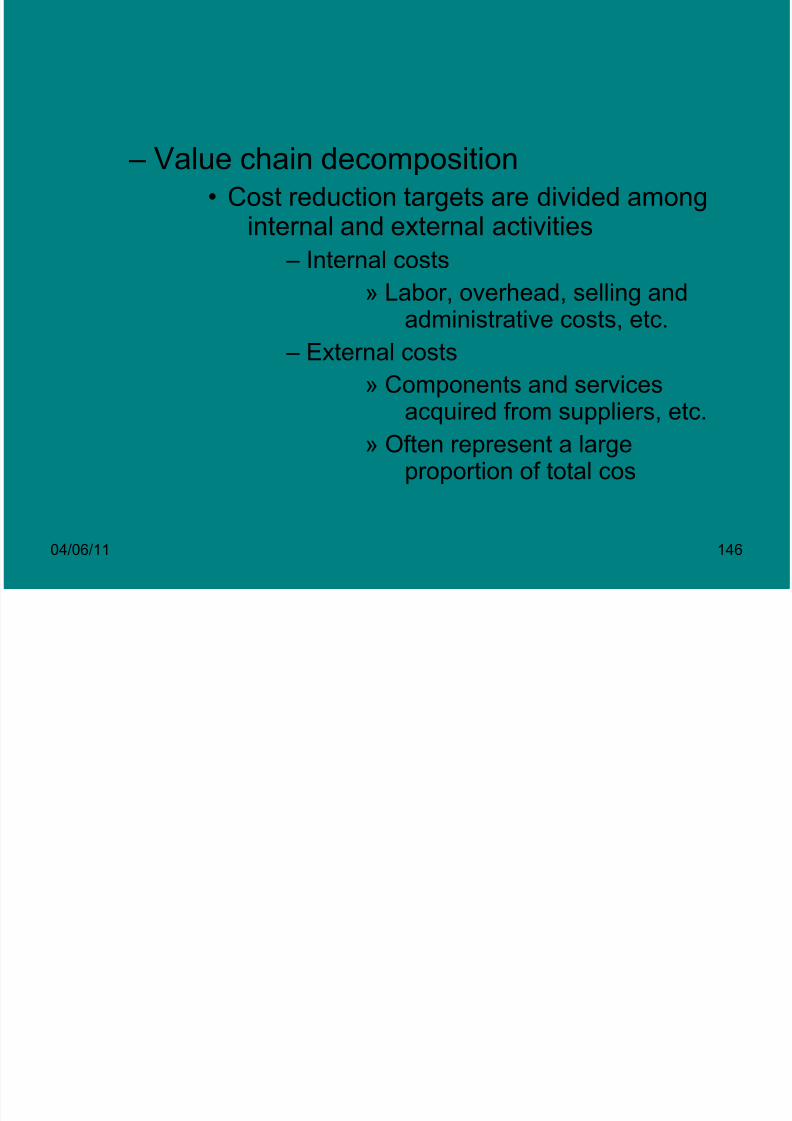
– Value chain decomposition• Cost reduction targets are divided among
internal and external activities
– Internal costs
» Labor, overhead, selling andadministrative costs, etc.
– External costs
» Components and servicesacquired from suppliers, etc.
» Often represent a largeproportion of total cos
8/7/2019 Presentation3 for CSM
http://slidepdf.com/reader/full/presentation3-for-csm 147/207
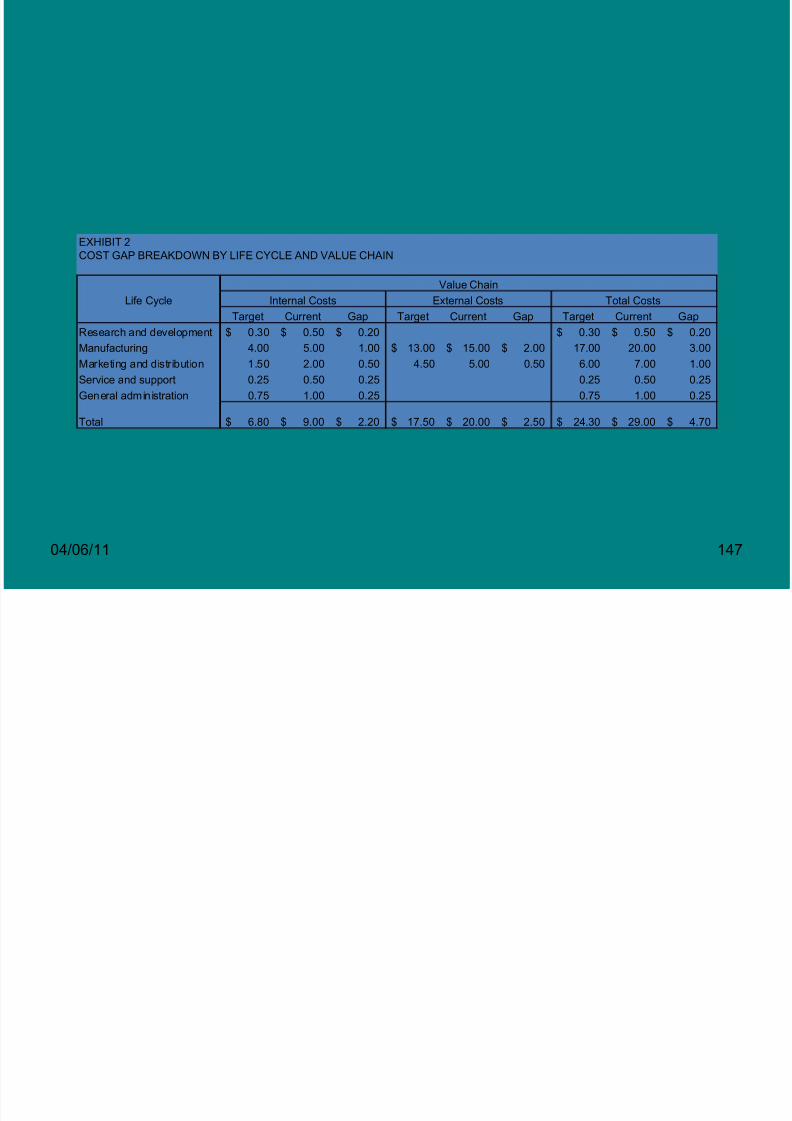
04/06/11 147
EXHIBIT 2COST GAP BREAKDOWN BY LIFE CYCLE AND VALUE CHAIN
Life CycleTarget Current Gap Target Current Gap Target Current Gap
Research and development 0.30$ 0.50$ 0.20$ 0.30$ 0.50$ 0.20$
Manufacturing 4.00 5.00 1.00 13.00$ 15.00$ 2.00$ 17.00 20.00 3.00
Marketing and distribution 1.50 2.00 0.50 4.50 5.00 0.50 6.00 7.00 1.00
Service and support 0.25 0.50 0.25 0.25 0.50 0.25
General administration 0.75 1.00 0.25 0.75 1.00 0.25
Total 6.80$ 9.00$ 2.20$ 17.50$ 20.00$ 2.50$ 24.30$ 29.00$ 4.70$
Internal Costs External Costs Total Costs
Value Chain
8/7/2019 Presentation3 for CSM
http://slidepdf.com/reader/full/presentation3-for-csm 148/207
04/06/11 148
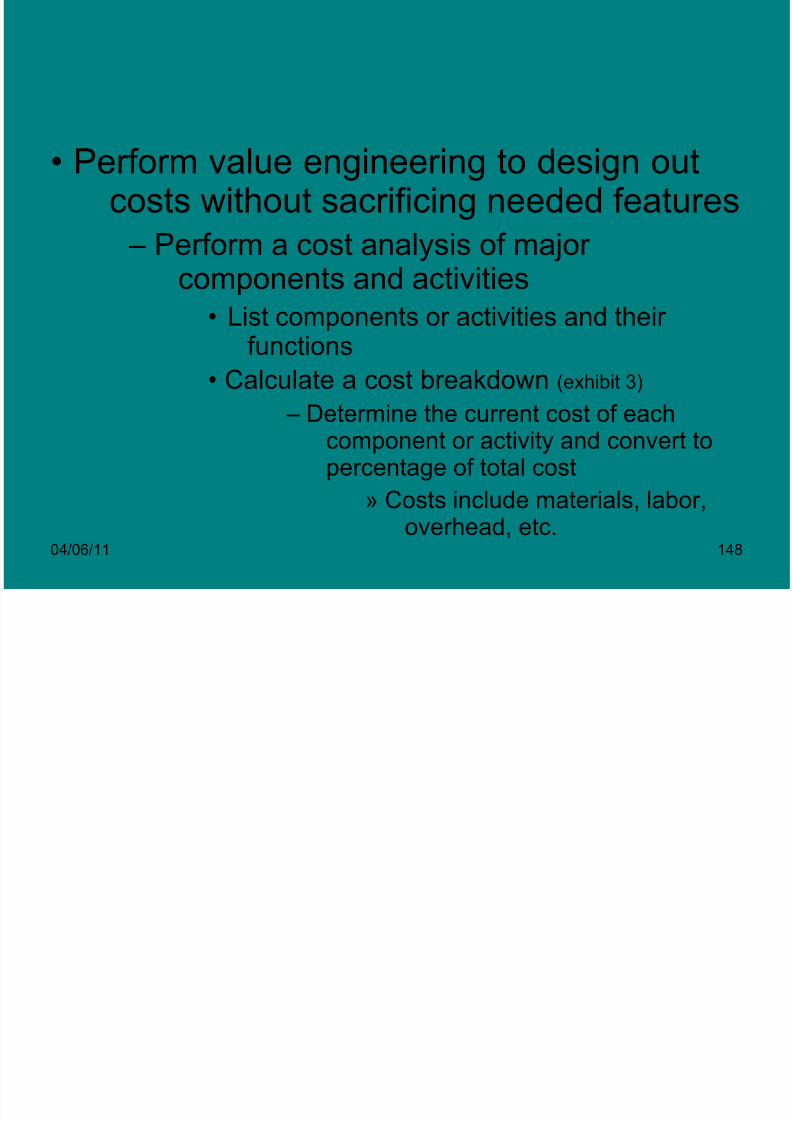
• Perform value engineering to design outcosts without sacrificing needed features
– Perform a cost analysis of major components and activities
• List components or activities and their functions
• Calculate a cost breakdown (exhibit 3)
– Determine the current cost of each
component or activity and convert topercentage of total cost
» Costs include materials, labor,overhead, etc.

8/7/2019 Presentation3 for CSM
http://slidepdf.com/reader/full/presentation3-for-csm 149/207
04/06/11 149
EXHIBIT 3COMPONENT COST BREAKDOWN
Percent of
Component Function Cost total costMotor Turns blade 8$ 40%
Transmission Provides oscillation capabilities 4 20%
Speed control/switch Controls blade speed 3 15%
Body Houses motor, transmission, speed control 2 10%
Blade Moves air 1 5%
Blade guard Protects blade from contacting objects 2 10%
Total 20$ 100%
8/7/2019 Presentation3 for CSM
http://slidepdf.com/reader/full/presentation3-for-csm 150/207
04/06/11 150
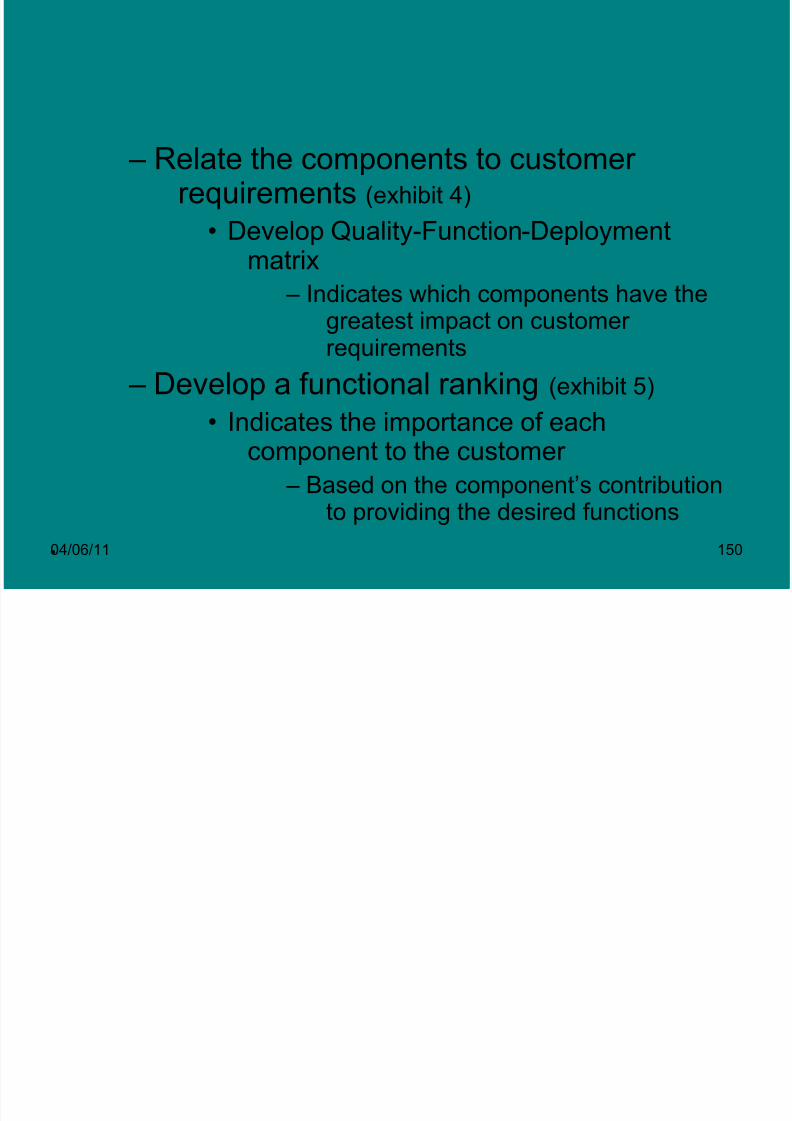
– Relate the components to customer requirements (exhibit 4)
• Develop Quality-Function-Deploymentmatrix
– Indicates which components have thegreatest impact on customer requirements
– Develop a functional ranking (exhibit 5)
• Indicates the importance of eachcomponent to the customer
– Based on the component’s contributionto providing the desired functions

8/7/2019 Presentation3 for CSM
http://slidepdf.com/reader/full/presentation3-for-csm 151/207
04/06/11 151
EXHIBIT 4QUALITY-FUNCTION-DEPLOYMENT (QFD) MATRIX
Speed Blade
Motor Transmission control Body Blade guard
Multiple speeds
Horizontal oscillationVertical oscillation
Light weight
Adjustable height
Airflow capacity
Quietness
Compact size
Looks nice
Strong correlationModerate correlationWeak correlation
Components
Customer Requirements

8/7/2019 Presentation3 for CSM
http://slidepdf.com/reader/full/presentation3-for-csm 152/207
04/06/11 152
E X H IB IT 5
C O M P O N E N T C O N T R IB U T IO N T O C U S T O M E R R E Q U IR E M E N T S
C u s t o m e r R e q u i r e m e n t s S p e e d B la d e
M o t o r T r a n s m is s io n c o n t r o l B o d y B l a d e g u a r d
M u l t ip le s p e e d s 4 0 X 1 4 . 8 = 5 . 9 2 6 0 X 1 4 . 8 = 8 . 8 8
H o r iz o n t a l o s c i l la t io n 8 0 X 1 1 . 1 = 8 .8 8 2 0 X 1 1 .1 = 2 . 2 2
V e r t ic a l o s c i l la t io n 8 0 X 3 .7 = 2 . 9 6 2 0 X 3 .7 = 0 .7 4
L ig h t w e ig h t 7 0 X 1 4 .8 = 1 0 . 3 61 0 X 1 4 . 8 = 1 . 4 8 2 0 X 1 4 . 8 = 2 . 9 6
A d ju s t a b le h e ig h t 1 0 0 X 3 .7 = 3 . 7 0
A ir f lo w c a p a c i t y 5 0 X 1 4 . 8 = 7 . 4 0 5 0 X 1 4 .8 = 7 .4 0
Q u ie tn e s s 4 0 X 1 8 . 5 = 7 . 4 0 6 0 X 1 8 . 5 = 1 1 .1 0C o m p a c t s iz e 5 X 1 1 . 1 = 0 . 5 65 X 1 1 .1 = 0 . 5 6 3 0 X 1 1 . 1 = 3 . 3 33 0 X 1 1 . 1 = 3 .3 33 0 X 1 1 .1 =
L o o k s n ic e 5 0 X 7 .4 = 3 .7 0 5 0 X 7 . 4 =
T o t a l c o n t r ib u t io n p e r c e n t a g e 3 1 . 6 4 % 1 3 .8 8 % 8 . 8 8 % 1 6 . 6 5 % 2 1 . 8 3 % 7 . 0 3
C o m p o n e n ts
8/7/2019 Presentation3 for CSM
http://slidepdf.com/reader/full/presentation3-for-csm 153/207
04/06/11 153
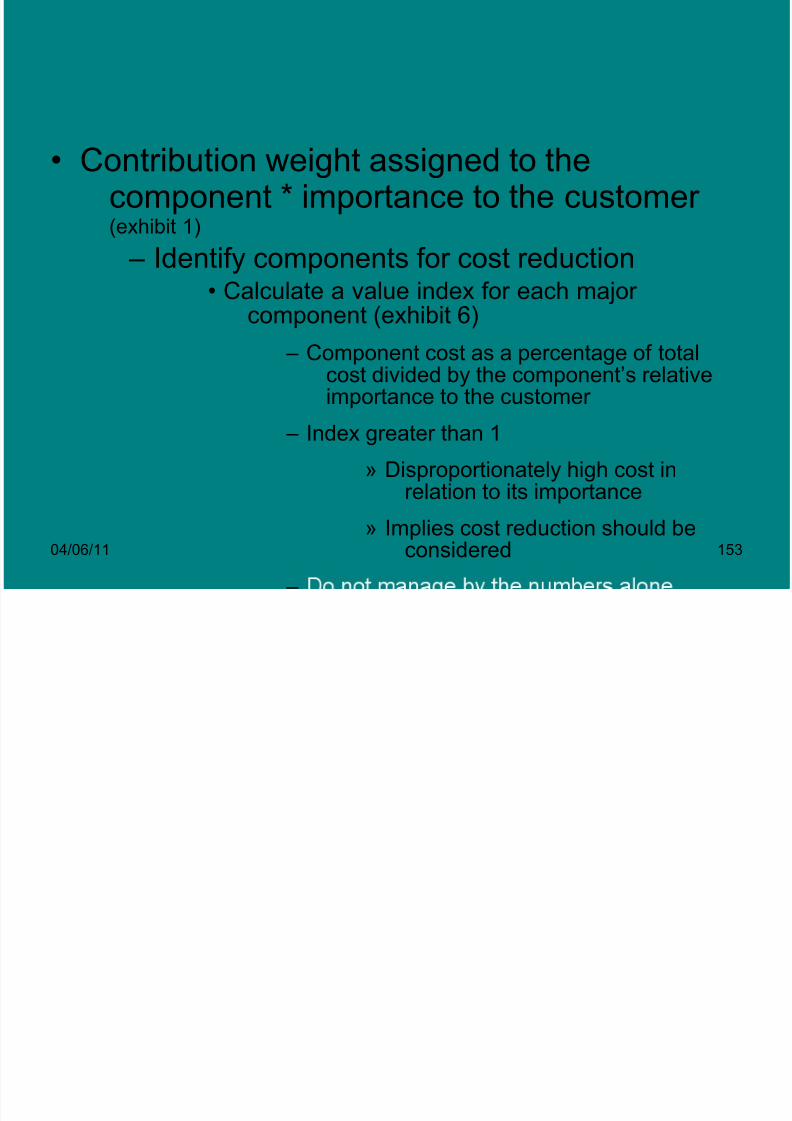
• Contribution weight assigned to thecomponent * importance to the customer (exhibit 1)
– Identify components for cost reduction
• Calculate a value index for each major component (exhibit 6)
– Component cost as a percentage of totalcost divided by the component’s relativeimportance to the customer
– Index greater than 1» Disproportionately high cost in
relation to its importance
» Implies cost reduction should beconsidered
–
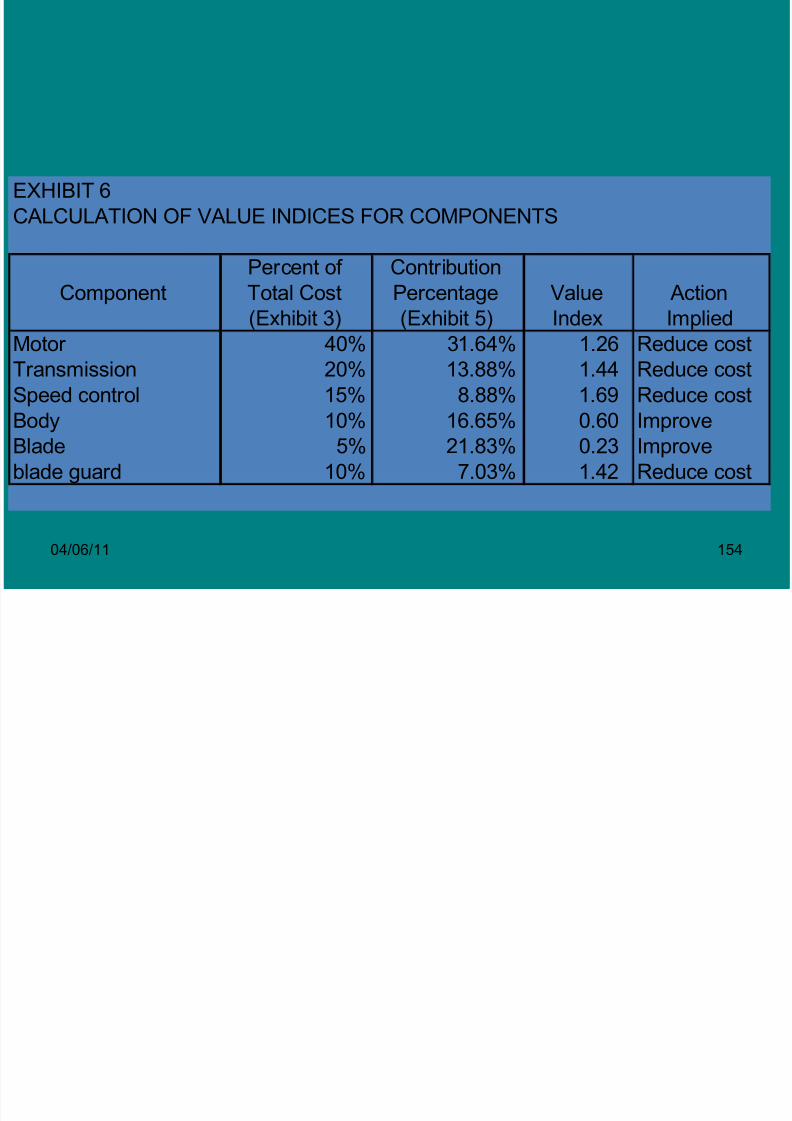
8/7/2019 Presentation3 for CSM
http://slidepdf.com/reader/full/presentation3-for-csm 154/207

8/7/2019 Presentation3 for CSM
http://slidepdf.com/reader/full/presentation3-for-csm 155/207
04/06/11 155
– Generate cost reduction ideas• Eliminate over-engineering
• Eliminate, replace, combine, rearrange
– Seek ways to accomplish the goal at
less cost• Consider the process as well as the product
– More efficient manufacturing processes
– Better logistics
– Etc.

8/7/2019 Presentation3 for CSM
http://slidepdf.com/reader/full/presentation3-for-csm 156/207
04/06/11 156
– Test the ideas• Will they be effective?
• Are they technologically feasible?
• Is there a domino effect?
– Construct a component interactionmatrix (exhibit 7)
– Do activities interact?
– Estimate the achievable costs
• Use activity-based costing, cost tables, etc
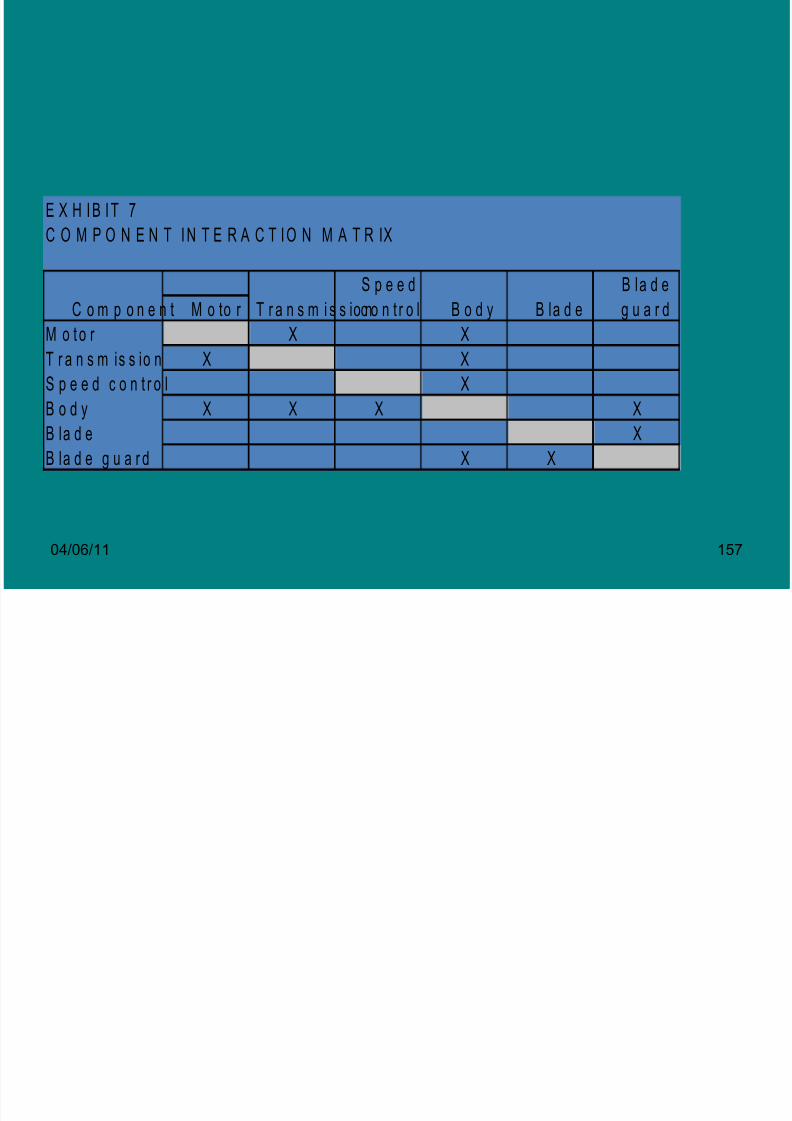
8/7/2019 Presentation3 for CSM
http://slidepdf.com/reader/full/presentation3-for-csm 157/207
04/06/11 157
E X H I B I T 7
C O M P O N E N T I N T E R A C T I O N M A T R IX
S p e e d B la d e
C o m p o n e n t M o to r T r a n s m i s s io nc o n t r o l B o d y B la d e g u a r d
M o t o r X X
T r a n s m is s io n X X
S p e e d c o n t r o l X
B o d y X X X X
B la d e XB la d e g u a r d X X
Organizational Impact
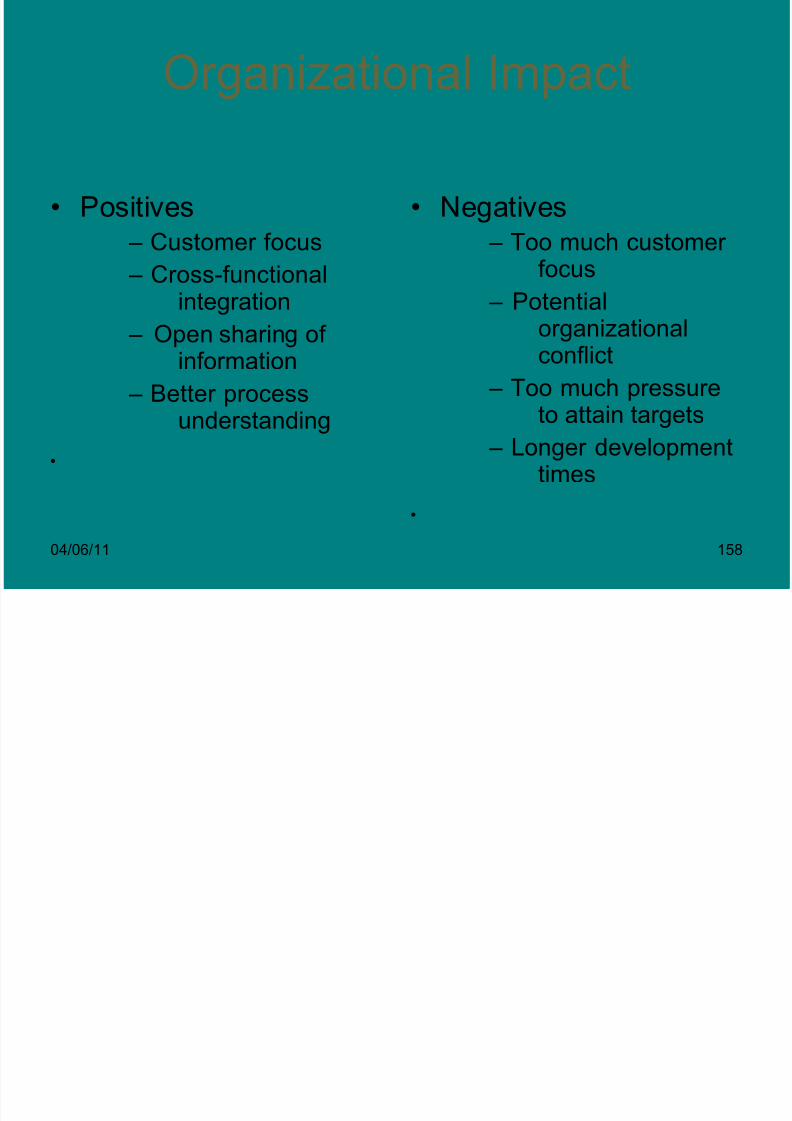
8/7/2019 Presentation3 for CSM
http://slidepdf.com/reader/full/presentation3-for-csm 158/207
04/06/11 158
• Positives
– Customer focus
– Cross-functional
integration– Open sharing of
information
– Better processunderstanding
• Negatives
– Too much customer focus
– Potentialorganizationalconflict
– Too much pressureto attain targets
– Longer developmenttimes
Divisional Performance Management

8/7/2019 Presentation3 for CSM
http://slidepdf.com/reader/full/presentation3-for-csm 159/207
04/06/11 159
Advantages of divisionalisation:• Top management gets free time to concentrate on strategicplanning and management.
• Improves decision making process.
• Specific decisions can be made on the spot.
• Managers will have quick response to changesin the environment.
• Managers gain experience in decision making.
• Helps in good labour management.Disadvantages:
• Competition among decisions may enhance profitabilty of onedecision at the cost of another decision.
• Duplication of costs and assets.• Top management loose some control.
•
Responsibility Centre
8/7/2019 Presentation3 for CSM
http://slidepdf.com/reader/full/presentation3-for-csm 160/207
04/06/11 160
• Cost centre: Managers are responsible to control cost but botresponsible for revenue..
• Revebue centre: managers are responsible for generating salesrevenue but do not have control over cost (e.g) MarketingManagers.
• Project centre: Project managers has responsibility both for cost and
revenue.• Investment Centre: Responsible for planning , sourcing and
deployment of funds in selected investment portfolio.Responsibility Accounting: Accounting is done in such a way as to how
the Managers of Responsibility centre have performed . Thissystem assumes the following:
1. Area of responsibility well defined.2. Managers are charged with items of work and responsibility over
which they are exercising significant direct control.
8/7/2019 Presentation3 for CSM
http://slidepdf.com/reader/full/presentation3-for-csm 161/207
04/06/11 161
3. Managers are actively participating in establishing goals andbudgets. ,
1. Goals defined should be attainable with efficient and effectiveparticipation of all.
2. Good MIS and control mechanism.
3. Competent managersResponsibility performance reporting’ report should be:
• Fit the organaisation structure.
• Prompt and timely.
• Issued regularly.
• Easy to understand.• Sufficient but not excess detail.
• Compare performance with targets
•
1.
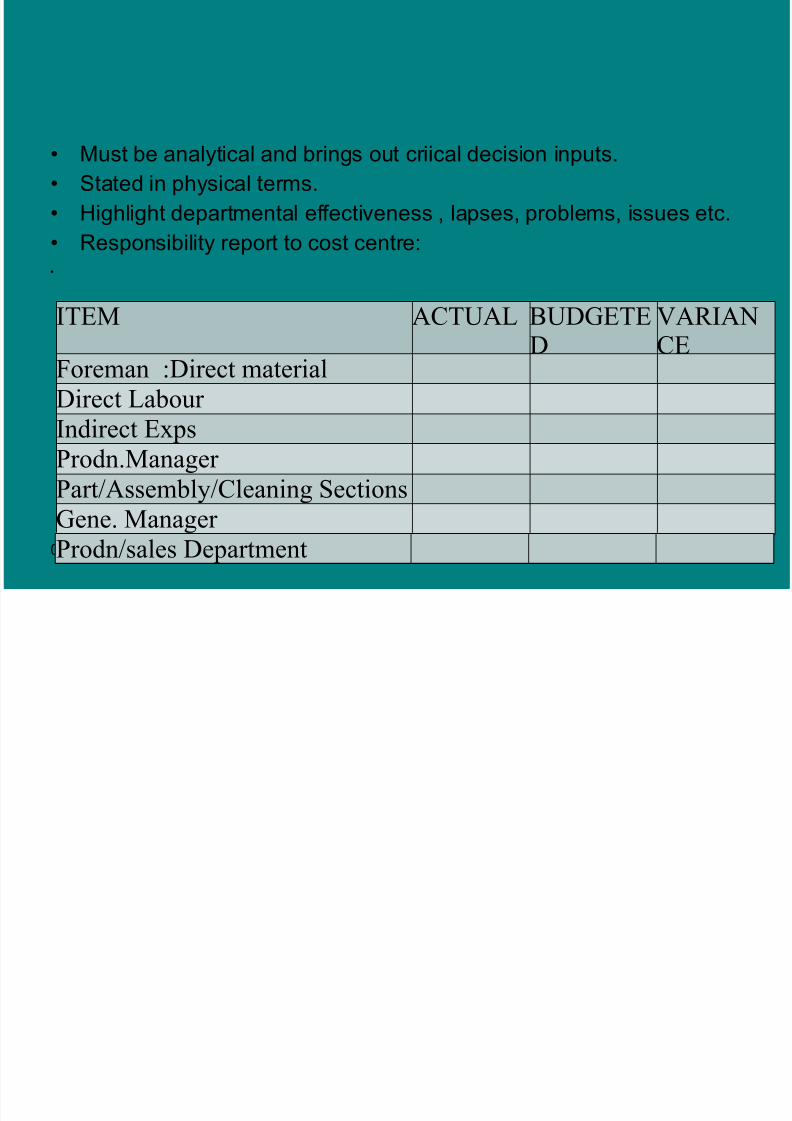
8/7/2019 Presentation3 for CSM
http://slidepdf.com/reader/full/presentation3-for-csm 162/207
04/06/11 162
• Must be analytical and brings out criical decision inputs.• Stated in physical terms.
• Highlight departmental effectiveness , lapses, problems, issues etc.
• Responsibility report to cost centre:
ITEM ACTUAL BUDGETED
VARIANCE
Foreman :Direct material
Direct Labour
Indirect ExpsProdn.Manager
Part/Assembly/Cleaning Sections
Gene. Manager
Prodn/sales Department
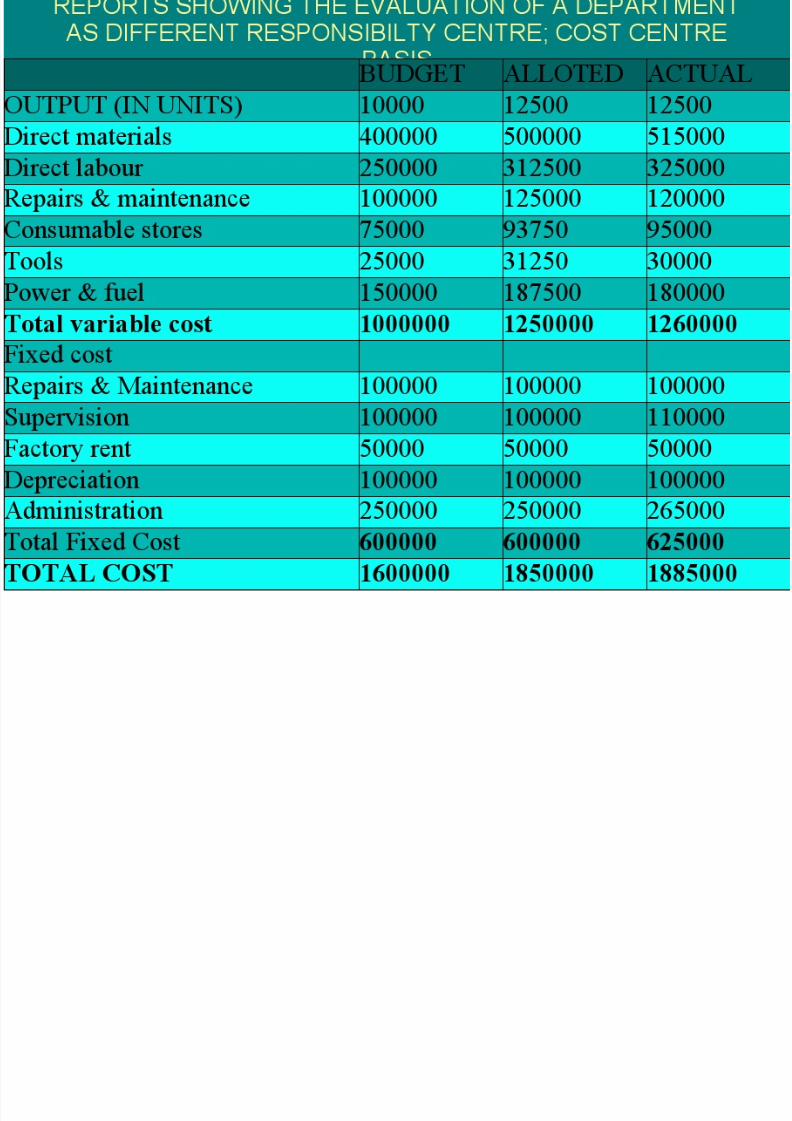
8/7/2019 Presentation3 for CSM
http://slidepdf.com/reader/full/presentation3-for-csm 163/207
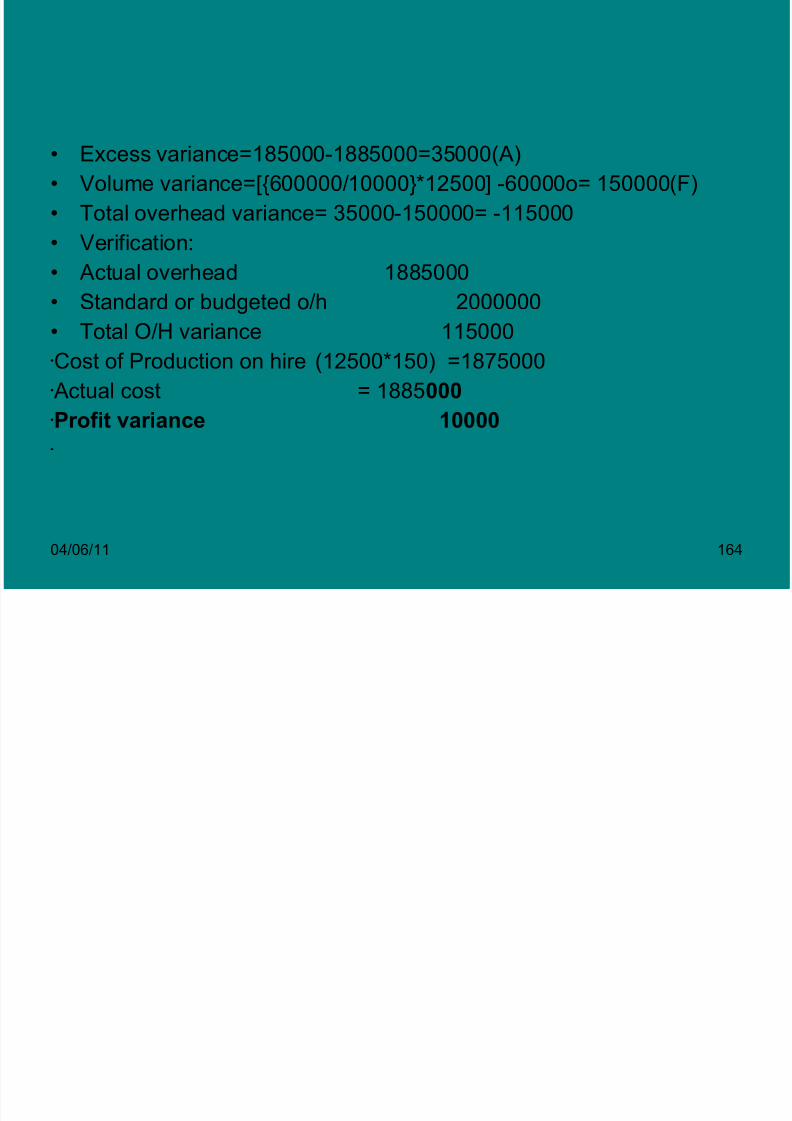
8/7/2019 Presentation3 for CSM
http://slidepdf.com/reader/full/presentation3-for-csm 164/207
04/06/11 164
• Excess variance=185000-1885000=35000(A)
• Volume variance=[{600000/10000}*12500] -60000o= 150000(F)
• Total overhead variance= 35000-150000= -115000
• Verification:
• Actual overhead 1885000
• Standard or budgeted o/h 2000000• Total O/H variance 115000Cost of Production on hire (12500*150) =1875000Actual cost = 1885000Profit variance 10000
RESPONSIBILITY CENTRE BASIS
BUDGET ACTUAL VARIANCE
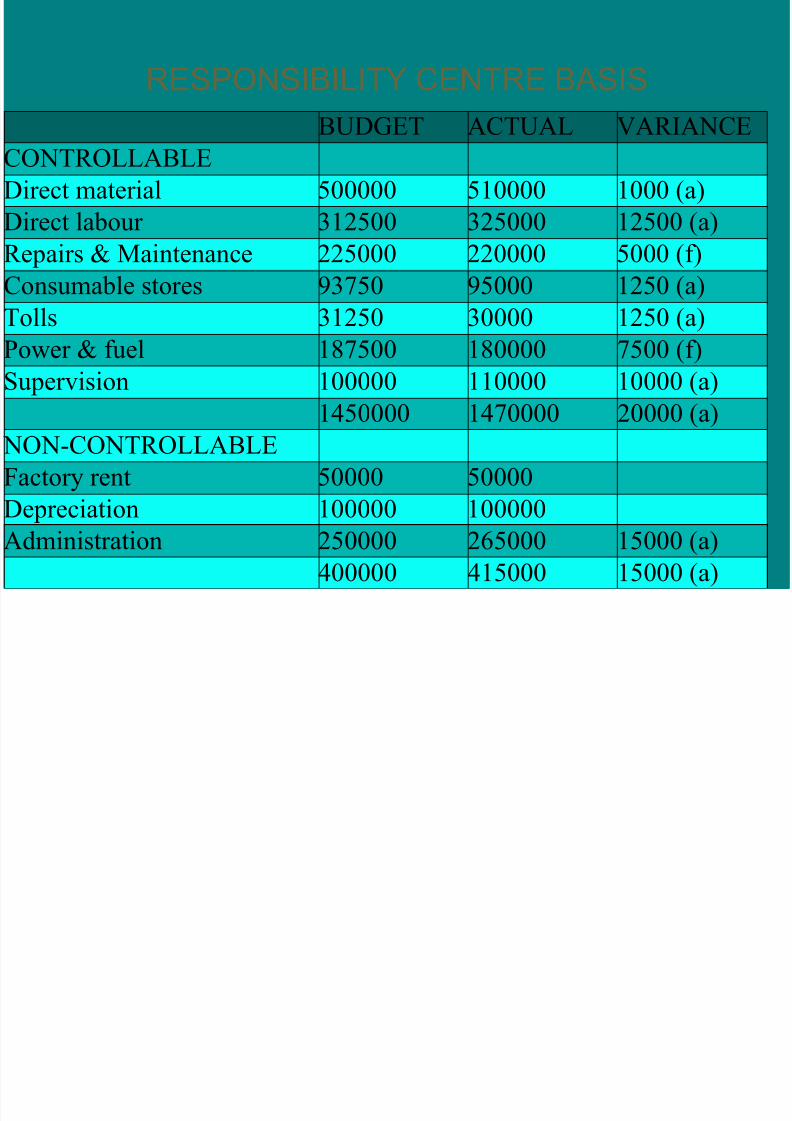
8/7/2019 Presentation3 for CSM
http://slidepdf.com/reader/full/presentation3-for-csm 165/207
04/06/11 165
BUDGET ACTUAL VARIANCE
CONTROLLABLEDirect material 500000 510000 1000 (a)
Direct labour 312500 325000 12500 (a)
Repairs & Maintenance 225000 220000 5000 (f)
Consumable stores 93750 95000 1250 (a)
Tolls 31250 30000 1250 (a)
Power & fuel 187500 180000 7500 (f)
Supervision 100000 110000 10000 (a)
1450000 1470000 20000 (a)
NON-CONTROLLABLEFactory rent 50000 50000
Depreciation 100000 100000
Administration 250000 265000 15000 (a)
400000 415000 15000 (a)
Residual income
8/7/2019 Presentation3 for CSM
http://slidepdf.com/reader/full/presentation3-for-csm 166/207
04/06/11 166
• Residual income business is based on generation of cash without doingphysical labor. Residual income provides you with the tool to earnmoney easily even after not working directly. Internet at presentcomes up with several residual income opportunities to help yougenerate them and at last earn money via others effort. There areseveral online business opportunities, which you can easily pursueto have residual income.
• If you wish to start up your own online business, then you need not bethe computer expert or genius. You just need to have rightknowledge and right residual income opportunities. Though there areseveral options on internet for residual income business, only fewguarantees to be authentic and trustworthy. When speaking aboutonline residual income opportunities, two things come up in themind. The first opportunity is to opt for online network marketing andthe other one is Affiliated Marketing.
ECONOMIC VALUE ADDED

8/7/2019 Presentation3 for CSM
http://slidepdf.com/reader/full/presentation3-for-csm 167/207
04/06/11 167
• The goal of Financial Management is to maximize the shareholder'svalue. The shareholder's wealth is measured by the returns theyreceive on their investment. Returns are in two parts, first is inthe form of dividends and the second in the form of capitalappreciation reflected in market value of shares of which marketvalue is thee dominant part.
• There exist very measures like return on Capital Employed, Returnon Equity, earnings per share, Net Profit margin, and Operatingprofit margin to evaluate the performance of the business. Theproblem with theses measures is that they lack a proper benchmark for comparison. The shareholders require at least aminimum rate of return on their vestment depending on the risk inthe investment. To overcome these problems the concept of EVAvas developed.

8/7/2019 Presentation3 for CSM
http://slidepdf.com/reader/full/presentation3-for-csm 168/207
04/06/11 168
• Evolution of EVA:
• It was Stern Stewart & Co. who devised an accounting methodcalled Economic Value Added (EVA), which measures whether the company is generating adequate profits to reward, itsshareholders. EVA is the registered trademark of Stern Stewart &Co. It is the financial performance measure that captures the true
economic profit of an enterprise. It is also one of the measuresmost directly linked to the creation of shareholder wealth over time.
•
8/7/2019 Presentation3 for CSM
http://slidepdf.com/reader/full/presentation3-for-csm 169/207
04/06/11 169
• Concept of EVA:
• The company creates shareholders value only if it generates returns inexcess of its cost of capital. The excess of returns over cost of capital issimply termed as Economic Value Added. To put in a simple terms EVAis the profits generated by any economic entity over its cost of capitalemployed. The entity can be a company, country or the entire humancivilization. If the difference between the above two parameters is
positive than the entity is said to be creating wealth for its stakeholders.A negative EVA on the other hand indicates the company is a destroyer of value.
• EVA is just a way of measuring an operation's real profitability. EVA holds acompany accountable for the cost of capital it uses to expand andoperate its business and attempts to show whether a company is
creating a real value for its shareholders.

8/7/2019 Presentation3 for CSM
http://slidepdf.com/reader/full/presentation3-for-csm 170/207
04/06/11 170
• Calculation of EVA: • EVA is essentially the surplus left after
making an appropriate charge for the
capital employed in the business. It canbe calculated in the following way.
• EVA = NOPAT – (TCE x WACC)Where,
NOPAT = Net operating profit after taxTCE = Total capital employedWACC= Weighted average cost of
capital
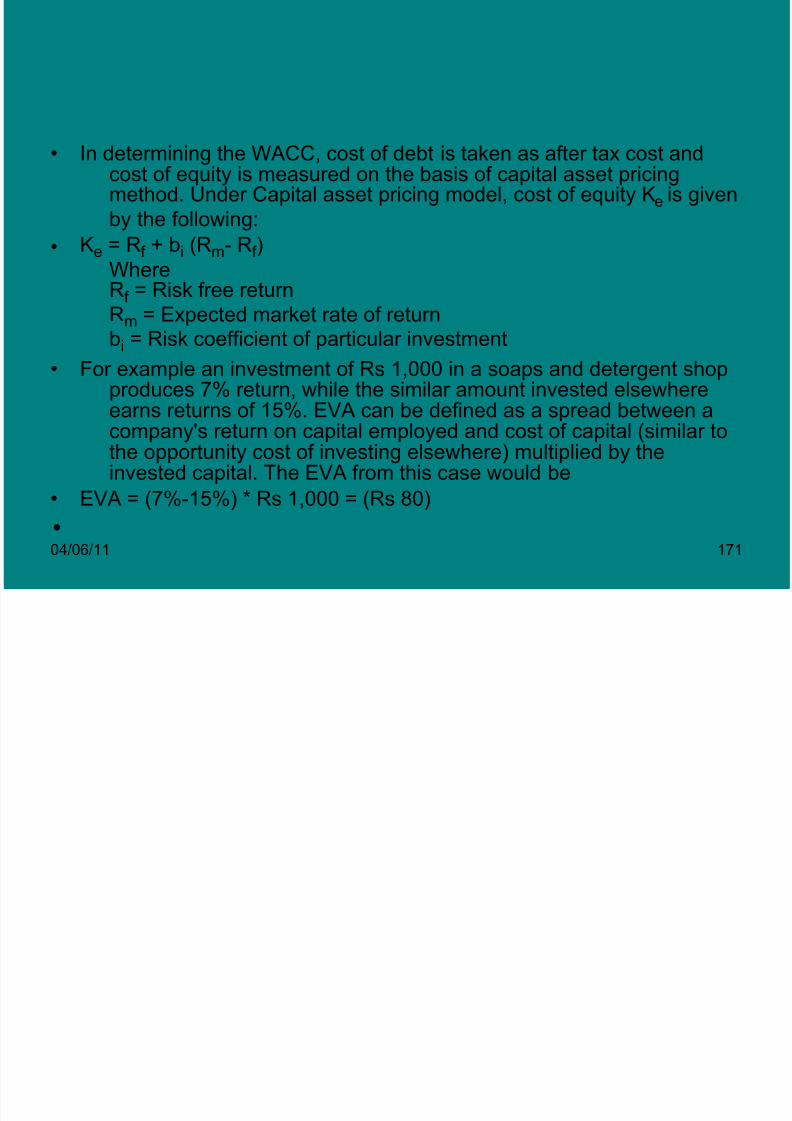
8/7/2019 Presentation3 for CSM
http://slidepdf.com/reader/full/presentation3-for-csm 171/207
04/06/11 171
• In determining the WACC, cost of debt is taken as after tax cost andcost of equity is measured on the basis of capital asset pricingmethod. Under Capital asset pricing model, cost of equity Ke is given
by the following:
• Ke = Rf + bi (Rm- Rf )
WhereR
f
= Risk free return
Rm = Expected market rate of returnbi = Risk coefficient of particular investment
• For example an investment of Rs 1,000 in a soaps and detergent shopproduces 7% return, while the similar amount invested elsewhereearns returns of 15%. EVA can be defined as a spread between acompany's return on capital employed and cost of capital (similar tothe opportunity cost of investing elsewhere) multiplied by theinvested capital. The EVA from this case would be
• EVA = (7%-15%) * Rs 1,000 = (Rs 80)
•

8/7/2019 Presentation3 for CSM
http://slidepdf.com/reader/full/presentation3-for-csm 172/207
04/06/11 172
• An accountant measures the profit earned while an economist looksat what could have been earned. Although the accounting profitin this example is Rs 70 (7% * Rs 1,000), there was anopportunity to earn Rs 150 (15% * Rs 1,000). So in this case thecompany can be called as a destroyer of wealth.
• Thus, the litmus test behind any decision to raise, invest, or retain a Rupee must be to create more value than theinvestor might have achieved with an otherwise alternativeinvestment opportunity of similar risk.
• EVA Example:
• Now consider this example based on the formula explained above.You can put different balance sheet and profit figures to know
your own EVA.
•

8/7/2019 Presentation3 for CSM
http://slidepdf.com/reader/full/presentation3-for-csm 173/207
04/06/11 173
Particulars (Rs m)
Equity Capital 500
Reserves 7,500
Net worth 8,000
12.5% debentures 2,000
Capital employed 10,000
Weight of equity 0.8
Weight of debt 0.2
NOPAT (as per definition) 1,500.0Return on tax free governmentbonds *
11.0%
Beta * 1.1
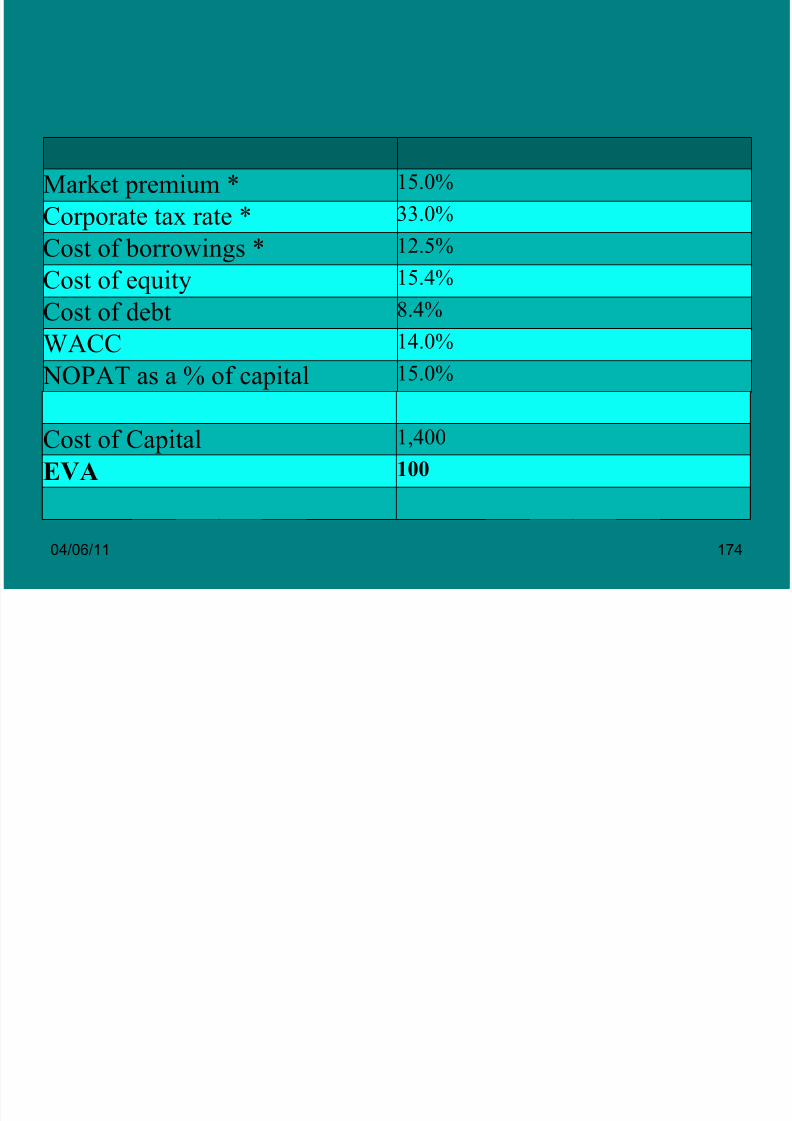
8/7/2019 Presentation3 for CSM
http://slidepdf.com/reader/full/presentation3-for-csm 174/207
04/06/11 174
Market premium * 15.0%
Corporate tax rate * 33.0%
Cost of borrowings * 12.5%
Cost of equity 15.4%
Cost of debt 8.4%
WACC 14.0%
NOPAT as a % of capitalemployed
15.0%
Cost of Capital 1,400EVA 100
TRANSFER PRICING

8/7/2019 Presentation3 for CSM
http://slidepdf.com/reader/full/presentation3-for-csm 175/207
04/06/11 175
• In divisionalised companies where profit centres are created, thereis likely hood of inter divisional transfer of goods or services.
• This calls form transfer pricing/..
• Normally transfer price is set up for intermediate products andservices that are supplied by selling division to buying division.
• Transfer price refers to the amount used in accounting for transfer of goods or services from one responsibility centre to another or from one company to another which belongs to the same group.
• Transfer pricing is a mechanism for distributing revenue betweendifferent divisions which jointly develop, manufacture and marketproducts and services.

8/7/2019 Presentation3 for CSM
http://slidepdf.com/reader/full/presentation3-for-csm 176/207
04/06/11 176
• Transfer pricing systems are designed to accomplish the followingobjectives:
• to provide each division with relevant information required to makeoptimal decisions for the organisation as a whole;
• to promote goal congruence – that is, actions by divisionalmanagers to optimise divisional performance should
automatically optimise the firm's performance; and• to facilitate measuring divisional performances.
• The fundamental principle is that the transfer price should be similar to the price that would be charged if the product were sold tooutside customers or purchased from outside vendors.
•
Methods of pricing

8/7/2019 Presentation3 for CSM
http://slidepdf.com/reader/full/presentation3-for-csm 177/207
04/06/11 177
• Cost based- -Actual cost -Marginal cost -Standard cost -Cost Plus ( cost +profit)
• Market-based transfer pricing system provides optimal results when the
market for the intermediate product is perfectly competitive and theselling division can sell its output either to insiders or outsiders andas long as the buying division can obtain all its requirements fromeither outsiders or insiders.
• In such a situation the company as a whole has no additional cost of providing autonomy to divisions. For example, if division A decides to
sell its product at the market price of Rs. 100 per unit and division Bdecides to buy the same product from market at the market price,net cash flow to the firm will be zero.
•
8/7/2019 Presentation3 for CSM
http://slidepdf.com/reader/full/presentation3-for-csm 178/207
04/06/11 178
• If competitive prices are not available or it is too costly to obtainmarket prices, transfer prices may be determined based on thecost plus a profit. Cost-based transfer prices should be used onlyas a second option to market-based transfer prices because itinvolves complex calculations and results are less thansatisfactory.
• For multinational corporations, it may be advantageous toarbitrarily select prices such that most of the profit is made in acountry with low taxes, thus shifting the profits to reduce overalltaxes paid by a multinational group.
• However, most countries enforce tax laws based on the arm's lengthprinciple as defined in the OECD (Organisation for Economic Co-operation and Development) Transfer Pricing Guidelines for Multinational Enterprises and Tax Administrations, limiting howtransfer prices can be set and ensuring that that country gets totax its "fair" share. In India, the OECD principle was adopted in2001.
•
•
8/7/2019 Presentation3 for CSM
http://slidepdf.com/reader/full/presentation3-for-csm 179/207
04/06/11 179
• Applying transfer pricing rules based onthe arm's length principle is not easy,even with the help of the OECD'sguidelines. It is not always possible –
and certainly takes valuable time – tofind comparable market transactions toset an acceptable transfer price.
• The revenue authority and the MNCsshould work together in good faith toimplement regulations effectively. Thequestion of ethics cannot be ignored
Role of Costing in Budgeting

8/7/2019 Presentation3 for CSM
http://slidepdf.com/reader/full/presentation3-for-csm 180/207
04/06/11 180
• Role of Cost Accounting
• Balance sheets and profit and loss statements do not reveal howprofitable one product is versus another, or whether one plantproduces more efficiently than another.
• Although the stockholder or investment analyst may care little aboutdetails of efficiency and cost since to them the overall profit of the
business is sufficient, management must take a different point of view. Naturally, management is interested in maintaining theoverall position of the company.
• The overall position of a company can include such measures ashow successfully it competes, how it is perceived by its
customers, competitors, and investors, and its capacity for futuregrowth.
•
•
8/7/2019 Presentation3 for CSM
http://slidepdf.com/reader/full/presentation3-for-csm 181/207
04/06/11 181
• In cost accounting the total expenditures in operating abusiness are broken down on per item or per unitbasis, as for example the cost of producing a gallon of gasoline, a ton of coal, a dozen shirts, or arefrigerator.
• The same idea can be extended to cost per productionorder, as when a special product is made for acustomer, or extended to cost per activity or operation,such as the cost of drilling ½ inch holes, or platingsheet metal of a certain size and quality.
•
•
•
8/7/2019 Presentation3 for CSM
http://slidepdf.com/reader/full/presentation3-for-csm 182/207
04/06/11 182
• Cost accounting provides information for the followingpurposes:
• 1. Cost determination
• The costs and expense of a business are recorded, classified,and
allocated to various jobs, departments, products, or services.• 2. Costs for pricing Once costs are determined, the information also serves as a
guide regarding prices to be quoted to customers. Even though
selling prices are governed only partly by the costs of production, in the long run the selling price must atleast equalthe costs of production, or there will be serious consequenceto the profit and loss statement
•

8/7/2019 Presentation3 for CSM
http://slidepdf.com/reader/full/presentation3-for-csm 183/207
04/06/11 183
• Cost for managerial decision• In a sense, both cost determination and cost
for pricing provide bases for managerialdecisions. Although managerial decision
making actually becomes much morecomplex than the statement above implies,cost information may be helpful in makingdecision that have to do with
• (a) whether to add a new product, or to dropone that is now being produced
• (b) Whether to manufacture a certain unit, or buy it on the outside, and

8/7/2019 Presentation3 for CSM
http://slidepdf.com/reader/full/presentation3-for-csm 184/207
04/06/11 184
• Cost control• One of the more essential purposes of
cost accounting is control of expenditures. Such control leads toefficiency in the use of labor, materialsmachines and plants.
• Although to a large extent selling prices
are determined by competition, theprofit-making capacity of a business isguided by the efficiency with which costs
t ll d

8/7/2019 Presentation3 for CSM
http://slidepdf.com/reader/full/presentation3-for-csm 185/207
04/06/11 185
• Cost control• One of the more essential purposes of
cost accounting is control expenditure.Such control leads to efficiency in theuse of labor, materials machines andplants.
• Although to a large extent selling prices
are determined by competition, theprofit-making capacity of a business isguided by the efficiency with which costs
t ll d
8/7/2019 Presentation3 for CSM
http://slidepdf.com/reader/full/presentation3-for-csm 186/207
04/06/11 186
• Basic Cost Elements• There are three basic cost elements
-direct material cost, direct labor cost,and overhead. Overhead will be further subdivided as to whether it results fromfactory operation, sales effort, or generaladministration.
• Figure below shows in chart form thederivation of basic cost elements.
•
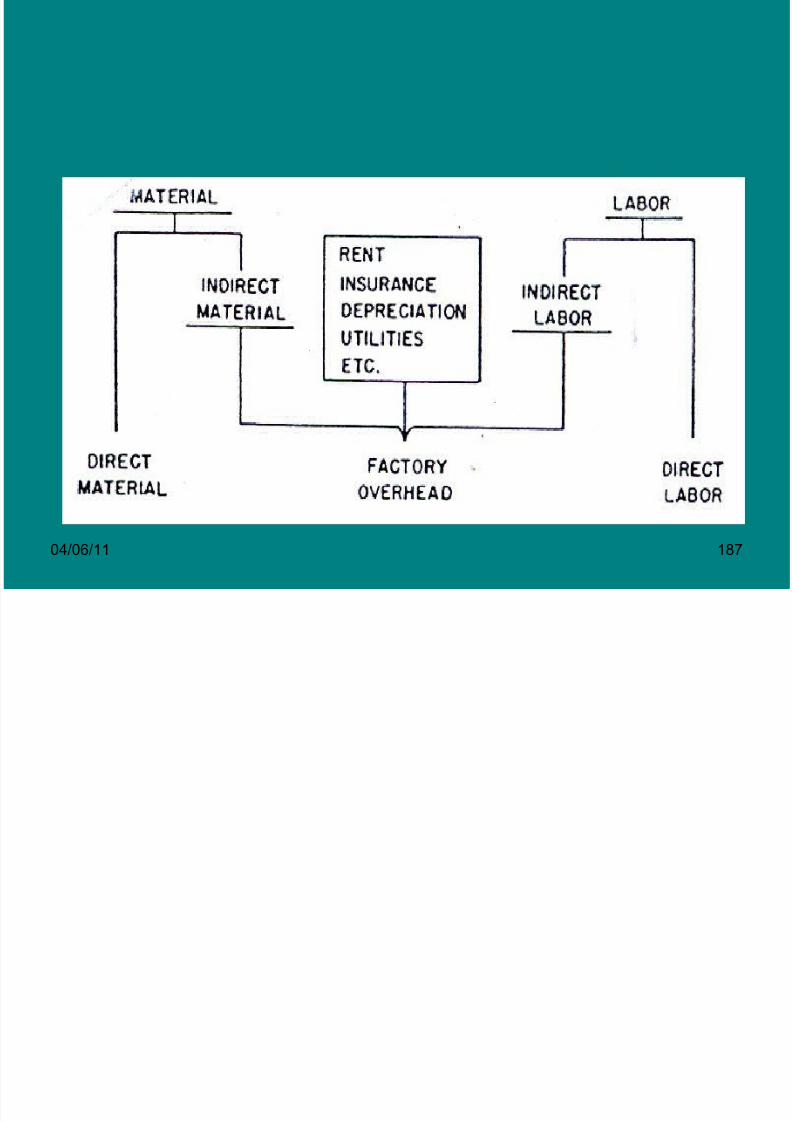
8/7/2019 Presentation3 for CSM
http://slidepdf.com/reader/full/presentation3-for-csm 187/207
04/06/11 187
Obtaining Unit Costs
8/7/2019 Presentation3 for CSM
http://slidepdf.com/reader/full/presentation3-for-csm 188/207
04/06/11 188
• Let us consider how these cost figures areobtained, particularly on per unit or per-product basis.
• Direct material and direct labor present littledifficulty. One can generally measure theamount of direct material used per unit of product.
• Because material costs can be determinedfrom vendors’ invoices and if product yields
are known, the direct material dollars per unit can easily be obtained.• Most factories require their employees to
keep time records. From these records thenumber of direct labor hours spent on any
8/7/2019 Presentation3 for CSM
http://slidepdf.com/reader/full/presentation3-for-csm 189/207
04/06/11 189
• Common bases for the allocation of overhead costs are
• 1. Number of employees
• 2. Direct labor costs• 3. Direct labor hours
• 4. Direct material costs
• 5. Machine hours• 6. Floor area
• 7. Prime Costs
8/7/2019 Presentation3 for CSM
http://slidepdf.com/reader/full/presentation3-for-csm 190/207
04/06/11 190
• Past versus Future Costs• We have speaking of cost determination
and cost allocation strictly in thehistorical sense.
• In other words, our discussion so far haslooked at cost after the accountingperiod is over and products have been
stored in the warehouse; and we havethen tried to determine costs on a per unit basis. Such figures are interesting
d h l f l t t t b t th

8/7/2019 Presentation3 for CSM
http://slidepdf.com/reader/full/presentation3-for-csm 191/207
04/06/11 191
• In managing operations, we needsufficient information about what futurecosts should be so that bids may beplaced on jobs, selling prices may be
estimated ahead of time, and a basis for corrective action may be provided.
• The use of standard costs is helpful both
in predictive work as well as in controlTotal cost of a product= Direct material+
direct labour+ Prime cot overhead+ Selling
& Di t ib ti O/H + Ad i i t ti O/H
ROLE OF COSTIING IN BUDGETING

8/7/2019 Presentation3 for CSM
http://slidepdf.com/reader/full/presentation3-for-csm 192/207
04/06/11 192
• Objectives
• To inculcate cost consciousness and accountability among the tleaders/scientific community.
• To enable the optimal utilization of resources at various stages of implementation .
• To obtain cost data on each PRODUCT• For facilitating course corrections in the total cost estimates of the
products as well as decisions concerning reallocation of resources.• To provide information to the management to monitor the flow of
financial inputs in relation to physical outputs.• To realistically project the future requirements of the organsation
in the budgetary process.• To serve as an aid for better management in planning, monitoring
and reviewing of the programmes, projects and activities of thelaboratories.
•
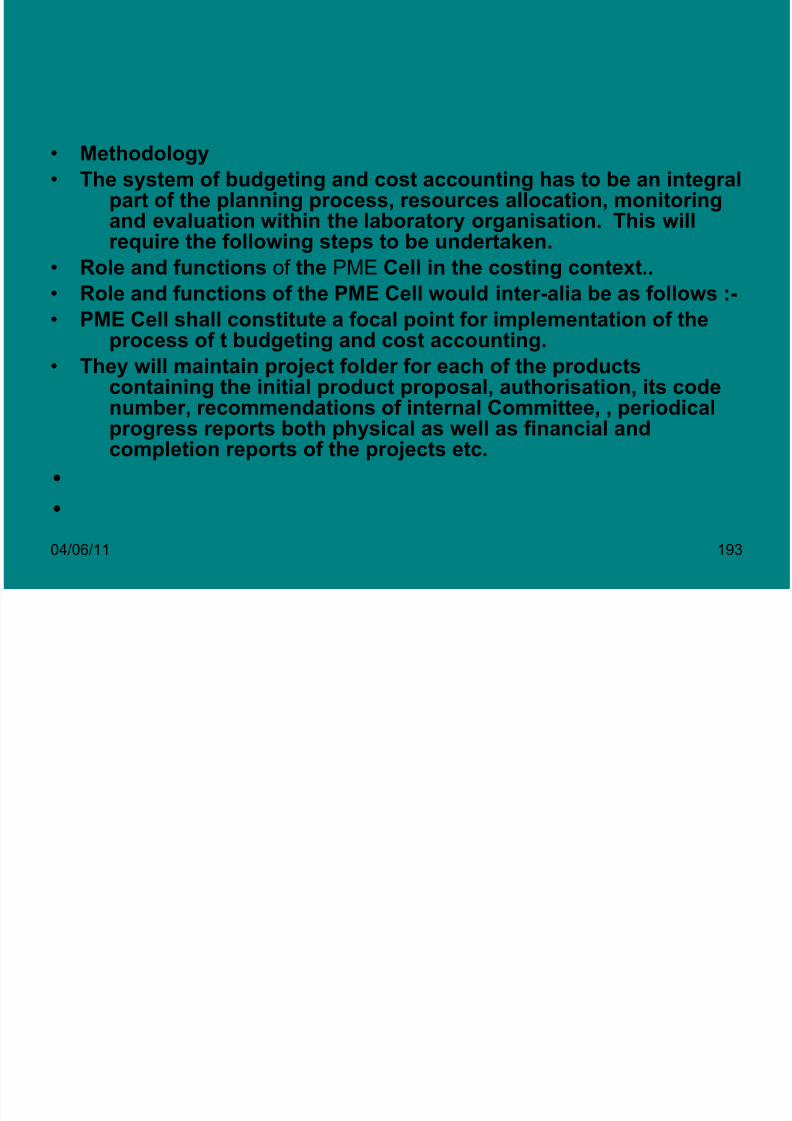
8/7/2019 Presentation3 for CSM
http://slidepdf.com/reader/full/presentation3-for-csm 193/207
04/06/11 193
• Methodology
• The system of budgeting and cost accounting has to be an integralpart of the planning process, resources allocation, monitoringand evaluation within the laboratory organisation. This willrequire the following steps to be undertaken.
• Role and functions of the PME Cell in the costing context..
• Role and functions of the PME Cell would inter-alia be as follows :-
• PME Cell shall constitute a focal point for implementation of theprocess of t budgeting and cost accounting.
• They will maintain project folder for each of the productscontaining the initial product proposal, authorisation, its codenumber, recommendations of internal Committee, , periodicalprogress reports both physical as well as financial and
completion reports of the projects etc.•
•
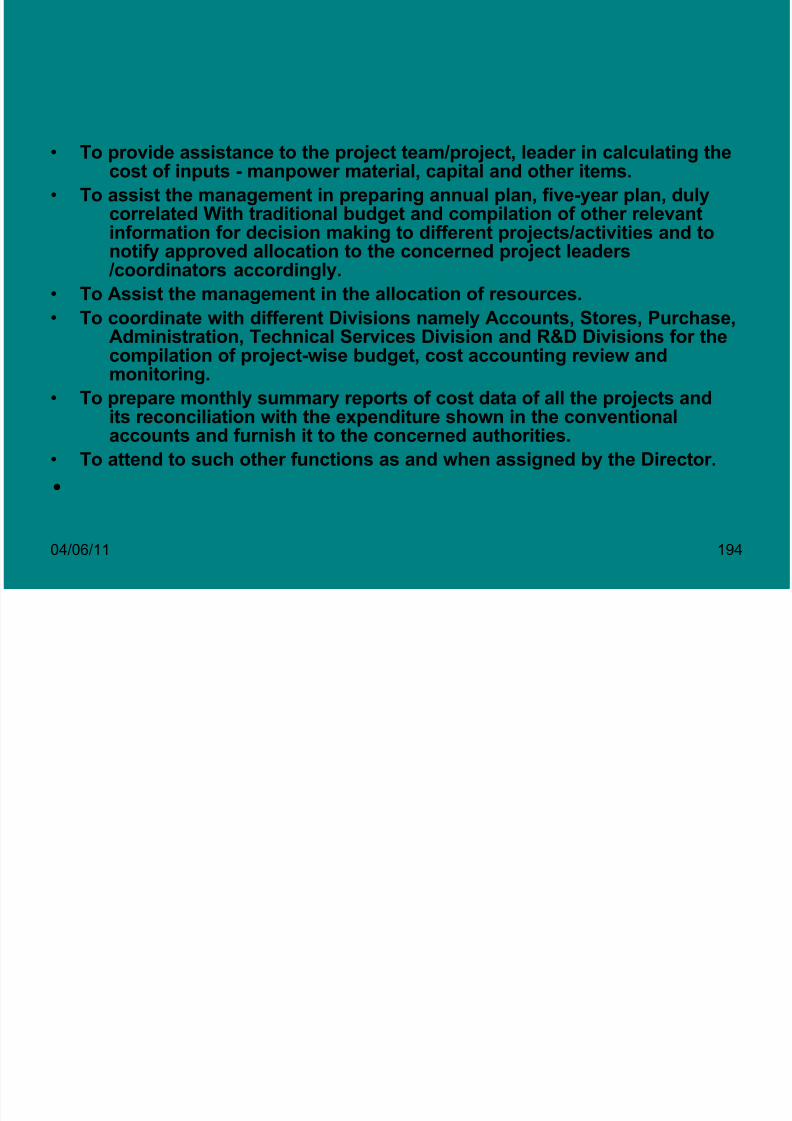
8/7/2019 Presentation3 for CSM
http://slidepdf.com/reader/full/presentation3-for-csm 194/207

8/7/2019 Presentation3 for CSM
http://slidepdf.com/reader/full/presentation3-for-csm 195/207
04/06/11 195
• Financial aspects of a project would include the following
elements: -
• Direct Cost:
• Cost of manpower ( % time involved per (Profonna -1) personproposed to be deployed
• Additional manpower required, if any (Proforma-II)
• Cost of Materials - Consumables and non- consumables -(Proforma-III)
• Special capital equipment (Proforma-IV)
• Works and services specifically needed (proforma -V)
• Others (Misc./Contingencies etc.)
•

8/7/2019 Presentation3 for CSM
http://slidepdf.com/reader/full/presentation3-for-csm 196/207
04/06/11 196
• Indirect Cost:
• Estimated cost of other allowances not covered under directcharges.
• General & divisional overheads-expenses covering infrastructuralfacilities costs, contingencies, maintenance etc.
• Role of Finance & Accounts Section• 1. Finance and Accounts Division will be required to
ensure that all the bills passed by them contain classificationboth conventional as well as project wise/cost centre wise withCode Number.
• 2. Similarly while making posting of bills in the classifiedabstract, expenditure relating to specific projects will besignified by (p) under the Conventional Budget head. This willfacilitate the apportioning of expenditure to the projects and
general O.H. by PME Cell. F&A.0 will personally ensure thatinformation/records needed by PME Cell for compilation of costaccounts are made available to them within the prescribed timeschedule. He would be extended all facilities and cooperationin this regard
•

8/7/2019 Presentation3 for CSM
http://slidepdf.com/reader/full/presentation3-for-csm 197/207
04/06/11 197
• Cost Accounting
• As already mentioned, PME Cell will act as a focal point for project cost accounting. Total expenditure of the project will beaccounted under the following heads : (Profonna-XIV).
• Salary - research personnel cost
• Other allowances
• Consumables - General Stores• Consumables - Project Stores
• Capital equipment
• Works& Services
• Service charges like computer charges, Workshop charges etc.
• Facility utilization charges (Depreciation)
• Overhead charges
• Any other
COST FLOWS USING A GENERAL LEDGER(ON STD.COST BASIS)
8/7/2019 Presentation3 for CSM
http://slidepdf.com/reader/full/presentation3-for-csm 198/207
04/06/11 198
LEDGER (ON ACTIVITY BASED COST
BASIS)
8/7/2019 Presentation3 for CSM
http://slidepdf.com/reader/full/presentation3-for-csm 199/207
04/06/11 199
BUDGET FORMULATION PROCESS
StrategicGoals
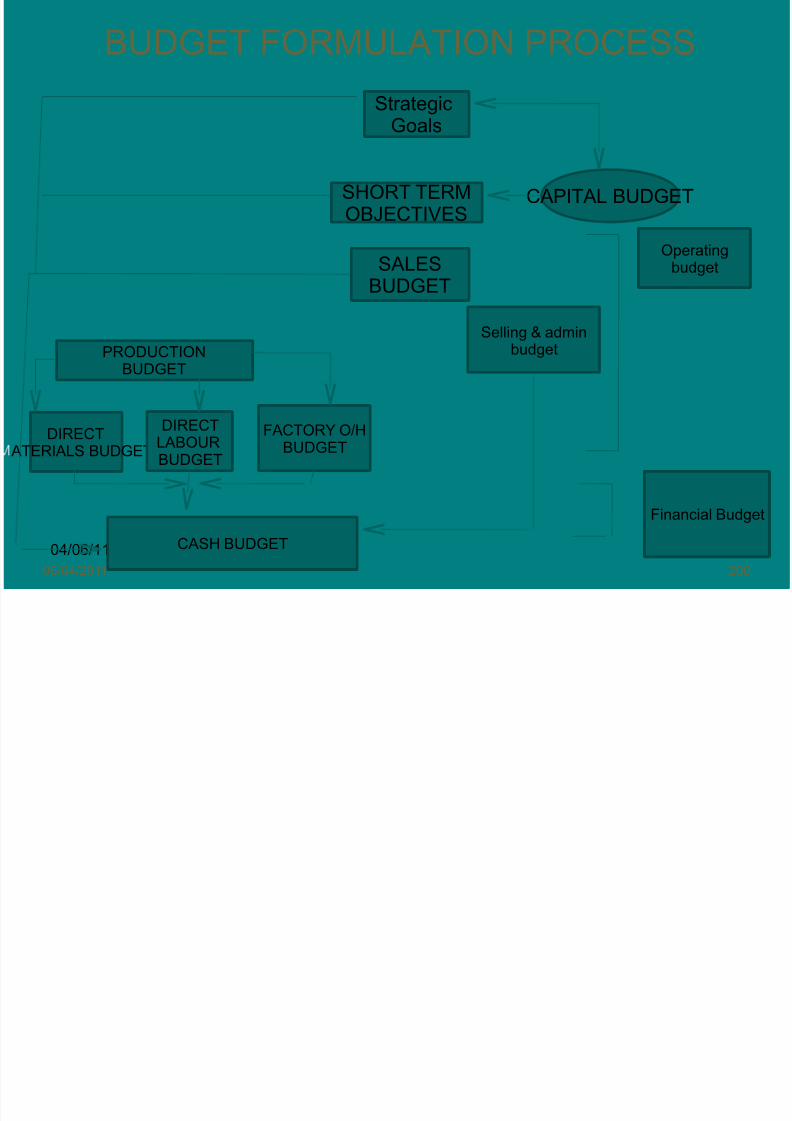
8/7/2019 Presentation3 for CSM
http://slidepdf.com/reader/full/presentation3-for-csm 200/207
04/06/11 200
06/04/2011 200
SHORT TERMOBJECTIVES
CAPITAL BUDGET
SALESBUDGET
PRODUCTIONBUDGET
DIRECT
ATERIALS BUDGET
DIRECT
LABOURBUDGET
FACTORY O/H
BUDGET
CASH BUDGET
Selling & adminbudget
Operatingbudget
Financial Budget
C t f B d t d B d t C t l
8/7/2019 Presentation3 for CSM
http://slidepdf.com/reader/full/presentation3-for-csm 201/207
04/06/11 201
• Concept of Budgets and Budgetary Control
• A budget is a detailed plan of operations for some specificfuture period. It acts as a business barometer
• It is a statement defining objectives to be attained in a futureperiod and the course to be followed to achieve them.
• It may express its targets either in rupees or in physical units
or both.• It is prepared for a definite period well in advance.
• Laying down the objectives to be achieved by the business;
• Formulating the necessary plans to ensure that the desiredobjectives are achieved;
• Relating the responsibilities of executives to the budgets or particular sections
8/7/2019 Presentation3 for CSM
http://slidepdf.com/reader/full/presentation3-for-csm 202/207
Obj ti f B d t C t l

8/7/2019 Presentation3 for CSM
http://slidepdf.com/reader/full/presentation3-for-csm 203/207
04/06/11 203
• Objectives of Budgetary Control
• Planning: A budget is a plan of the policy to be pursued during thedefined period
• Coordination "is the orderly arrangement of group effort to provideunity of action in the pursuit of a common purpose".
• Control: Planning generates the need for control
– Budgeting system integrates key managerial functionsas it links top management's planning function with thecontrol function performed at all levels in themanagerial hierarchy. Budgetary control makes everymanager becomes cost conscious
Budgetary Control as a ManagementTool
It d t t t b i d
8/7/2019 Presentation3 for CSM
http://slidepdf.com/reader/full/presentation3-for-csm 204/207
04/06/11 204
• Its advantages to management can be summarised asfollows:
• establishment of divisional and departmentalresponsibilities.
• coordinates the various divisions of a business facilitatatingsmoother operation
• forces management to give timely and adequate attention tothe effect of expected trend of general business conditions
• helps in carrying out a uniform policy.
• facilitates management by exception and the timely correctionof significant deviations from the targets set.
• is looked upon with favour by credit agencies as indicative of sound management.
• guards against undue optimism leading to over expansion

8/7/2019 Presentation3 for CSM
http://slidepdf.com/reader/full/presentation3-for-csm 205/207
04/06/11 205
• . Plant• Insufficiency due to a)Shortage of supply(b)
Lack of capital. (c) Lack of space,(d)Bottlenecks in certain key processes
• iv. Sales• Consumer demand.
• Insufficient advertising.
• Shortage of good salesmen.
» Organisation for Budgetary Control
8/7/2019 Presentation3 for CSM
http://slidepdf.com/reader/full/presentation3-for-csm 206/207
04/06/11 206
» Organisation for Budgetary Control
• Installation of budget centres• Preparation of Organisation Chart• Establishment of budget committees• Budget Period• Determination of the Key Factor • The sequence of preparation of budgets is determined by the Key Factor or the
Principal Budget Factor • Following are the key factors which can possibly affect budgeting:
– i. Materials -Shortage due to non availability.(b)Shortage due to restrictions imposed bylicenses, quotas etc
• Labour • General shortage. (b)Shortage of certain grades of labour •
• Management
8/7/2019 Presentation3 for CSM
http://slidepdf.com/reader/full/presentation3-for-csm 207/207
• Management
• Overall paucity of capital.• Limited availability of expertise - technical and managerial.
• Flogging research effort in respect of methods of production, productiondesign, etc.
• The Key factors should be correctly defined
• Budget Manual
• As the budgetary system gets into stride, it becomes essential tosystematize the procedure for the preparation of various budgets.Generally the practice is to arrange this by means of a budget manual
• Preparation of Budgets
• The top management should define the objectives and policies in clear terms. The goals set should be realistic and attainable. Then the budget


