33
Q1 2015 Results & Strategic Outlook

Q1 2015 Results & Strategic Outlook

Agenda
2
DADA in a snapshot
Q1 2015 Business Overview
Q1 2015 Financials

Targeted to SMBs, professionals and high-end
customers
Pan-European presence in 7 countries with a high
potential of scalability thanks to unified platforms
Large customer base (520k paying clients for 1.7 mn
registered domains) upon which DADA can up-sell
additional services
Ongoing focus on retaining the existing customer base
and acquiring new customers
Increasing competition in most geographies, entry of
major global players and lower demand for new
registrations
3
Key Highlights
“The one-stop shop for your online presence”

4
Key Financials Q1 2015 vs Q1 2014
€ mn
EBITDA
Ebitda margin %
Revenue
YoY
+0,1%
+25%
EBIT
Q1 2015
2.8
18%
16.01
1.1
Net Profit 0.01
NFP -26.9
n.m.
Q1 2014
2.3
14%
15.97
0.5
-0.5
-30.3
Headcount 348 364
+104%
**Including 25 employees from MOQU excluded from the figures at 31 March 2015 as a result of the disposal on 16 March 2015
**
*
* Performance Adv (MOQU) results classified as Profit (Loss) from discontinued operationsfor both 2015 and 2014
Profit (loss) from
discontinued operations -0.3 n.m.-0.1

Agenda
5
DADA in a snapshot
Q1 2015 Business Overview
Q1 2015 Financials

6
Product Offering
CUSTOMER NEEDS DADA’S SUITE OF SERVICES
• One-Stop-Shop to:
- Create online presence
- Market and promote businesses
- Sell and distribute products
online
• Product quality, ease-to-
use:
- Simple way to find, purchase
and use the right service
Online s
olu
tions
are
incre
asi
ngly
key f
or
SM
Es
Domain names
Web AppsWebsite creator
E-commerce
Dedicated & Cloud
SolutionsDedicated &Virtual Servers
Private & Public Cloud Solutions
Online
Adv, OBP &
Security
Products
CommunicationE-mail / PEC / Office 365
Shared Hosting
PR
ICE
N.
Of
CU
STO
MER
S
Business Overview

What we offer…
S
Step 1
Get a domain name to start
online presence
Step 2
Build a web presence
Step 3
Increase your visibility and sell
online
Key Products:
• Domain name registrations
• Domain renewals and transfers
• newGtlds pre-registration
• TMCH and DPML
Key Products:
• Website builder
• Shared Hosting (email)
• Dedicated and virtual servers
• Turnkey products
Key Products:
• Search Engine Optimization
• Online marketing solutions
• E-Commerce solutions
Business Overview
7

8
Business Overview
… supported by continued outstanding customer care

Business Overview
9
…and to the new IT Infrastructure
Milan
Paris
ReadingLondon
Strasbourg
Shared Hosting/ Network/ Other services
Dedicated Virtual Servers
All
The new UK DataCentre site is a 50,000
square foot facility located near to the
Green Park technology area:
• Cutting-edge specifications (TIER 4 like)
• Industry leading SLAs
• 24/7 Support

10
Revenue model and key drivers
2015 DRIVERS
Year 1Renewals/
Recurring
Revenue
Upselling on
existing
customers
New
Customers Year 2
Customer base consolidation is key for driving long-term growth
and extracting future value
Strategic priority on:
reducing Churn
upselling to Current Customers
acquiring New Customers
Working closely on
RETENTION and on
NEW ACQUISITIONS
Renewals of existing clients
represents over two thirds of new
sales on average
Of which about 90% is
from advance payment
by credit card
Business Overview

11
Domain Markets in Europe
Competitors
1Q15 confirmed the slow down trend in the
Domain & Hosting business in the main European
markets, affecting number of new customers
General increase in cost of acquisition driven by
aggressive marketing policies by large competitors and
consequently risk of commoditization
*Source: Management analysis based on available market data
Main Market trends of Q1 2015
Business Overview
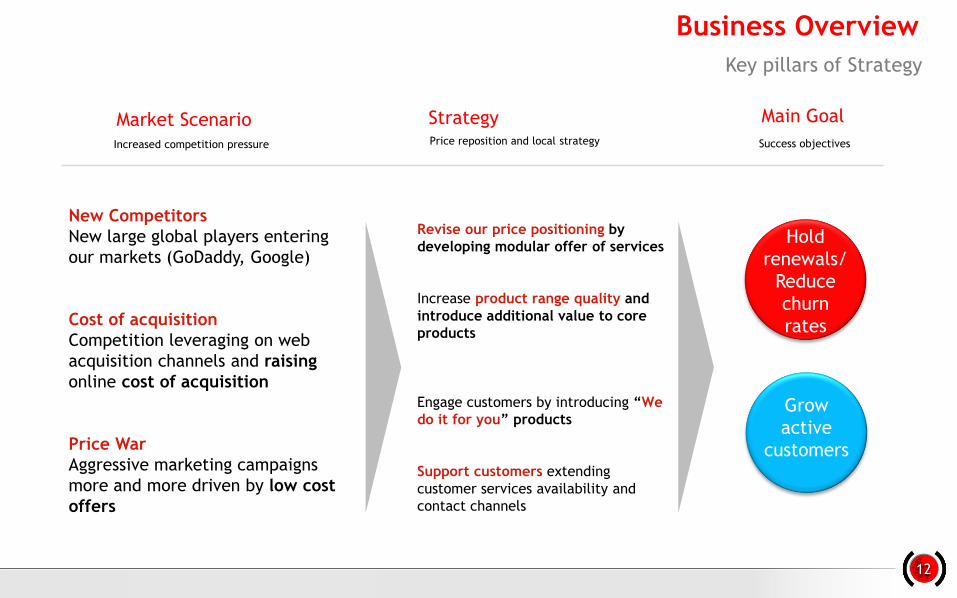
Market Scenario
New Competitors
New large global players entering
our markets (GoDaddy, Google)
Cost of acquisition
Competition leveraging on web
acquisition channels and raising
online cost of acquisition
Price War
Aggressive marketing campaigns
more and more driven by low cost
offers
Strategy
Revise our price positioning by
developing modular offer of services
Increase product range quality and
introduce additional value to core
products
Engage customers by introducing “We
do it for you” products
Support customers extending
customer services availability and
contact channels
Price reposition and local strategyIncreased competition pressure
Main Goal
Success objectives
Grow
active
customers
12
Business Overview
Key pillars of Strategy
Hold
renewals/
Reduce
churn
rates

Reduce Churn
Upsell to Base
Platform integration
New cust channels
•Platform performance•Value add products•Enhanced user interface
•Develop offline sales channel• Introduce new products•Enhanced user interface
Domains & Hosting2015 Strategic Priorities
Objective Deliverable
•Network infrastructure•Platform consolidation• Team integration
Impact
• Improved renewal rates• Lower customer attrition
•Offline sales improved•New/enhanced products• Improved ARPU
• Savings delivered•Operational efficiency• Speed to market
1
2
3
•New local and social products•Co-brand marketing•New market entrance
•Growth in new customers•Operating in Indian and South
American market•Acquiring without domain lead
4
13
Agenda
14
DADA in a snapshot
Q1 2015 Business Overview
Q1 2015 Financials

Shareholding Structure
Orascom TMT
Investments*
69.4%
Free Float
25.4%
* Through its wholly-owned subsidiary Libero Acquisition S.à r.l.
Oyster Sicav
5.1%
€
15
FinancialsCorporate Profile
Share Information
DA IM (Bloomberg), DA.MI (Reuters)
€48.84 mn
16.210.069
39.955
Ticker
Market cap (FTSE STAR Segment)
Shares issued
Last 3 Month avg. daily trade
3Y Stock Performance
Set,
2011
Jul,
2012
Gen,
2013
Gen,
2014
Gen,
2015Jul,
2013
Jul,
2014
Current
management
team in
charge

Financials
€ mn
Q1 2015 % on sales Q1 2014 % on sales
Net Revenues 16.01 15.97
EBITDA 2.8 18% 2.3 14%
EBIT 1.1 7% 0.5 3%
Profit before Tax 0.6 4% -0.2 -2%
Group Net Profit 0.01 n.m. -0.5 n.m.
16
Q1 2015 - Profit & Loss
Q/Q %
0.1%
25%
104%
n.m.
102%

Financials
17
Over
75% of
D&H
Domains Under Management
Customer Base
UK AREA
EU AREA
Q1 2015 - Revenue Breakdown by Country
Q1 2015 Revenue = 16.01 mn (100%)

16.01 15.97
18
% = Delta vs
2014€ mn
Q1 2015 – Key Revenues components
(*) Not business related effects:
€/GBP Exchange Rate +€0.6 mn
2014 UK Adsl Revenue (Dismissed in May14) -€0.2 mn
+0.3%-0.2%
+0.1%
-0.2%
Financials

Q1 2014 Q1 2015
2.3
2.8
% of
Revenue14% 18%
GM
+0.5
FinancialsQ1 2015 - Key EBITDA components
COA
(0.4)
Labour Cost
+0.6
G&A,
Corporate
Costs
(0.1)
19
€ mn

Financials
20
Q1
2015
2.8
D&A EBITDA Non recurring
charges/Write
downs
EBIT Net
FinancialsTaxes Net Profit
(1.6)
(0.1) 1.1(0.4)
(0.3)0.01
Q1 2015 - From EBITDA to Net Profit
Q1
2014
2.3
D&A EBITDA Non recurring
charges/Write
downs
Net
FinancialsTaxes
Net Loss
(1.7)
(0.7)
(0.3)
(0.5)
(0.05) 0.5
EBIT
€ mn

Financials
21
Q1 2015 - Capex Composition
€ mn
0.6
1.31.2
0.00.1
0.4

Financials
22
Q1 2015 - Cash Flow Composition
* Of which -€0.3 mn related to CC commissions
€ mn
4.2
(33.6)
(26.9)
(1.5)(0.7)
5.0 (0.2) (0.1)

Financials
€ mn 31.03.2015 31.12.2014
Net Working Capital (11.4)* (10.3)
Fixed Assets 97.1 95.4
Severance and Other Funds (1.2) (1.4)
Other Payables beyond one year (22) (17)
Net Capital Employed 84.5 83.7
Net Financial Position (26.7) (33.6)
Total Shareholders’ Equity (57.6) (50.1)
23
Differences between NCE and the sum of NFP and Net Equity area due to rounding
* Of which 13mn deferred revenues included
Q1 2015 – Balance Sheet
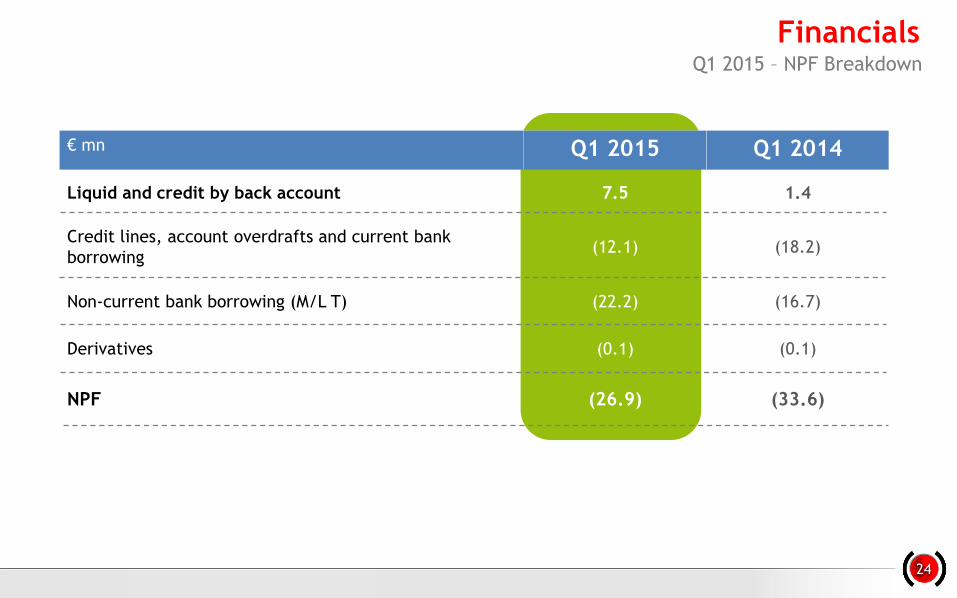
Financials
€ mn Q1 2015 Q1 2014
Liquid and credit by back account 7.5 1.4
Credit lines, account overdrafts and current bank
borrowing(12.1) (18.2)
Non-current bank borrowing (M/L T) (22.2) (16.7)
Derivatives (0.1) (0.1)
NPF (26.9) (33.6)
24
Q1 2015 – NPF Breakdown
Appendix

Group Corporate Structure as of April 2015
26

27* 2015 Positive Result for €11k
Q1 2015 – Dada Group Consolidated P&L
€/mn ACT 2015 ACT 2014
Revenue 16,0 16,0 0,0 0,1%
COGS -5,7 -6,2 0,5
Product Margin 10,3 9,8 0,5 5,3%
COA -1,7 -1,2 -0,4
Gross Margin 8,7 8,6 0,1 0,9%
Labour Cost & Contractors -4,7 -5,3 0,6
R&D CAPEX 0,6 0,8 -0,2
G&A -1,8 -1,9 0,1
EBITDA 2,8 2,3 0,6 25,0%
Receivables write-downs -0,1 -0,1 -0,1
Non recurring charges 0,0 0,0 0,0
D&A -1,7 -1,7 0,0
EBIT 1,1 0,5 0,5 103,9%
Net Financials -0,4 -0,8 0,4
Taxes -0,3 -0,2 -0,1
Profit (Loss) from Continuing Operations 0,3 -0,5 0,8 n.m.
Profit (Loss) from discontinued operations -0,3 -0,1 -0,3
Net Result 0,0 -0,5 0,5 n.m.
Delta vs 2014

July 2006
Last 3%
acquisition
August 2006
100% acquisition
May 2008
100% acquisition
January 2010
100% acquisition
Over time DADA has proved that it can grow also by
external growth
July 2008
100% acquisition
July 2007
100% acquisition
M&A activity in Domains & Hosting
28

M&A history
29

1 “The Domain Name Industry Brief”, Verisign, March. 2015
2 Zooknic, local registries
The fourth quarter of 20141 showed 288 million domain name
registrations worldwide, a growth of 6.2% yoy:
• the .com and .net TLDs reached a combined total of 130.6
mn names (+2.7% yoy)
• At the end of the fourth quarter of 2014, 478 new gTLDs
were delegated into the root. New gTLD registrations totaled
3.6 million (+2.3% of total gTLD registrations)
• the base of ccTLDs was 134 mn names (+8.7% yoy) for more
than 285 extensions globally
Domain & Hosting – Market Overview
30
CCTLDS/NEWGTLDS DOMAINS PENETRATIONNew Gtlds registration totaled
3,6 mln, on 2,3% on total gtlds
registrations

1. Integrating technology platforms
2. Capitalize the rationalization of the Data
Centers structure started in 2014
3. Ensuring tight operating cost control to increase
overall efficiency
STRENGTHENING CUSTOMERS BASE FOCUSING ON THE BUSINESS SEGMENT OF SMEs…
… WHILE DRIVING PROFITABILITY
IMPROVEMENT
1. Strengthening Email and Social collaboration tools,
Hosting and related value-added products
2. Expanding the offer of virtual and dedicated servers,
also in fully managed mode
3. Improving on- and off-line customer service, for
customer delight and further increasing retention and
ARPU rates
2015 – 2016
TOPLINE:
Mid-single digitCAGR*
(with a higher rate from the second
part of the period)
PROFITABILITY:More than proportional
increase vs Rev growth
* On a like-for-like basis and net of the negative contribution of Simply
Domains & HostingKey pillars of Future Strategy figure from FY2014 Presentation
31

€ mn Q1 2015 Q1 2014
Cash and Cash Equivalents at the Beginning of Period (16.8) (9.5)
Group Net Profit (Loss) 2.8 2.3
Gross Operating Cash Flow 3.8 3.0
Working capital, Income taxes and Interest paid (0.5) (0.5)
Net Operating Cash Flow 3.3 2.5
Capex & Investing Activities 3.4 (1.9)
Financing Activities 5.5 0.0
Free Cash Flow 12.2 0.7
Cash and Cash Equivalents at the End of Period (4.6) (8.9)
FY 2014 Results – Cash Flow Statement
32

Many thanks!All forecasts included in this document are subject to risks and uncertainties of DADA itself and of Internet, media and
Telco markets.
All forecasts are based on currently available information and reflect DADA Group management expectations.
All forecasts reflect market parameters, assumptions and other fundamentals which could change and therefore
influence the future results.
All the forecasts are based on an hypothesis of organic growth and commercial and regulatory stability, particularly in
the mobile market.
This document does not constitute solicitation of public saving.
Contacts
Investor Relations DADA
Tel: +39 055 200211


