May 1, 2010 May 1, 2010 Presented by Presented by Ron Ebelhar Ron Ebelhar H. C. . C. Nutting, A Nutting, A Terracon Company Terracon Company Presented by Presented by Ron Ebelhar Ron Ebelhar H. C. . C. Nutting, A Nutting, A Terracon Company Terracon Company
Transcript
May 1, 2010May 1, 2010
Presented by Presented by Ron EbelharRon Ebelhar
HH. C. . C. Nutting, A Nutting, A Terracon CompanyTerracon Company
Presented by Presented by Ron EbelharRon Ebelhar
HH. C. . C. Nutting, A Nutting, A Terracon CompanyTerracon Company
2000 International Building Code (IBC) introduced the new
concept of Seismic Design Category (SDC) to guide seismic
structural design.
The SDC is a function of:
� The Seismic Use Group (type/occupancy),
� Site spectral response accelerations (Ss and S1), and
� Soil type (Site Class) – adopted from UBC
Cost impact of the SDC can be large – thechoice impacts framing and mechanicalbracing ($100,000 to over $2,000,000)
SEISMIC DESIGN FACTORS
SITE CLASSIFICATION PERIBC 2000 / 2003 / …..
� There are six soil classes (designated A through F)
� The upper 100 feet (30 m) of the soil/rock profile are used to determine the “Site Class”.
� The soil/rock profile is stratified into layers (based on properties) and a weighted average of the properties of the upper 100 feet (30 m).
� Site Class D is the default classification
Site Class
Class Profile
A Hard Rock
B Rock
C Very Dense Soil
D Stiff Soil
E Soft Soil
F Collapsible or Liquefiable Soil
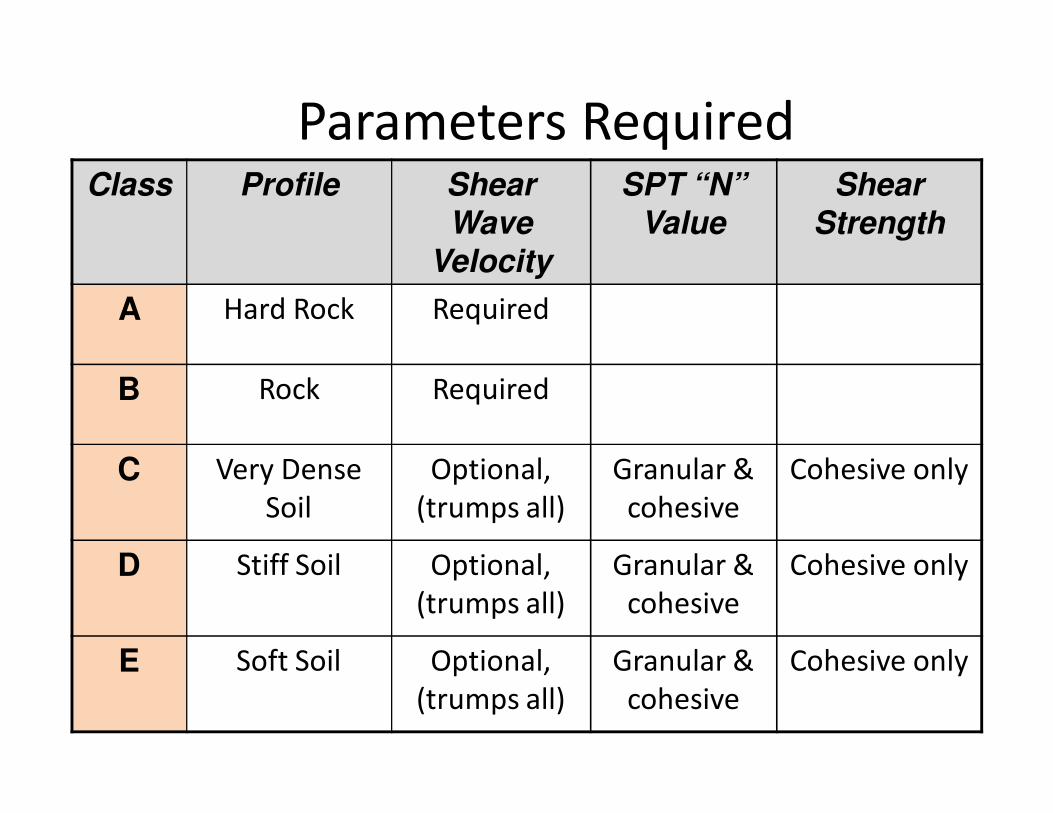
Parameters RequiredClass Profile Shear
Wave
Velocity
SPT “N” Value
Shear Strength
A Hard Rock Required
B Rock Required
C Very Dense
Soil
Optional,
(trumps all)
Granular &
cohesive
Cohesive only
D Stiff Soil Optional,
(trumps all)
Granular &
cohesive
Cohesive only
E Soft Soil Optional,
(trumps all)
Granular &
cohesive
Cohesive only
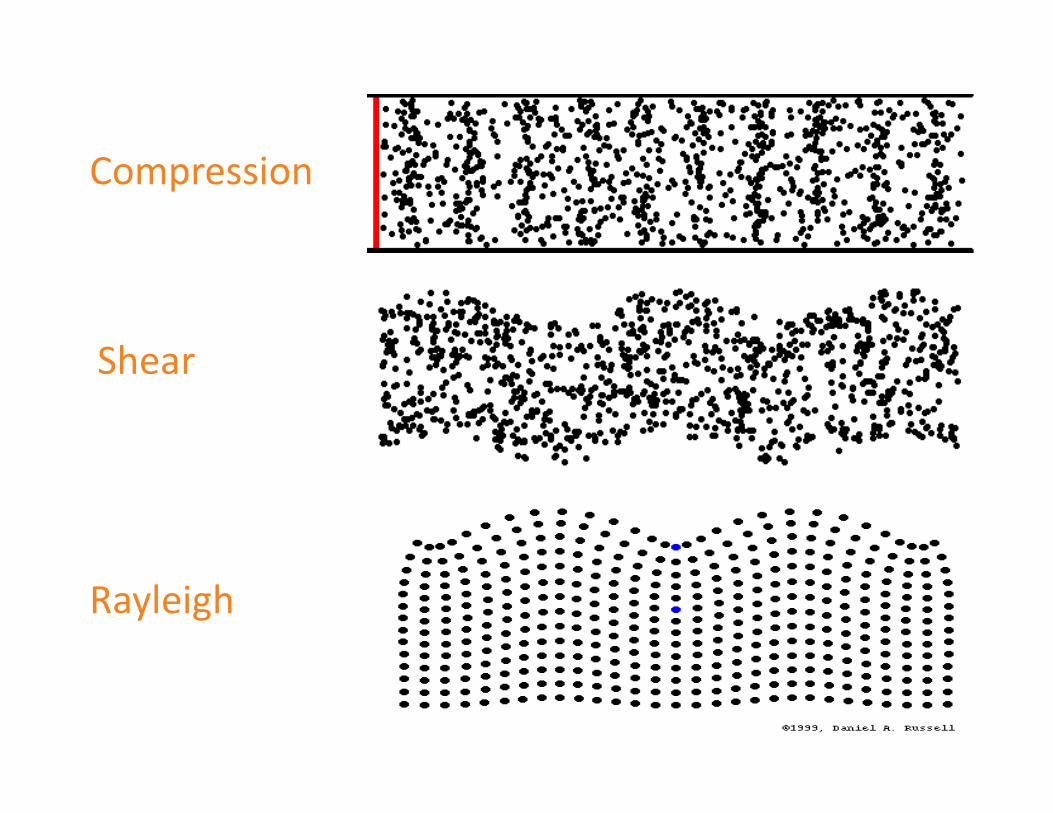
Compression
Shear
Rayleigh
� Applies directly to hard rock and rock sites – may be useful for mixed material (soil and rock) profiles
� Direct indication of soil / rock stiffness
Field Measurements1. Seismic Refraction Survey : ASTM D5777
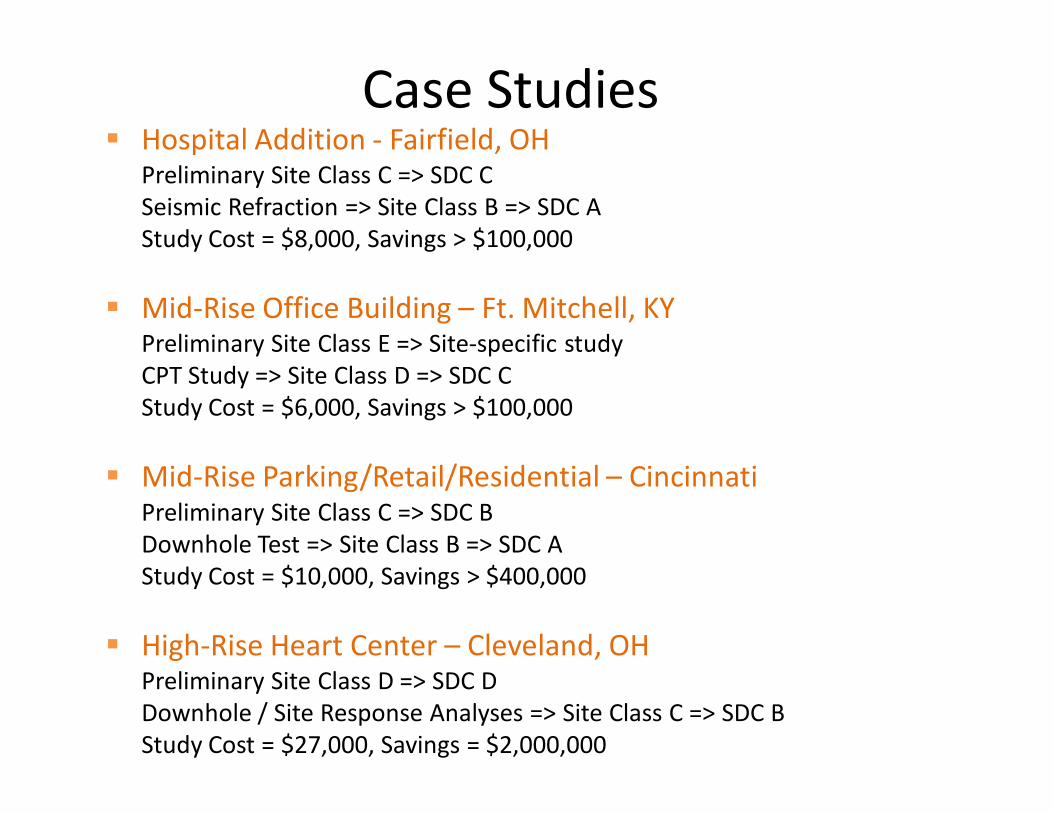
� Mid-Rise Office Building – Ft. Mitchell, KYPreliminary Site Class E => Site-specific study
CPT Study => Site Class D => SDC C
Study Cost = $6,000, Savings > $100,000
� Mid-Rise Parking/Retail/Residential – CincinnatiPreliminary Site Class C => SDC B
Downhole Test => Site Class B => SDC A
Study Cost = $10,000, Savings > $400,000
� High-Rise Heart Center – Cleveland, OHPreliminary Site Class D => SDC D
Downhole / Site Response Analyses => Site Class C => SDC B
Study Cost = $27,000, Savings = $2,000,000
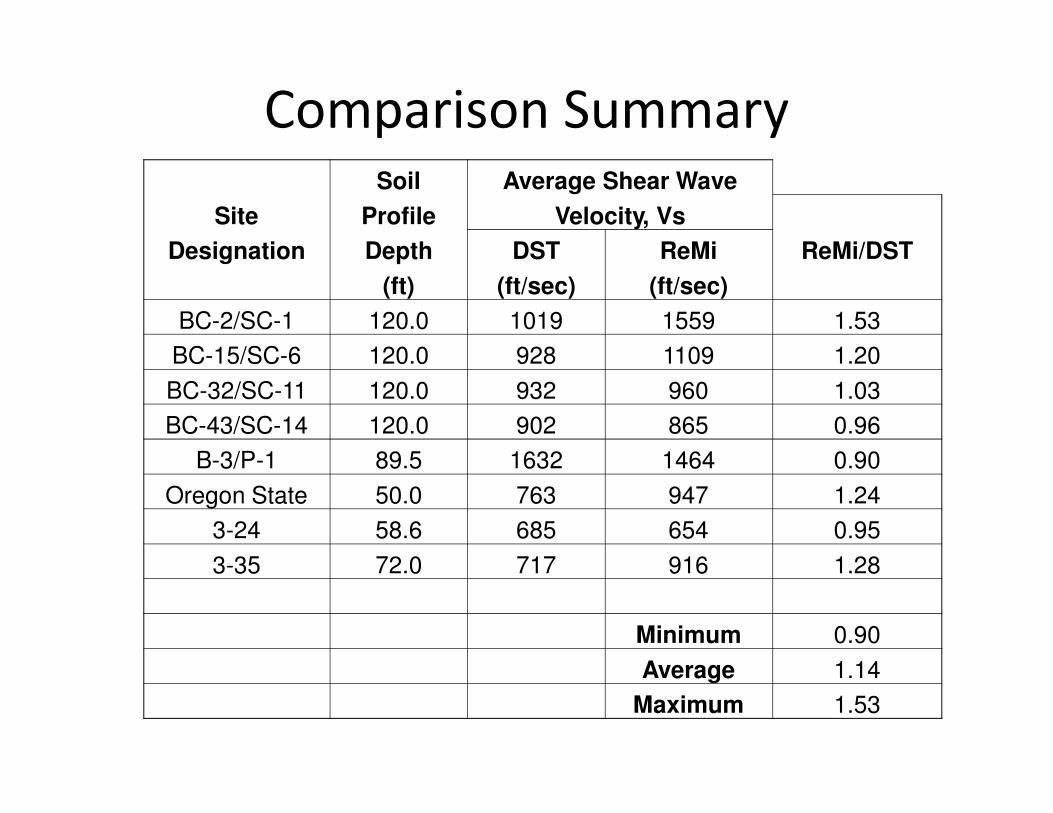
Comparison SummarySoil Average Shear Wave
Site Profile Velocity, Vs
Designation Depth DST ReMi ReMi/DST
(ft) (ft/sec) (ft/sec)
BC-2/SC-1 120.0 1019 1559 1.53
BC-15/SC-6 120.0 928 1109 1.20
BC-32/SC-11 120.0 932 960 1.03
BC-43/SC-14 120.0 902 865 0.96
B-3/P-1 89.5 1632 1464 0.90
Oregon State 50.0 763 947 1.24
3-24 58.6 685 654 0.95
3-35 72.0 717 916 1.28
Minimum 0.90
Average 1.14
Maximum 1.53
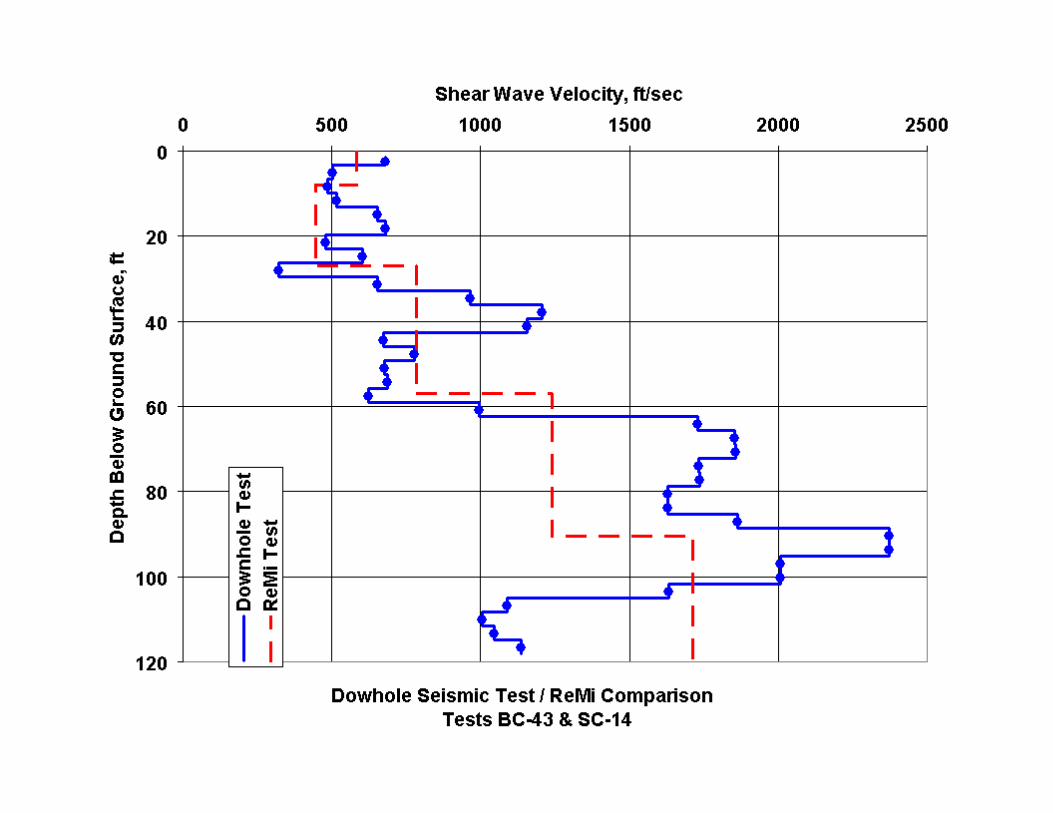
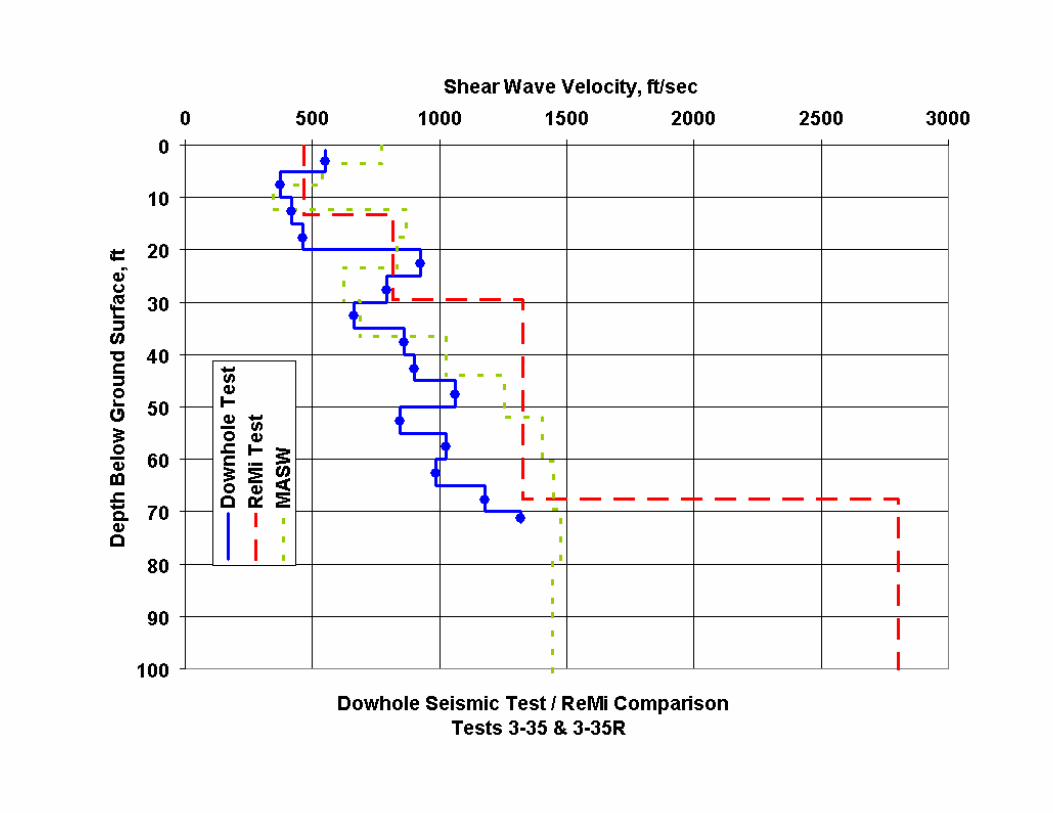
Shear Wave Velocity Measurements –
Advantages/Disadvantages
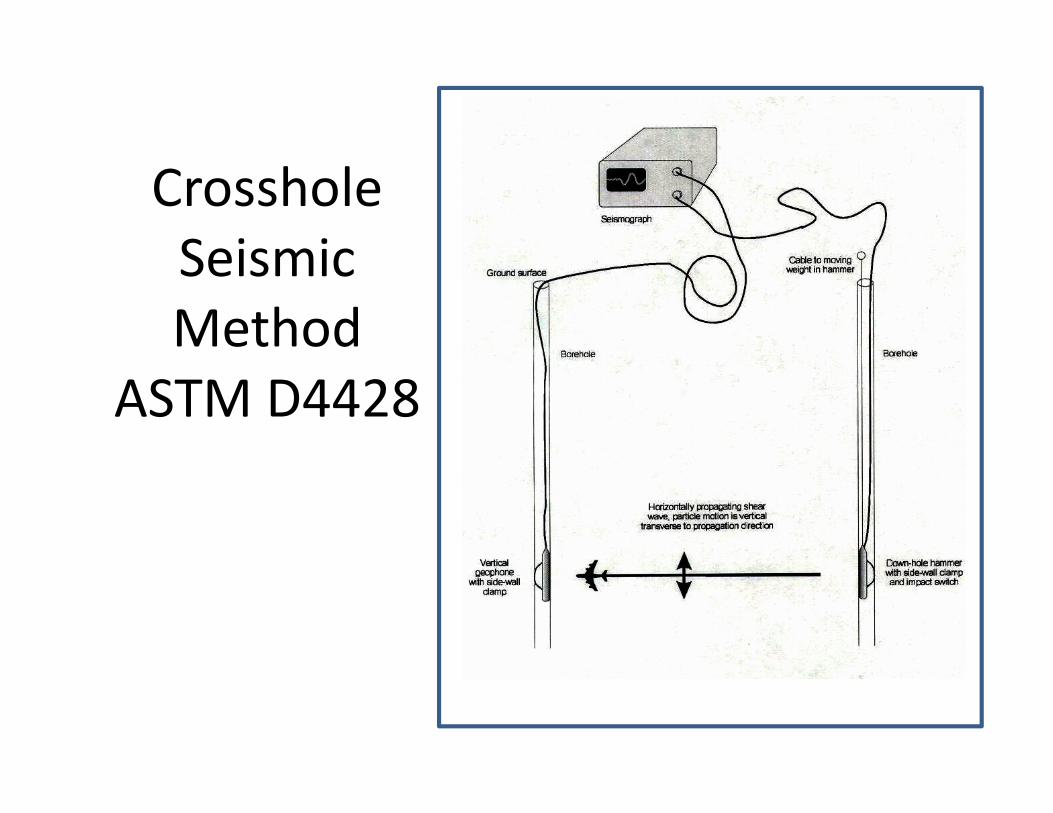
� Crosshole – most direct / accurate interval shear wave velocities - requires 2 to 3 cased boreholes – samples relatively small volume
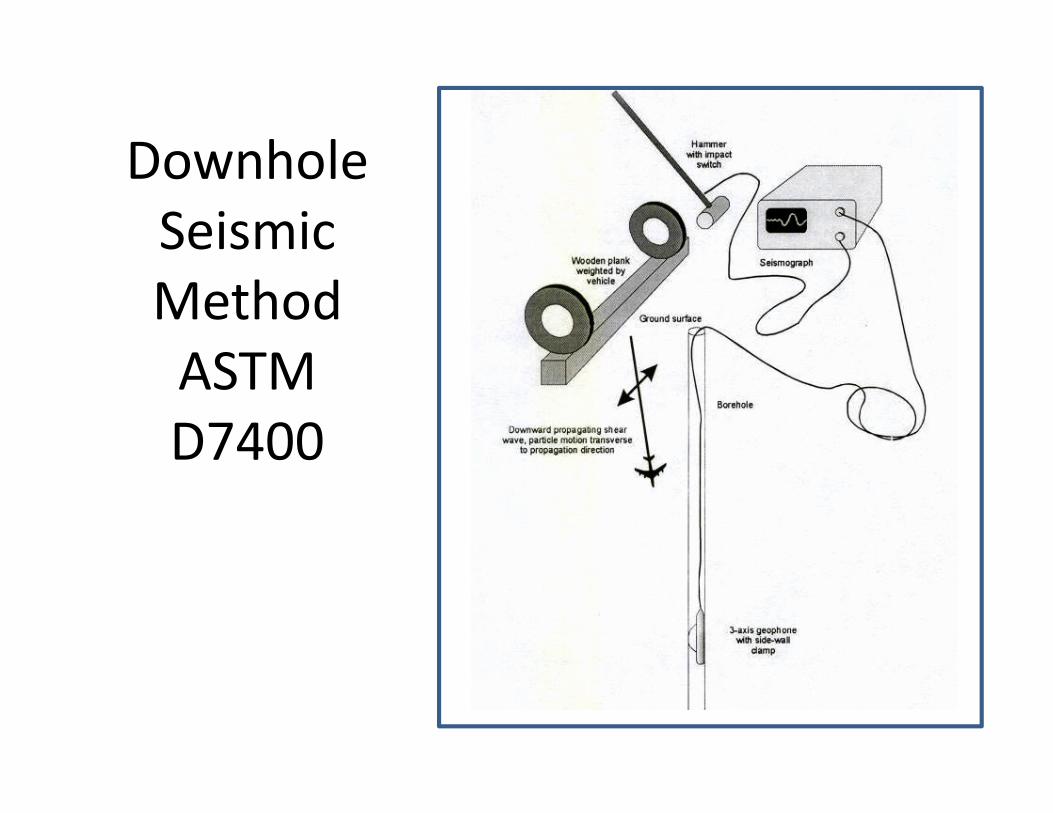
� Downhole – reasonably direct / accurate shear wave velocities – requires 1 cased borehole or deploy with CPT or dilatometer – samples relatively small volume
� ReMi – less accurate, can’t tell if you’re high or low –uses surface deployment of receivers to pick up ambient noise – samples relatively high volume
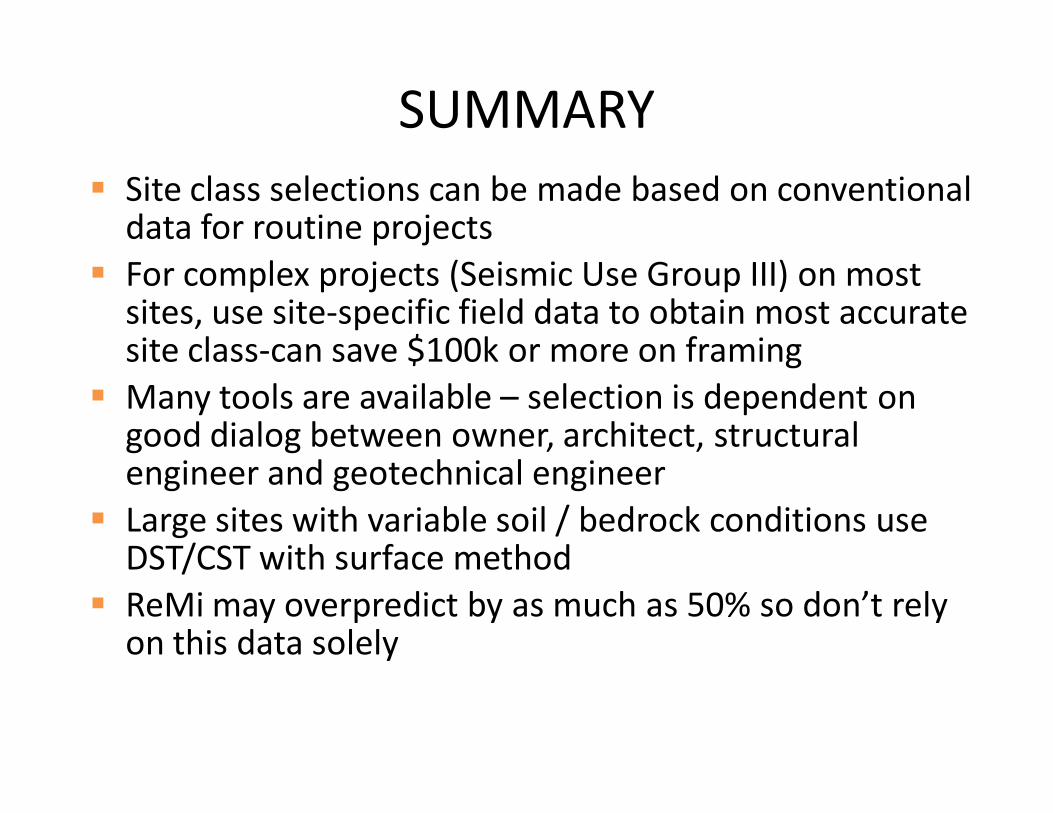
SUMMARY
� Site class selections can be made based on conventional data for routine projects
� For complex projects (Seismic Use Group III) on most sites, use site-specific field data to obtain most accurate site class-can save $100k or more on framing
� Many tools are available – selection is dependent on good dialog between owner, architect, structural engineer and geotechnical engineer
� Large sites with variable soil / bedrock conditions use DST/CST with surface method
� ReMi may overpredict by as much as 50% so don’t rely on this data solely