34
1 APBF APBF - - DEC Lubricants Project DEC Lubricants Project Presented by: Shawn D. Whitacre, NREL Presented at: 4 th JCAP Conference Tokyo, Japan June 1, 2005

1
APBFAPBF--DEC Lubricants ProjectDEC Lubricants Project
Presented by:
Shawn D. Whitacre, NREL
Presented at:
4th JCAP ConferenceTokyo, Japan
June 1, 2005

2
APBF-DEC Participants
AutomobileAutomobile• Ford• GM• DaimlerChrysler• Toyota
GovernmentGovernment• DOE• NREL• ORNL• EPA• CARB• SCAQMD
TechnologyTechnology
• Battelle
EnginesEngines• EMA• Caterpillar• Detroit Diesel• Cummins• John Deere• Mack Trucks• International
Truck & Engine
Emission ControlEmission Control
• MECA • Johnson Matthey• Delphi • 3M • Engelhard
• Siemens • Benteler • ArvinMeritor • Clean Diesel Tech. • Corning
• Donaldson Co. • OMG• NGK • Rhodia • Argillon
• Tenneco Automotive • Robert Bosch
Energy/AdditivesEnergy/Additives
• API • American Chemistry Council• BP • Castrol • ChevronOronite
• Chevron • Ciba • Ergon • Afton • ExxonMobil • Infineum
• Lubrizol • Marathon Ashland • Motiva • NPRA
• Pennzoil-Quaker State • Shell Global Solutions • Valvoline
• ConocoPhillips • Crompton

3
Two-Phase Approach
Engine-out Catalyst-out
OilOil
Phase IPhase I Phase IIPhase II
EmissionControlDevice
EmissionControlDevice

4
Objectives
• Part 1: Characterize effects of lubricant properties on engine out emissions
• Part 2: Develop methods to accelerate exposures of emission control systems (ECS) to lubricant-derived emissions
Phase IPhase I
Determine the impact of lubricant properties and composition on engine-out/catalyst-in emissions
Determine if lubricant formulation impacts the performance and durability of diesel engine ECS
Phase IIPhase II

5
Desired OutcomeDetermine which (if any) lube derived emission components are detrimental to ECS performance and durability
• Engine manufacturers
• ECS suppliers
Guidelines for lubricant formulation
Guidelines for lubricant formulation
• Basestock selection
• Additive chemistry
Design guidelinesDesign guidelines
The results will provide:

6
Phase 1

7
Phase 1Base Oils
• Group I: Valero (Paulsboro)• 4800-5600-ppm S, 75% saturates
• Group II: Excel (Lake Charles)• <20-ppm S, >99% saturates
• Group III: Motiva (Port Arthur, TX)• <5-ppm S, >99% saturates
• Group IV: BP• PAO (poly-alpha olefin, synthetic)• 0 sulfur• 5% ester for additive solubility (from Uniqema)
Phase I - Part 1Phase I - Part 1
Lubricant SelectionLubricant Selection
7

8
Ash 0 – 1.85%Sulfur 0 – 6590-ppmCalcium 0 – 4770-ppmZinc 0 – 1900-ppmPhosphorus 0 – 1700-ppmMagnesium 0 – 1700-ppmBoron 0 – 1235-ppm
Phase I - Part 1Phase I - Part 1
Additive PackagesLubricant SelectionLubricant Selection
• Five suppliers (Ciba, Chevron, Ethyl, Infineum, and Lubrizol) provided specifications on 26 candidate additive packages
• Five suppliers (Ciba, Chevron, Ethyl, Infineum, and Lubrizol) provided specifications on 26 candidate additive packages
• Range of constituents (in Group II base oil)• Range of constituents (in Group II base oil)
• Supplier and source of constituents not specified• Supplier and source of constituents not specified
8

9
Test Laboratory – Phase I
• Subcontractor: Automotive Testing Laboratories, (East Liberty, OH)
• Subcontractor: Automotive Testing Laboratories, (East Liberty, OH)
Phase I - Part 1Phase I - Part 1

10
Test Engine
• 7.3L OHV V-8• Direct injection, turbocharged w/ wastegate• HEUI fuel system• 215 hp at 2400 rpm• 540 ft-lbs torque at 1500 rpm• Exhaust gas recirculation (retrofit)• Closed crankcase ventilation with filter• Lube system capacity: 18 quarts
Phase I - Part 1Phase I - Part 1
• 1999 International T444E• 1999 International T444E

11
12
3
4
Test Modes and Emissions Measurements
Four Mode Steady-State (OICA)• Mode 1: Rated Condition• Mode 2: High Torque• Mode 3: Road Load• Mode 4: Low Torque
Emissions Measurements• Gases (HC, CO, CO2, NOx, SO2)• PM – three sampling trains
– TPM, SOF, SO4
– Metals– PAHs
12
3
4
800
700
600
500
400
300
200
100
0700 1200 1700 2200 2700
Speed (RPM)To
rque
(N
m)
Phase I - Part 1Phase I - Part 1
12
Data Analysis Questions #1 and #2
• Are there significant differences in engine-out emissions that can be attributed to oil properties?
• If so, how much of an impact is due to properties of the additive package? …base oil?
Phase I - Part 1Phase I - Part 1
1
2

13
SO2 Emissions – Significant Additive and Base Oil Effects• Additive packages
c and i produced highest SO2emissions
• Significant base oil effect – Group 1 highest
• Magnitude of the effects do not directly correlate with sulfur content of oil
4-Mode OICA Weighted0.018
0.000
0.002
0.004
0.006
0.008
0.010
I II III IV I II III IV I II III IV I II III IV I II III IV I II III IV II II II II II II II II
a b c d e f g h i j k l r* r**
Base Oil/Additive
Adj
. SO
2 (g
/Bh
p-H
r)
*Pre-aging. **Post-aging.
8930-ppm S(Highest)
8930-ppm S(Highest) 3500-ppm S3500-ppm S
245-ppm S(Lowest)
245-ppm S(Lowest)
Phase I - Part 1Phase I - Part 1

14
Also… Significant Effects of Additive Packages and Base Oils on SO2
• Many significant differences among the 6 additive packages tested in all four base oils
• Significant base oil effect – Group 1 highest
• No significant interactions between additive packages and base oils
Phase I - Part 1Phase I - Part 1
4-Mode OICA Weighted
0.000
0.001
0.002
0.003
0.004
0.005
0.006
A Z Y M B T 1 3 2 4
Effect of Additive Package Effect of Base Oil
Adj
. SO
2 (g
/Bhp
-Hr)
Main Effects of Additives and Base Oils
15
Data Analysis Question #3
Which emissions species can be directly predicted from the properties of the oil and fuel?
3
Phase I - Part 1Phase I - Part 1

16
Mass Balance
• Metals • SO4• Metals • SO4
• SO2• SO2
• Emissions from fuel and oil consumptions and wear metals
• Recovery rates obtained by comparing measured emissions with calculated values based on fuel and oil properties
Phase I - Part 1Phase I - Part 1
FuelFuel
Lube OilLube Oil
PMEmissions
PMEmissions
GaseousEmissionsGaseous
Emissions
16

17
Ca Mass Balance• Ca emissions directly
correlated with concentration in oil
• No apparent composition effects
• 42% recovery rate
• Ca emissions directly correlated with concentration in oil
• No apparent composition effects
• 42% recovery rate
0.0
0.2
0.4
0.6
0.8
1.0
0.0 0.2 0.4 0.6 0.8 1.0
x=y
Mea
sure
d Va
lue
(mg/
Bhp
-Hr)
Calculated Value (mg/Bhp-Hr)
Phase I - Part 1Phase I - Part 1

18
P Mass Balance
0.0
0.1
0.2
0.3
0.4
0.5
0.0 0.1 0.2 0.3 0.4 0.5
Calculated Value (mg/Bhp-Hr)
Mea
sure
d Va
lue
(mg/
Bhp
-Hr)
x=y
• P emissions directly correlated with concentration in oil
• Oil c2, c3 and c4 deviate significantly
• 86% recovery rate (excl. Oils c2, c3 and c4)
• P emissions directly correlated with concentration in oil
• Oil c2, c3 and c4 deviate significantly
• 86% recovery rate (excl. Oils c2, c3 and c4)
Phase I - Part 1Phase I - Part 1

19
Sulfur Mass Balance (continued)
• S emissions directly correlated with concentration in oil
• Oil i significantly deviates
• 125% recovery rate (excl. Oils i)
• S emissions directly correlated with concentration in oil
• Oil i significantly deviates
• 125% recovery rate (excl. Oils i)
8.08.0
9.210.2
0
1
2
3
4
0 1 2 3 4Calculated Value (mg/Bhp-Hr)
Mea
sure
d Va
lue
(mg/
Bhp
-Hr)
Oil a* Oil b* Oil c*
Oil d* Oil e* Oil f*
Oil g* Oil h* Oil i*
Oil j* Oil k* Oil l*
Oil a(I) Oil b(I) Oil c(I)
Oil d(I) Oil e(I) Oil f(I)
Oil a(III) Oil b(III) Oil c(III)
Oil d(III) Oil e(III) Oil f(III)
Oil a(IV) Oil b(IV) Oil c(IV)
Oil d(IV) Oil e(IV) Oil f(IV)
Oil i r*-Pre r-Pre
r*-Post r-Post Pred.
x=y
*Tested using fuel w ith 4.54 ppm sulfur. Note: Oil c1 excluded.
Phase I - Part 1Phase I - Part 1

20
Phase I Conclusions
• Lubricant formulation has modest effects on regulated emissions • +10% for CO and NOx, +20% for PM, and +30% for HC
• Sulfur content in the oil has significant effects on sulfur emissions.
• However, oil formulation (beyond oil sulfur content) can have a significant impact on SO2emissions (e.g. oils c and i)
• Metals (S, P, Zn, Ca) emissions correlate with concentration in oil
Phase I - Part 1Phase I - Part 1

21
Phase 2

22
Test Laboratory – Phase 2
• Subcontractor: Analytical Engineering, Inc. (AEI) Columbus, Indiana
• Subcontractor: Analytical Engineering, Inc. (AEI) Columbus, Indiana
Phase I - Part 1Phase I - Part 1

23
Test Hardware – Phase 2
2002 Cummins ISB – 300 hp @ 2500 rpm5.9L, inline 6 cylinderCooled-EGRSingle NOx adsorber (7L)In-pipe regeneration fueling

24
Test Protocol
400-hour testEvaluations at 100-hour intervals
- Focus on NOx reduction efficiencyOil consumption measurementNew LNT for each testOil change at 200-hoursDEC base fuel (0.6-ppm S/15-ppm S)Post-analysis of catalyst by XRF

25
Operating Modes
Mode
Engine Speed (RPM)
Load (FT*Lbs)
Average Catalyst
Mid Temp. ºF
(ºC)
Space Velocity (1/hr)
1 1650 140 650 (343) 30,000 2 2100 175 650 (343) 70,000 3 1400 160 750 (399) 32,000 4 1900 225 750 (399) 63,000 5 1200 275 850 (454) 33,000 6 1700 350 850 (454) 62,000

26
Phase 2 Analysis Approach
Engine-outEmissions
TailpipeEmissions
OilOilNOx
AdsorberCatalyst
NOxAdsorberCatalyst
Fuel/OilProperties
CatalystDeposits

27
Test Matrix
ZDDP Level
Calc
ium
Det
erge
nt L
evel
A
DEF
B
C

28
Properties of Test Oils
Viscosity
Test Number
Ash* (%)
S* (ppm)
Ca (ppm)
P (ppm)
Zn (ppm)
N* (ppm)
TBN (mg
KOH/g)@100ºC
(cSt)
@40ºC
(cSt) Soot (%)
1 0.775 1695 1853 427 471 1128 6.99 14.9 111.3 0.07 2 1.522 2928 3258 1210 1320 1329 12.34 15.0 111.9 0.06 3 1.131 3980 2050 1430 1590 1477 7.3 15.0 111.9 0.06 4 1.316 4195 3160 1340 1520 1314 10.6 15.0 112.5 0.12 5 1.310 2228 3241 419 475 1368 9.6 14.6 107.7 0.12 6 1.497 4197 3518 1280 1480 1315 10.2 14.7 109.1 0.11 7 0.775 1695 2065 451 505 1128 6.7 14.9 110.9 0.08 8 0.775 1695 2329 483 546 1128 8.7 14.9 110.9 0.11

29
Catalyst Deposit Profile
Sulfur
0%
20%
40%
60%
80%
100%
Front Middle Rear
Catalyst Position
Per
cent
of T
otal
Su
lfur
Depo
sits
Phosphorus
0%
20%
40%
60%
80%
100%
Front Middle Rear
Catalyst PositionPe
rcen
t of T
otal
Ph
osph
orou
s D
epos
its

30
Phosphorus Impact on PerformanceC
hang
e in
NO
x R
educ
tion
Effic
ienc
y (%
)
-80%
-60%
-40%
-20%
0%
0.0 0.1 0.2 0.3 0.4 0.5Phosphorous Exposure over 400 Hours of Aging (g/liter)
A-1 A-7 B-3 E-2 F-4 C-5 D-6Lubricant-Test Number:

31
Impact of DetergentA
vera
ge S
ulfu
r + P
hosp
horo
us D
epos
its (g
/lite
r)
0
1
2
3
4
0.5 1.0 1.5 2.0 2.5
Exposure Amount (g/liter)Low Ca Sulfonate High Ca Sulfonate High Ca Phenate High Ca Salicylate
32
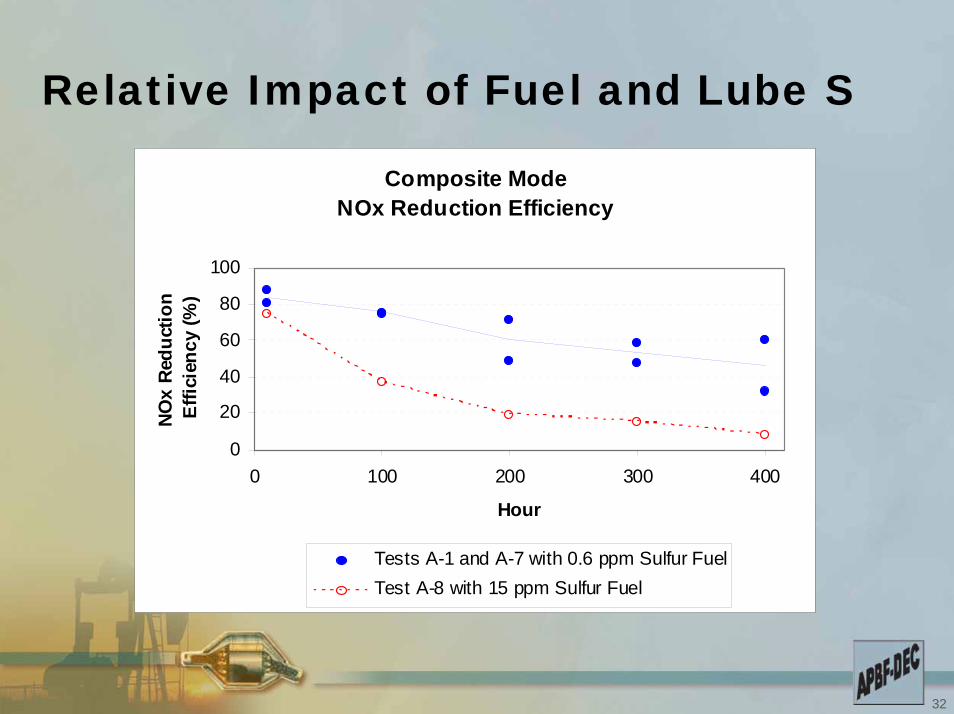
Relative Impact of Fuel and Lube S
Composite ModeNOx Reduction Efficiency
0
20
40
60
80
100
0 100 200 300 400
Hour
NOx
Redu
ctio
n Ef
ficie
ncy
(%)
Tests A-1 and A-7 with 0.6 ppm Sulfur FuelTest A-8 with 15 ppm Sulfur Fuel

33
Preliminary Conclusions – Phase 2Final reporting still in progress
Will be available late 2005
Sulfur and phosphorus in lube oil appear to impact LNT performanceDeposits of lube oil derived species concentrated on front of catalystDetergent level may temper the effectFuel sulfur still appears to be dominant in terms of degradation

34
THE END


