Page 1
Pro-VIZOR: Process Tunable Virtually Zero Margin Low Power Adaptive RF for Wireless Systems
Pro-VIZOR: Process Tunable Virtually Zero Margin Low Power Adaptive RF for Wireless Systems
Presented by: Presented by: Shreyas Shreyas SenSenJune 11,June 11, 2008. Paper 2008. Paper 27.327.3, DAC , DAC 08.08.
Shreyas Sen, Vishwanath Natarajan, Rajarajan Shreyas Sen, Vishwanath Natarajan, Rajarajan Senguttuvan,Senguttuvan,
Abhijit ChatterjeeAbhijit Chatterjee
Georgia Institute of TechnologyGeorgia Institute of Technology
Page 2
Goal
Traditional wireless circuits
Designed for worst case environmental variations
and
worst case process corners.
Involves significant built in design margin.
MotivationMotivation
Waste of performance (i.e. power) under favorable condition.
SAVE POWER by adapting to environment and process.
Page 3
Process Tunable Virtually Zero Margin RFProcess Tunable Virtually Zero Margin RF
BasebandReceiver
Transmitter
BasebandTransmitter
Receiver
Base Station (BS)Base Station (BS) Mobile Station (MS)Mobile Station (MS)
Save Power
Save Power
Worst Case System Design
Worst Case System Design
Adaptive System Design
Adaptive System Design
Varyingchannel
Process adaptability
Page 4
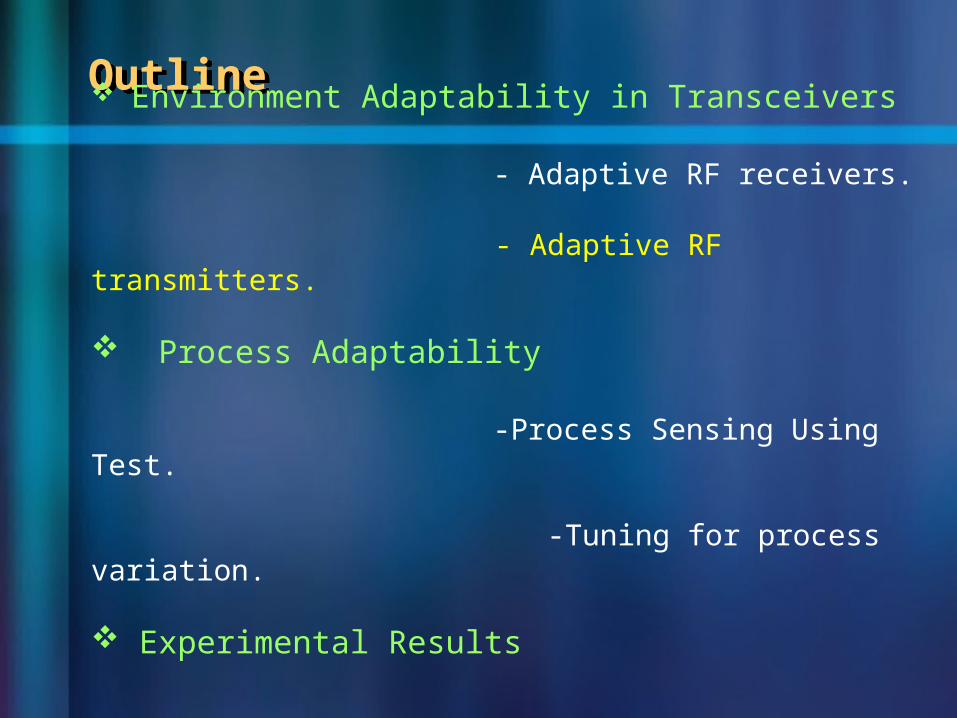
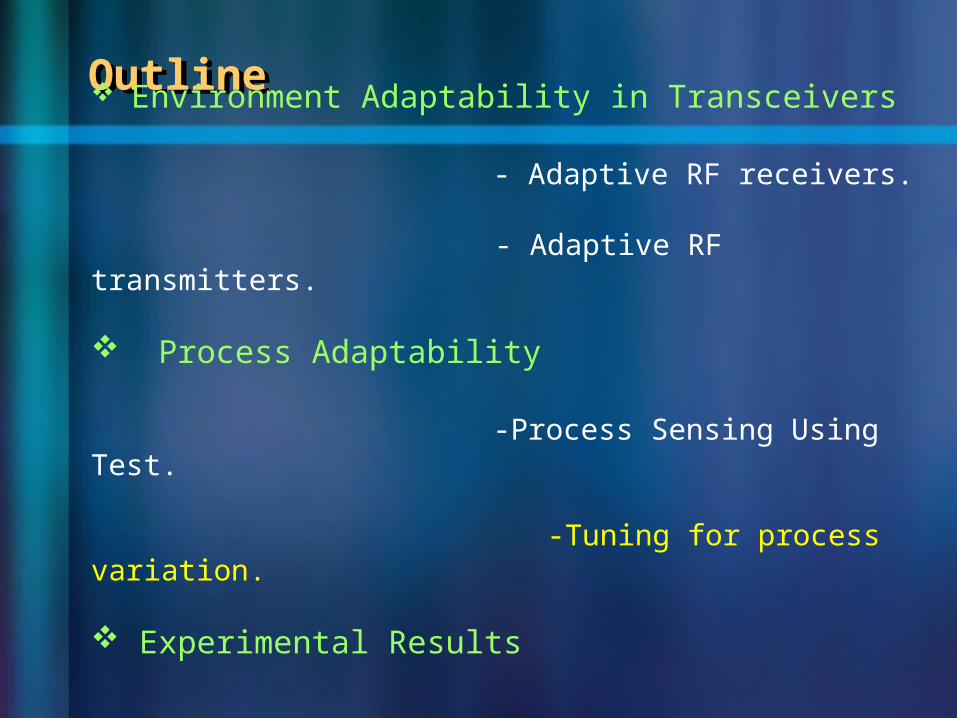
OutlineOutline
Environment Adaptability in Transceivers
- Adaptive RF receivers. - Adaptive RF transmitters.
Process Adaptability -Process Sensing Using Test.
-Tuning for process variation.
Experimental Results
Page 5
OutlineOutline
Environment Adaptability in Transceivers
- Adaptive RF receivers. - Adaptive RF transmitters.
Process Adaptability -Process Sensing Using Test.
-Tuning for process variation.
Experimental Results
Page 6
VIZOR: ReceiverVIZOR: Receiver
Adaptation metric is a measure of the quality of the received signal. Adaptation metric is a measure of the quality of the received signal.
Page 7
010010
Baseband&RF
Baseband&RF
010010
Transmission ReceptionChannel
BER =tR
Ne
Modulation Demodulation
Ne = Number of errorsR = Data ratet = Test time
Adaptation metric selectionAdaptation metric selection
Bit Error Rate (BER)Bit Error Rate (BER)
Cannot be calculated in real-timeCannot be calculated in real-time
Error Vector Magnitude (EVM)Error Vector Magnitude (EVM)
1
2 e
I
Q
Error in thereceived symbolV2
V1 e = V1 - V2
Can be calculated in real-timeCan be calculated in real-time
Page 8
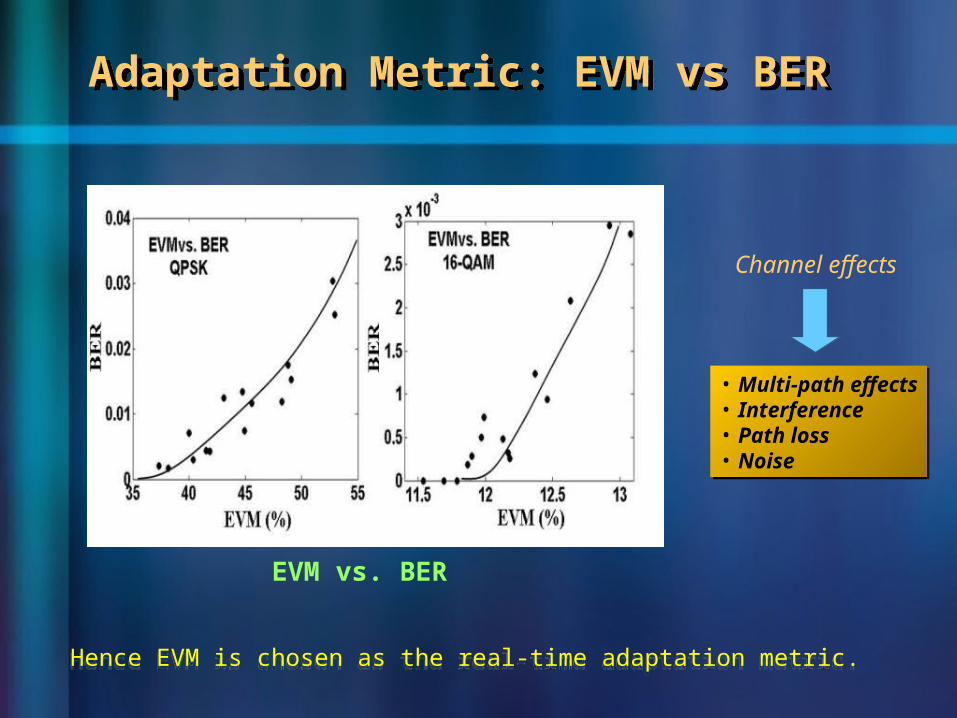
EVM vs. BER
Channel effects
Adaptation Metric: EVM vs BER Adaptation Metric: EVM vs BER
Hence EVM is chosen as the real-time adaptation metric. Hence EVM is chosen as the real-time adaptation metric.
• Multi-path effects• Interference• Path loss• Noise
• Multi-path effects• Interference• Path loss• Noise
Page 9
VIZOR operation-Operation close toerror threshold
VIZOR operation-Operation close toerror threshold
Normal operationNormal operation
Save powerSave power
VIZOR Operation : ConstellationVIZOR Operation : Constellation
EVM=22%EVM=22%
EVM=8%EVM=8%
EVM=35%EVM=35%
EVM=14%EVM=14%
VIZOR operationVIZOR operation
Channel 1Channel 1
Channel 2Channel 2
Page 10
Receiver hardware and Power SavingsReceiver hardware and Power Savings
Page 11
Tuning Knob 2
Performance
Tuning knob 1
Minimum power, maximum EVM locus
Increasing performance P
Tuning knob: Vdd, Vbias of different RF block, ADC wordsize
Power vs. Performance locusPower vs. Performance locus
Page 12
OutlineOutline
Environment Adaptability in Transceivers
- Adaptive RF receivers. - Adaptive RF transmitters.
Process Adaptability -Process Sensing Using Test.
-Tuning for process variation.
Experimental Results
Page 13
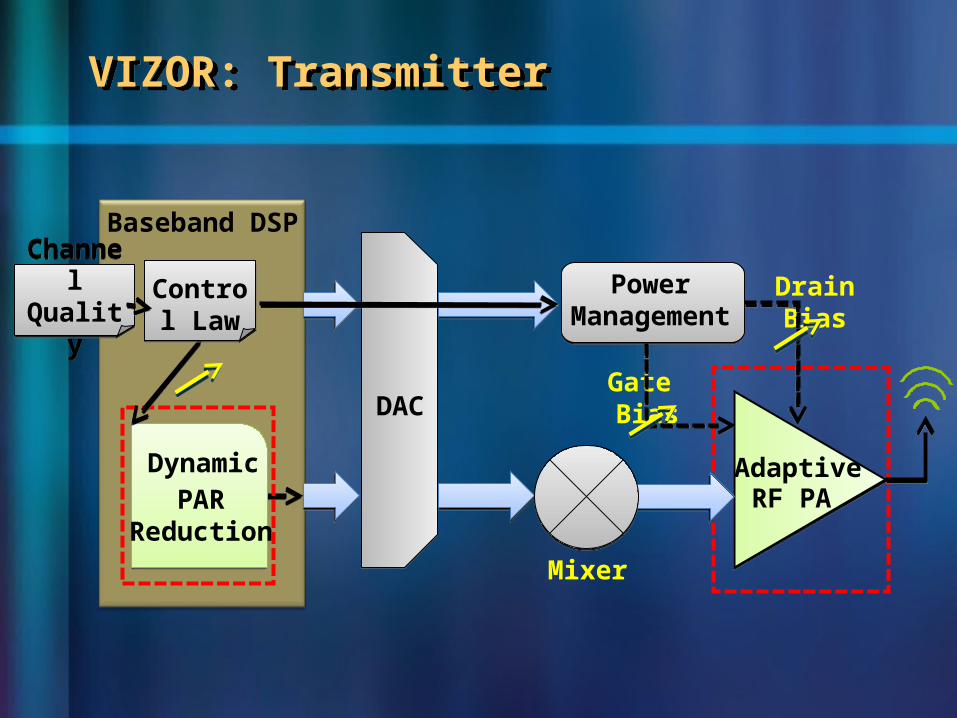
VIZOR: TransmitterVIZOR: Transmitter
RF PA
Drain Bias
Gate Bias
Power Management
DAC
Mixer
Baseband DSP
PARReduction
Control Law
Channel QualityChannel Quality
Dynamic Adaptive
Page 14
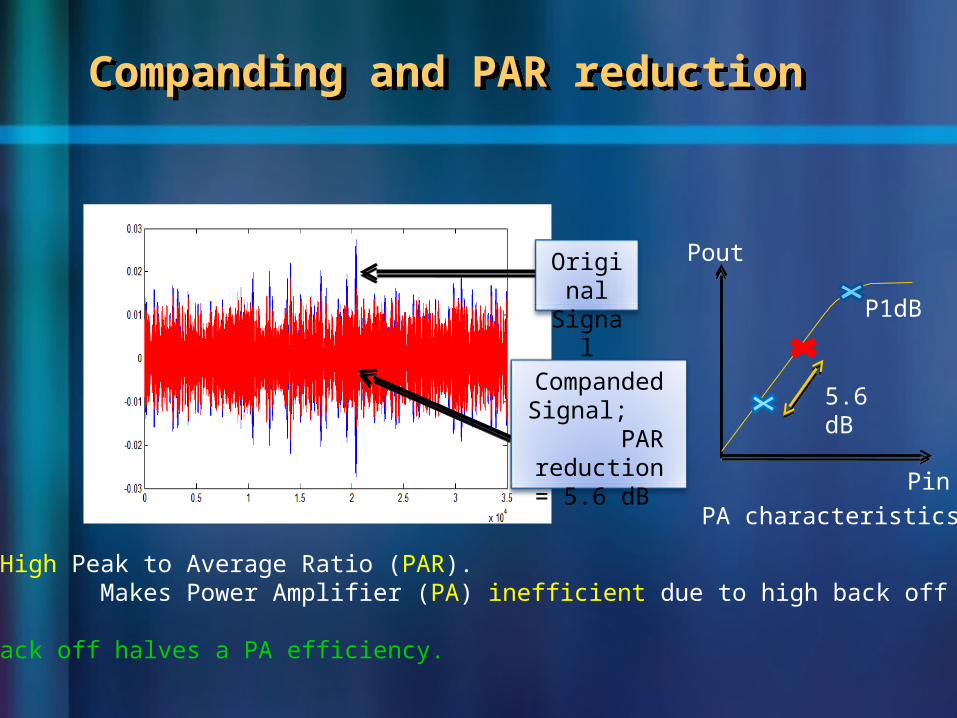
Companded Signal;
PAR reduction = 5.6 dB
OFDM: High Peak to Average Ratio (PAR). Makes Power Amplifier (PA) inefficient due to high back off required.
3 dB back off halves a PA efficiency.
Pin
Pout
PA characteristics
Original Signal
P1dB
5.6 dB
Companding and PAR reductionCompanding and PAR reduction
Page 15
Compliance to BER threshold Compliance to BER threshold
PAR Reduction
BER moderate channel
BER good channel
EVM moderate channel
EVM good channel
µ : Companding Factor
Page 16
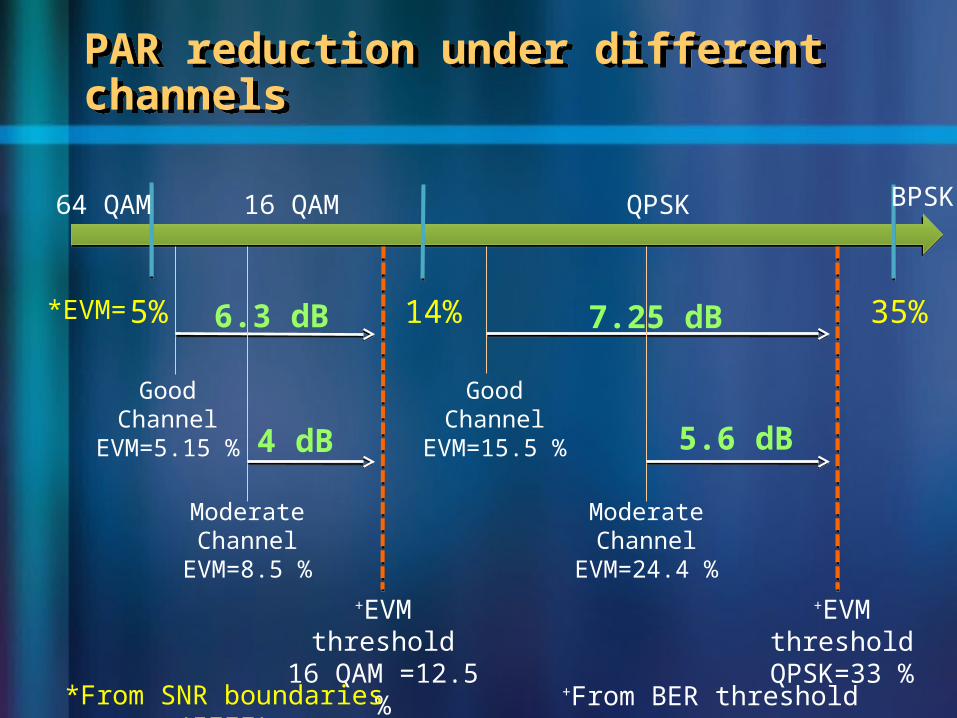
PAR reduction under different channels PAR reduction under different channels
64 QAM BPSK
5% 14% 35%
16 QAM QPSK
*EVM=
+EVM threshold16 QAM =12.5 %
+EVM thresholdQPSK=33 %
Good ChannelEVM=5.15 %
Moderate ChannelEVM=8.5 %
6.3 dB
4 dB
Moderate ChannelEVM=24.4 %
7.25 dB
5.6 dB
Good ChannelEVM=15.5 %
*From SNR boundaries (IEEE) +From BER threshold
Page 17
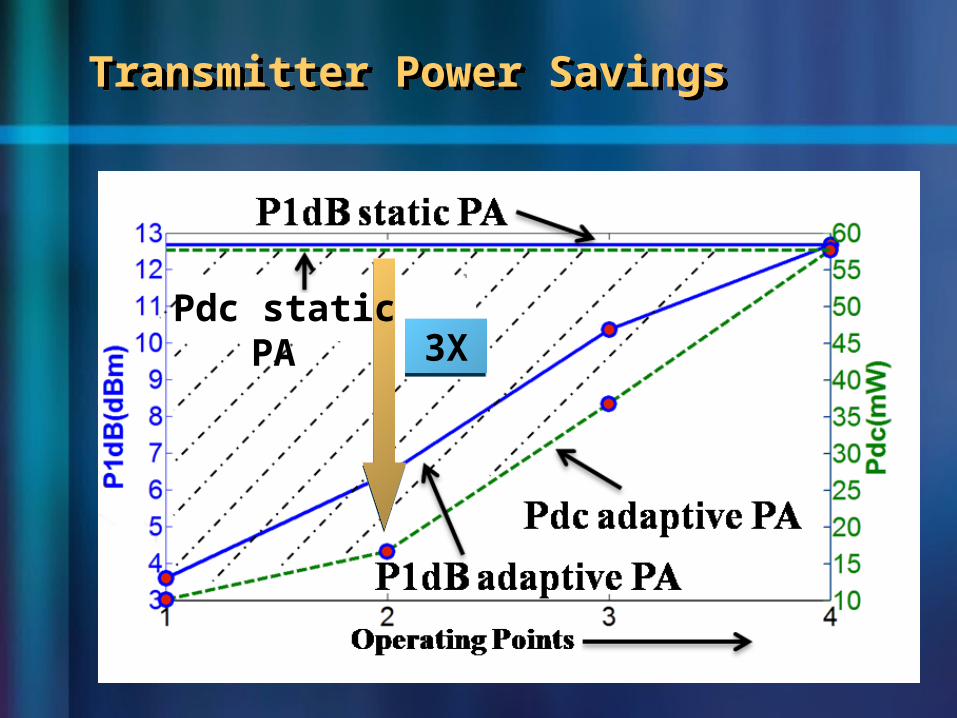
Transmitter Power SavingsTransmitter Power Savings
3X3XPdc static PA
Page 18
OutlineOutline
Environment Adaptability in Transceivers
- Adaptive RF receivers. - Adaptive RF transmitters.
Process Adaptability -Process Sensing Using Test.
-Tuning for process variation.
Experimental Results
Page 19
Minimum power, maximum EVM locus
Increasing performance P
PROCESS
Effect of process variations: run RF BIST to pick the “Right” locus under variation.
Effect of Process variationEffect of Process variation
Performance
Tuning Knob 2
Tuning knob 1
Page 20
Process SensingProcess Sensing
Transmitter spec estimation
Receiver spec estimation
BASEBAND DSP
Rx Module
Embedded sensor
Loopback hardware
TxModule
Transmitter spec estimation
Receiver spec estimation
BASEBAND DSP
Rx Module
Embedded sensor
Loopback hardware
TxModule
*V. Natarajan et. al. “ACT: Adaptive Calibration test….” VTS 08*V. Natarajan et. al. “ACT: Adaptive Calibration test….” VTS 08
Page 21
OutlineOutline
Environment Adaptability in Transceivers
- Adaptive RF receivers. - Adaptive RF transmitters.
Process Adaptability -Process Sensing Using Test.
-Tuning for process variation.
Experimental Results
Page 22
Process tuningProcess tuning
Design PhaseDesign Phase Production Test/Tuning PhaseProduction Test/Tuning Phase
Minimum power & Maximum
EVM locus for Np instances
Process Sensing & Process Tuning
Process Sensing & Process Tuning
Locus corresponding to the BEST MATCH (LMS)
DUT
Np process instances
For each processinstance
Perform environmental Adaptation during run timePerform environmental Adaptation during run time
Process 1Process 2
Process Np
PerformanceGain, IIP3, P/ Vdd, P/ Vb
..
Gain, IIP3, P/ Vdd, P/ Vb
Process adaptation metric for Np instances
Performance
Measure TX process
Measure RX process
Find BEST MATCH with available Np process instances
Measure Power sensitivities
Page 23
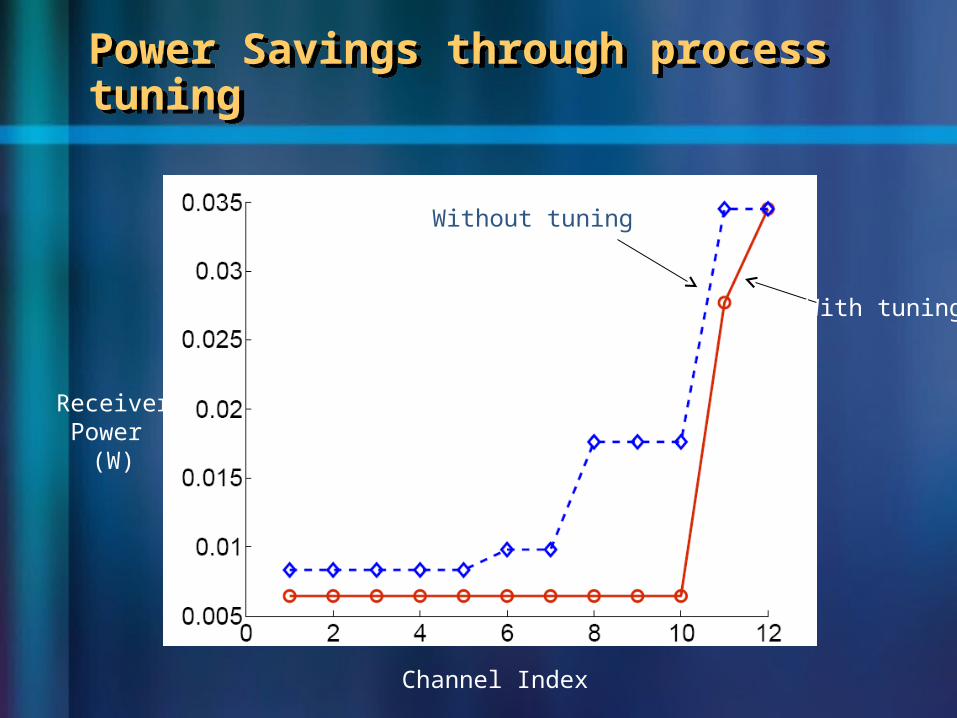
With tuning
Without tuningWithout tuning
Channel Index
ReceiverPower
(W)
Power Savings through process tuningPower Savings through process tuning
Page 24
OutlineOutline
Environment Adaptability in Transceivers
- Adaptive RF receivers. - Adaptive RF transmitters.
Process Adaptability -Process Sensing Using Test.
-Tuning for process variation.
Experimental Results
Page 25
VIZOR system VIZOR system
VIZOR TX and RX
Page 26
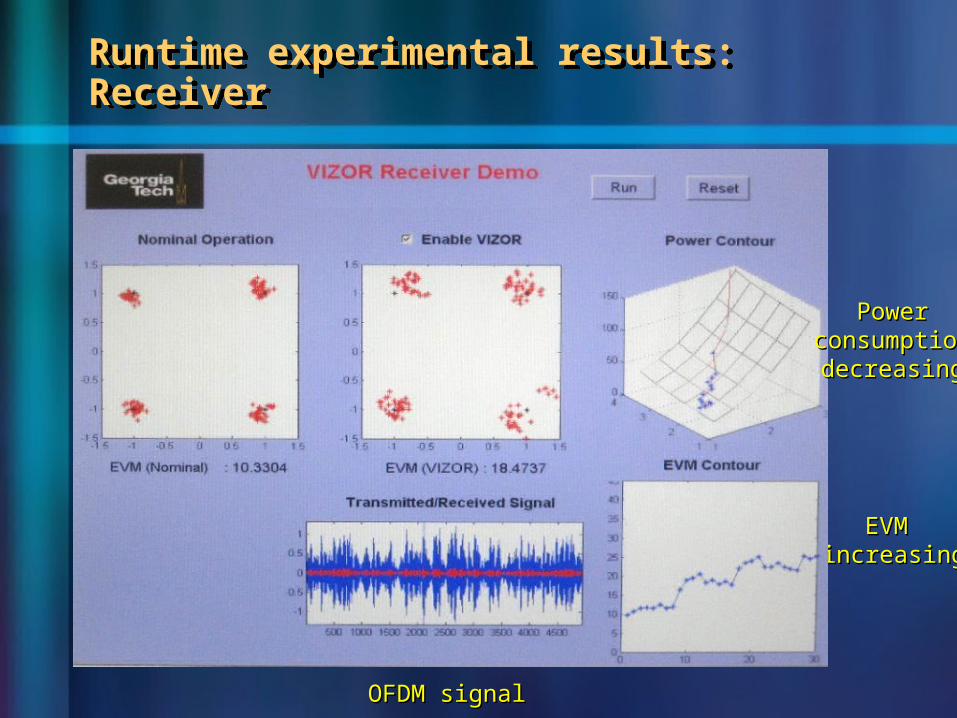
Runtime experimental results: ReceiverRuntime experimental results: Receiver
EVM EVM increasingincreasing
OFDM signalOFDM signal
Power Power consumption consumption decreasingdecreasing
Page 27
System in OperationSystem in Operation
Page 28
Environment Adaptability allows transceiver operation with very less built in design margin. (i.e. Virtually Zero Margin) - Saves significant power under favorable environmental condition.
- 3X transmitter and 4X receiver power savings could be achieved.
Process Adaptability makes this adaptation near optimal even under process variation.
ConclusionConclusion
Significant increase in battery life.Significant increase in battery life.
Page 29
Questions ? Questions ?
Page 30
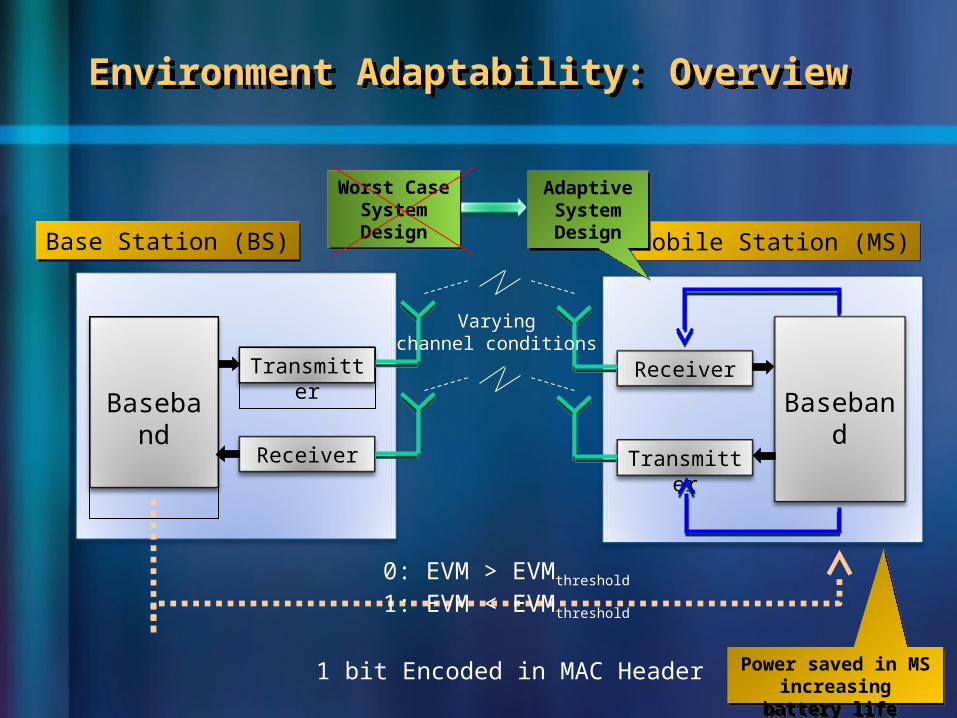
Environment Adaptability: OverviewEnvironment Adaptability: Overview
BasebandReceiver
Transmitter
BasebandTransmitter
Receiver
Base Station (BS)Base Station (BS) Mobile Station (MS)Mobile Station (MS)
1 bit Encoded in MAC Header
0: EVM > EVMthreshold
1: EVM < EVMthreshold
Power saved in MS increasing battery life Power saved in MS
increasing battery life
Worst Case System Design
Worst Case System Design
Adaptive System Design
Adaptive System Design
Varyingchannel conditions
Page 31
VIZOR OptimizerVIZOR Optimizer
Zero-margin operation – Save more power under favorable conditions (good channel)!!
Identify tunable Parameters
• LNA supply• LNA bias
• Mixer supply• Mixer bias
• ADC word sizeSet EVM threshold for satisfactory operation
Generate different Channels
• Interference• Multi-path
•Noise
Optimization
Optimal values oftunable parameters for
• Different channelconditions
• Different modulations (data rates)
Page 32
PAR reduction and compliance to BER threshold PAR reduction and compliance to BER threshold
Page 33
• Estimate transmitter specs• Tune the transmitter – Hardware + software knobs
-Process variation, non-idealities• Estimate Receiver specs
Transmitter spec estimation
Receiver spec estimation
BASEBAND DSP
Rx Module
Embedded sensor
Loopback hardware
Tuning
control
Tx Module
Tu
ned
ou
tpu
t
Baseband response
Process Sensing: Adaptive Calibration TestProcess Sensing: Adaptive Calibration Test
Page 34
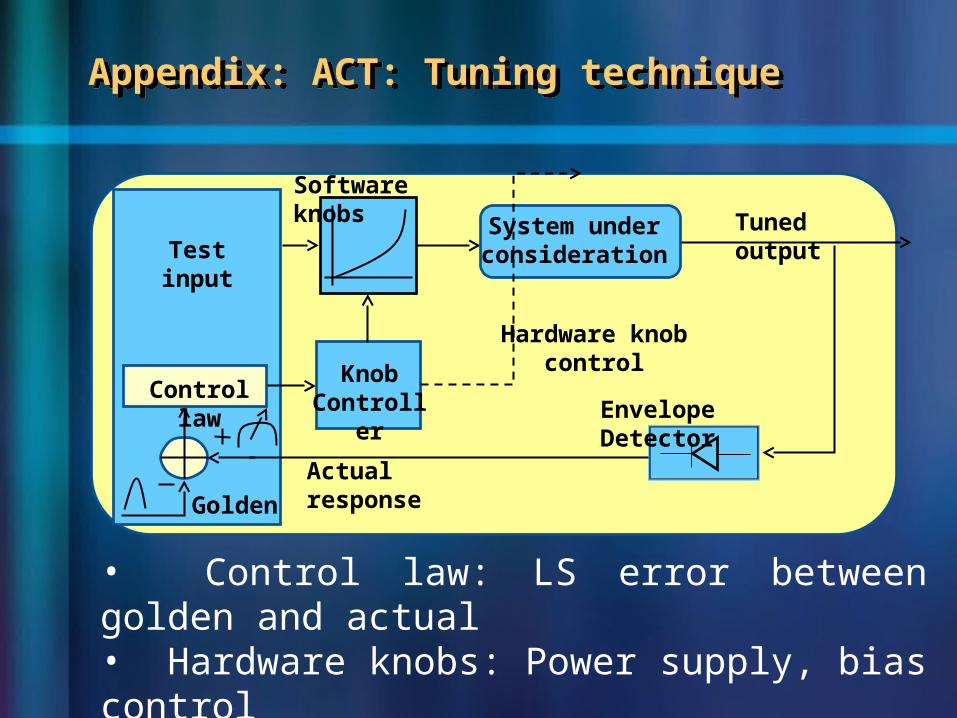
• Control law: LS error between golden and actual• Hardware knobs: Power supply, bias control• Software knobs: Reverse distortion polynomials
Control law
Test input
System under consideration
Knob Controll
er
Software knobs Tuned
output
Actual responseGolden
Hardware knob control
Envelope Detector
Appendix: ACT: Tuning techniqueAppendix: ACT: Tuning technique
Page 35
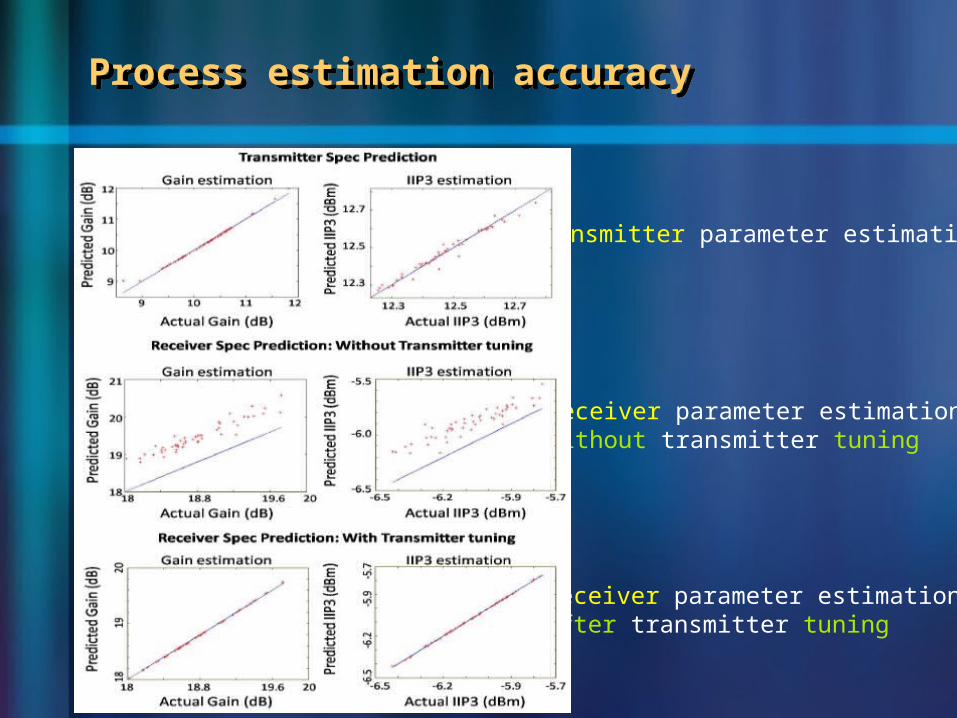
Transmitter parameter estimation
Receiver parameter estimation without transmitter tuning
Receiver parameter estimation after transmitter tuning
Process estimation accuracyProcess estimation accuracy