26

Today’sPresenters
Q2 2021 Interim Report
Richard BrownCEO
Tore FormoGroup CFO
2
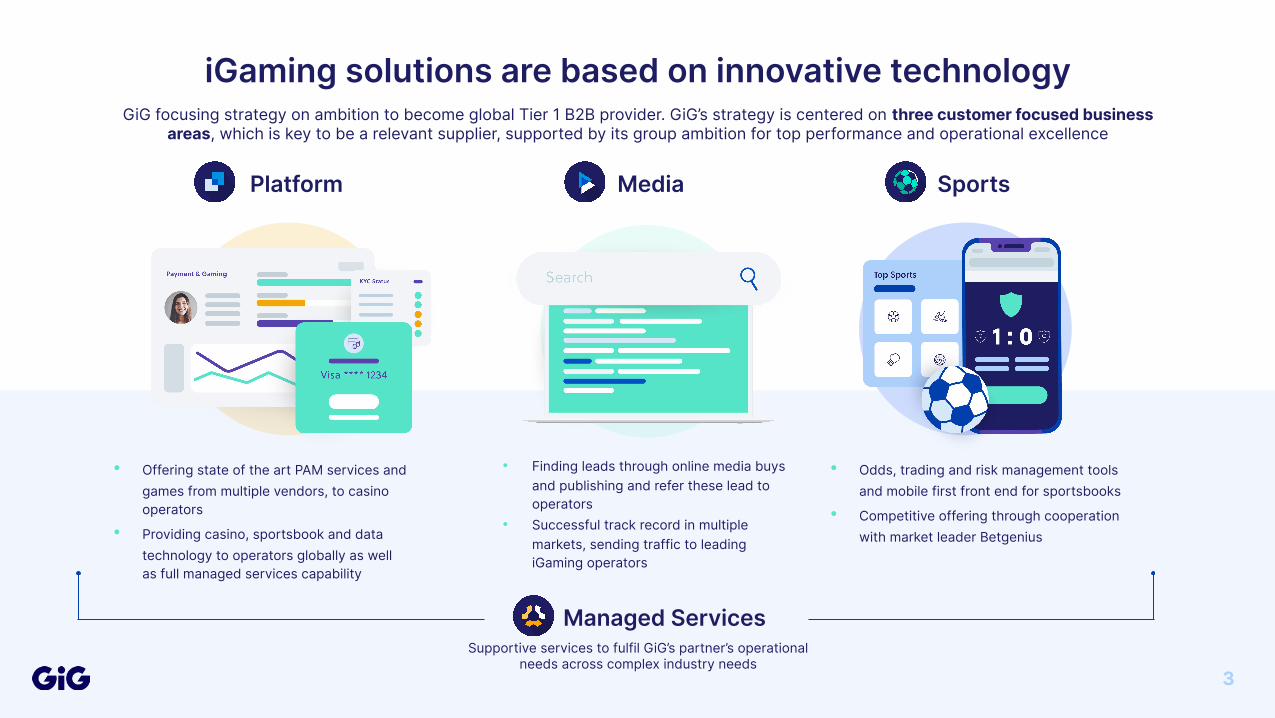
GiG focusing strategy on ambition to become global Tier 1 B2B provider. GiG’s strategy is centered on three customer focused business areas, which is key to be a relevant supplier, supported by its group ambition for top performance and operational excellence
3Supportive services to fulfil GiG’s partner’s operational
needs across complex industry needs
iGaming solutions are based on innovative technology
• Offering state of the art PAM services and games from multiple vendors, to casino operators
• Providing casino, sportsbook and data technology to operators globally as well as full managed services capability
• Finding leads through online media buys and publishing and refer these lead to operators
• Successful track record in multiple markets, sending traffic to leading iGaming operators
Platform Media
Managed Services
• Odds, trading and risk management tools and mobile first front end for sportsbooks
• Competitive offering through cooperation with market leader Betgenius
Sports
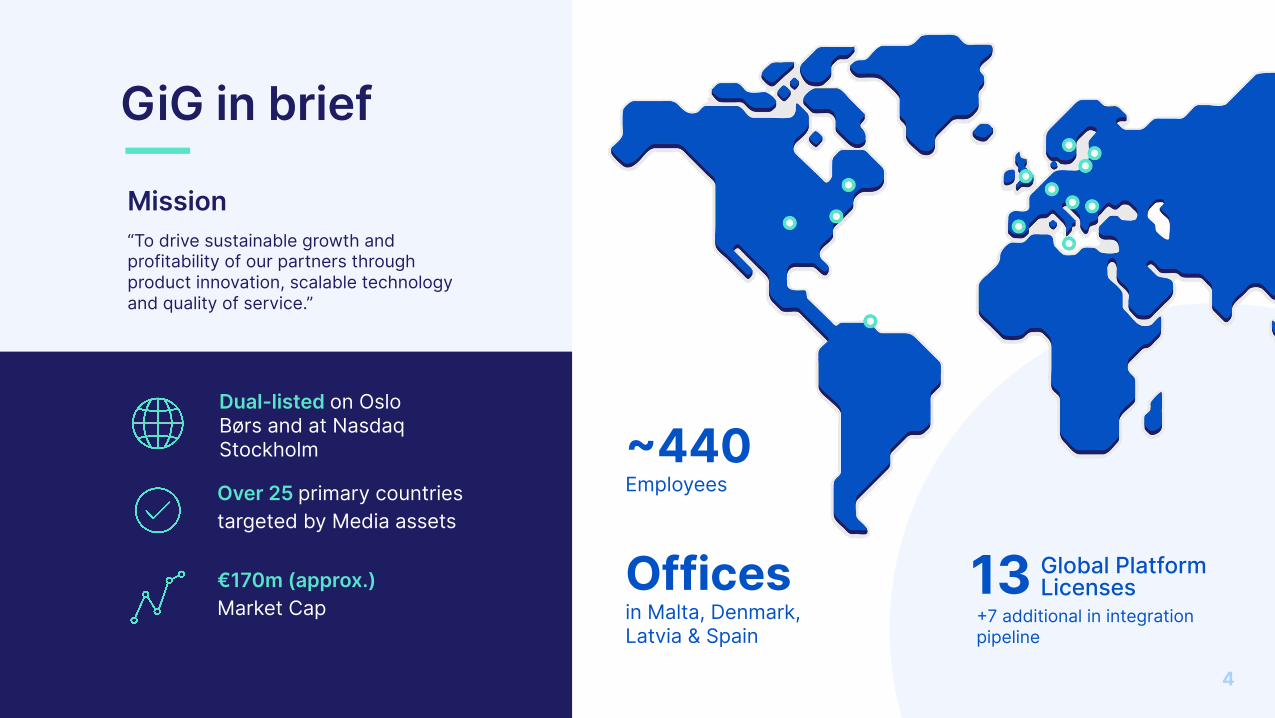
Mission“To drive sustainable growth and profitability of our partners through product innovation, scalable technology and quality of service.”
Over 25 primary countries targeted by Media assets
Dual-listed on Oslo Børs and at Nasdaq Stockholm
GiG in brief
€170m (approx.)Market Cap
440Employees
13 Global Platform Licenses
7 additional in integration pipeline
Officesin Malta, Denmark, Latvia & Spain
4
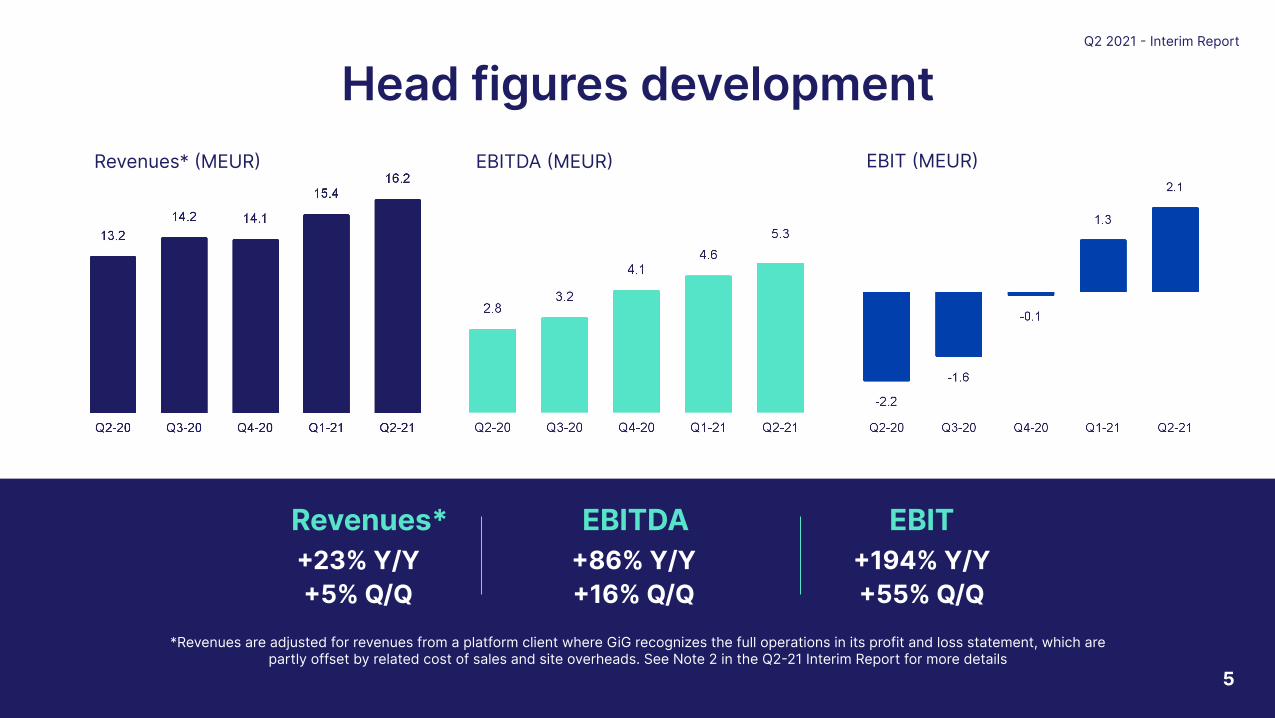
Head figures development
Revenues*
Q2 2021 Interim Report
23% Y/Y5% Q/Q
EBITDA 86% Y/Y16% Q/Q
EBIT194% Y/Y55% Q/Q
Revenues* MEUR EBITDA MEUR
5
*Revenues are adjusted for revenues from a platform client where GiG recognizes the full operations in its profit and loss statement, which are partly offset by related cost of sales and site overheads. See Note 2 in the Q221 Interim Report for more details
EBIT MEUR
Key takeaways Q2 2021● Continued positive development with significant
YoY growth, both revenues and EBITDA
● Media delivered all-time-highs on both revenue and FTD generation
● Signed two new agreements for platform provision in the quarter
● One new brands went live on the platform in Q2, two more in dev complete phase
● Sports delivered a €0.7m improvement YoY in EBITDA, strong strategic rational future potential driver
● Positive cash-flow from operation
● Refinanced bond, new maturity in June 2024
Q2 2021 Interim Report
6
Strategic Update - Q2
Q2 2021 Interim Report
7
Q3 2020 Interim ReportQ2 2021 Interim Report
8
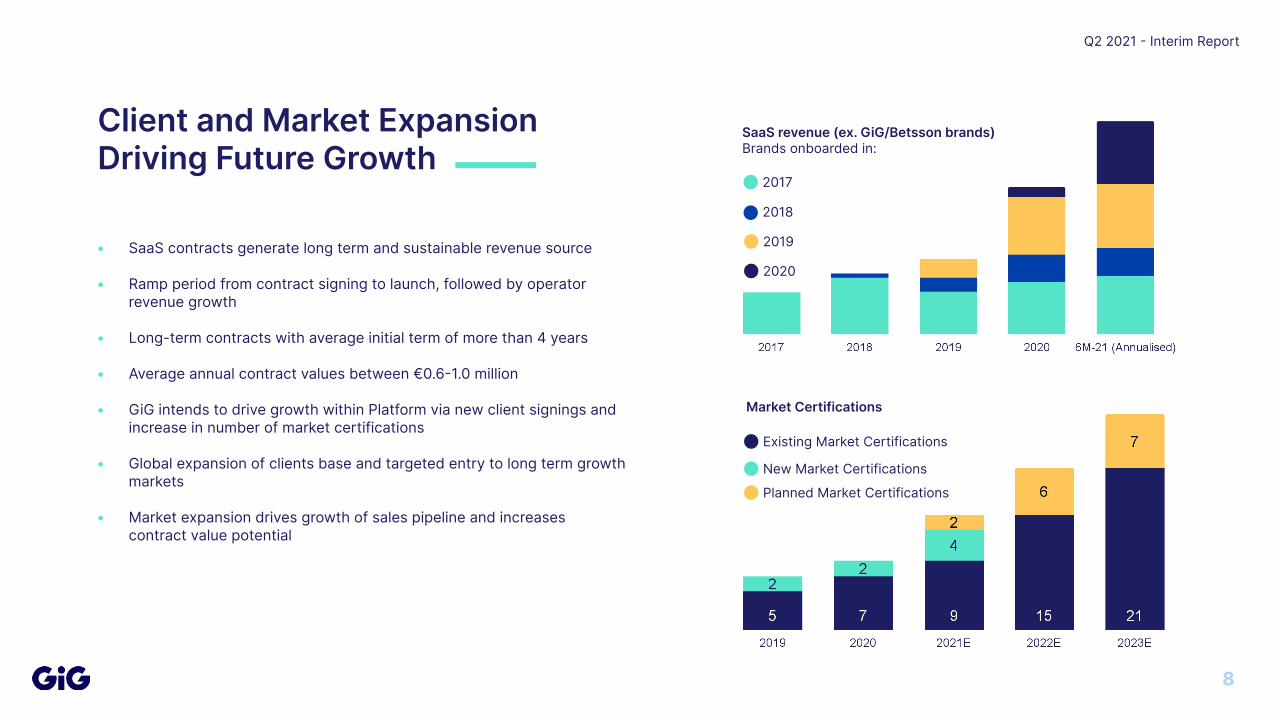
Client and Market Expansion Driving Future Growth
• SaaS contracts generate long term and sustainable revenue source
• Ramp period from contract signing to launch, followed by operator revenue growth
• Long-term contracts with average initial term of more than 4 years
• Average annual contract values between €0.61.0 million
• GiG intends to drive growth within Platform via new client signings and increase in number of market certifications
• Global expansion of clients base and targeted entry to long term growth markets
• Market expansion drives growth of sales pipeline and increases contract value potential
2017
2018
2019
2020
SaaS revenue (ex. GiG/Betsson brands)Brands onboarded in:
Market Certifications
Existing Market Certifications
New Market Certifications
Planned Market Certifications
Q3 2020 Interim Report
9
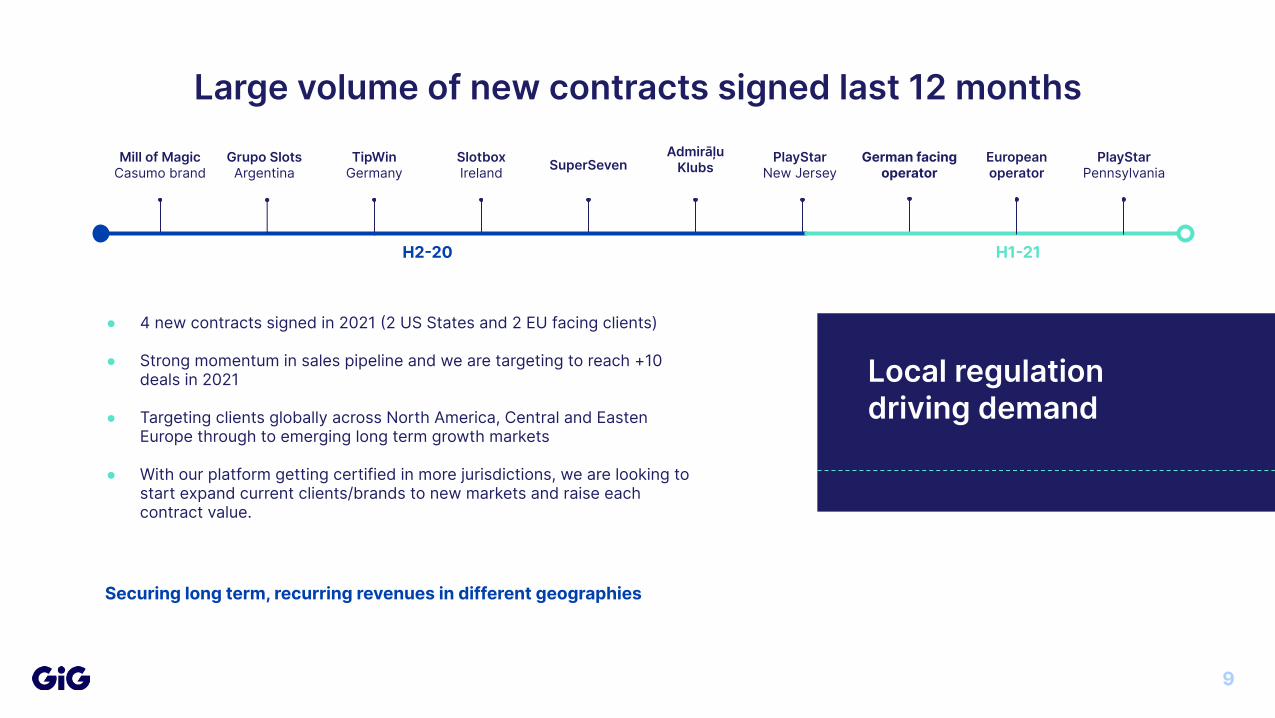
Large volume of new contracts signed last 12 months
Securing long term, recurring revenues in different geographies
● 4 new contracts signed in 2021 2 US States and 2 EU facing clients)
● Strong momentum in sales pipeline and we are targeting to reach +10 deals in 2021
● Targeting clients globally across North America, Central and Easten Europe through to emerging long term growth markets
● With our platform getting certified in more jurisdictions, we are looking to start expand current clients/brands to new markets and raise each contract value.
Mill of Magic Casumo brand
Grupo SlotsArgentina
TipWinGermany
SlotboxIreland SuperSeven
AdmirāļuKlubs
H220
PlayStarNew Jersey
H121
Local regulation driving demand
German facing operator
European operator
PlayStarPennsylvania
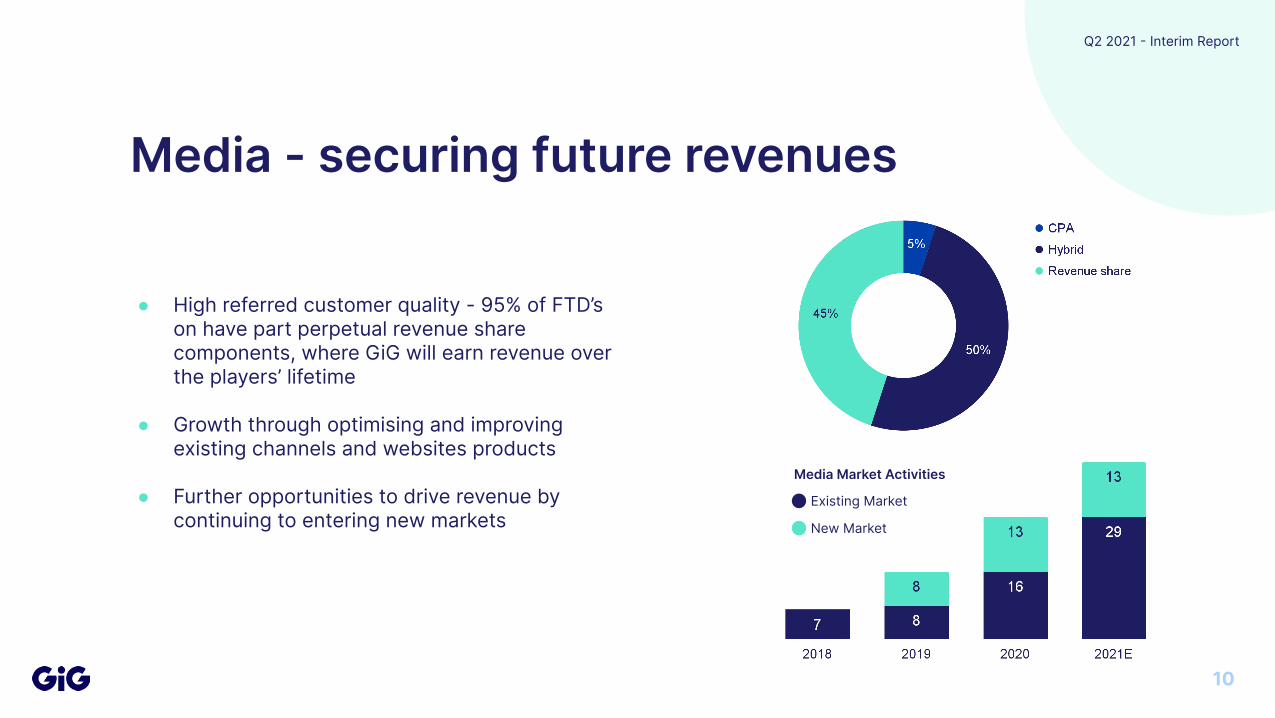
Media - securing future revenues
● High referred customer quality - 95% of FTD’s on have part perpetual revenue share components, where GiG will earn revenue over the players’ lifetime
● Growth through optimising and improving existing channels and websites products
● Further opportunities to drive revenue by continuing to entering new markets
Q2 2021 Interim Report
10
Media Market Activities
Existing Market
New Market
Business Update
Q2 2021 Interim Report
11
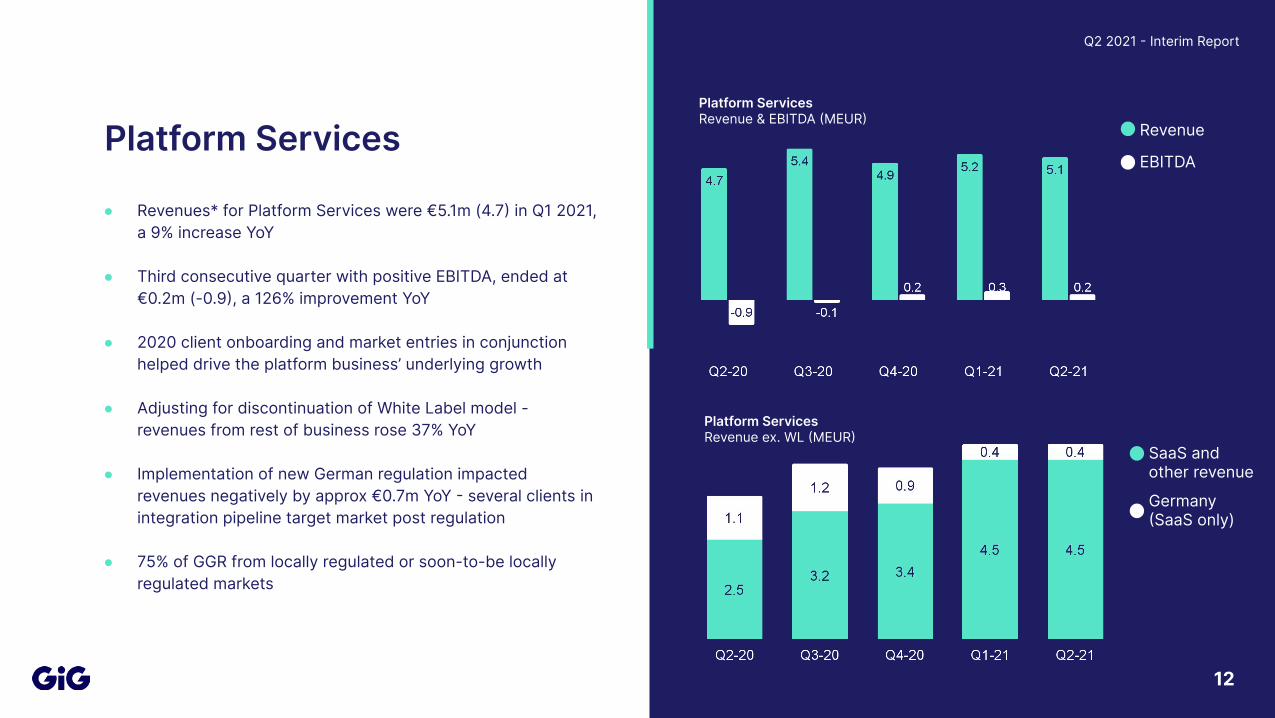
● Revenues* for Platform Services were €5.1m (4.7 in Q1 2021, a 9% increase YoY
● Third consecutive quarter with positive EBITDA, ended at €0.2m (-0.9, a 126% improvement YoY
● 2020 client onboarding and market entries in conjunction helped drive the platform business’ underlying growth
● Adjusting for discontinuation of White Label model - revenues from rest of business rose 37% YoY
● Implementation of new German regulation impacted revenues negatively by approx €0.7m YoY several clients in integration pipeline target market post regulation
● 75% of GGR from locally regulated or soon-to-be locally regulated markets
Q2 2021 Interim Report
Platform Services Revenue
EBITDA
12
Platform ServicesRevenue ex. WL MEUR
SaaS and other revenue
Germany SaaS only)
Platform ServicesRevenue & EBITDA MEUR
Q 2021 Interim Report
Platform Services
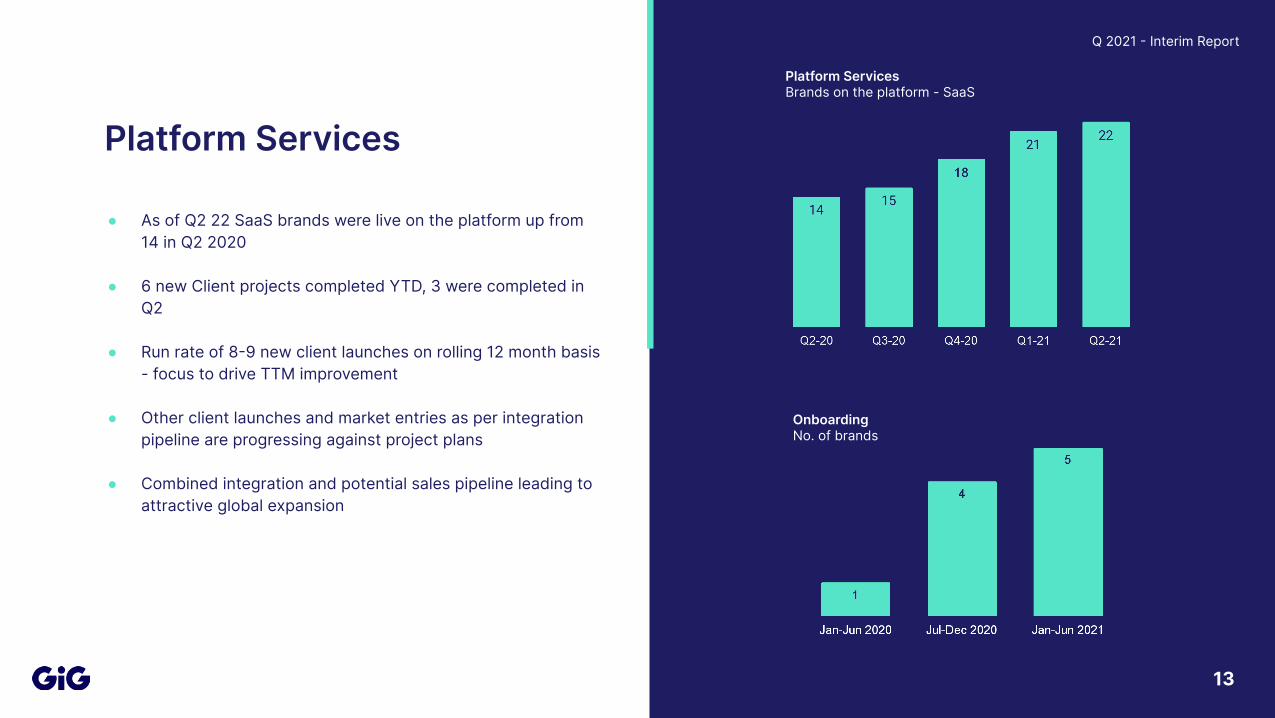
Platform ServicesBrands on the platform - SaaS
13
● As of Q2 22 SaaS brands were live on the platform up from 14 in Q2 2020
● 6 new Client projects completed YTD, 3 were completed in Q2
● Run rate of 89 new client launches on rolling 12 month basis - focus to drive TTM improvement
● Other client launches and market entries as per integration pipeline are progressing against project plans
● Combined integration and potential sales pipeline leading to attractive global expansion
OnboardingNo. of brands
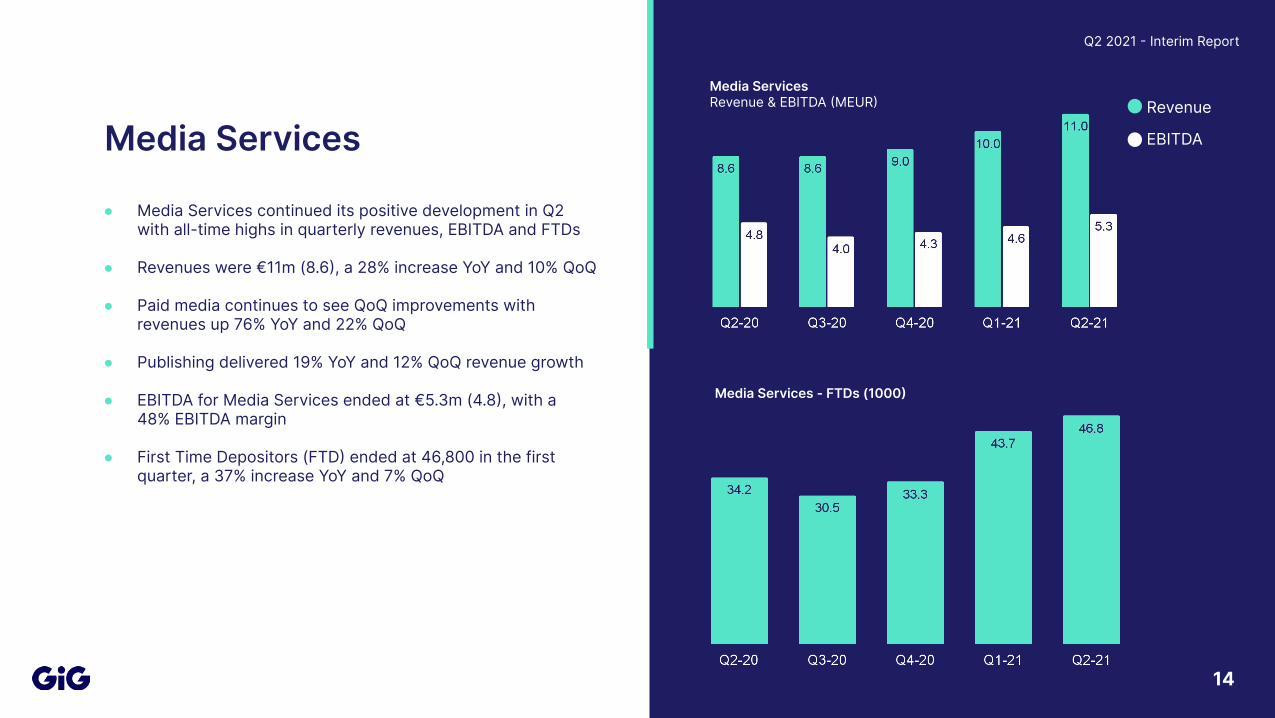
● Media Services continued its positive development in Q2with all-time highs in quarterly revenues, EBITDA and FTDs
● Revenues were €11m (8.6, a 28% increase YoY and 10% QoQ
● Paid media continues to see QoQ improvements with revenues up 76% YoY and 22% QoQ
● Publishing delivered 19% YoY and 12% QoQ revenue growth
● EBITDA for Media Services ended at €5.3m (4.8, with a 48% EBITDA margin
● First Time Depositors (FTD ended at 46,800 in the first quarter, a 37% increase YoY and 7% QoQ
Q2 2021 Interim Report
Media ServicesMedia ServicesRevenue & EBITDA MEUR
Media Services - FTDs (1000
Revenue
EBITDA
14
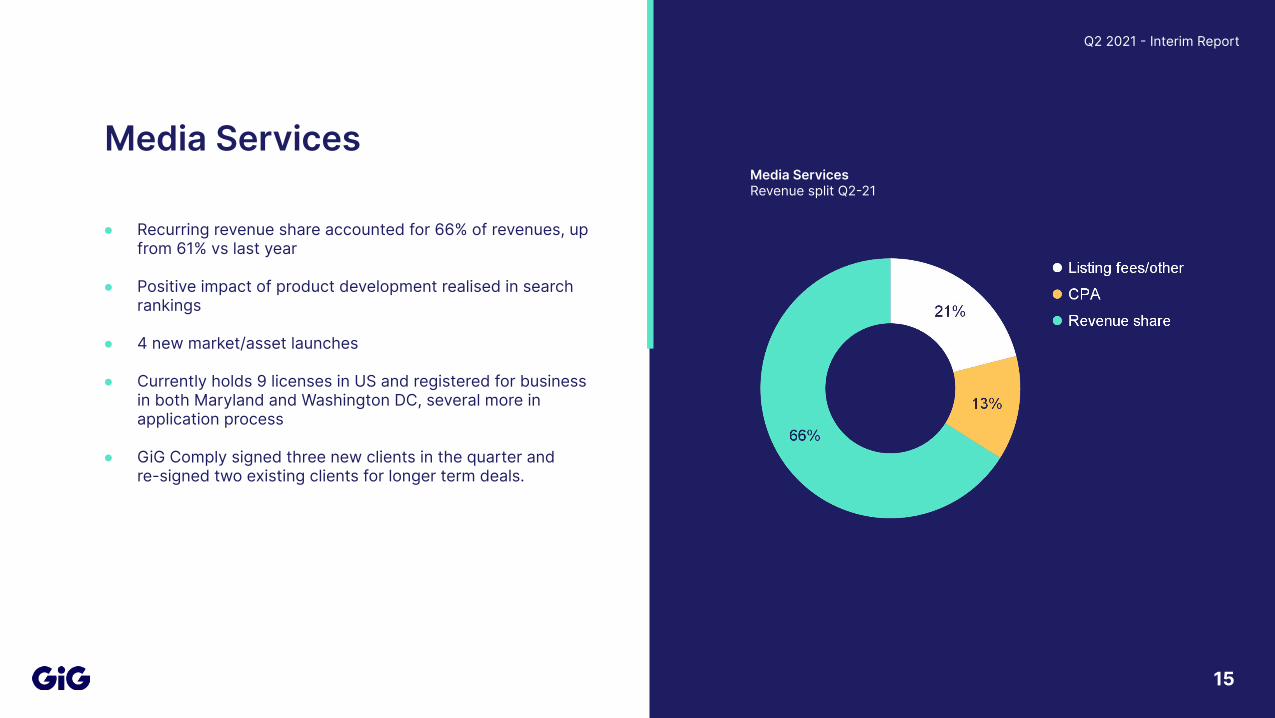
● Recurring revenue share accounted for 66% of revenues, up from 61% vs last year
● Positive impact of product development realised in search rankings
● 4 new market/asset launches
● Currently holds 9 licenses in US and registered for business in both Maryland and Washington DC, several more in application process
● GiG Comply signed three new clients in the quarter and re-signed two existing clients for longer term deals.
Q2 2021 Interim Report
Media Services
15
Media ServicesRevenue split Q221

Events afterthe quarter &
summary
Q2 2021 Interim Report
16
Update after the quarter● Additional brand already live in Q3, with two
additional launches anticipated shortly
● Sales pipeline remains strong and builds momentum
● FTDs up 32% YoY for Media in July, positive developments in Media continues
● Revenues in July were up 10% vs same period last year, and 26% if adjusting for white-labels and Germany
Q2 2021 Interim Report
17
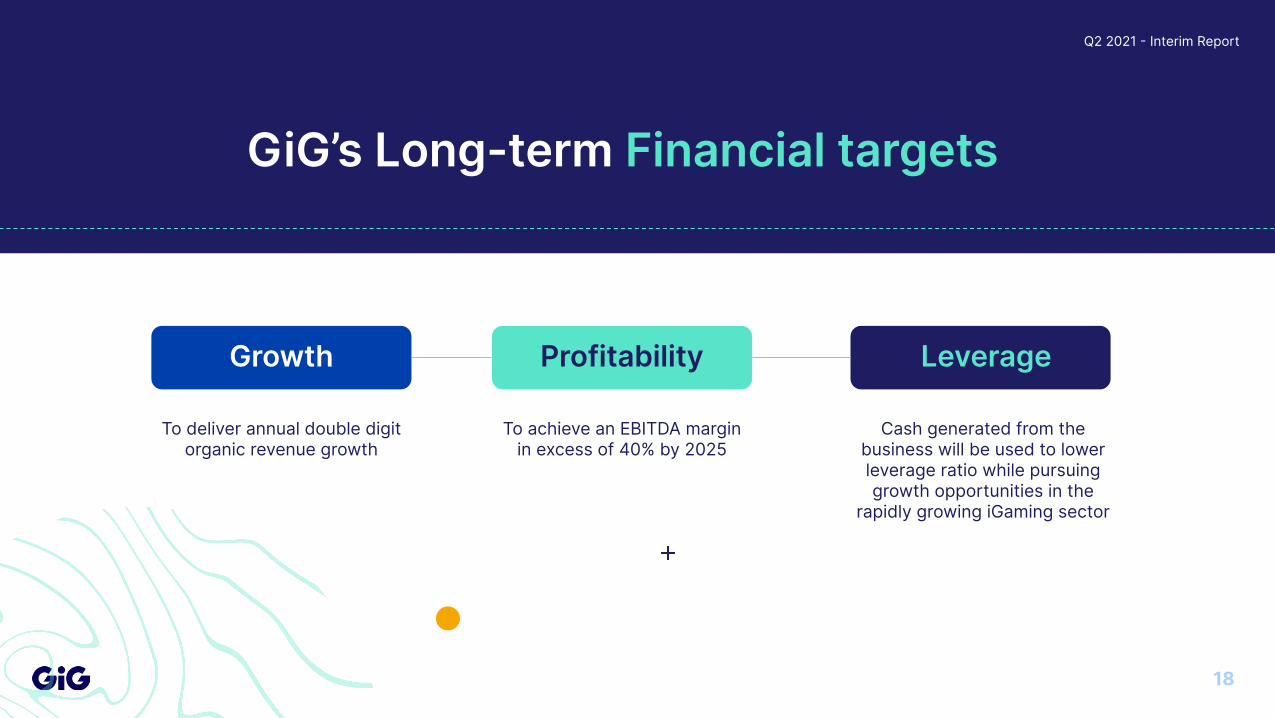
GiG’s Long-term Financial targets
Q2 2021 Interim Report
Growth LeverageProfitability
To deliver annual double digit organic revenue growth
To achieve an EBITDA margin in excess of 40% by 2025
Cash generated from the business will be used to lower leverage ratio while pursuing growth opportunities in the
rapidly growing iGaming sector
18
Summary
Q2 2021 Interim Report
● The business in Q2 delivered strong double digit growth in revenues, EBITDA and EBIT
● Media business performed exceptionally well reaching all-time highs both financially and in operational KPI’s while it continued to launch into new markets and build on top of the existing asset portfolio product offering
● GiG’s platform has shown robust and diverse SaaS revenues and client growth with ever increasing addressable market, via number of clients and a focus on global market expansion
● Ever improving balance sheet helped via conversion of convertible loan and bond refinance exercise
● Forward focus continues as we see this quarter as another step towards long term targets, creating further long term value across the Company towards its shareholders
19
Q&A
Q2 2021 Interim Report
20
Appendix
Q2 2021 Interim Report
21
Q2 2021 Interim Report
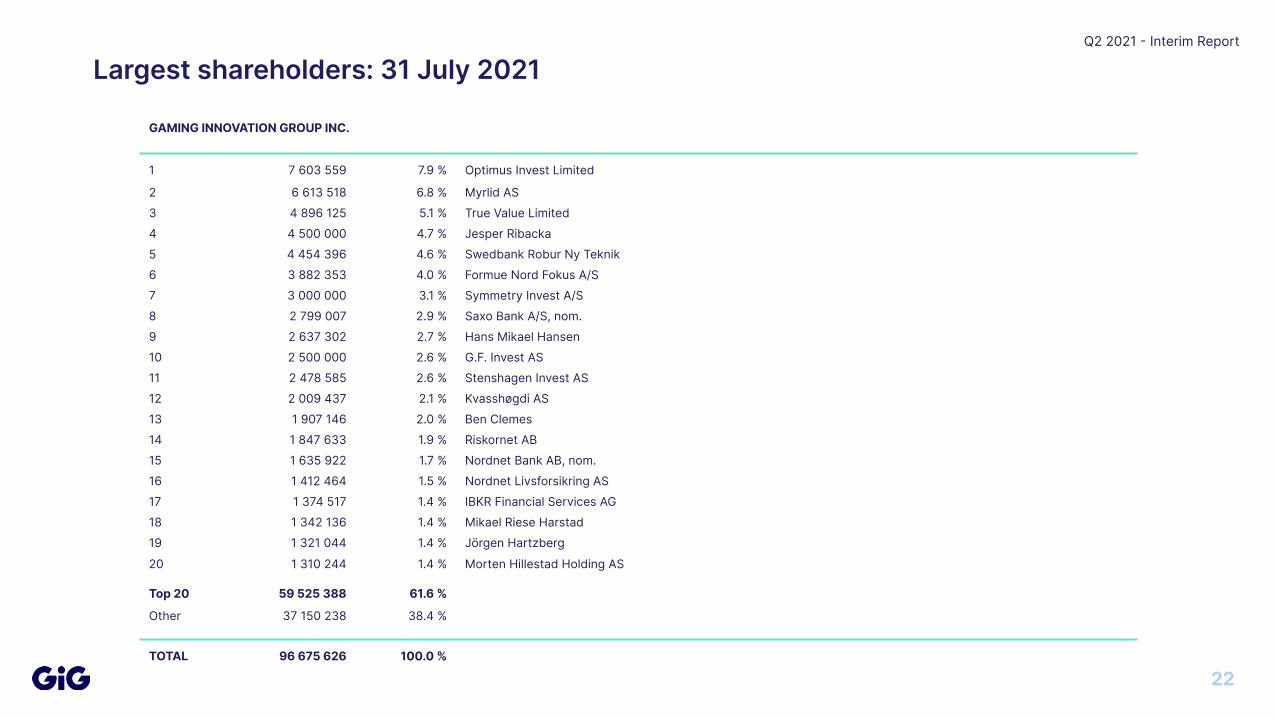
Largest shareholders: 31 July 2021
GAMING INNOVATION GROUP INC.
1 7 603 559 7.9 % Optimus Invest Limited
2 6 613 518 6.8 % Myrlid AS3 4 896 125 5.1 % True Value Limited4 4 500 000 4.7 % Jesper Ribacka 5 4 454 396 4.6 % Swedbank Robur Ny Teknik 6 3 882 353 4.0 % Formue Nord Fokus A/S7 3 000 000 3.1 % Symmetry Invest A/S8 2 799 007 2.9 % Saxo Bank A/S, nom.9 2 637 302 2.7 % Hans Mikael Hansen 10 2 500 000 2.6 % G.F. Invest AS11 2 478 585 2.6 % Stenshagen Invest AS12 2 009 437 2.1 % Kvasshøgdi AS13 1 907 146 2.0 % Ben Clemes14 1 847 633 1.9 % Riskornet AB15 1 635 922 1.7 % Nordnet Bank AB, nom.16 1 412 464 1.5 % Nordnet Livsforsikring AS17 1 374 517 1.4 % IBKR Financial Services AG18 1 342 136 1.4 % Mikael Riese Harstad19 1 321 044 1.4 % Jörgen Hartzberg
20 1 310 244 1.4 % Morten Hillestad Holding AS
Top 20 59 525 388 61.6 %
Other 37 150 238 38.4 %
TOTAL 96 675 626 100.0 %
22
Q2 2021 Interim Report
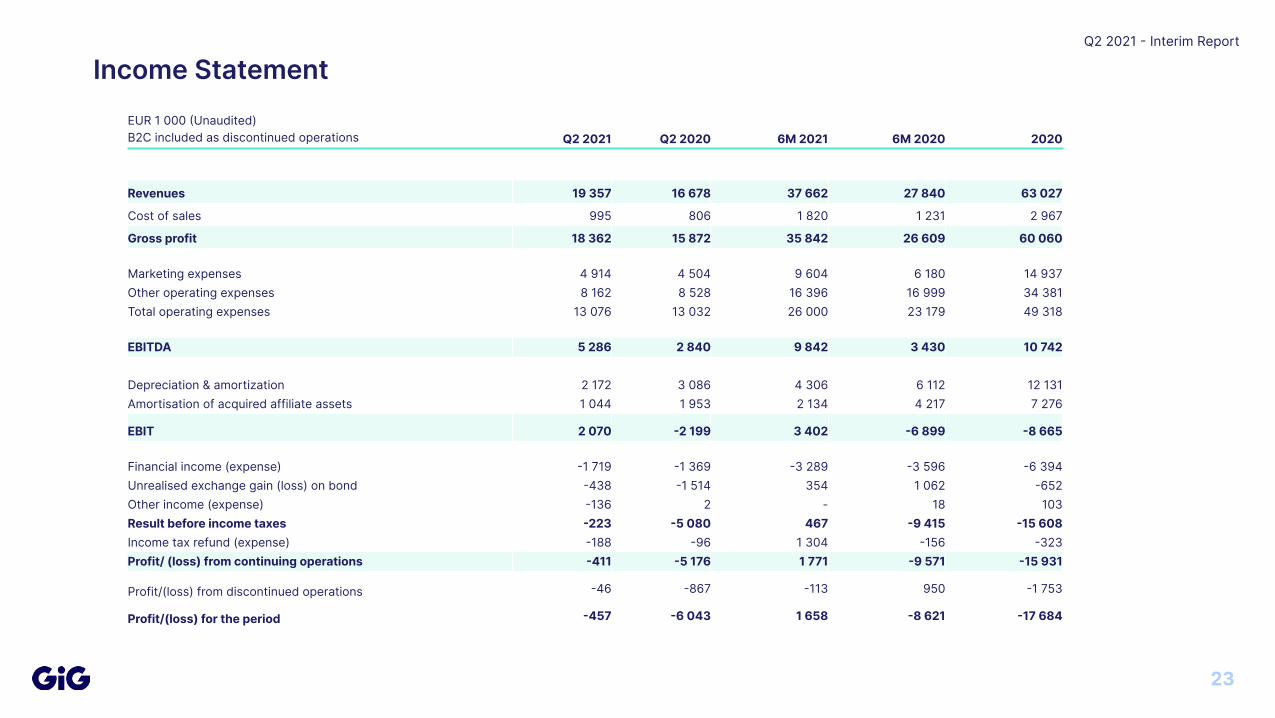
Income StatementEUR 1 000 Unaudited)B2C included as discontinued operations Q2 2021 Q2 2020 6M 2021 6M 2020 2020
Revenues 19 357 16 678 37 662 27 840 63 027
Cost of sales 995 806 1 820 1 231 2 967
Gross profit 18 362 15 872 35 842 26 609 60 060
Marketing expenses 4 914 4 504 9 604 6 180 14 937Other operating expenses 8 162 8 528 16 396 16 999 34 381Total operating expenses 13 076 13 032 26 000 23 179 49 318
EBITDA 5 286 2 840 9 842 3 430 10 742
Depreciation & amortization 2 172 3 086 4 306 6 112 12 131Amortisation of acquired affiliate assets 1 044 1 953 2 134 4 217 7 276
EBIT 2 070 2 199 3 402 6 899 8 665
Financial income (expense) 1 719 1 369 3 289 3 596 6 394Unrealised exchange gain (loss) on bond 438 1 514 354 1 062 652Other income (expense) 136 2 - 18 103Result before income taxes 223 5 080 467 9 415 15 608Income tax refund (expense) 188 96 1 304 156 323Profit/ (loss) from continuing operations 411 5 176 1 771 9 571 15 931
Profit/(loss) from discontinued operations 46 867 113 950 1 753
Profit/(loss) for the period 457 6 043 1 658 8 621 17 684
23
Q2 2021 Interim Report
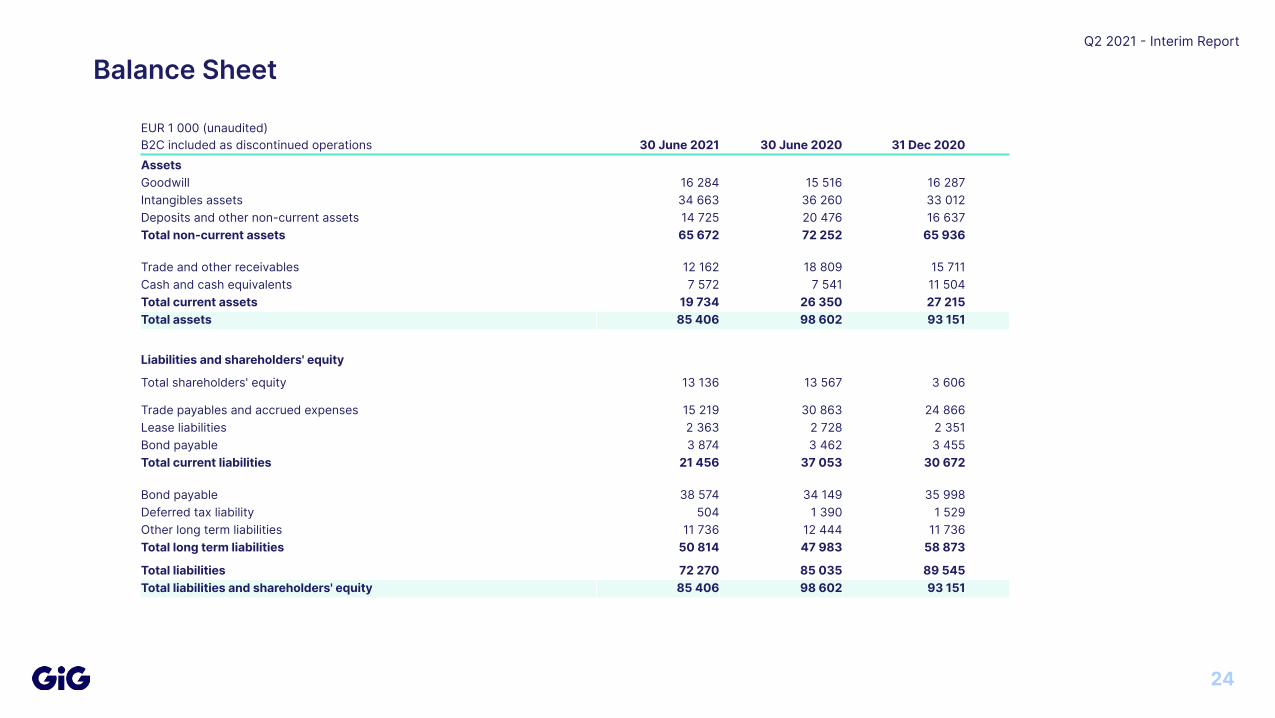
Balance Sheet
EUR 1 000 (unaudited)B2C included as discontinued operations 30 June 2021 30 June 2020 31 Dec 2020AssetsGoodwill 16 284 15 516 16 287Intangibles assets 34 663 36 260 33 012Deposits and other non-current assets 14 725 20 476 16 637Total non-current assets 65 672 72 252 65 936
Trade and other receivables 12 162 18 809 15 711Cash and cash equivalents 7 572 7 541 11 504Total current assets 19 734 26 350 27 215Total assets 85 406 98 602 93 151
Liabilities and shareholders' equity
Total shareholders' equity 13 136 13 567 3 606
Trade payables and accrued expenses 15 219 30 863 24 866Lease liabilities 2 363 2 728 2 351Bond payable 3 874 3 462 3 455Total current liabilities 21 456 37 053 30 672
Bond payable 38 574 34 149 35 998Deferred tax liability 504 1 390 1 529Other long term liabilities 11 736 12 444 11 736Total long term liabilities 50 814 47 983 58 873
Total liabilities 72 270 85 035 89 545Total liabilities and shareholders' equity 85 406 98 602 93 151
24
Q2 2021 Interim Report
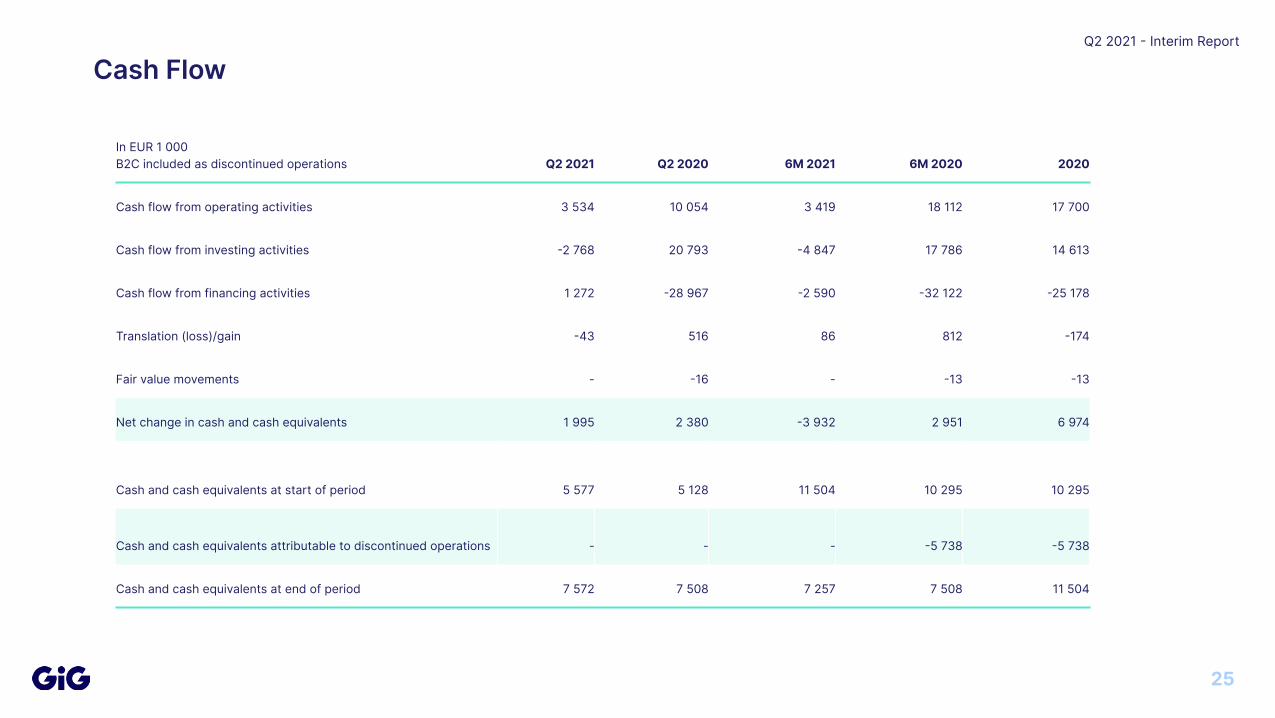
Cash Flow
In EUR 1 000B2C included as discontinued operations Q2 2021 Q2 2020 6M 2021 6M 2020 2020
Cash flow from operating activities 3 534 10 054 3 419 18 112 17 700
Cash flow from investing activities 2 768 20 793 4 847 17 786 14 613
Cash flow from financing activities 1 272 28 967 2 590 32 122 25 178
Translation (loss)/gain 43 516 86 812 174
Fair value movements - 16 - 13 13
Net change in cash and cash equivalents 1 995 2 380 3 932 2 951 6 974
Cash and cash equivalents at start of period 5 577 5 128 11 504 10 295 10 295
Cash and cash equivalents attributable to discontinued operations - - - 5 738 5 738
Cash and cash equivalents at end of period 7 572 7 508 7 257 7 508 11 504
25
Legal Disclaimer
Gaming Innovation Group Inc. gives forecasts. Certain statements in this report presentation are forward-looking and the actual outcome may be materially different. In addition to the factors discussed, other factors could have an impact on actual outcomes. Such factors include developments for customers, competitors, the impact of economic and market conditions, national and international legislation and regulations, fiscal regulations, the effectiveness of copyright for computer systems, technological developments, fluctuation in exchange rates, interest rates and political risks.
26


