53
Presenting and communicating statistics. Principles, components and assessment Filomena Maggino Università degli Studi di Firenze
| Date post: | 14-Dec-2015 |
| Category: |
Documents |
| Upload: | latrell-hurley |
| View: | 220 times |
| Download: | 1 times |

Presenting and communicating
statistics.Principles,
components and assessmentFilomena Maggino
Università degli Studi di Firenze

The study presented here is the result of a project developed by myself and
Marco Fattore Università degli Studi di Milano-Bicocca
and
Marco Trapani Università degli Studi di Firenze

1. Communication: full component of the statistical work
Contents
2. Communicating statistics
3. Assessing the quality of communication in statistics

1. Communication: full component of the statistical work
Contents
2. Communicating statistics
3. Assessing the quality of communication in statistics
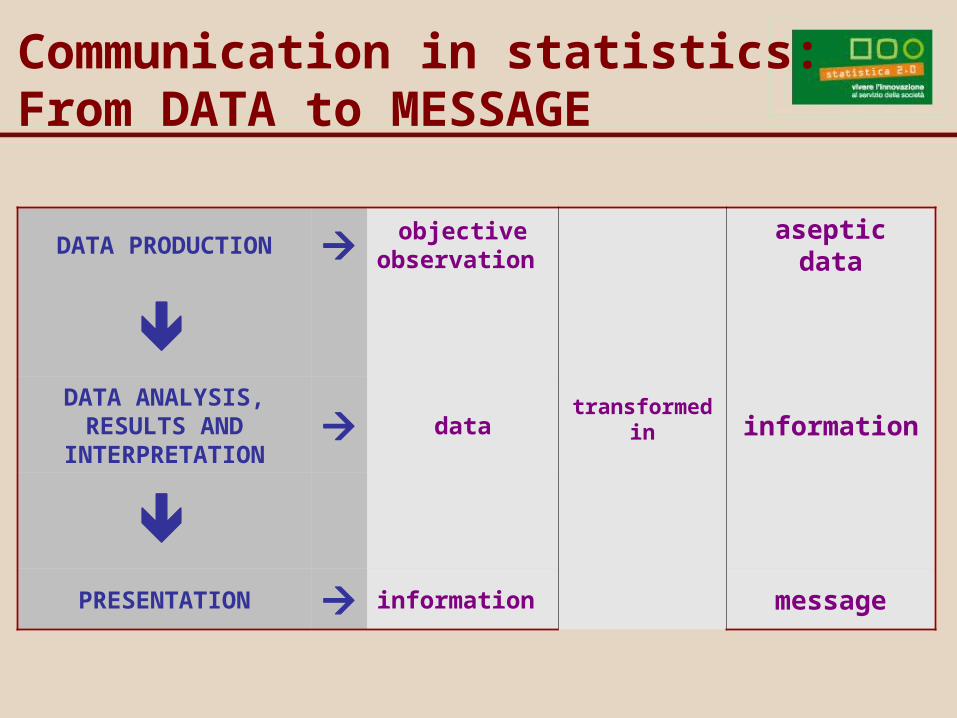
Communication in statistics: From DATA to MESSAGE
DATA PRODUCTION objective observation
transformed in
aseptic data
DATA ANALYSIS,
RESULTS AND INTERPRETATION
data information
PRESENTATION information message
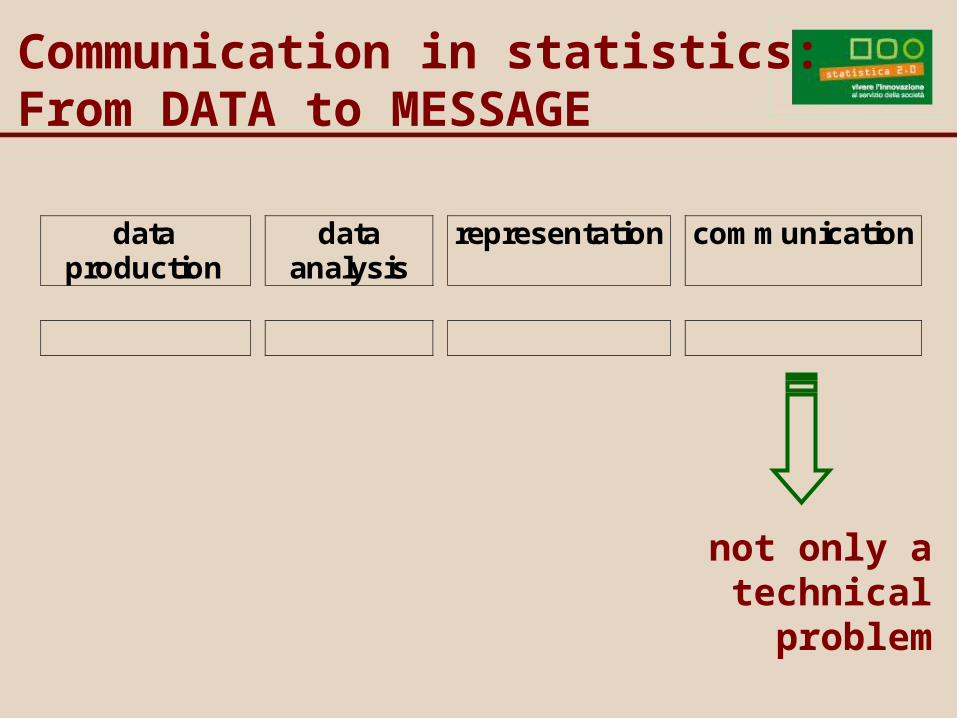
Communication in statistics: From DATA to MESSAGE
data production
data analysis
representation communication
not only a technical problem
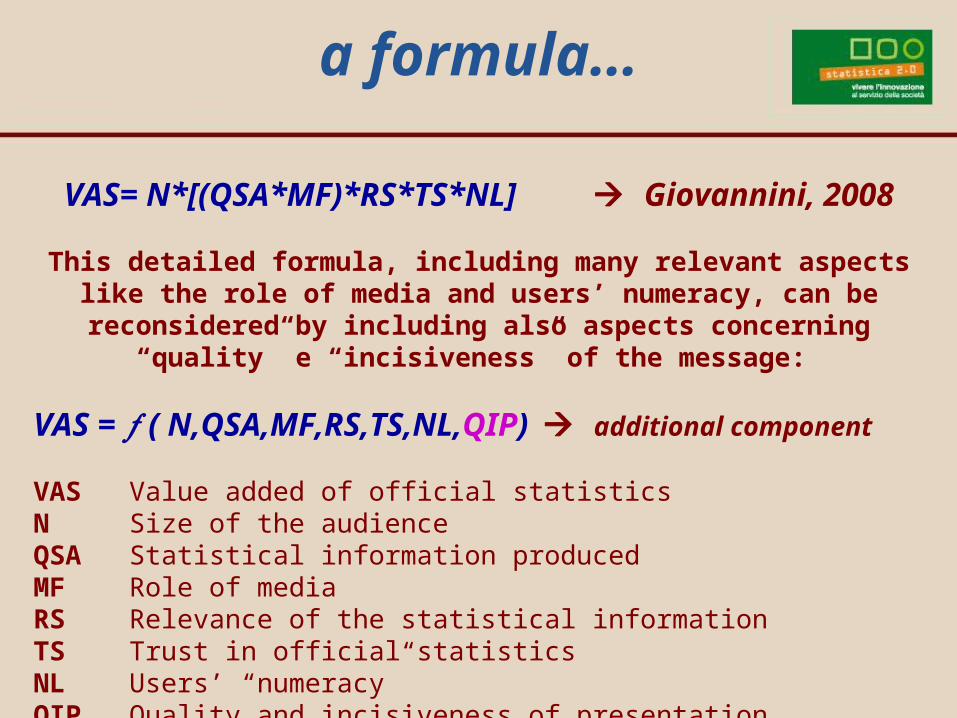
VAS= N*[(QSA*MF)*RS*TS*NL] Giovannini, 2008
This detailed formula, including many relevant aspects like the role of media and users’ numeracy, can be reconsidered by including also
aspects concerning “quality” e “incisiveness” of the message:
VAS = ( N,QSA,MF,RS,TS,NL,QIP) additional component
VAS Value added of official statistics N Size of the audienceQSA Statistical information producedMF Role of mediaRS Relevance of the statistical informationTS Trust in official statisticsNL Users’ “numeracy”QIP Quality and incisiveness of presentation
a formula…
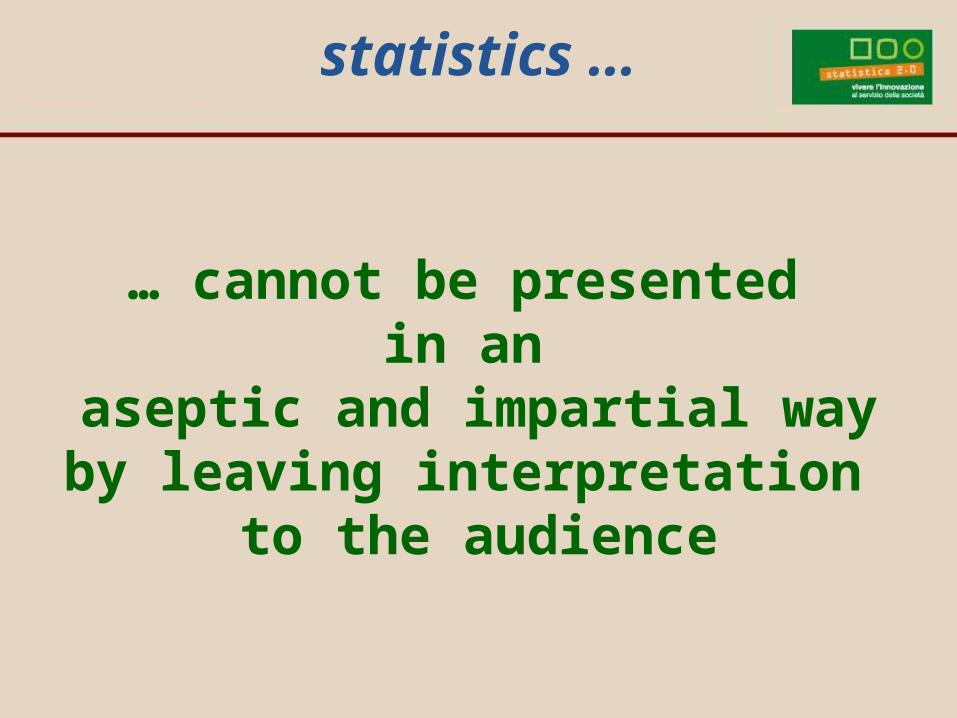
… cannot be presented in an
aseptic and impartial wayby leaving interpretation
to the audience
statistics …
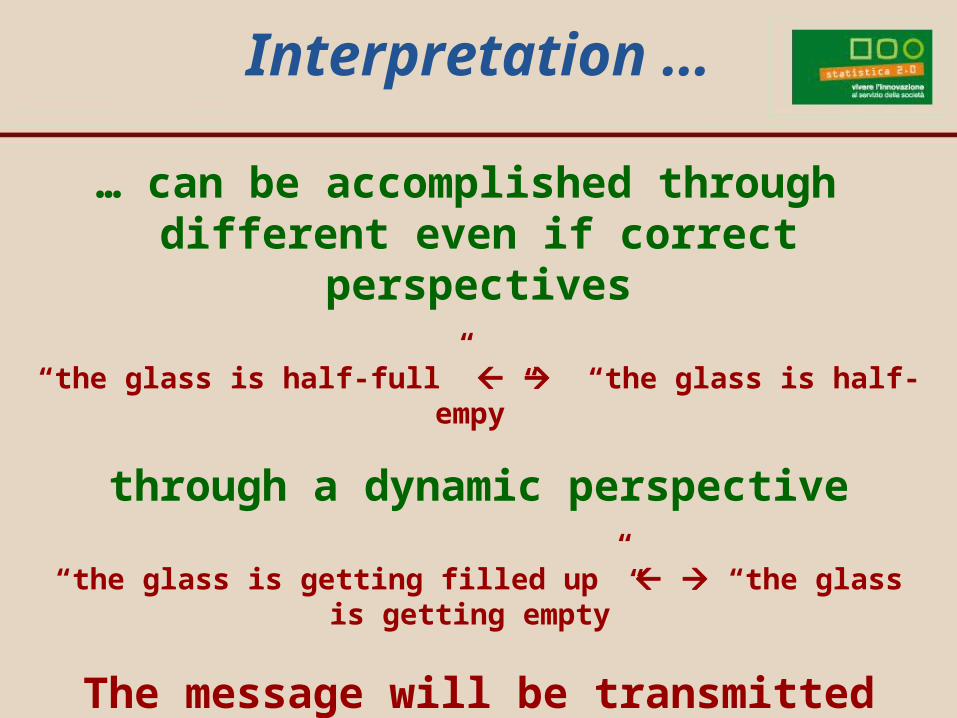
… can be accomplished through different even if correct
perspectives
“the glass is half-full” “the glass is half-empy”
through a dynamic perspective
“the glass is getting filled up” “the glass is getting empty”
The message will be transmitted and interpreted by the audience
without realizing the mere numeric aspect.
Interpretation …
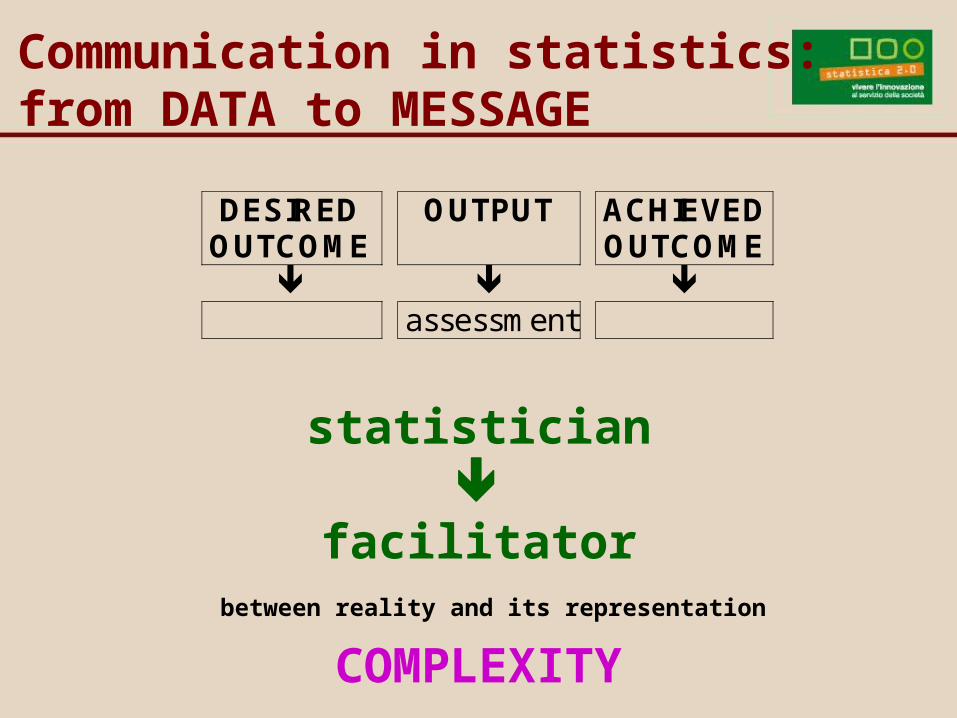
Communication in statistics: from DATA to MESSAGE
DESIRED OUTCOME
OUTPUT ACHIEVED OUTCOME
assessment
statistician
facilitator between reality and its representation
COMPLEXITY

1. Communication: full component of the statistical work
Contents
2. Communicating statistics
3. Assessing the quality of communication in statistics
2. Communicating statistics 1. Fundamental aspects
Contents
2. Main components
3. The codes
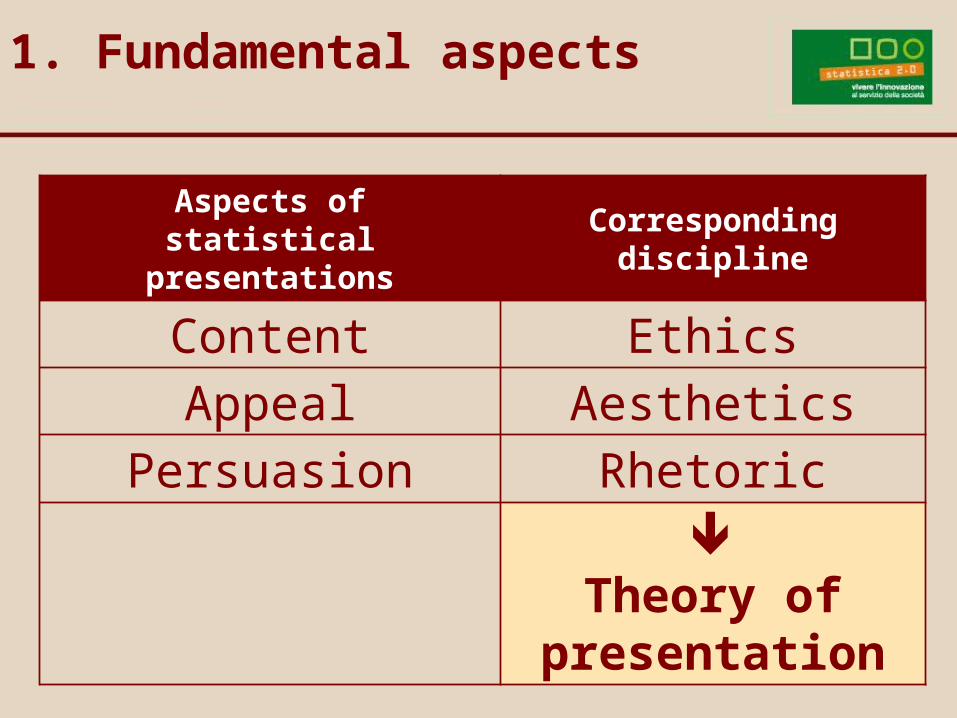
1. Fundamental aspects
Aspects ofstatistical
presentations
Correspondingdiscipline
Content EthicsAppeal Aesthetics
Persuasion Rhetoric
Theory of presentation
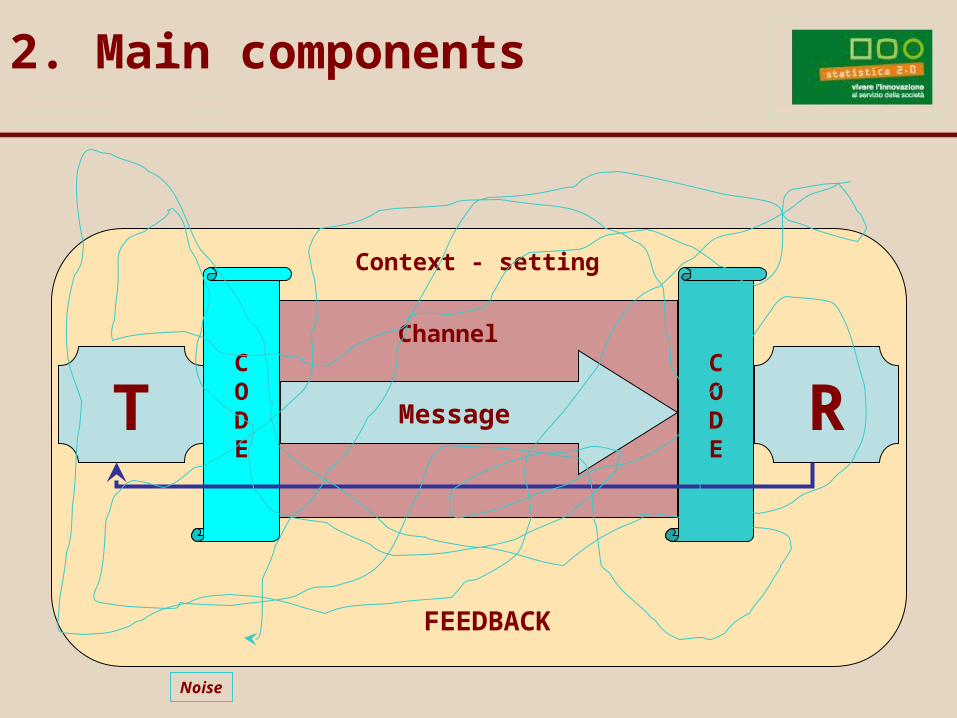
2. Main components
T RCODE
CODE
Message
Channel
Context - setting
FEEDBACK
Noise
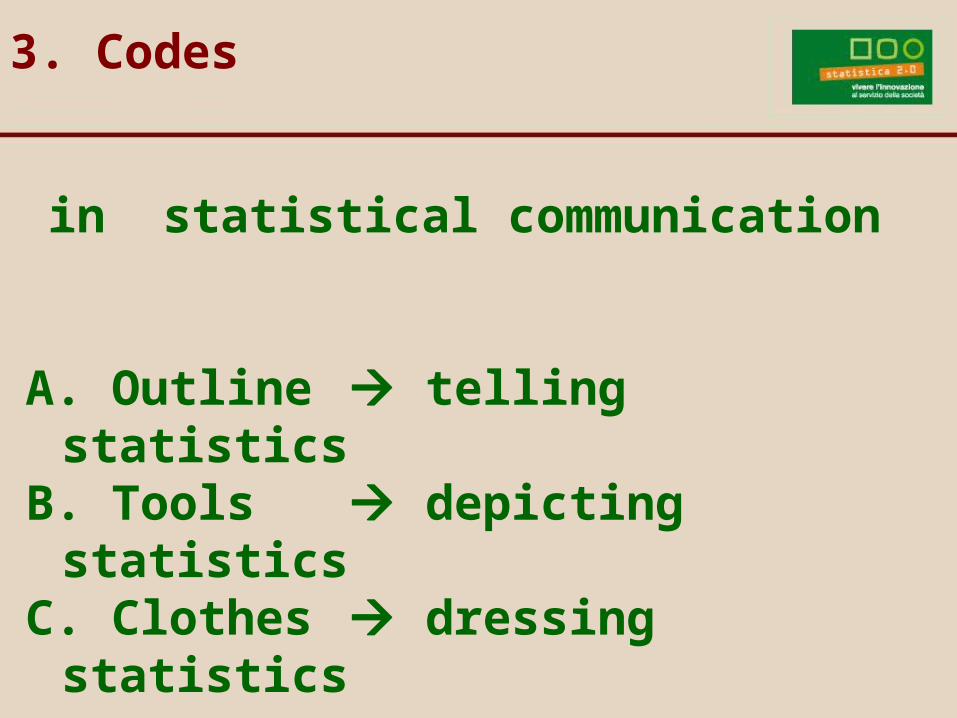
in statistical communication
A. Outline telling statisticsB. Tools depicting statisticsC. Clothes dressing statistics
3. Codes
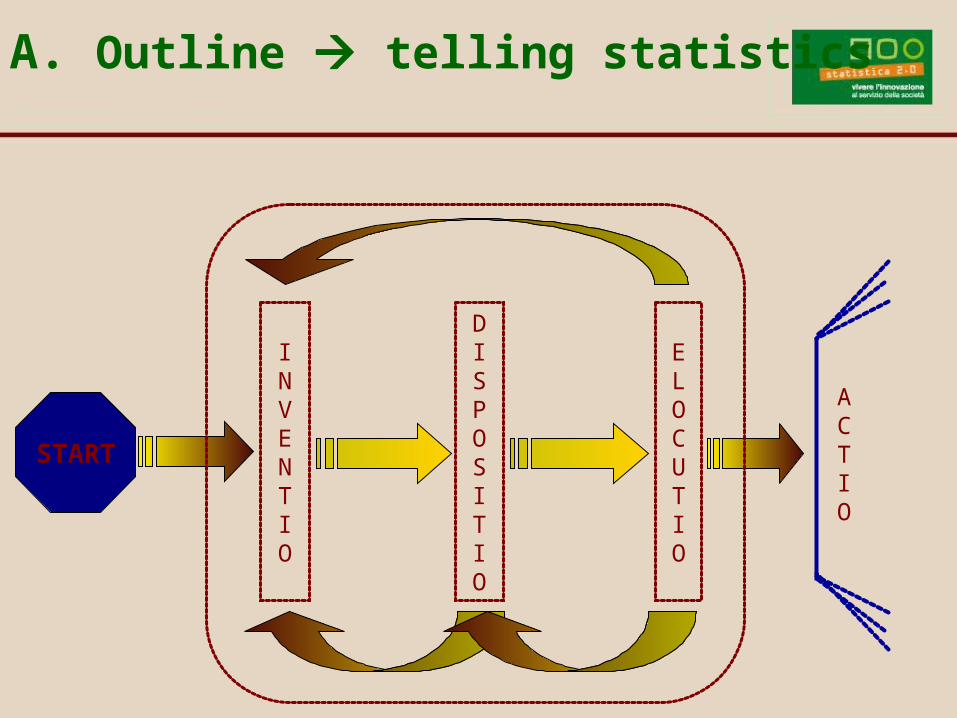
INVENTIO
DISPOSITIO
ELOCUTIO
ACTIO
A. Outline telling statistics
START
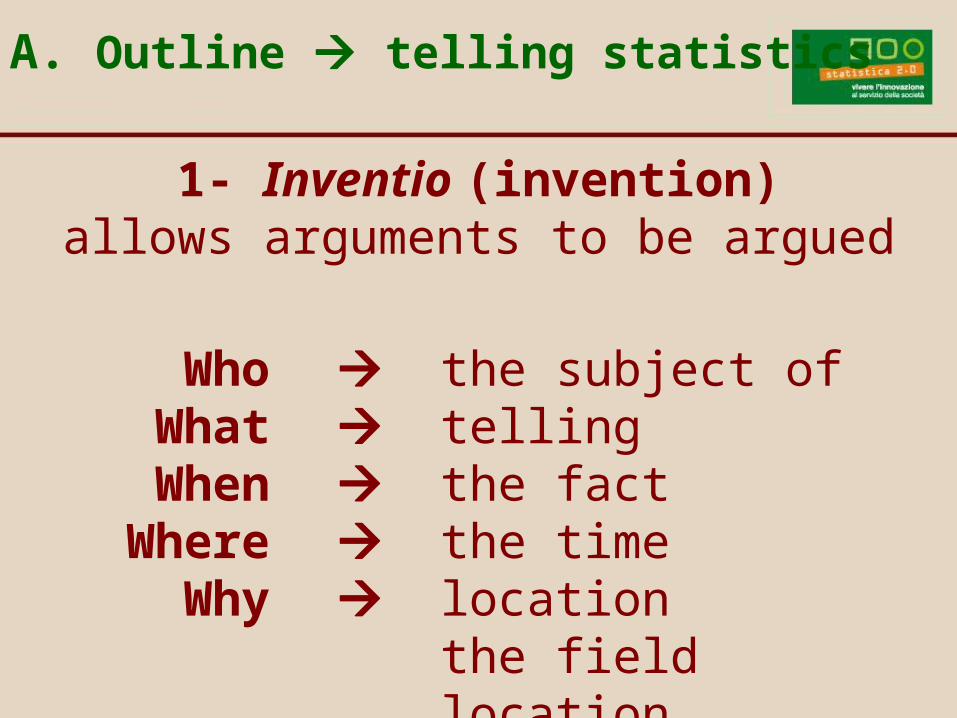
1- Inventio (invention)allows arguments to be argued
A. Outline telling statistics
WhoWhatWhen
WhereWhy
the subject of tellingthe fact the time locationthe field locationthe causes
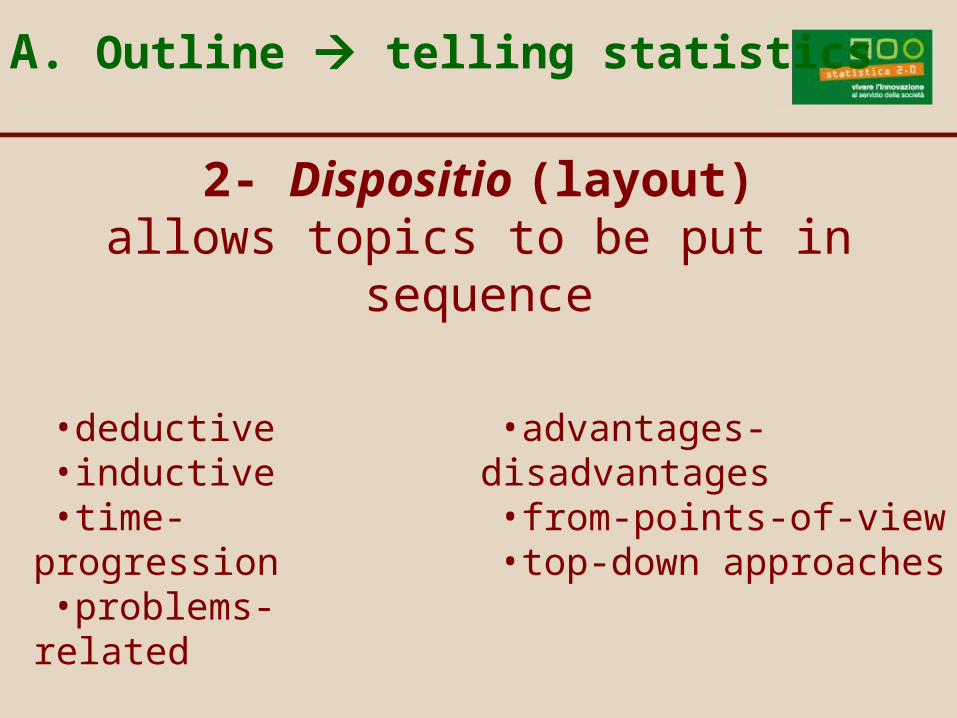
2- Dispositio (layout)allows topics to be put in sequence
A. Outline telling statistics
•deductive •inductive •time-progression•problems-related
•advantages-disadvantages•from-points-of-view•top-down approaches
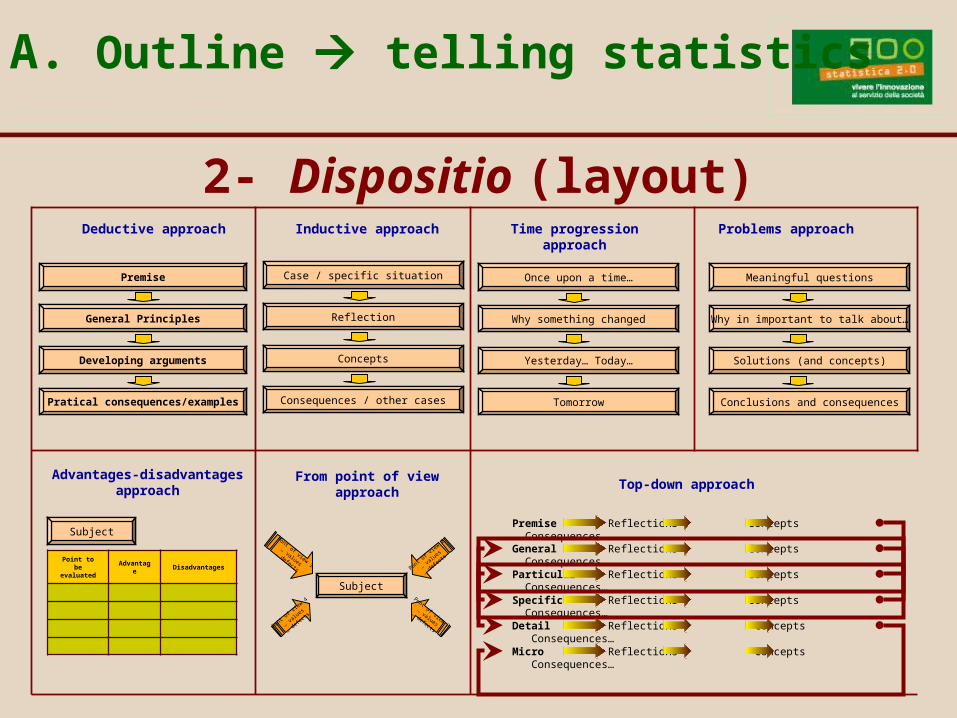
2- Dispositio (layout)
Premise
General Principles
Developing arguments
Pratical consequences/examples
Deductive approach
Case / specific situation
Reflection
Concepts
Consequences / other cases
Inductive approach
Once upon a time…
Why something changed
Yesterday… Today…
Tomorrow
Time progression approach
Meaningful questions
Why in important to talk about…
Solutions (and concepts)
Conclusions and consequences
Problems approach
Subject
Advantages-disadvantages approach
Point to be evaluated
Advantage
Disadvantages
Subject
From point of view approach
Pont of view 1
… values
… defects
Pont of v
iew 4
… va
lues
… defe
cts
Pont of view 3
… values
… defects
Pont o
f view 2
… va
lues
… de
fects
Top-down approach
General Reflections Concepts Consequences…
Particular Reflections Concepts Consequences…
Specific Reflections Concepts Consequences…
Detail Reflections Concepts Consequences…
Micro Reflections Concepts Consequences…
Premise Reflections Concepts Consequences…
A. Outline telling statistics
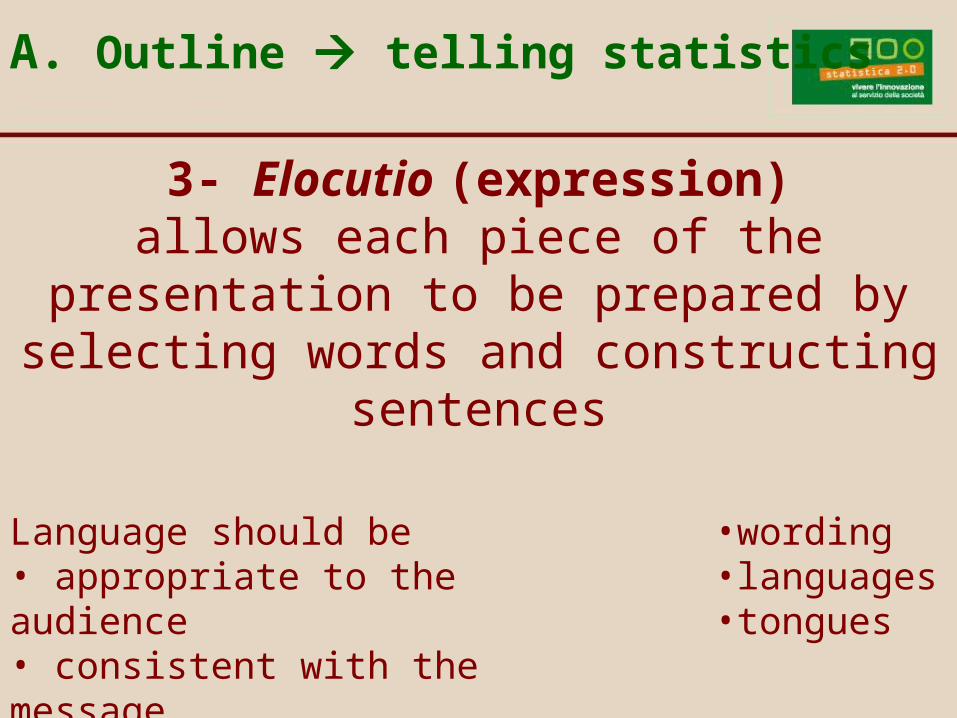
3- Elocutio (expression)allows each piece of the presentation to be prepared by selecting words and
constructing sentences
A. Outline telling statistics
Language should be• appropriate to the audience• consistent with the message
•wording•languages•tongues
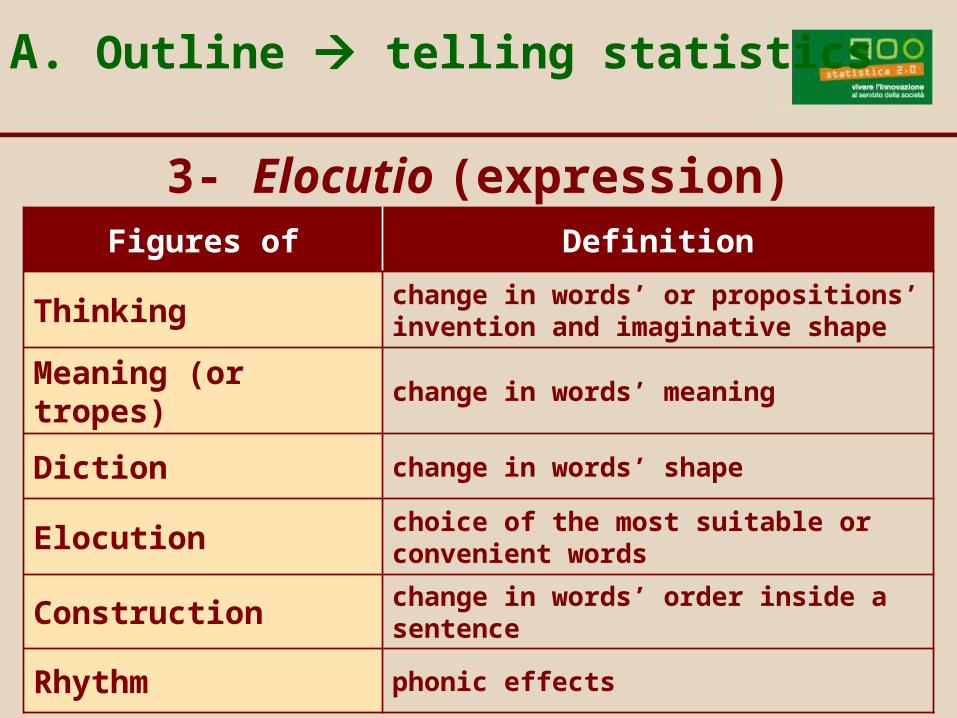
3- Elocutio (expression)Figures of Definition
Thinkingchange in words’ or propositions’ invention and imaginative shape
Meaning (or tropes) change in words’ meaning
Diction change in words’ shape
Elocutionchoice of the most suitable or convenient words
Construction change in words’ order inside a sentence
Rhythm phonic effects
A. Outline telling statistics
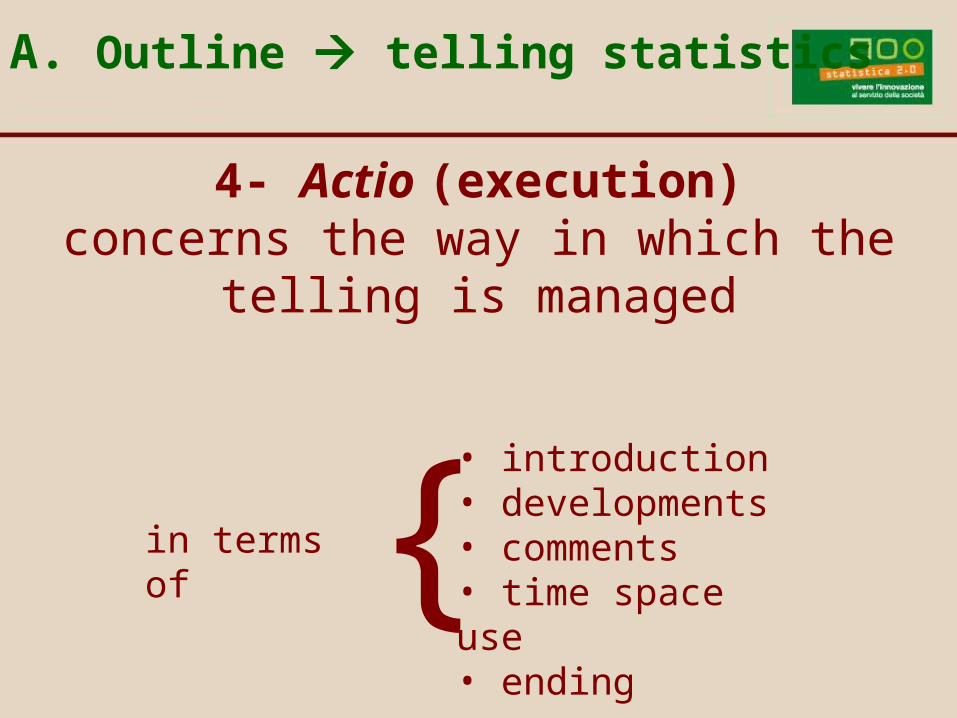
4- Actio (execution)concerns the way in which the telling
is managed
A. Outline telling statistics
in terms of
• introduction • developments• comments• time space use• ending
{
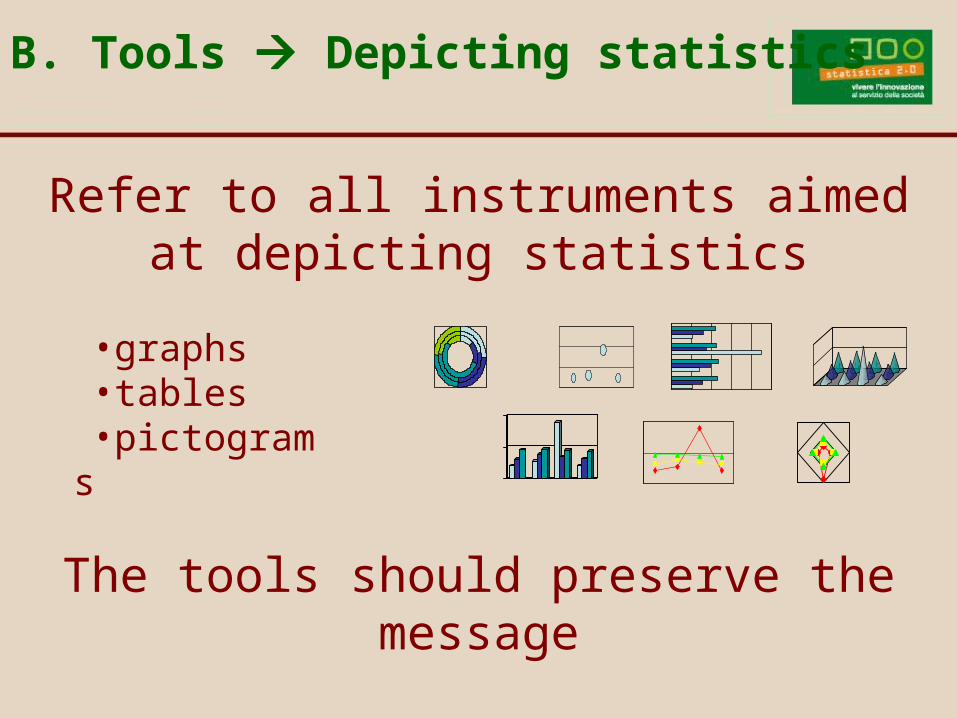
B. Tools Depicting statistics
Refer to all instruments aimed at depicting statistics
•graphs•tables•pictograms
The tools should preserve the message
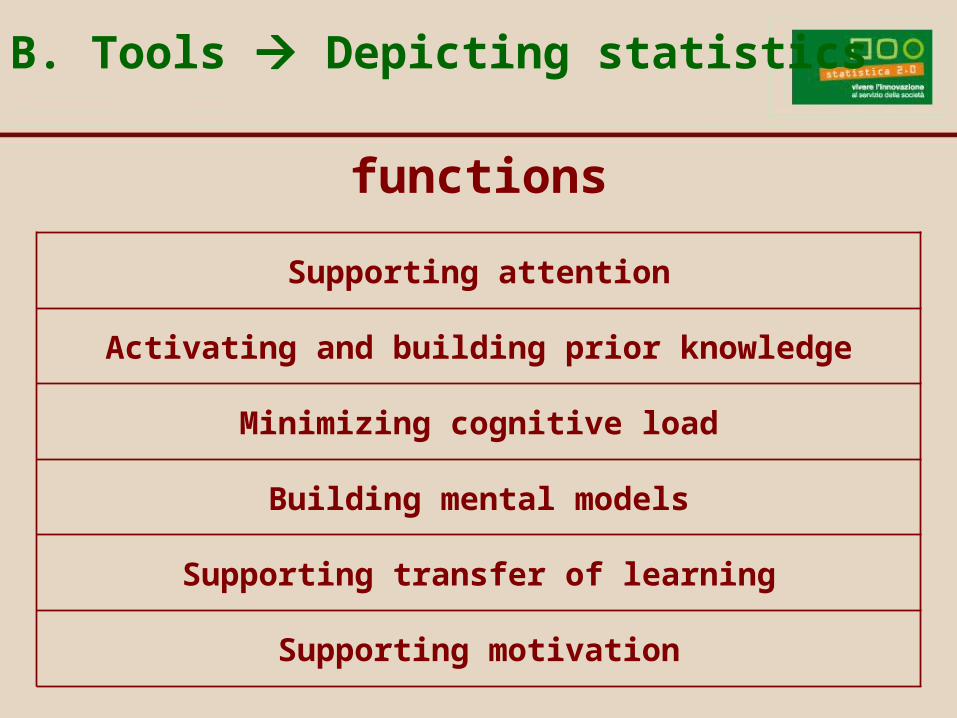
functions
Supporting attention
Activating and building prior knowledge
Minimizing cognitive load
Building mental models
Supporting transfer of learning
Supporting motivation
B. Tools Depicting statistics
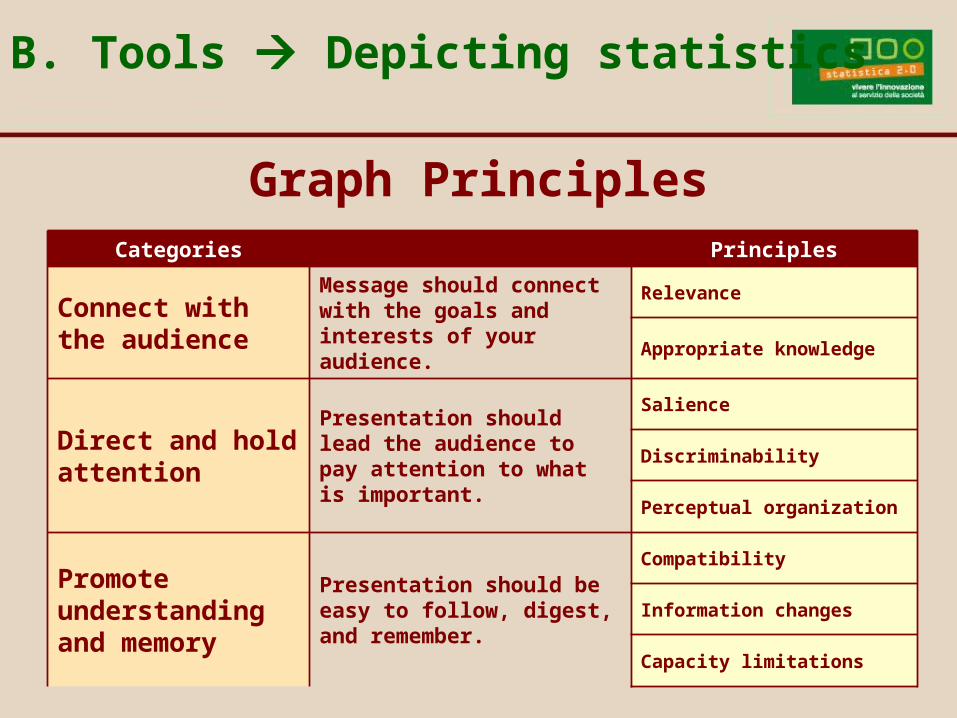
Graph PrinciplesCategories Principles
Connect with the audience
Message should connect with the goals and interests of your audience.
Relevance
Appropriate knowledge
Direct and hold attention
Presentation should lead the audience to pay attention to what is important.
Salience
Discriminability
Perceptual organization
Promote understanding and memory
Presentation should be easy to follow, digest, and remember.
Compatibility
Information changes
Capacity limitations
B. Tools Depicting statistics
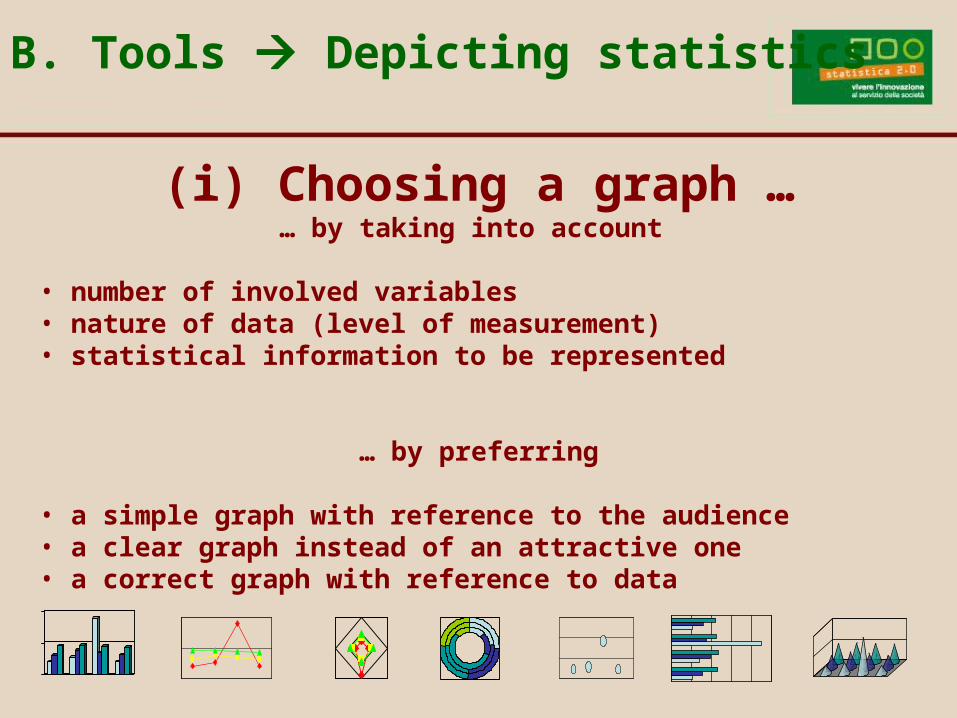
(i) Choosing a graph …… by taking into account
• number of involved variables• nature of data (level of measurement)• statistical information to be represented
… by preferring
• a simple graph with reference to the audience• a clear graph instead of an attractive one• a correct graph with reference to data
B. Tools Depicting statistics
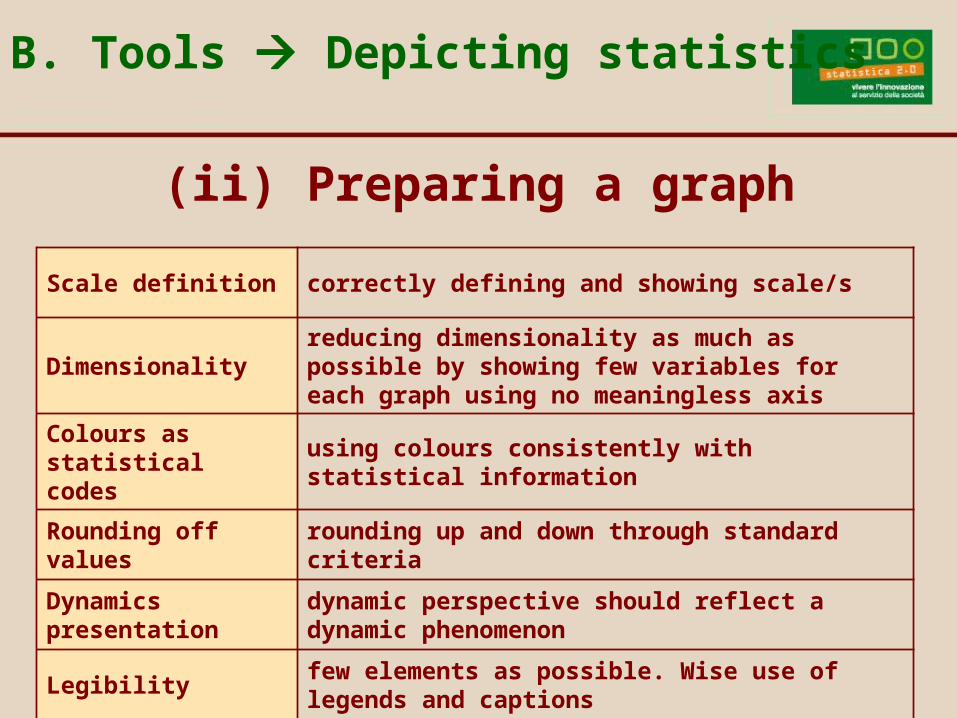
(ii) Preparing a graph
Scale definition correctly defining and showing scale/s
Dimensionalityreducing dimensionality as much as possible by showing few variables for each graph using no meaningless axis
Colours as statistical codes
using colours consistently with statistical information
Rounding off values
rounding up and down through standard criteria
Dynamics presentation
dynamic perspective should reflect a dynamic phenomenon
Legibilityfew elements as possible. Wise use of legends and captions
B. Tools Depicting statistics
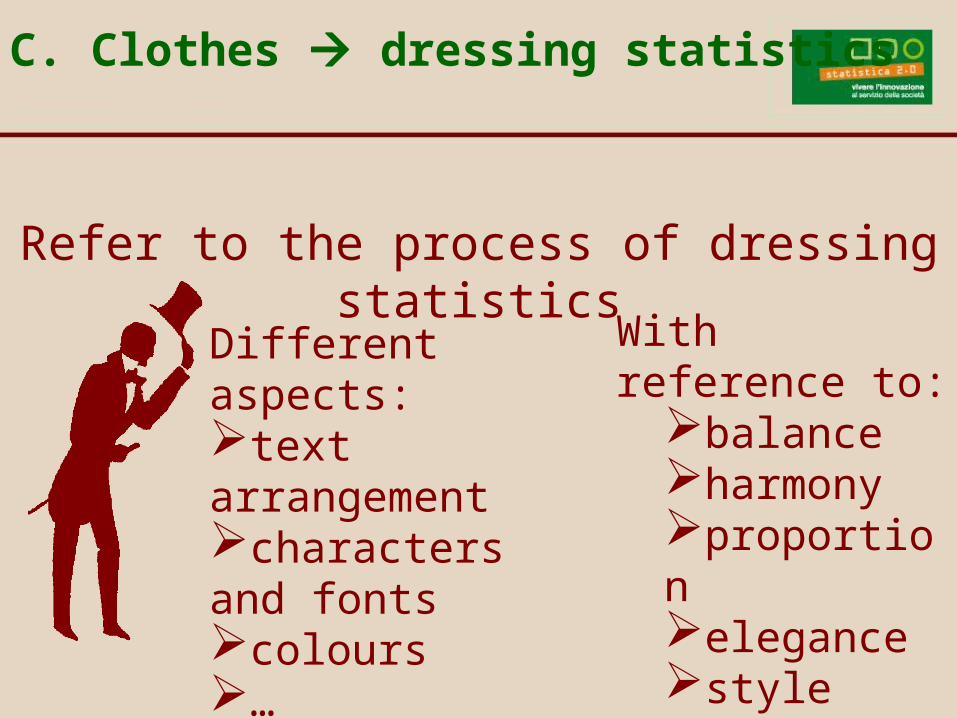
C. Clothes dressing statistics
Refer to the process of dressing statistics
With reference to:
balanceharmonyproportionelegancestyle
Different aspects: text arrangementcharacters and fontscolours…
1. Communication: full component of the statistical work
Contents
2. Communicating statistics
3. Assessing the quality of communication in statistics
3. Assessing the quality of communication in statistics
1. The conceptual model
Contents
2. The application
A. The dimensions to evaluateB. The evaluating criteria C. The components of the
transmission process
1. The conceptual model
A. The dimensions to evaluate
1. OUTLINE telling statistics
2. TOOLS depicting statistics
3. CLOTHES dressing statistics
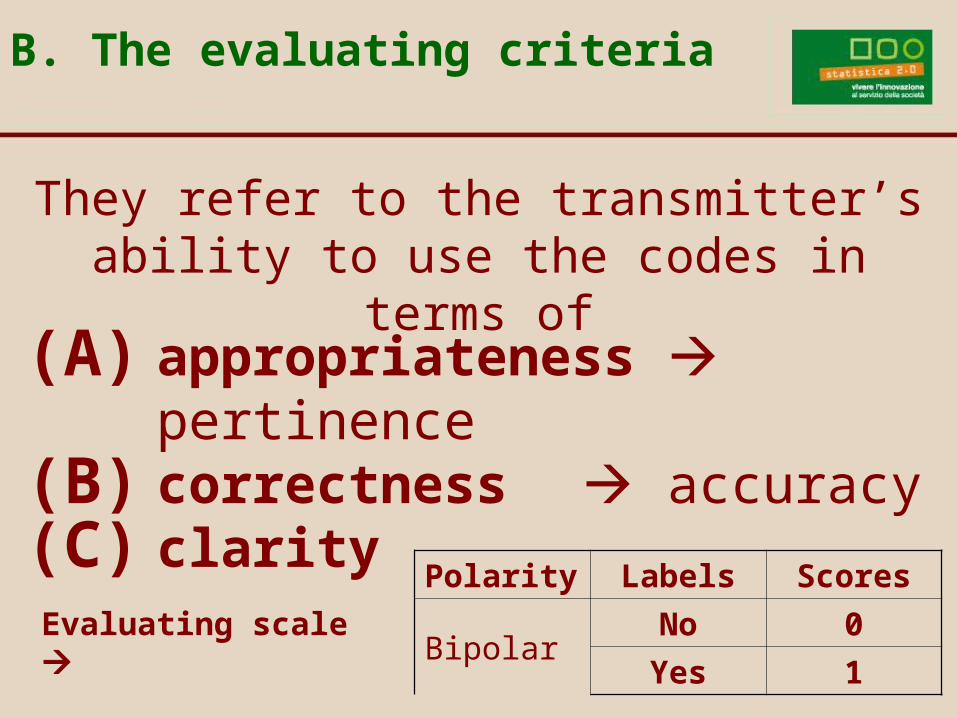
B. The evaluating criteria
They refer to the transmitter’s ability to use the codes in terms of
Evaluating scale
(A) appropriateness pertinence
(B) correctness accuracy(C) clarity
Polarity Labels Scores
BipolarNo 0
Yes 1
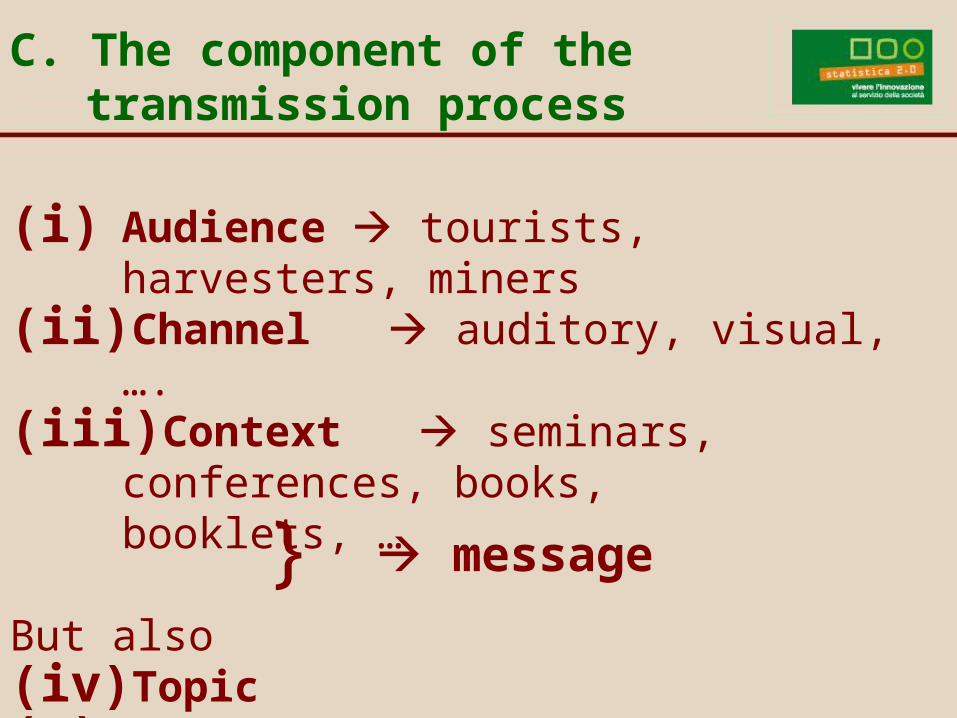
(i) Audience tourists, harvesters, miners
(ii) Channel auditory, visual, ….(iii) Context seminars, conferences,
books, booklets, …
But also(iv) Topic(v) Data
C. The component of the transmission process
message}
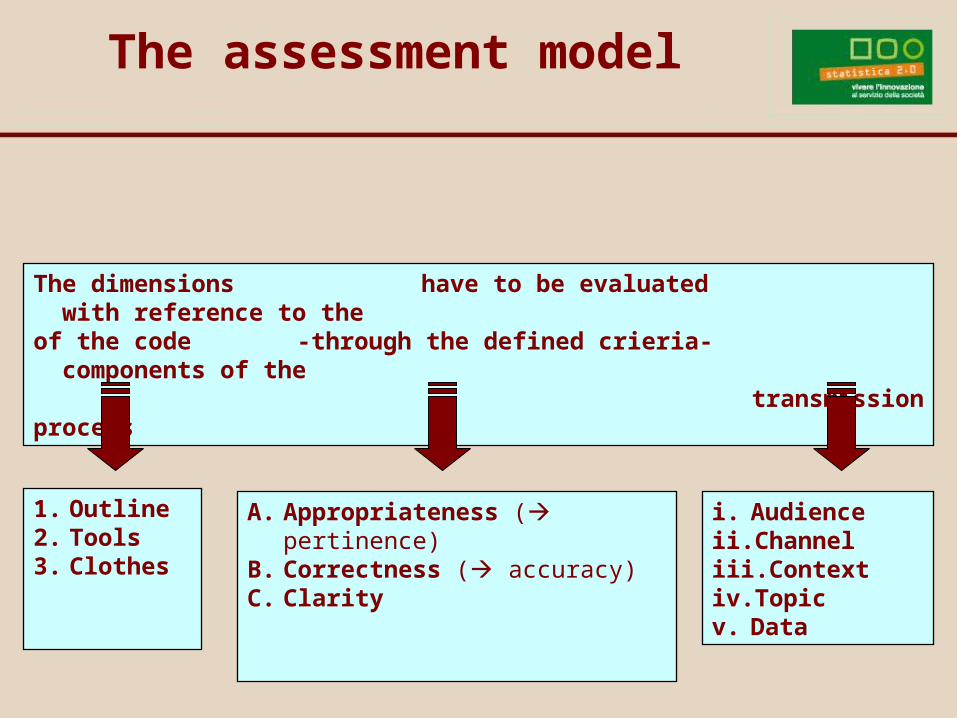
The assessment model
The dimensions have to be evaluated with reference to the of the code -through the defined crieria- components of the
transmission process
1. Outline2. Tools3. Clothes
A. Appropriateness ( pertinence)B. Correctness ( accuracy) C. Clarity
i. Audienceii. Channeliii. Contextiv. Topicv. Data
A. The assessing tableB. Study planning and data
collectionC. Data analysis
2. The application
A. The assessing table
each judge can evaluate presence (1) or absence (0)
….
The conceptual model can be consistently assessed by developing
an Assessing Tablethrough which
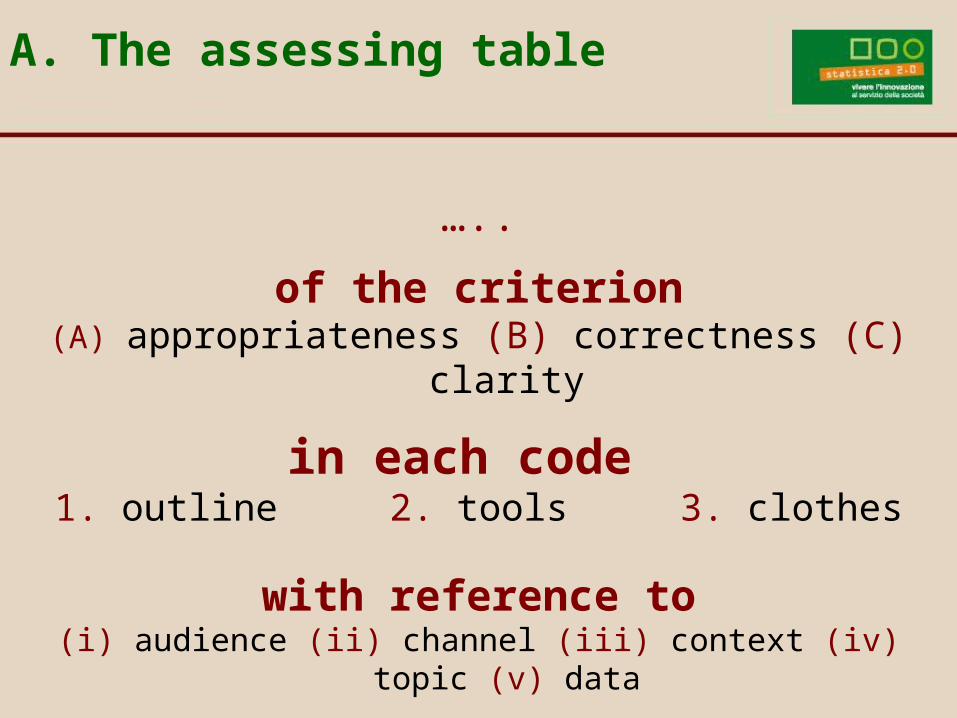
of the criterion(A) appropriateness (B) correctness (C) clarity
…..
in each code
1. outline 2. tools 3. clothes
with reference to(i) audience (ii) channel (iii) context (iv) topic (v) data
A. The assessing table
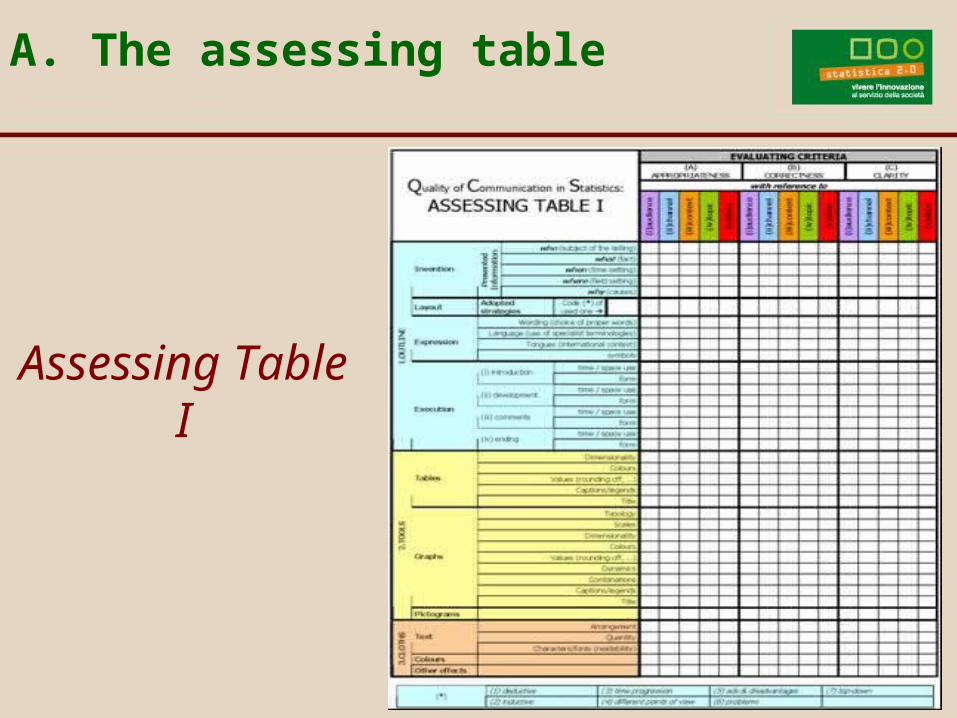
Assessing Table I
A. The assessing table
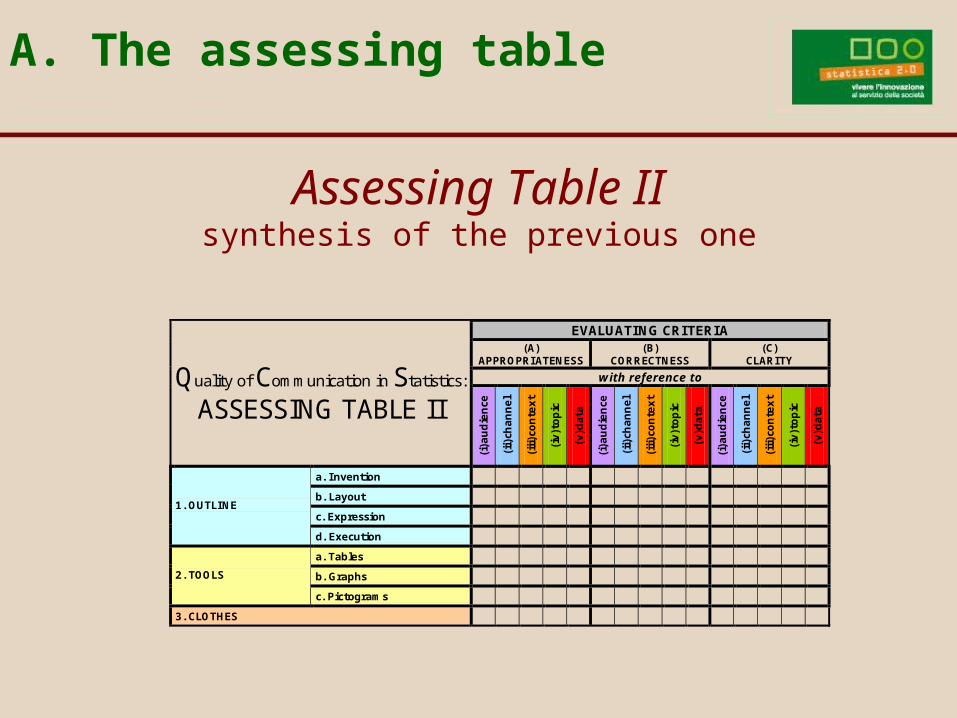
Assessing Table IIsynthesis of the previous one
A. The assessing table
EVALUATING CRITERIA
(A) APPROPRIATENESS
(B) CORRECTNESS
(C) CLARITY
with reference to Quality of Communication in Statistics:
ASSESSING TABLE II
(i)a
udie
nce
(ii)
channel
(iii)c
onte
xt
(iv)t
opic
(v)d
ata
(i)a
udie
nce
(ii)
channel
(iii)c
onte
xt
(iv)t
opic
(v)d
ata
(i)a
udie
nce
(ii)
channel
(iii)c
onte
xt
(iv)t
opic
(v)d
ata
a. Invention
b. Layout
c. Expression 1. OUTLINE
d. Execution
a. Tables
b. Graphs 2. TOOLS
c. Pictograms
3. CLOTHES
B. The study planning and data collection
Selection of the judges
1.Competence in survey
methodology and statistical issues
2.Competence in communication theory
B. The study planning and data collection
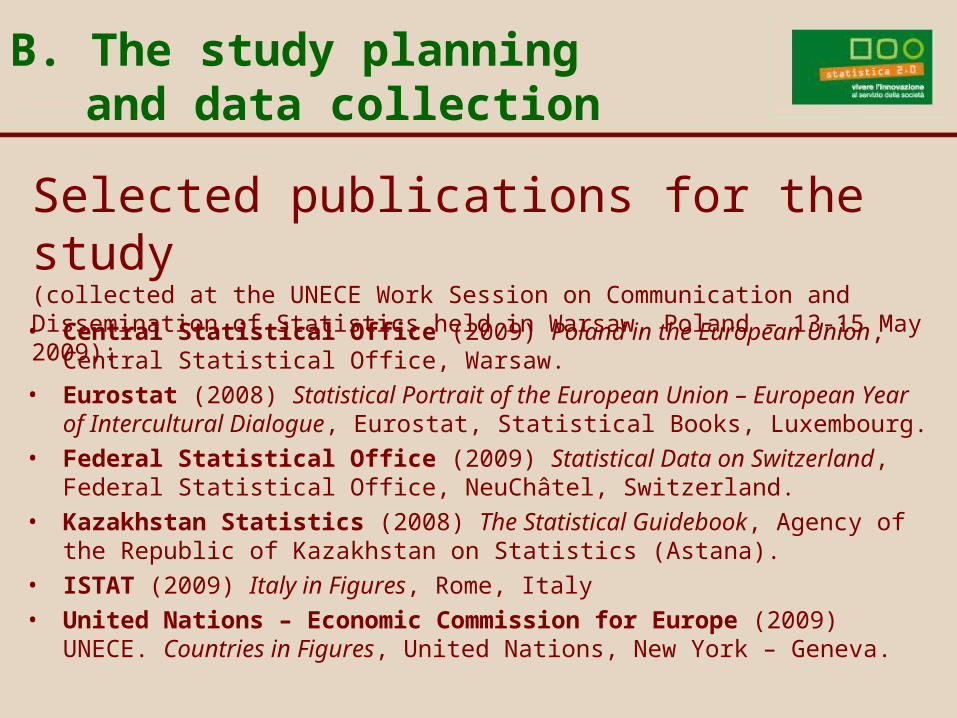
• Central Statistical Office (2009) Poland in the European Union, Central Statistical Office, Warsaw.
• Eurostat (2008) Statistical Portrait of the European Union – European Year of Intercultural Dialogue, Eurostat, Statistical Books, Luxembourg.
• Federal Statistical Office (2009) Statistical Data on Switzerland, Federal Statistical Office, NeuChâtel, Switzerland.
• Kazakhstan Statistics (2008) The Statistical Guidebook, Agency of the Republic of Kazakhstan on Statistics (Astana).
• ISTAT (2009) Italy in Figures, Rome, Italy• United Nations – Economic Commission for Europe (2009) UNECE.
Countries in Figures, United Nations, New York – Geneva.
Selected publications for the study (collected at the UNECE Work Session on Communication and Dissemination of Statistics held in Warsaw, Poland – 13-15 May 2009):
C. Data analysis
SOLUTION
PROBLEM
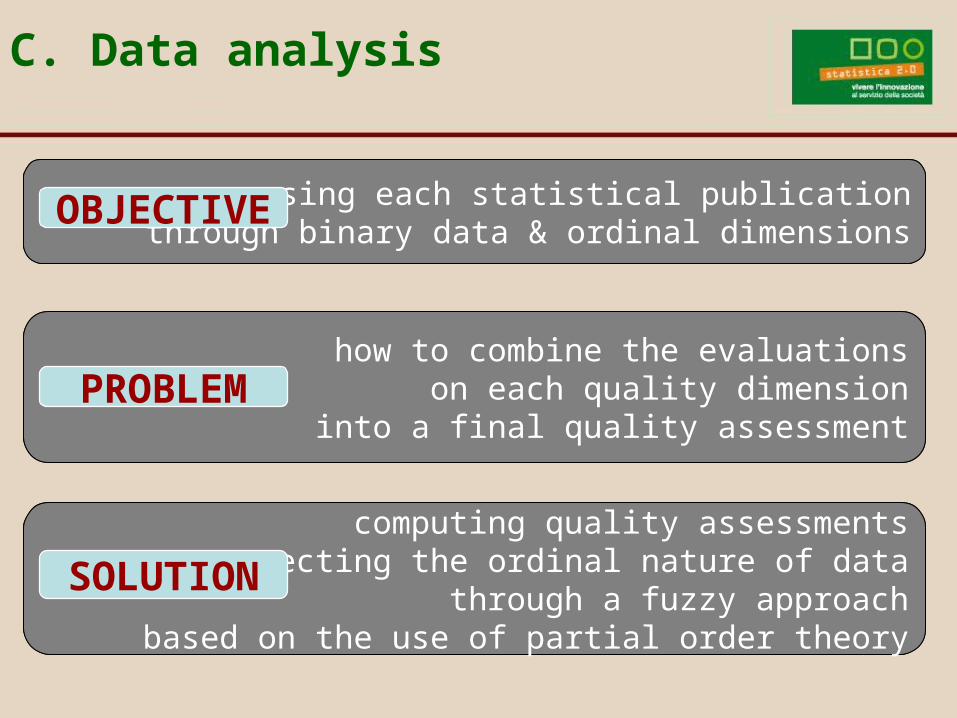
OBJECTIVEassessing each statistical publicationthrough binary data & ordinal dimensions
how to combine the evaluationson each quality dimension
into a final quality assessment
computing quality assessmentsrespecting the ordinal nature of data
through a fuzzy approachbased on the use of partial order theory
OBJECTIVE
PROBLEM
SOLUTION
C. Data analysis
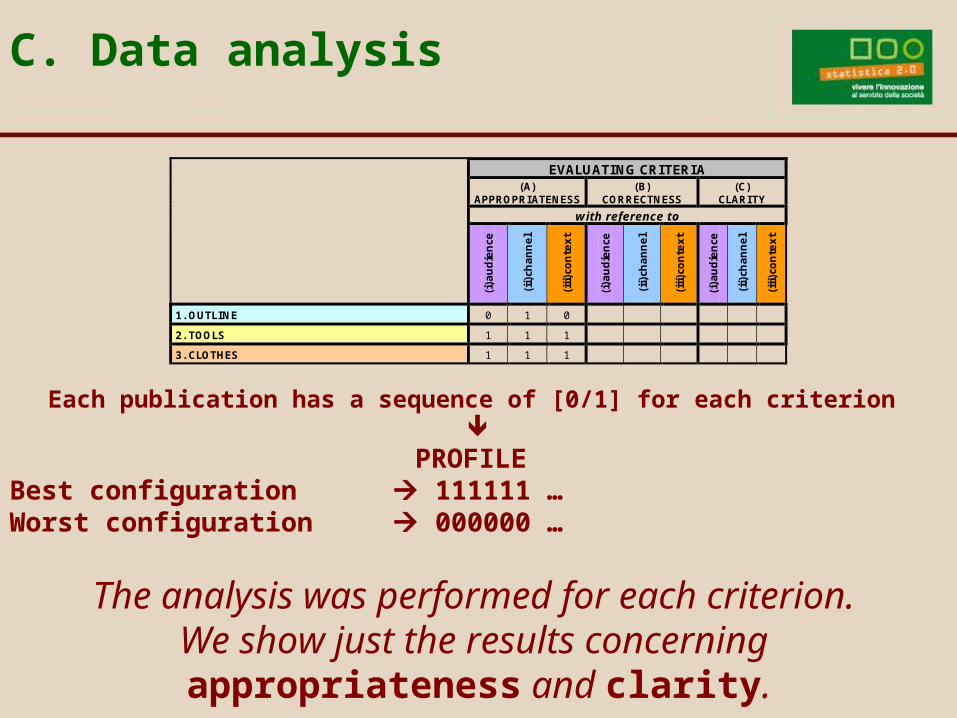
Each publication has a sequence of [0/1] for each criterion
PROFILE Best configuration 111111 …Worst configuration 000000 …
EVALUATING CRITERIA
(A) APPROPRIATENESS
(B) CORRECTNESS
(C) CLARITY
with reference to
(i)a
udie
nce
(ii)
channel
(iii)c
onte
xt
(i)a
udie
nce
(ii)
channel
(iii)c
onte
xt
(i)a
udie
nce
(ii)
channel
(iii)c
onte
xt
1. OUTLINE 0 1 0
2. TOOLS 1 1 1
3. CLOTHES 1 1 1
The analysis was performed for each criterion. We show just the results concerning
appropriateness and clarity.
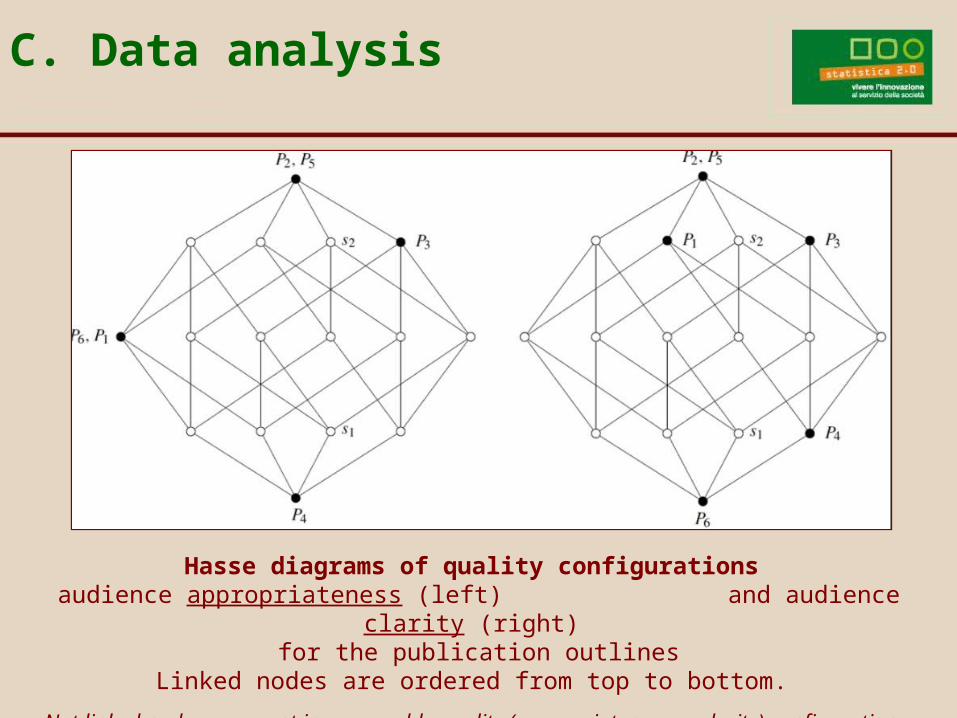
Hasse diagrams of quality configurations audience appropriateness (left) and audience clarity (right)
for the publication outlinesLinked nodes are ordered from top to bottom.
Not linked nodes represent incomparable quality (appropriateness or clarity) configurations.
C. Data analysis
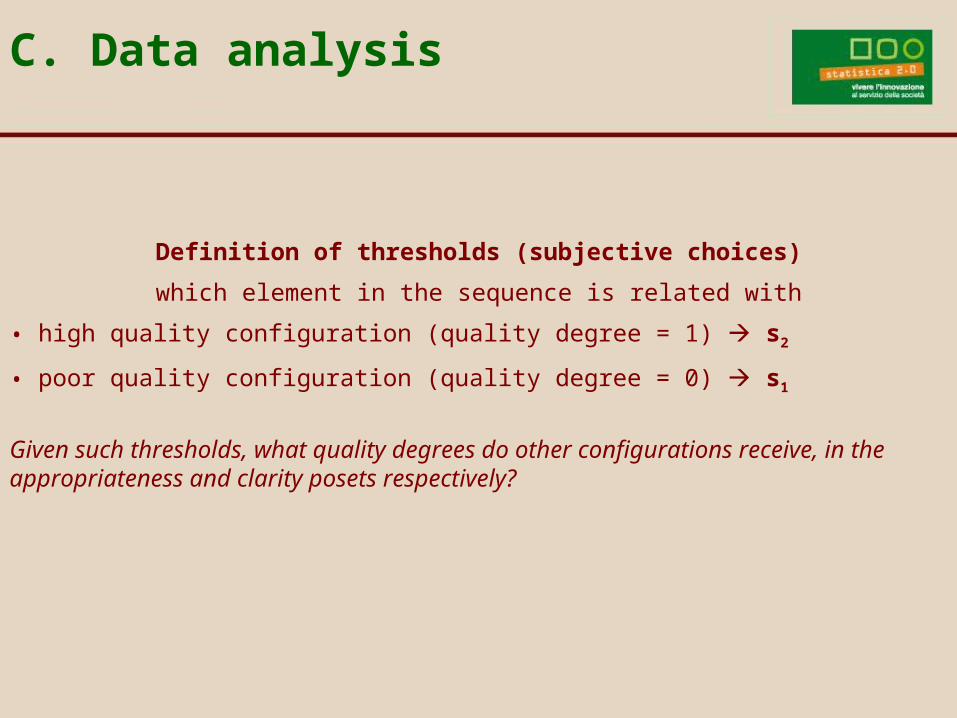
Definition of thresholds (subjective choices)
which element in the sequence is related with
• high quality configuration (quality degree = 1) s2
• poor quality configuration (quality degree = 0) s1
Given such thresholds, what quality degrees do other configurations receive, in the appropriateness and clarity posets respectively?
C. Data analysis
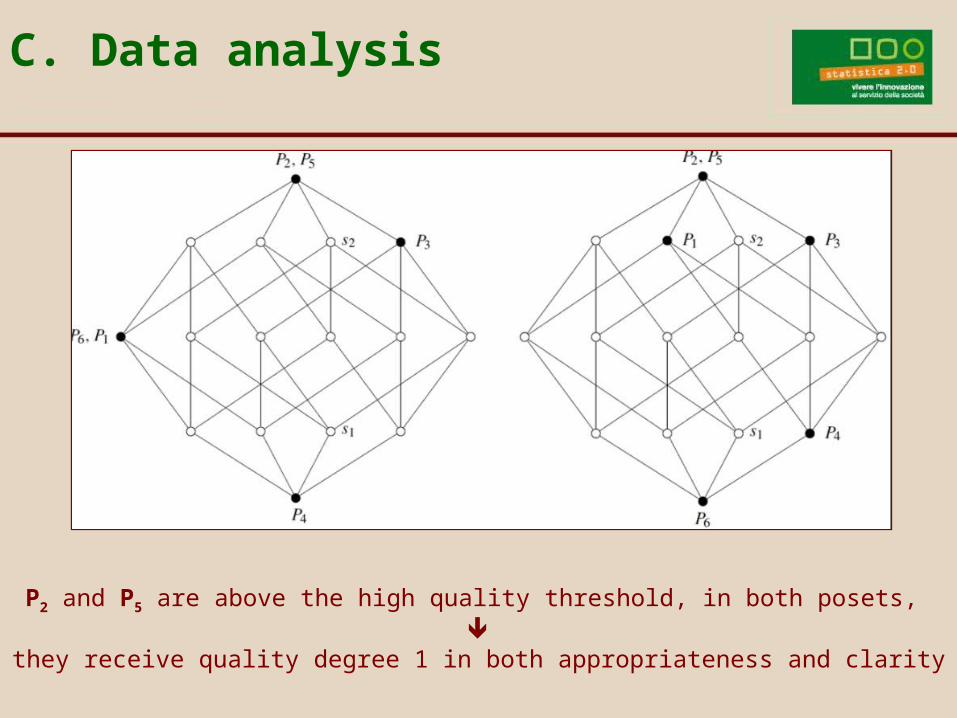
P2 and P5 are above the high quality threshold, in both posets,
they receive quality degree 1 in both appropriateness and clarity
C. Data analysis
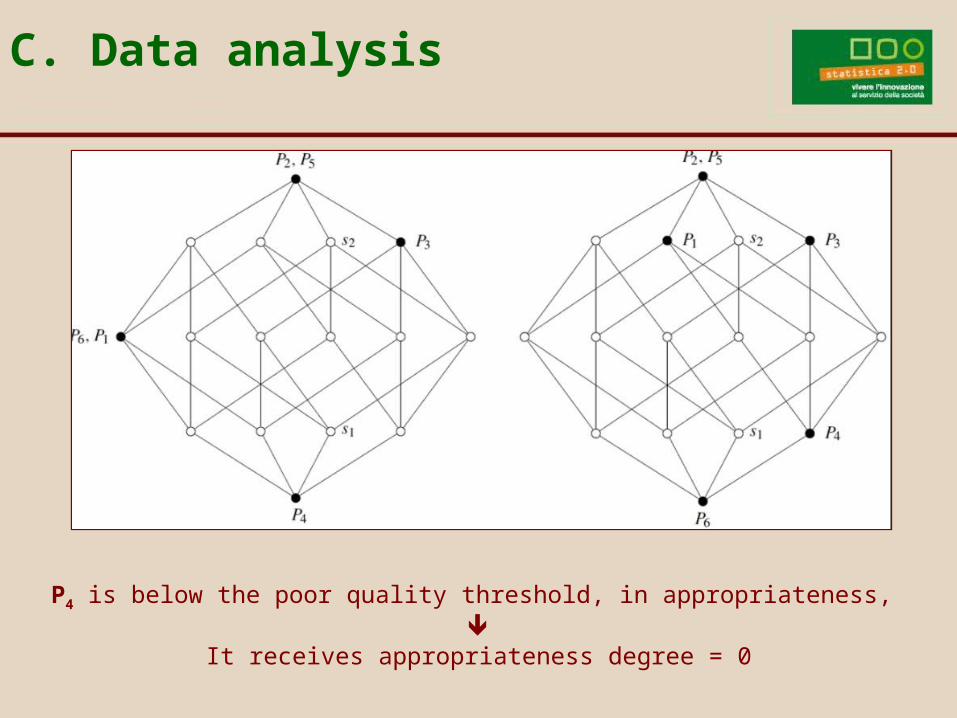
P4 is below the poor quality threshold, in appropriateness,
It receives appropriateness degree = 0
C. Data analysis
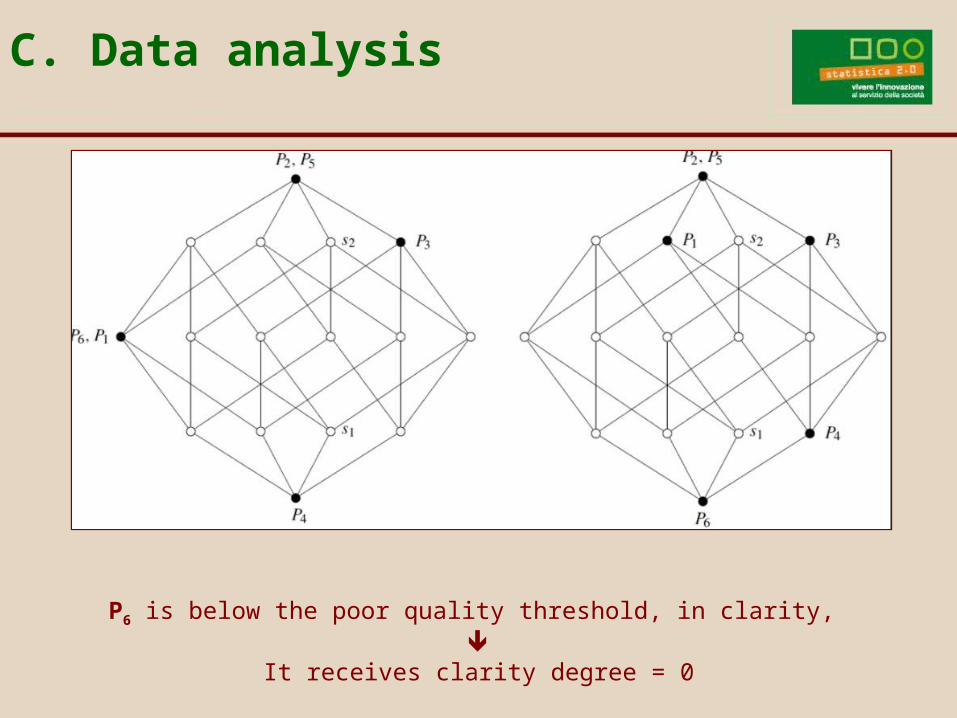
P6 is below the poor quality threshold, in clarity,
It receives clarity degree = 0
C. Data analysis
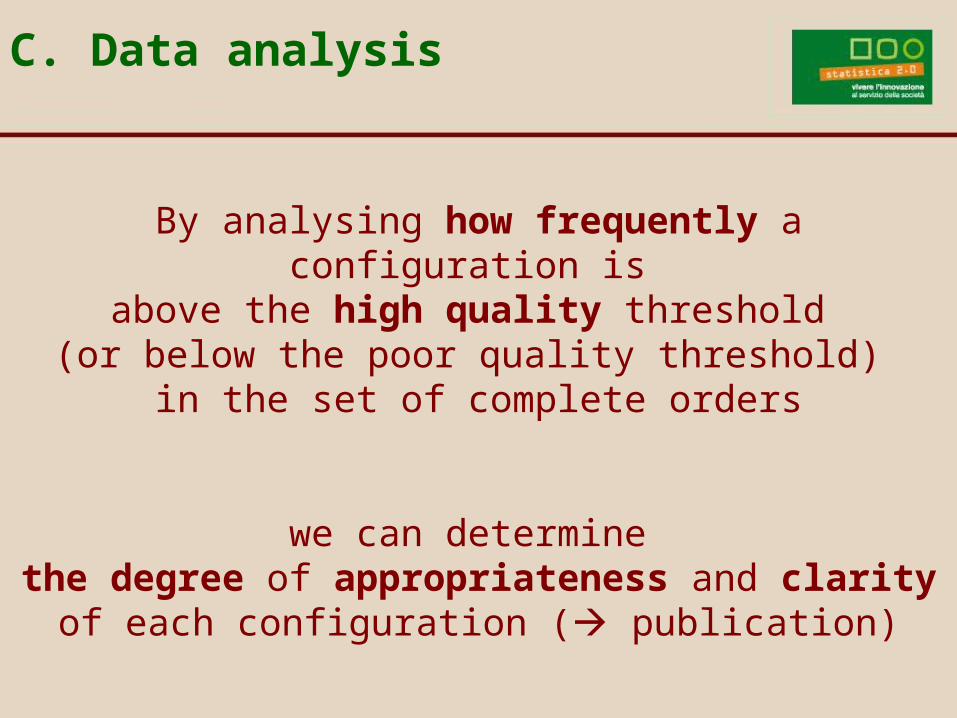
By analysing how frequently a configuration is above the high quality threshold
(or below the poor quality threshold) in the set of complete orders
we can determine the degree of appropriateness and clarity
of each configuration ( publication)
C. Data analysis
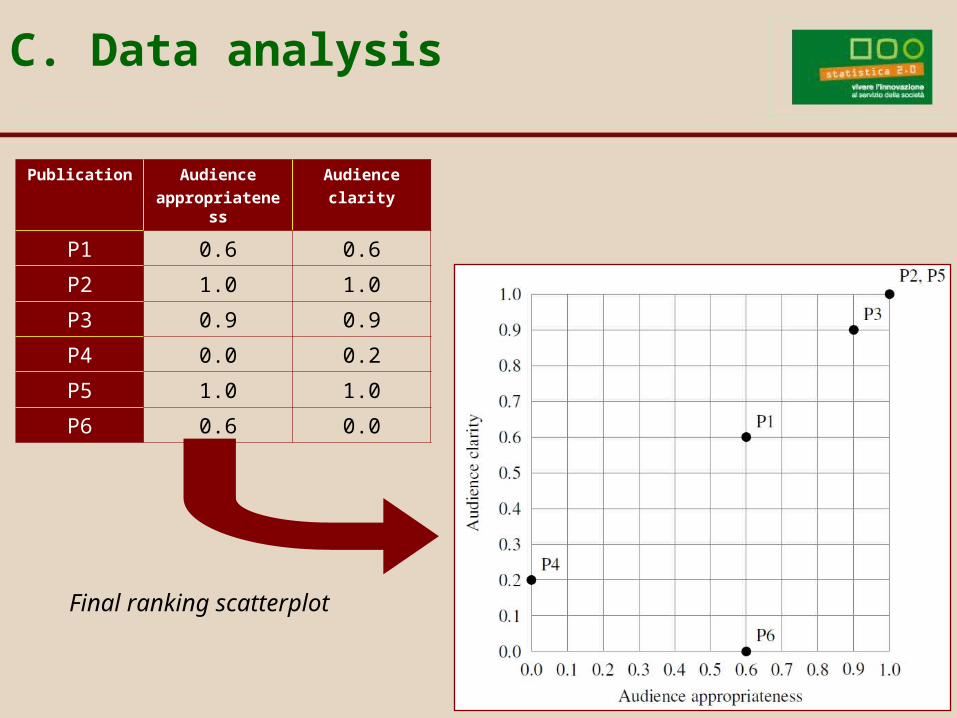
Final ranking scatterplot
Publication Audience
appropriateness
Audience
clarity
P1 0.6 0.6
P2 1.0 1.0
P3 0.9 0.9
P4 0.0 0.2
P5 1.0 1.0
P6 0.6 0.0
C. Data analysis
Goals
- Improving the assessing model
- New applications
- Promoting an improvement of statisticians’ education by proposing a training module on communication
The way forward …


![暮らしのゲンテン|genten2012 • rgenten FIRENZE, rgenten FIRENZE, rgenten FIRENZE] Vicolo dei Cerchi I 50122 Firenze ITALY Created Date 8/23/2012 6:25:27 PM ...](https://static.documents.pub/doc/80x56/60a89577778c6f25a0219137/fffioe-2012-a-rgenten-firenze-rgenten-firenze-rgenten-firenze.jpg)