23
Presenting HDFC Prudence Fund (An Open-Ended Balanced Scheme) October 2012 1
PresentingHDFC Prudence Fund
(An Open-Ended Balanced Scheme)October 2012
1
Table of Contents
Definition and Positioning
Product Rationale and Investment Strategy
Portfolio Composition
Product Features and Asset Allocation Pattern
Performance and Dividend History
Fund Suitability
Disclaimer
2
What is a balanced fund?
A balanced fund is one that has a portfolio comprising debtinstruments, convertible securities, preference and equity shares
Assets are generally held in predefined proportion of debt / money marketsecurities and equities
Broadly, balanced funds target returns greater than debt schemes with lowerBroadly, balanced funds target returns greater than debt schemes with lowervolatility than equity schemes
Balanced funds provide investors the growth of equity with the stability of debt
3
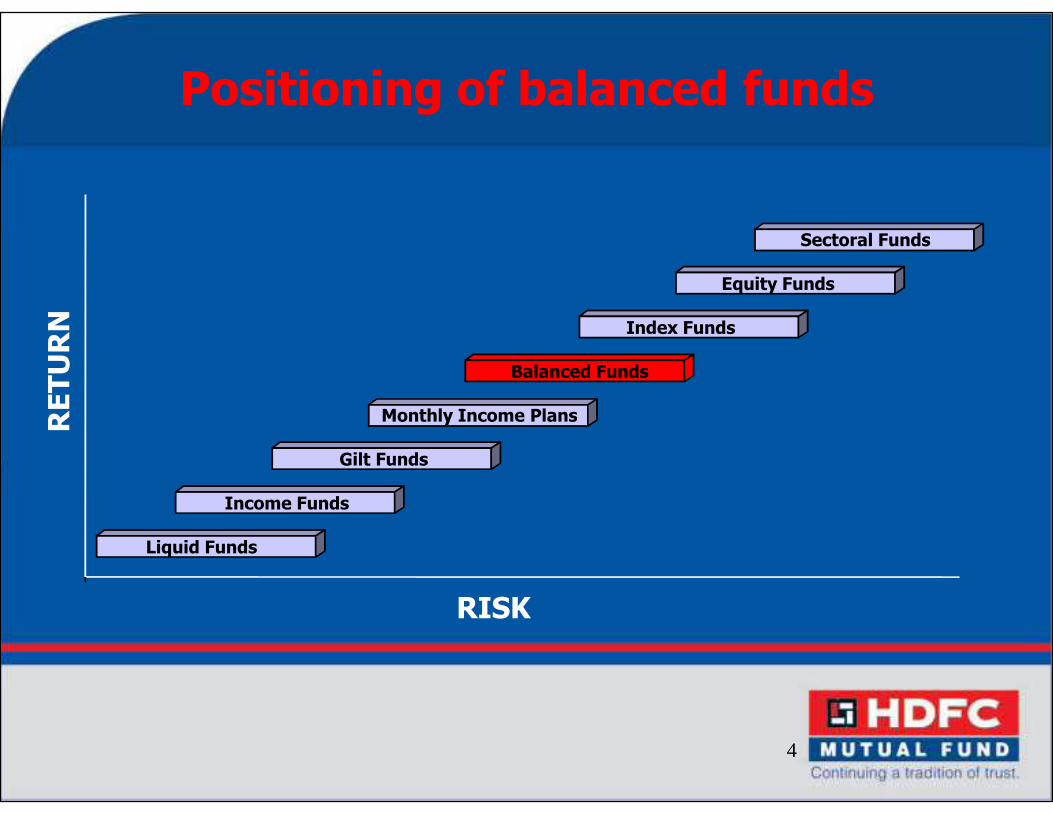
Positioning of balanced fundsRETURN
Monthly Income Plans
Balanced Funds
Index Funds
Equity Funds
Sectoral Funds
RISK
RETURN
Liquid Funds
Income Funds
Gilt Funds
Monthly Income Plans
4
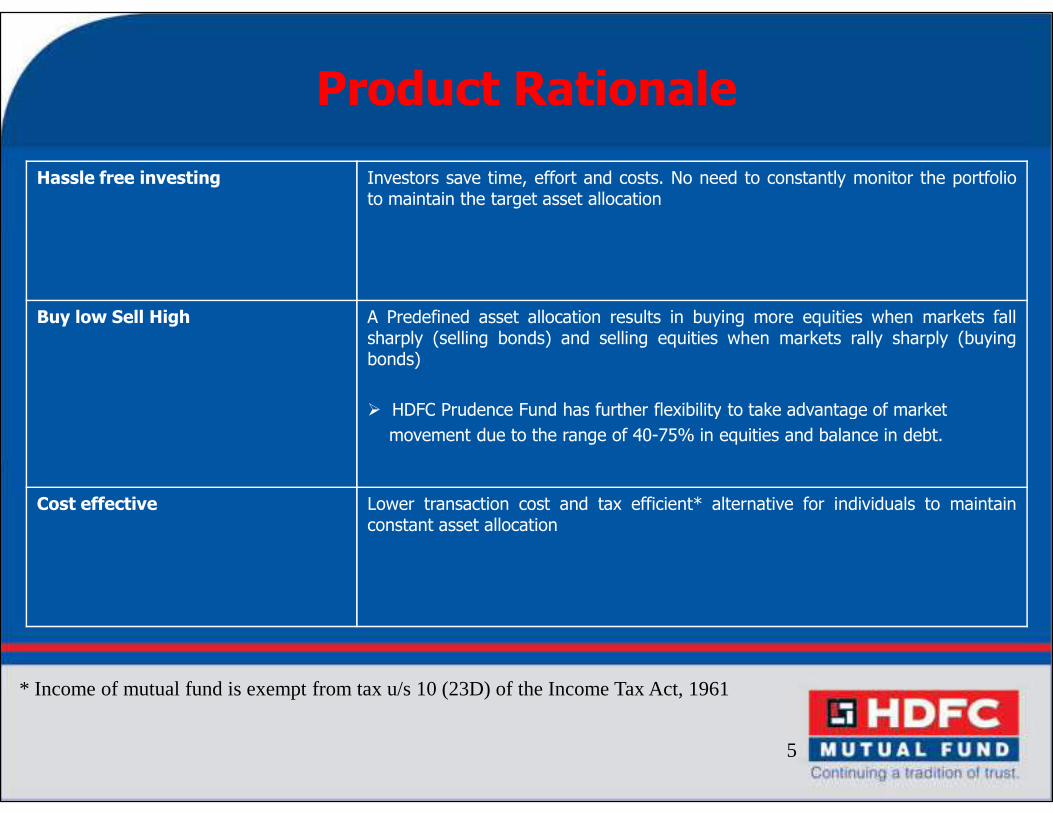
Product Rationale
Hassle free investing Investors save time, effort and costs. No need to constantly monitor the portfolioto maintain the target asset allocation
Buy low Sell High A Predefined asset allocation results in buying more equities when markets fallsharply (selling bonds) and selling equities when markets rally sharply (buyingbonds)
� HDFC Prudence Fund has further flexibility to take advantage of market� HDFC Prudence Fund has further flexibility to take advantage of market
movement due to the range of 40-75% in equities and balance in debt.
Cost effective Lower transaction cost and tax efficient* alternative for individuals to maintainconstant asset allocation
5
* Income of mutual fund is exempt from tax u/s 10 (23D) of the Income Tax Act, 1961
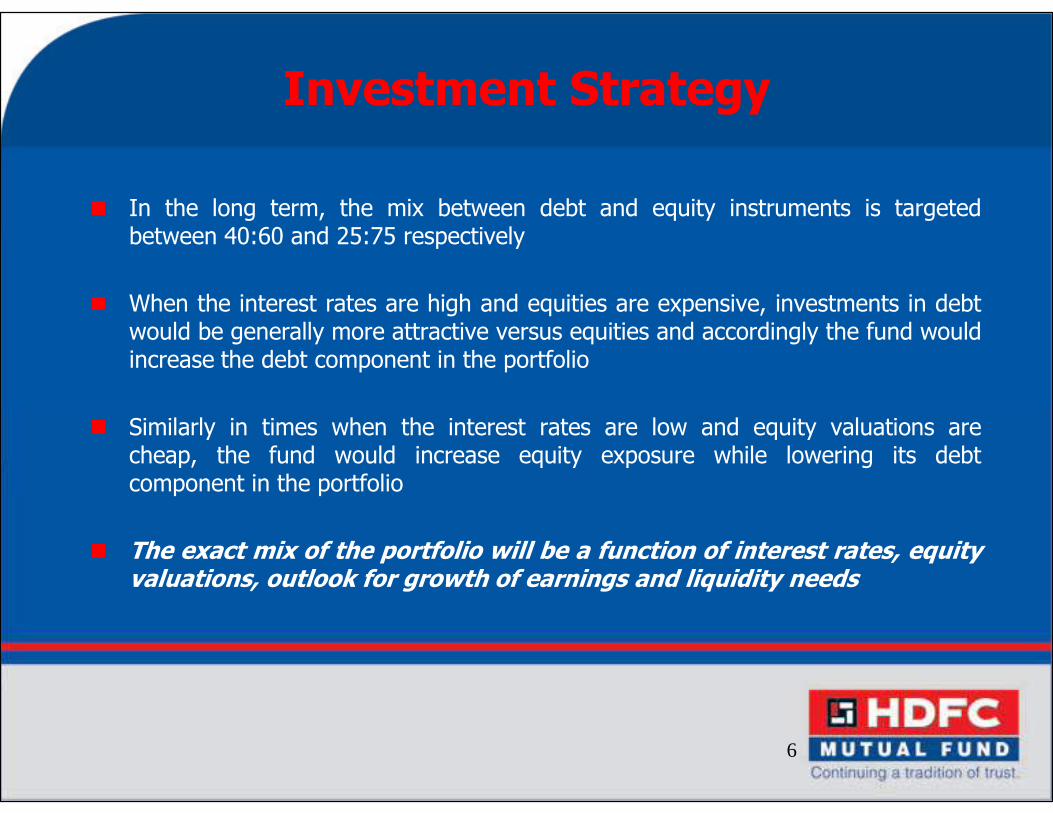
Investment Strategy
In the long term, the mix between debt and equity instruments is targetedbetween 40:60 and 25:75 respectively
When the interest rates are high and equities are expensive, investments in debtwould be generally more attractive versus equities and accordingly the fund wouldincrease the debt component in the portfolio
Similarly in times when the interest rates are low and equity valuations arecheap, the fund would increase equity exposure while lowering its debtcomponent in the portfolio
The exact mix of the portfolio will be a function of interest rates, equityvaluations, outlook for growth of earnings and liquidity needs
6
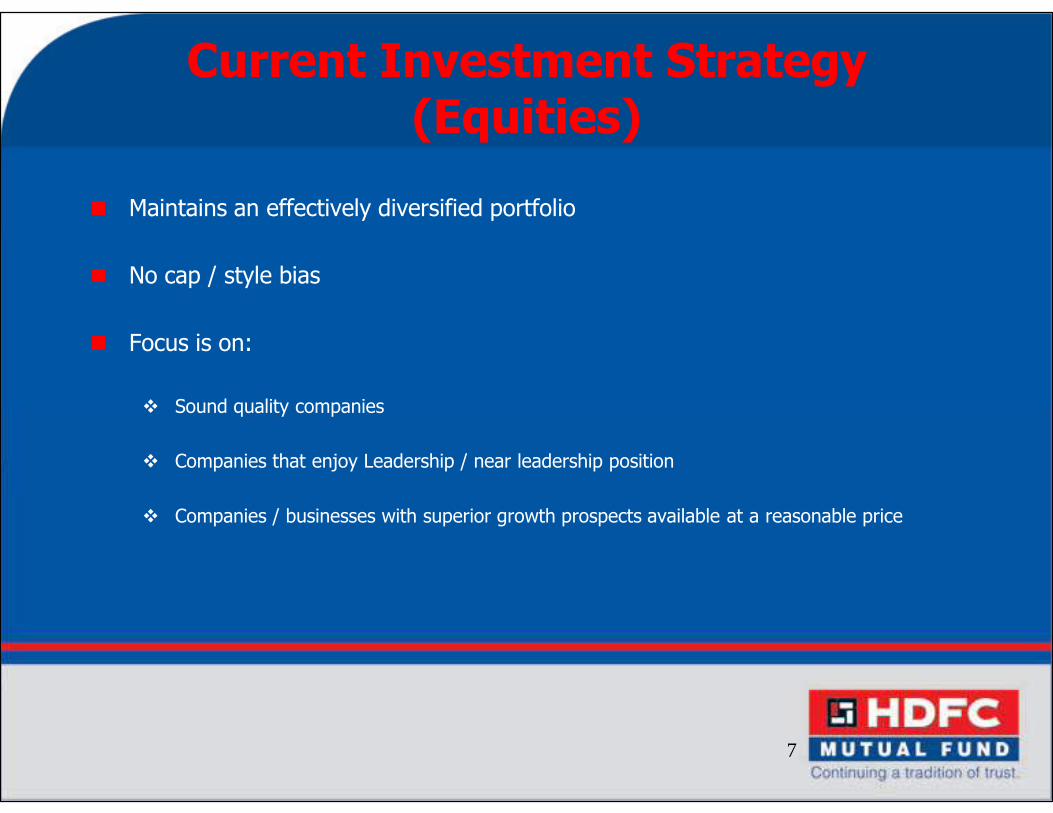
Current Investment Strategy(Equities)
Maintains an effectively diversified portfolio
No cap / style bias
Focus is on:
� Sound quality companies� Sound quality companies
� Companies that enjoy Leadership / near leadership position
� Companies / businesses with superior growth prospects available at a reasonable price
7
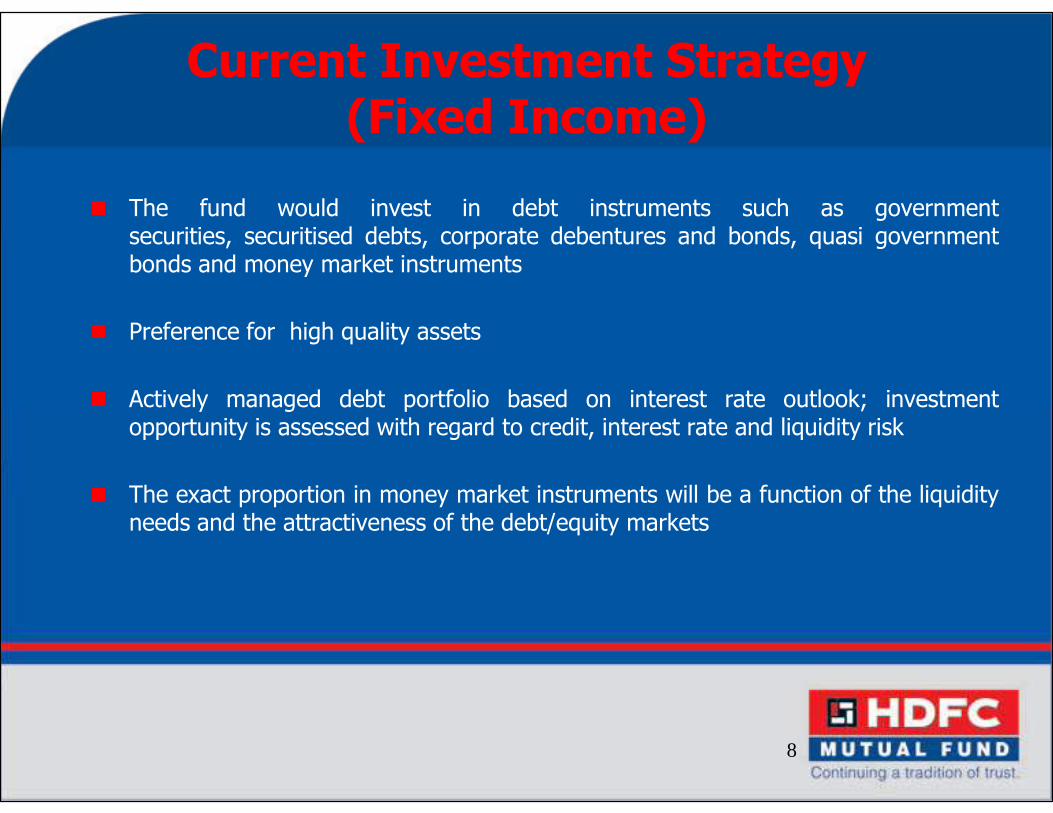
Current Investment Strategy(Fixed Income)
The fund would invest in debt instruments such as governmentsecurities, securitised debts, corporate debentures and bonds, quasi governmentbonds and money market instruments
Preference for high quality assets
Actively managed debt portfolio based on interest rate outlook; investmentActively managed debt portfolio based on interest rate outlook; investmentopportunity is assessed with regard to credit, interest rate and liquidity risk
The exact proportion in money market instruments will be a function of the liquidityneeds and the attractiveness of the debt/equity markets
8
Portfolio Composition(As on September 30, 2012)(As on September 30, 2012)
9
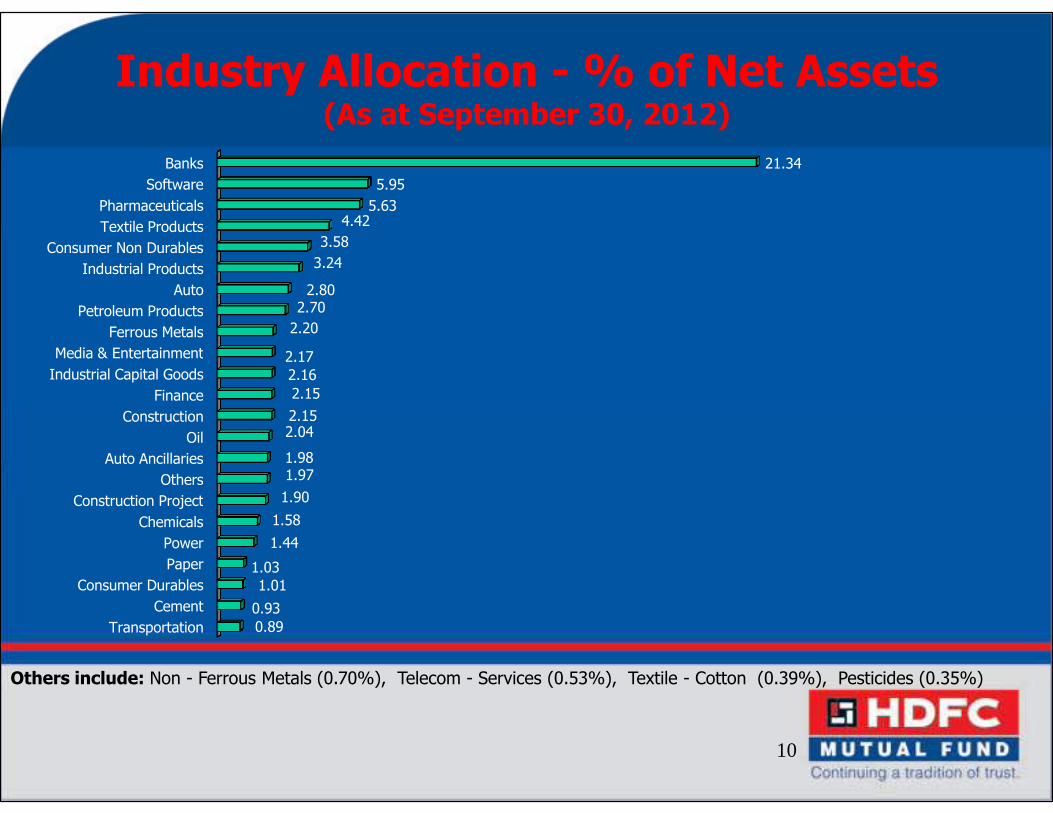
Industry Allocation - % of Net Assets(As at September 30, 2012)
Finance
Industrial Capital Goods
Media & Entertainment
Ferrous Metals
Petroleum Products
Auto
Industrial Products
Consumer Non Durables
Textile Products
Pharmaceuticals
Software
Banks
2.15
2.15
2.16
2.17
2.20
2.702.80
3.24
3.58
4.425.63
5.95
21.34
Transportation
Cement
Consumer Durables
Paper
Power
Chemicals
Construction Project
Others
Auto Ancillaries
Oil
Construction
0.89
0.93
1.01
1.03
1.44
1.58
1.90
1.971.98
2.042.15
Others include: Non - Ferrous Metals (0.70%), Telecom - Services (0.53%), Textile - Cotton (0.39%), Pesticides (0.35%)
10
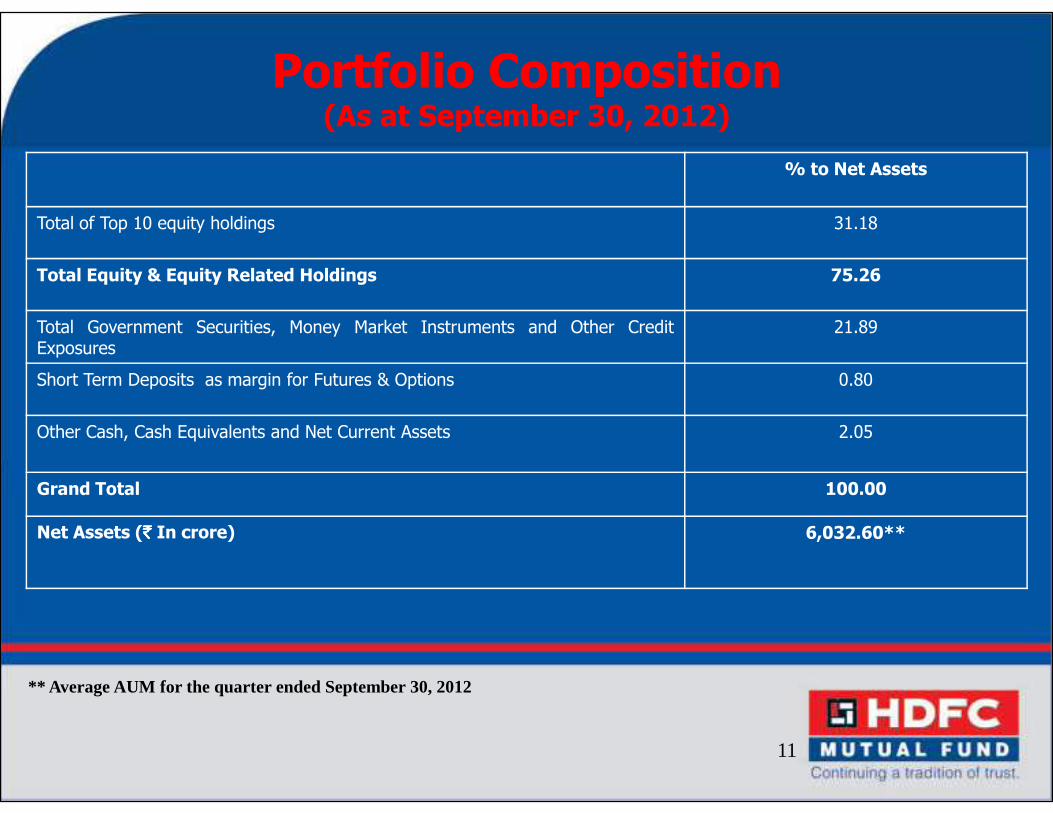
Portfolio Composition(As at September 30, 2012)
% to Net Assets
Total of Top 10 equity holdings 31.18
Total Equity & Equity Related Holdings 75.26
Total Government Securities, Money Market Instruments and Other CreditExposures
21.89
Short Term Deposits as margin for Futures & Options 0.80
Other Cash, Cash Equivalents and Net Current Assets 2.05
Grand Total 100.00
Net Assets (`̀̀̀ In crore) 6,032.60**
11
** Average AUM for the quarter ended September 30, 2012
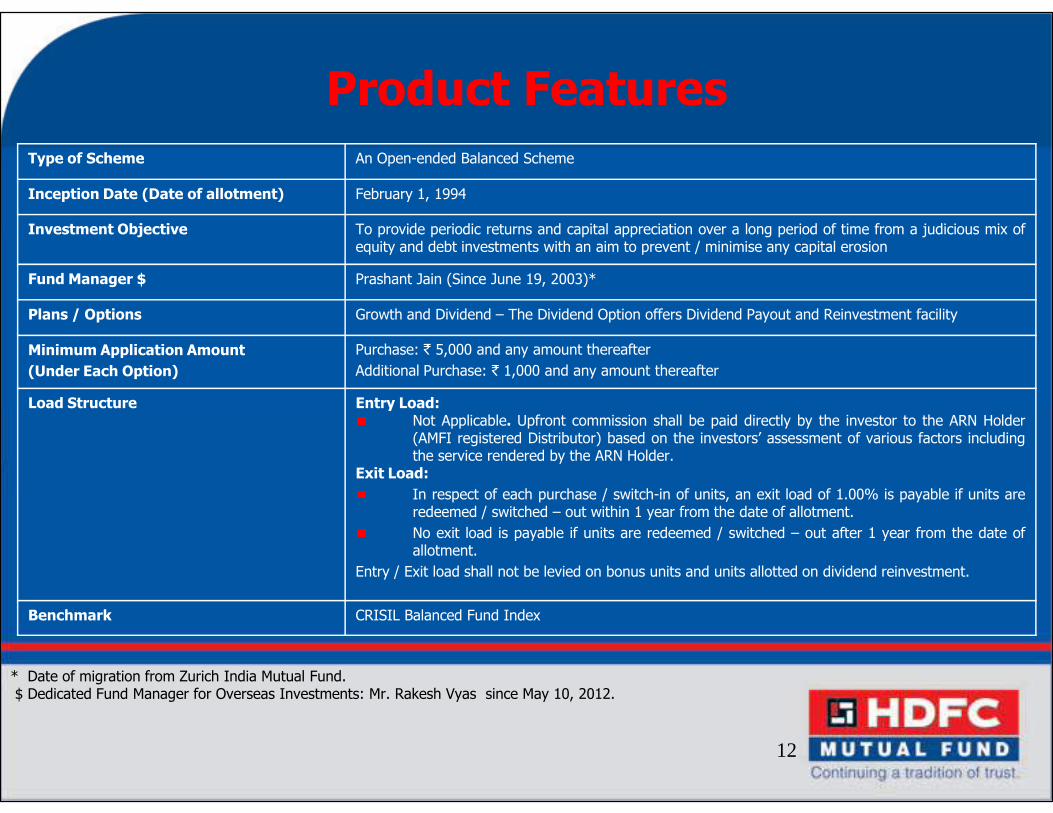
Product Features
Type of Scheme An Open-ended Balanced Scheme
Inception Date (Date of allotment) February 1, 1994
Investment Objective To provide periodic returns and capital appreciation over a long period of time from a judicious mix ofequity and debt investments with an aim to prevent / minimise any capital erosion
Fund Manager $ Prashant Jain (Since June 19, 2003)*
Plans / Options Growth and Dividend – The Dividend Option offers Dividend Payout and Reinvestment facility
Minimum Application Amount
(Under Each Option)
Purchase: ` 5,000 and any amount thereafter
Additional Purchase: ` 1,000 and any amount thereafter
Load Structure Entry Load:Load Structure Entry Load:Not Applicable. Upfront commission shall be paid directly by the investor to the ARN Holder(AMFI registered Distributor) based on the investors’ assessment of various factors includingthe service rendered by the ARN Holder.
Exit Load:
In respect of each purchase / switch-in of units, an exit load of 1.00% is payable if units areredeemed / switched – out within 1 year from the date of allotment.
No exit load is payable if units are redeemed / switched – out after 1 year from the date ofallotment.
Entry / Exit load shall not be levied on bonus units and units allotted on dividend reinvestment.
Benchmark CRISIL Balanced Fund Index
* Date of migration from Zurich India Mutual Fund. $ Dedicated Fund Manager for Overseas Investments: Mr. Rakesh Vyas since May 10, 2012.
12
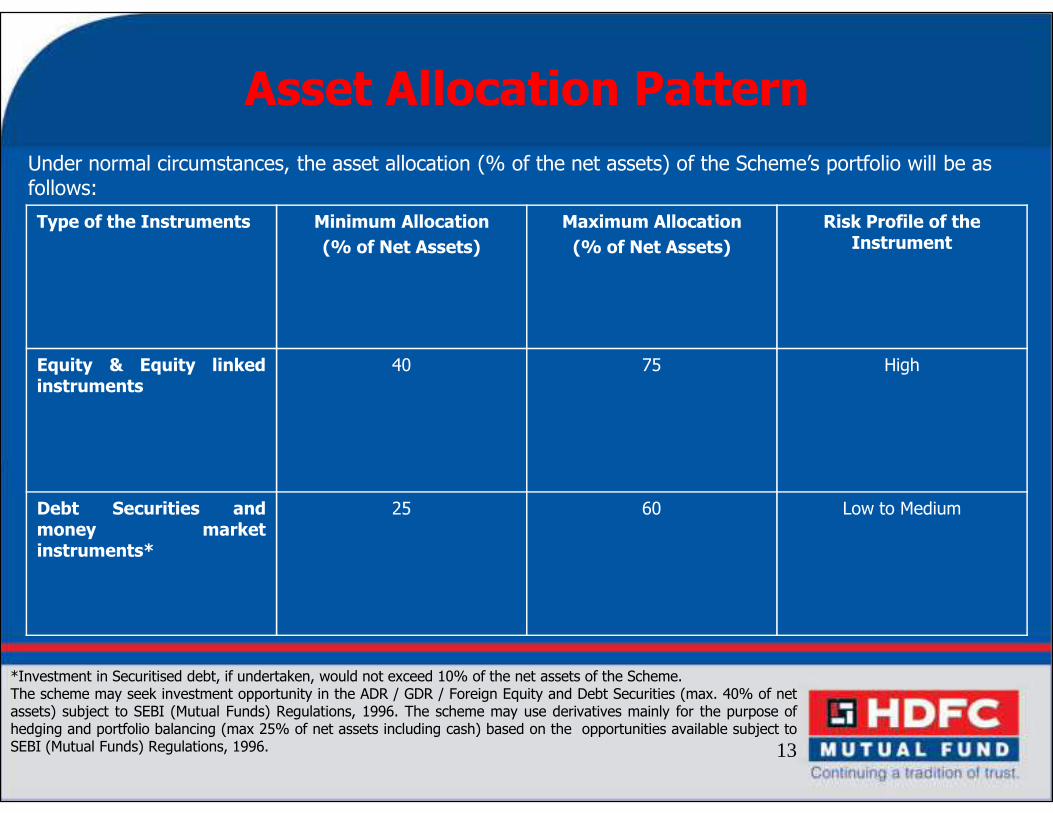
Asset Allocation Pattern
Type of the Instruments Minimum Allocation
(% of Net Assets)
Maximum Allocation
(% of Net Assets)
Risk Profile of the Instrument
Equity & Equity linkedinstruments
40 75 High
Under normal circumstances, the asset allocation (% of the net assets) of the Scheme’s portfolio will be as follows:
Debt Securities andmoney marketinstruments*
25 60 Low to Medium
*Investment in Securitised debt, if undertaken, would not exceed 10% of the net assets of the Scheme.The scheme may seek investment opportunity in the ADR / GDR / Foreign Equity and Debt Securities (max. 40% of netassets) subject to SEBI (Mutual Funds) Regulations, 1996. The scheme may use derivatives mainly for the purpose ofhedging and portfolio balancing (max 25% of net assets including cash) based on the opportunities available subject toSEBI (Mutual Funds) Regulations, 1996. 13
Performance (As on September 28, 2012)(As on September 28, 2012)
14
Date Period
NAV
Per
Unit (`)
Scheme
Returns
(%) ^ $$ *
Crisil
Balanced
Fund Index
(%) #
S & P CNX
NIFTY (%)
##
Scheme
(`)
Crisil
Balanced
Fund (`) #
S & P CNX
NIFTY (%)
(`) ##
Crisil
Balanced S & P CNX
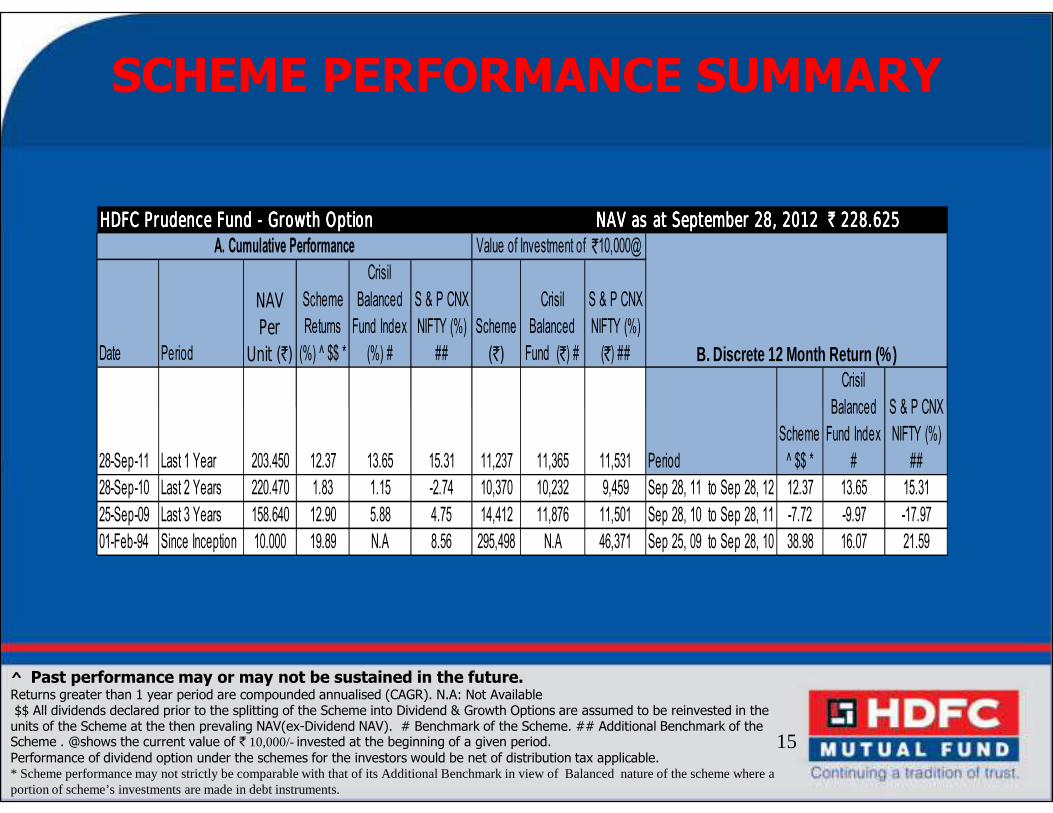
HDFC Prudence Fund - Growth Option NAV as at September 28, 2012 ` 228.625HDFC Prudence Fund - Growth Option NAV as at September 28, 2012 ` 228.625HDFC Prudence Fund - Growth Option NAV as at September 28, 2012 ` 228.625HDFC Prudence Fund - Growth Option NAV as at September 28, 2012 ` 228.625
Value of Investment of `10,000@
B. Discrete 12 Month Return (%)
A. Cumulative Performance
SCHEME PERFORMANCE SUMMARY
^ Past performance may or may not be sustained in the future.Returns greater than 1 year period are compounded annualised (CAGR). N.A: Not Available$$ All dividends declared prior to the splitting of the Scheme into Dividend & Growth Options are assumed to be reinvested in the units of the Scheme at the then prevaling NAV(ex-Dividend NAV). # Benchmark of the Scheme. ## Additional Benchmark of the Scheme . @shows the current value of ` 10,000/-invested at the beginning of a given period.Performance of dividend option under the schemes for the investors would be net of distribution tax applicable.* Scheme performance may not strictly be comparable with that of its Additional Benchmark in view of Balanced nature of the scheme where a portion of scheme’s investments are made in debt instruments.
15
28-Sep-11 Last 1 Year 203.450 12.37 13.65 15.31 11,237 11,365 11,531 Period
Scheme
^ $$ *
Balanced
Fund Index
#
S & P CNX
NIFTY (%)
##
28-Sep-10 Last 2 Years 220.470 1.83 1.15 -2.74 10,370 10,232 9,459 Sep 28, 11 to Sep 28, 12 12.37 13.65 15.31
25-Sep-09 Last 3 Years 158.640 12.90 5.88 4.75 14,412 11,876 11,501 Sep 28, 10 to Sep 28, 11 -7.72 -9.97 -17.97
01-Feb-94 Since Inception 10.000 19.89 N.A 8.56 295,498 N.A 46,371 Sep 25, 09 to Sep 28, 10 38.98 16.07 21.59
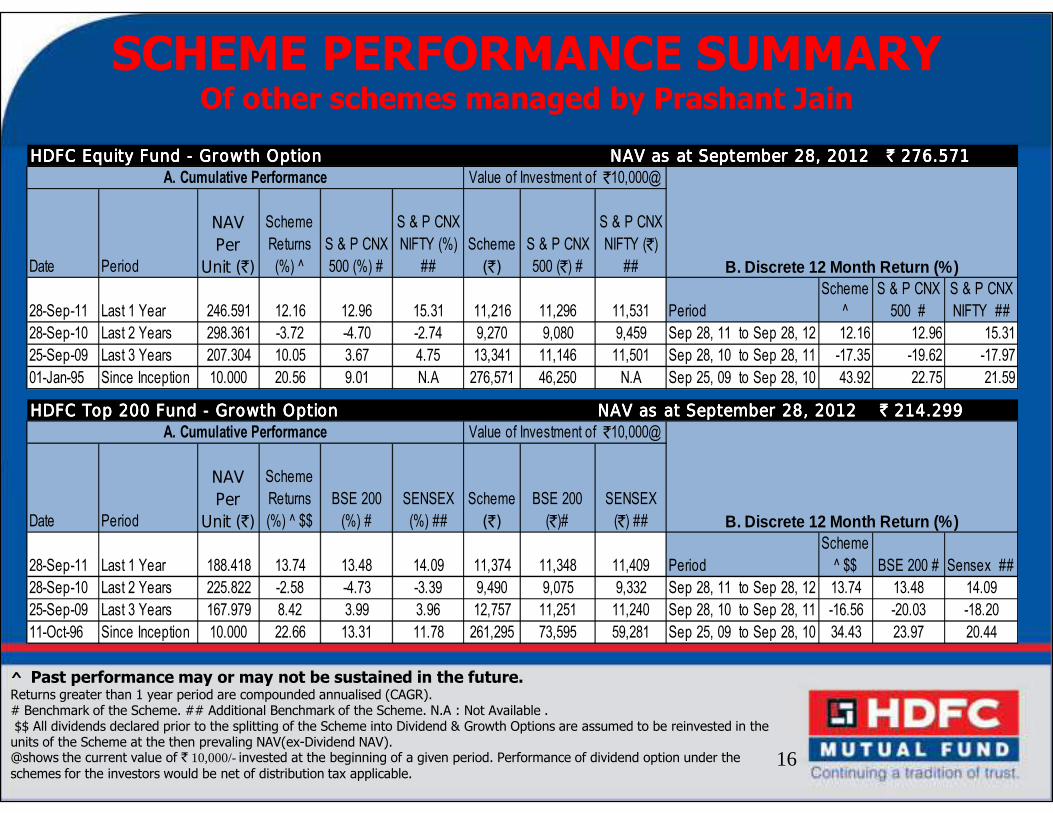
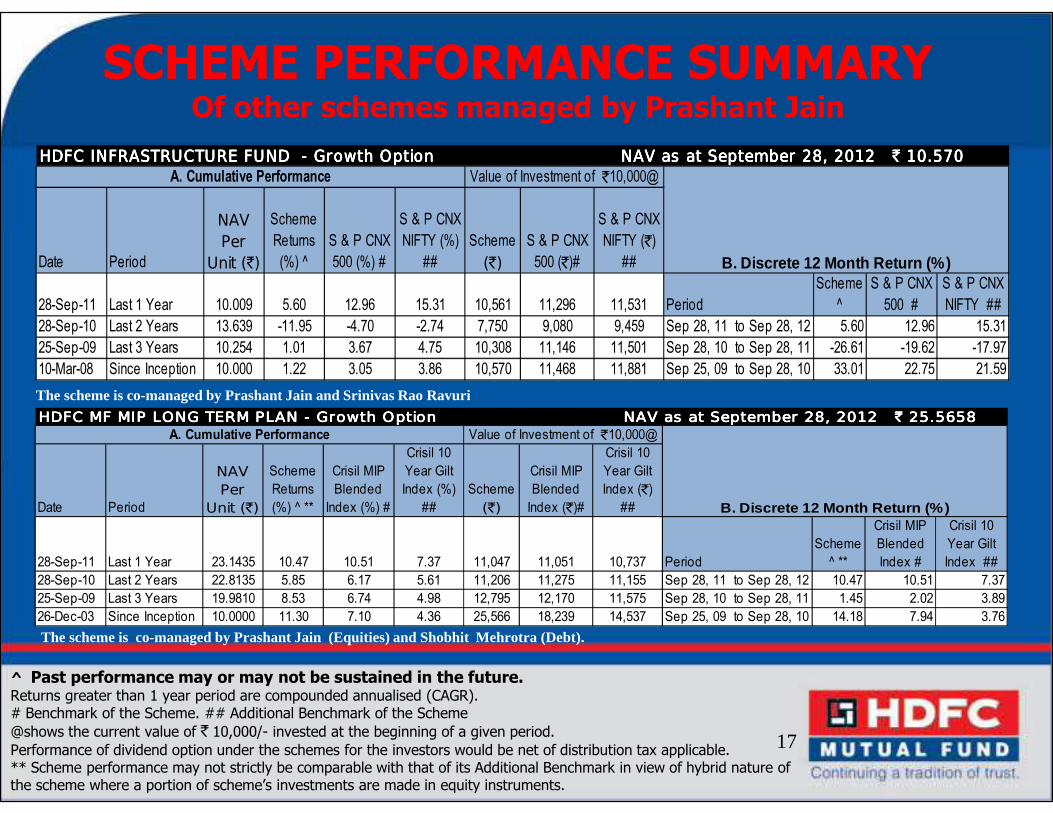
SCHEME PERFORMANCE SUMMARYOf other schemes managed by Prashant Jain
Date Period
NAV
Per
Unit (`)
Scheme
Returns
(%) ^
S & P CNX
500 (%) #
S & P CNX
NIFTY (%)
##
Scheme
(`)
S & P CNX
500 (`) #
S & P CNX
NIFTY (`)
##
28-Sep-11 Last 1 Year 246.591 12.16 12.96 15.31 11,216 11,296 11,531 Period
Scheme
^
S & P CNX
500 #
S & P CNX
NIFTY ##
28-Sep-10 Last 2 Years 298.361 -3.72 -4.70 -2.74 9,270 9,080 9,459 Sep 28, 11 to Sep 28, 12 12.16 12.96 15.31
25-Sep-09 Last 3 Years 207.304 10.05 3.67 4.75 13,341 11,146 11,501 Sep 28, 10 to Sep 28, 11 -17.35 -19.62 -17.97
01-Jan-95 Since Inception 10.000 20.56 9.01 N.A 276,571 46,250 N.A Sep 25, 09 to Sep 28, 10 43.92 22.75 21.59
HDFC Equity Fund - Growth Option NAV as at September 28, 2012 ` 276.571HDFC Equity Fund - Growth Option NAV as at September 28, 2012 ` 276.571HDFC Equity Fund - Growth Option NAV as at September 28, 2012 ` 276.571HDFC Equity Fund - Growth Option NAV as at September 28, 2012 ` 276.571
Value of Investment of `10,000@
B. Discrete 12 Month Return (%)
A. Cumulative Performance
HDFC Top 200 Fund - Growth Option NAV as at September 28, 2012 ` 214.299HDFC Top 200 Fund - Growth Option NAV as at September 28, 2012 ` 214.299HDFC Top 200 Fund - Growth Option NAV as at September 28, 2012 ` 214.299HDFC Top 200 Fund - Growth Option NAV as at September 28, 2012 ` 214.299
^ Past performance may or may not be sustained in the future.Returns greater than 1 year period are compounded annualised (CAGR). # Benchmark of the Scheme. ## Additional Benchmark of the Scheme. N.A : Not Available . $$ All dividends declared prior to the splitting of the Scheme into Dividend & Growth Options are assumed to be reinvested in the units of the Scheme at the then prevaling NAV(ex-Dividend NAV).@shows the current value of ` 10,000/-invested at the beginning of a given period. Performance of dividend option under the schemes for the investors would be net of distribution tax applicable.
16
Date Period
NAV
Per
Unit (`)
Scheme
Returns
(%) ^ $$
BSE 200
(%) #
SENSEX
(%) ##
Scheme
(`)
BSE 200
(`)#
SENSEX
(`) ##
28-Sep-11 Last 1 Year 188.418 13.74 13.48 14.09 11,374 11,348 11,409 Period
Scheme
^ $$ BSE 200 # Sensex ##
28-Sep-10 Last 2 Years 225.822 -2.58 -4.73 -3.39 9,490 9,075 9,332 Sep 28, 11 to Sep 28, 12 13.74 13.48 14.09
25-Sep-09 Last 3 Years 167.979 8.42 3.99 3.96 12,757 11,251 11,240 Sep 28, 10 to Sep 28, 11 -16.56 -20.03 -18.20
11-Oct-96 Since Inception 10.000 22.66 13.31 11.78 261,295 73,595 59,281 Sep 25, 09 to Sep 28, 10 34.43 23.97 20.44
Value of Investment of `10,000@
B. Discrete 12 Month Return (%)
A. Cumulative Performance
HDFC Top 200 Fund - Growth Option NAV as at September 28, 2012 ` 214.299HDFC Top 200 Fund - Growth Option NAV as at September 28, 2012 ` 214.299HDFC Top 200 Fund - Growth Option NAV as at September 28, 2012 ` 214.299HDFC Top 200 Fund - Growth Option NAV as at September 28, 2012 ` 214.299
SCHEME PERFORMANCE SUMMARYOf other schemes managed by Prashant Jain
The scheme is co-managed by Prashant Jain and Srinivas Rao Ravuri
Date Period
NAV
Per
Unit (`)
Scheme
Returns
(%) ^
S & P CNX
500 (%) #
S & P CNX
NIFTY (%)
##
Scheme
(`)
S & P CNX
500 (`)#
S & P CNX
NIFTY (`)
##
28-Sep-11 Last 1 Year 10.009 5.60 12.96 15.31 10,561 11,296 11,531 Period
Scheme
^
S & P CNX
500 #
S & P CNX
NIFTY ##
28-Sep-10 Last 2 Years 13.639 -11.95 -4.70 -2.74 7,750 9,080 9,459 Sep 28, 11 to Sep 28, 12 5.60 12.96 15.31
25-Sep-09 Last 3 Years 10.254 1.01 3.67 4.75 10,308 11,146 11,501 Sep 28, 10 to Sep 28, 11 -26.61 -19.62 -17.97
10-Mar-08 Since Inception 10.000 1.22 3.05 3.86 10,570 11,468 11,881 Sep 25, 09 to Sep 28, 10 33.01 22.75 21.59
HDFC INFRASTRUCTURE FUND - Growth Option NAV as at September 28, 2012 ` 10.570HDFC INFRASTRUCTURE FUND - Growth Option NAV as at September 28, 2012 ` 10.570HDFC INFRASTRUCTURE FUND - Growth Option NAV as at September 28, 2012 ` 10.570HDFC INFRASTRUCTURE FUND - Growth Option NAV as at September 28, 2012 ` 10.570
Value of Investment of `10,000@
B. Discrete 12 Month Return (%)
A. Cumulative Performance
^ Past performance may or may not be sustained in the future.Returns greater than 1 year period are compounded annualised (CAGR).# Benchmark of the Scheme. ## Additional Benchmark of the Scheme
@shows the current value of ` 10,000/- invested at the beginning of a given period.
Performance of dividend option under the schemes for the investors would be net of distribution tax applicable.** Scheme performance may not strictly be comparable with that of its Additional Benchmark in view of hybrid nature of the scheme where a portion of scheme’s investments are made in equity instruments.
The scheme is co-managed by Prashant Jain (Equities) and Shobhit Mehrotra (Debt).
17
Date Period
NAV
Per
Unit (`)
Scheme
Returns
(%) ^ **
Crisil MIP
Blended
Index (%) #
Crisil 10
Year Gilt
Index (%)
##
Scheme
(`)
Crisil MIP
Blended
Index (`)#
Crisil 10
Year Gilt
Index (`)
##
28-Sep-11 Last 1 Year 23.1435 10.47 10.51 7.37 11,047 11,051 10,737 Period
Scheme
^ **
Crisil MIP
Blended
Index #
Crisil 10
Year Gilt
Index ##
28-Sep-10 Last 2 Years 22.8135 5.85 6.17 5.61 11,206 11,275 11,155 Sep 28, 11 to Sep 28, 12 10.47 10.51 7.37
25-Sep-09 Last 3 Years 19.9810 8.53 6.74 4.98 12,795 12,170 11,575 Sep 28, 10 to Sep 28, 11 1.45 2.02 3.89
26-Dec-03 Since Inception 10.0000 11.30 7.10 4.36 25,566 18,239 14,537 Sep 25, 09 to Sep 28, 10 14.18 7.94 3.76
Value of Investment of `10,000@
B. Discrete 12 Month Return (%)
A. Cumulative Performance
HDFC MF MIP LONG TERM PLAN - Growth Option NAV as at September 28, 2012 ` 25.5658HDFC MF MIP LONG TERM PLAN - Growth Option NAV as at September 28, 2012 ` 25.5658HDFC MF MIP LONG TERM PLAN - Growth Option NAV as at September 28, 2012 ` 25.5658HDFC MF MIP LONG TERM PLAN - Growth Option NAV as at September 28, 2012 ` 25.5658
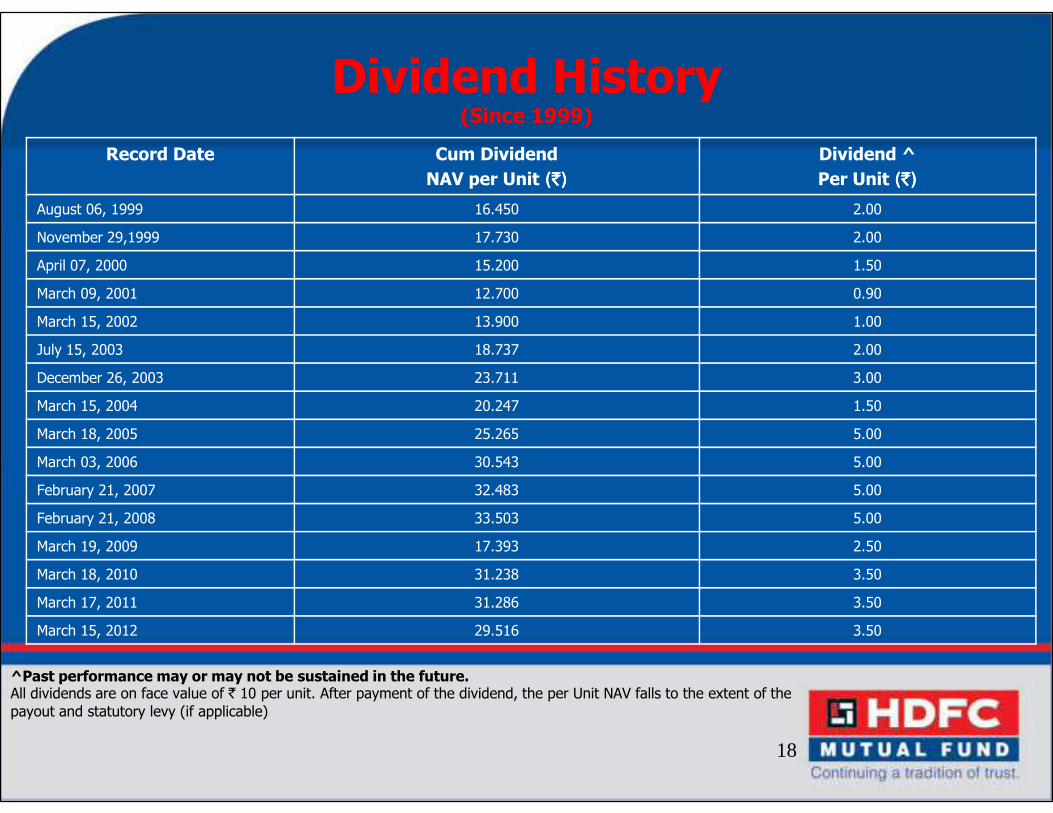
Dividend History(Since 1999)
Record Date Cum Dividend
NAV per Unit (`)(`)(`)(`)
Dividend ^
Per Unit (`)(`)(`)(`)
August 06, 1999 16.450 2.00
November 29,1999 17.730 2.00
April 07, 2000 15.200 1.50
March 09, 2001 12.700 0.90
March 15, 2002 13.900 1.00
July 15, 2003 18.737 2.00
December 26, 2003 23.711 3.00
March 15, 2004 20.247 1.50
^Past performance may or may not be sustained in the future.All dividends are on face value of ` 10 per unit. After payment of the dividend, the per Unit NAV falls to the extent of the
payout and statutory levy (if applicable)
March 15, 2004 20.247 1.50
March 18, 2005 25.265 5.00
March 03, 2006 30.543 5.00
February 21, 2007 32.483 5.00
February 21, 2008 33.503 5.00
March 19, 2009 17.393 2.50
March 18, 2010 31.238 3.50
March 17, 2011 31.286 3.50
March 15, 2012 29.516 3.50
18
Fund Suitability
19
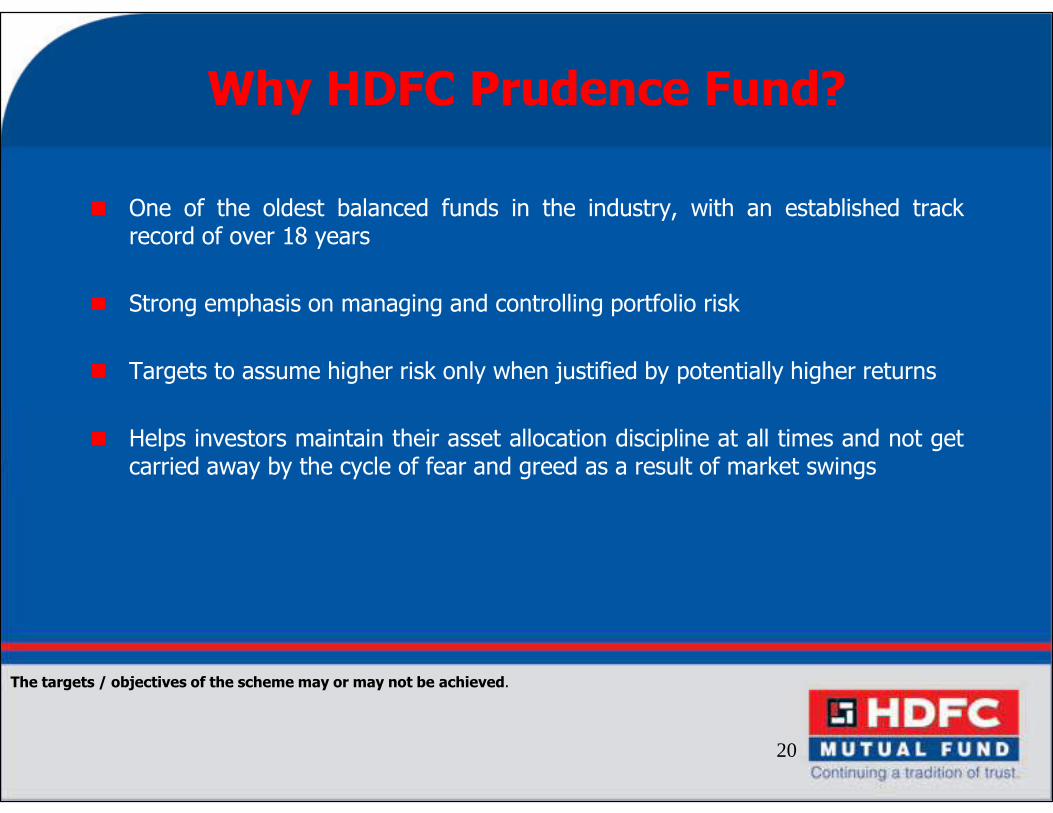
Why HDFC Prudence Fund?
One of the oldest balanced funds in the industry, with an established trackrecord of over 18 years
Strong emphasis on managing and controlling portfolio risk
Targets to assume higher risk only when justified by potentially higher returns
Helps investors maintain their asset allocation discipline at all times and not getcarried away by the cycle of fear and greed as a result of market swings
The targets / objectives of the scheme may or may not be achieved.
20
HDFC Prudence Fund is suitable for investors:
As a building block for their mutual fund portfolio
Looking for a well diversified portfolio across asset classes
Desiring a mixture of income and capital appreciation
Looking to maintain their asset allocation in a convenient, tax efficient andLooking to maintain their asset allocation in a convenient, tax efficient andtimely manner
21
DISCLAIMER: This presentation has been prepared by HDFC Asset Management Company Limited (“HDFC AMC”) on the basis of internal data, publiclyavailable information and other sources believed to be reliable. The information contained in this document is for general purposes only. The document isgiven in summary form and does not purport to be complete. The document does not have regard to specific investment objectives, financial situationand the particular needs of any specific person who may receive this document. The information/ data herein alone are not sufficient and should not beused for the development or implementation of an investment strategy. The same should not be construed as investment advice to any party. NeitherHDFC AMC and HDFC Mutual Fund (the Fund) nor any person connected with them, accepts any liability arising from the use of this document. Therecipient(s) before acting on any information herein should make his/her/their own investigation and seek appropriate professional advice and shall alonebe fully responsible / liable for any decision taken on the basis of information contained herein. This document has been made available in confidenceand may not be reproduced or disclosed to third parties or made public in any way without the written permission of HDFC AMC.
MUTUAL FUND INVESTMENTS ARE SUBJECT TO MARKET RISKS, READ ALL SCHEME RELATED DOCUMENTS CAREFULLY.
Disclaimer & Risk Factors
22

Thank You
23


