PRESS RELEASE 3000 N. Sam Houston Pkwy E., Houston, TX 77032 Phone: 281-871-2699 FOR IMMEDIATE RELEASE HALLIBURTON ANNOUNCES THIRD QUARTER 2019 RESULTS • Reported net income of $0.34 per diluted share • Cash flows from operating activities of $871 million and free cash flow of $526 million HOUSTON – October 21, 2019 – Halliburton Company (NYSE:HAL) announced today net income of $295 million, or $0.34 per diluted share, for the third quarter of 2019. This compares to reported net income for the second quarter of 2019 of $75 million, or $0.09 per diluted share, and adjusted net income for the second quarter of 2019 of $303 million, or $0.35 per diluted share, excluding impairments and other charges. Operating income was $536 million during the third quarter of 2019, compared to reported operating income of $303 million and adjusted operating income of $550 million for the second quarter of 2019. “Our organization executed effectively in the third quarter. We managed the market dynamics and delivered our financial results as per expectations,” commented Jeff Miller, Chairman, President and CEO. “Total company revenue was $5.6 billion and operating income was $536 million, representing decreases of 6% and 3%, respectively, compared to revenue and adjusted operating income in the second quarter of 2019. “International revenue, which was flat sequentially, was up 10% year to date and we remain confident that we will achieve high single-digit international growth for all of 2019. International growth continues across multiple regions, benefitting both our Drilling and Evaluation and Completion and Production divisions. “Our North America revenue decreased 11% sequentially driven by customer activity declines and the execution of our new playbook. I am proud of how our team performed in this challenging market. We are successfully implementing our new strategy and are focused on taking the right actions to deliver returns and cash flow for our shareholders. “As the international recovery continues and the North American market matures, our strategy is allowing us to thrive in this dynamic environment, generate strong free cash flow and produce industry-leading returns,” concluded Miller.
Transcript
PRESS RELEASE
3000 N. Sam Houston Pkwy E., Houston, TX 77032 Phone: 281-871-2699
FOR IMMEDIATE RELEASE
HALLIBURTON ANNOUNCES THIRD QUARTER 2019 RESULTS
• Reported net income of $0.34 per diluted share
• Cash flows from operating activities of $871 million and free cash flow of
$526 million
HOUSTON – October 21, 2019 – Halliburton Company (NYSE:HAL) announced today net income of $295 million, or $0.34 per diluted share, for the third quarter of 2019. This compares to reported net income for the second quarter of 2019 of $75 million, or $0.09 per diluted share, and adjusted net income for the second quarter of 2019 of $303 million, or $0.35 per diluted share, excluding impairments and other charges. Operating income was $536 million during the third quarter of 2019, compared to reported operating income of $303 million and adjusted operating income of $550 million for the second quarter of 2019.
“Our organization executed effectively in the third quarter. We managed the market dynamics and delivered our financial results as per expectations,” commented Jeff Miller, Chairman, President and CEO. “Total company revenue was $5.6 billion and operating income was $536 million, representing decreases of 6% and 3%, respectively, compared to revenue and adjusted operating income in the second quarter of 2019. “International revenue, which was flat sequentially, was up 10% year to date and we remain confident that we will achieve high single-digit international growth for all of 2019. International growth continues across multiple regions, benefitting both our Drilling and Evaluation and Completion and Production divisions. “Our North America revenue decreased 11% sequentially driven by customer activity declines and the execution of our new playbook. I am proud of how our team performed in this challenging market. We are successfully implementing our new strategy and are focused on taking the right actions to deliver returns and cash flow for our shareholders. “As the international recovery continues and the North American market matures, our strategy is allowing us to thrive in this dynamic environment, generate strong free cash flow and produce industry-leading returns,” concluded Miller.
Halliburton/Page 2
Operating Segments
Completion and Production
Completion and Production revenue in the third quarter of 2019 was $3.5 billion, a decrease of $299 million, or 8%, when compared to the second quarter of 2019, while operating income was $446 million, a decrease of $24 million, or 5%. These results were primarily driven by lower pressure pumping activity and pricing in North America land, coupled with decreased completion tool sales in Latin America and reduced stimulation activity in Middle East/Asia. These declines were partially offset by increased cementing activity in the Eastern Hemisphere, improved completion tool sales in Europe/Africa/CIS, and higher stimulation activity in Latin America.
Drilling and Evaluation
Drilling and Evaluation revenue in the third quarter of 2019 was $2.0 billion, a decrease of $81 million, or 4%, when compared to the second quarter of 2019, while operating income was $150 million, an increase of $5 million, or 3%. These results were driven by reduced drilling and wireline activity in North America and lower project management activity in Middle East/Asia. These declines were partially offset by higher drilling activity in the Eastern Hemisphere, fluids activity in Latin America and higher testing and software sales globally resulting in better overall margins.
Geographic Regions
North America
North America revenue in the third quarter of 2019 was $2.9 billion, an 11% decrease when compared to the second quarter of 2019, primarily associated with lower activity and pricing in pressure pumping and well construction services in North America land.
International
International revenue in the third quarter of 2019 was $2.6 billion, essentially flat when compared to the second quarter of 2019, with increased cementing activity in the Eastern Hemisphere and activity increases in Argentina offset by lower project management and stimulation activity in Middle East/Asia.
Latin America revenue in the third quarter of 2019 was $608 million, a 6% increase sequentially, resulting primarily from higher activity in multiple product service lines in Argentina, increased testing activity and artificial lift sales across the region and improved fluids activity in Mexico. These improvements were partially offset by lower completion tool sales in Brazil.
Europe/Africa/CIS revenue in the third quarter of 2019 was $831 million, essentially flat when compared to the second quarter of 2019. Higher activity across multiple product service lines in Russia, Caspian and the North Sea offset lower activity in West Africa.
Middle East/Asia revenue in the third quarter of 2019 was $1.2 billion, a 4% decrease sequentially, largely resulting from reduced project management and stimulation activity
Halliburton/Page 3
across the region. These declines were partially offset by increased activity in multiple product service lines in Indonesia.
Selective Technology & Highlights
• Halliburton announced the execution of an integrated services contract with Petrobras for pre-salt development in the Santos Basin. The thirty-month contract will provide drilling and completion services to drive greater efficiency by applying pre-salt expertise and integrating multiple product offerings.
• Woodside Energy (Senegal) BV awarded Halliburton nine contracts, conditional on the final project FID, for drilling and completion services for SNE Field Development Phase 1 offshore Senegal. Halliburton will provide drilling, logging, cementing, lower completions, e-line/slick line, coiled tubing and well testing services for the drilling campaign, which is due to start in late 2020 or early 2021.
• Halliburton introduced 3D reservoir mapping, a new logging-while-drilling (LWD) capability that provides a detailed representation of subsurface structures to improve well placement in complex reservoirs.
• Ten new DecisionSpace® 365 E&P cloud-native applications were released, leveraging advances in digital technology to help operators reduce exploration risk, improve reservoir characterization and boost drilling efficiency. DecisionSpace® 365
is an integrated suite of E&P cloud applications that empowers customers to be creative and realize their business objectives.
• Halliburton unveiled the Commander™ Full Bore Cement Head, a product that enables rotation and reciprocation of 4½ - 6 inch production strings to help increase reliability and reduce risk during the well cementing process. Advanced wireless functionality and faster rig-up time help increase efficiency and improve safety for land-based cement jobs, particularly in unconventional formations.
• QuickPulse™ Automated Directional Gamma Service, a new measurement while drilling (MWD) technology, was launched, providing quick and reliable downhole information at extended depths to deliver wells faster. This capability helps operators drill longer laterals, make improved geosteering decisions and reduce well time to maximize their asset value.
• Halliburton announced an asset acquisition of electromechanical downhole cutting tools and tubing punches from Westerton (UK) Ltd. These services provide operators with a safe and reliable alternative to traditional pipe recovery and intervention across the well lifecycle from exploration to abandonment. This new technology complements Halliburton's extensive well intervention portfolio, helping operators reduce the cost to construct new wells and extend the life of old wells.
Halliburton/Page 4
About Halliburton
Founded in 1919, Halliburton celebrates its 100 years of service as one of the world's largest providers of products and services to the energy industry. With approximately 60,000 employees, representing 140 nationalities in more than 80 countries, the company helps its customers maximize value throughout the lifecycle of the reservoir – from locating hydrocarbons and managing geological data, to drilling and formation evaluation, well construction and completion, and optimizing production throughout the life of the asset. Visit the company’s website at www.halliburton.com. Connect with Halliburton on Facebook, Twitter, LinkedIn, Instagram and YouTube.
NOTE: The statements in this press release that are not historical statements, including statements regarding future financial performance, are forward-looking statements within the meaning of the federal securities laws. These statements are subject to numerous risks and uncertainties, many of which are beyond the company's control, which could cause actual results to differ materially from the results expressed or implied by the statements. These risks and uncertainties include, but are not limited to: the continuation or suspension of our stock repurchase program, the amount, the timing and the trading prices of Halliburton common stock, and the availability and alternative uses of cash; changes in the demand for or price of oil and/or natural gas; potential catastrophic events related to our operations, and related indemnification and insurance matters; protection of intellectual property rights and against cyber-attacks; compliance with environmental laws; changes in government regulations and regulatory requirements, particularly those related to oil and natural gas exploration, radioactive sources, explosives, chemicals, hydraulic fracturing services, and climate-related initiatives; the impact of federal tax reform, compliance with laws related to income taxes and assumptions regarding the generation of future taxable income; risks of international operations, including risks relating to unsettled political conditions, war, the effects of terrorism, foreign exchange rates and controls, international trade and regulatory controls and sanctions, and doing business with national oil companies; weather-related issues, including the effects of hurricanes and tropical storms; changes in capital spending by customers; delays or failures by customers to make payments owed to us; execution of long-term, fixed-price contracts; structural changes and infrastructure issues in the oil and natural gas industry; maintaining a highly skilled workforce; availability and cost of raw materials; agreement with respect to and completion of potential acquisitions and integration and success of acquired businesses and operations of joint ventures. Halliburton's Form 10-K for the year ended December 31, 2018, Form 10-Q for the quarter ended June 30, 2019, recent Current Reports on Form 8-K and other Securities and Exchange Commission filings discuss some of the important risk factors identified that may affect Halliburton's business, results of operations, and financial condition. Halliburton undertakes no obligation to revise or update publicly any forward-looking statements for any reason.
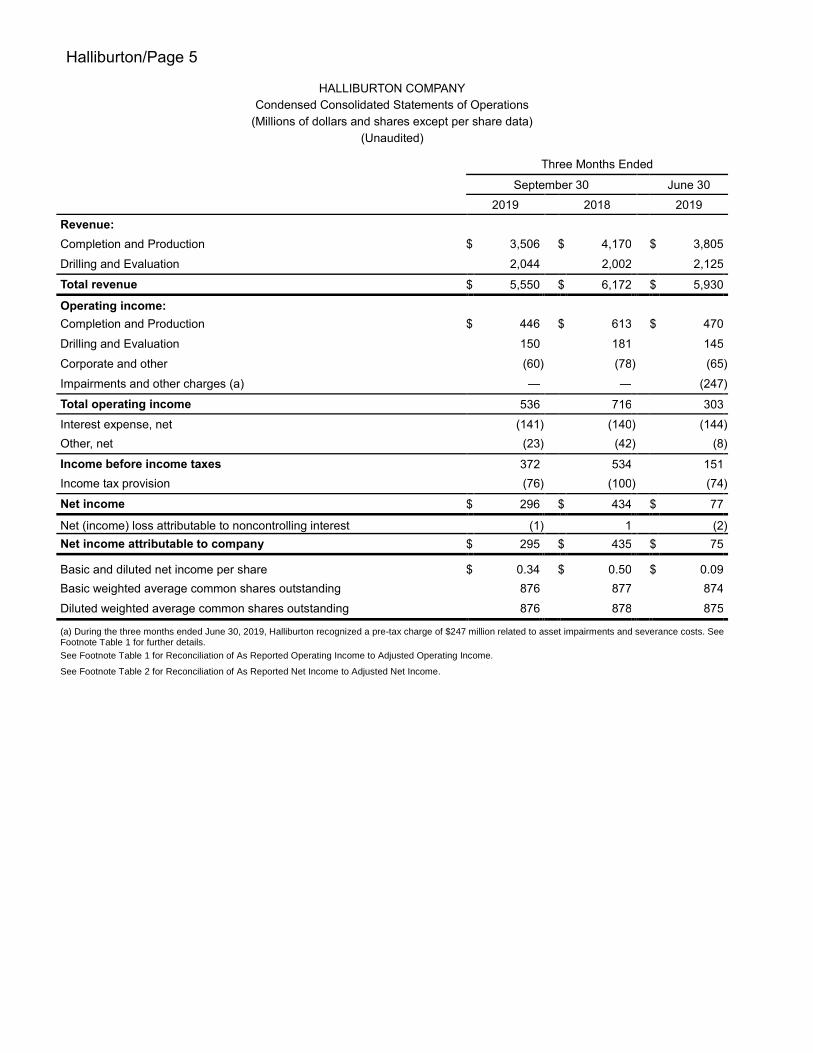
(Millions of dollars and shares except per share data)
(Unaudited)
Three Months Ended
September 30 June 30
2019 2018 2019
Revenue:
Completion and Production $ 3,506 $ 4,170 $ 3,805
Drilling and Evaluation 2,044 2,002 2,125
Total revenue $ 5,550 $ 6,172 $ 5,930
Operating income:
Completion and Production $ 446 $ 613 $ 470
Drilling and Evaluation 150 181 145
Corporate and other (60 ) (78 ) (65 )
Impairments and other charges (a) — — (247 )
Total operating income 536 716 303
Interest expense, net (141 ) (140 ) (144 )
Other, net (23 ) (42 ) (8 )
Income before income taxes 372 534 151
Income tax provision (76 ) (100 ) (74 )
Net income $ 296 $ 434 $ 77
Net (income) loss attributable to noncontrolling interest (1 ) 1 (2 )
Net income attributable to company $ 295 $ 435 $ 75
Basic and diluted net income per share $ 0.34 $ 0.50 $ 0.09
Basic weighted average common shares outstanding 876 877 874
Diluted weighted average common shares outstanding 876 878 875
(a) During the three months ended June 30, 2019, Halliburton recognized a pre-tax charge of $247 million related to asset impairments and severance costs. See Footnote Table 1 for further details.
See Footnote Table 1 for Reconciliation of As Reported Operating Income to Adjusted Operating Income.
See Footnote Table 2 for Reconciliation of As Reported Net Income to Adjusted Net Income.
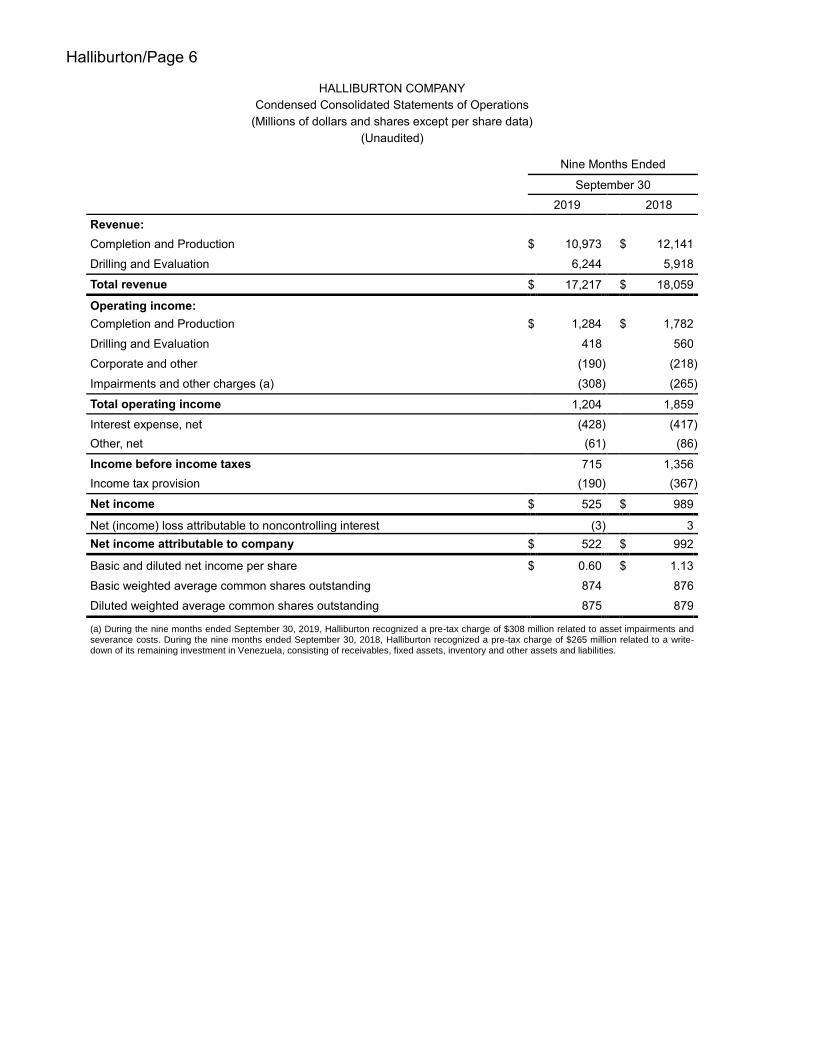
Halliburton/Page 6
HALLIBURTON COMPANY
Condensed Consolidated Statements of Operations
(Millions of dollars and shares except per share data)
(Unaudited)
Nine Months Ended
September 30
2019 2018
Revenue:
Completion and Production $ 10,973 $ 12,141
Drilling and Evaluation 6,244 5,918
Total revenue $ 17,217 $ 18,059
Operating income:
Completion and Production $ 1,284 $ 1,782
Drilling and Evaluation 418 560
Corporate and other (190 ) (218 )
Impairments and other charges (a) (308 ) (265 )
Total operating income 1,204 1,859
Interest expense, net (428 ) (417 )
Other, net (61 ) (86 )
Income before income taxes 715 1,356
Income tax provision (190 ) (367 )
Net income $ 525 $ 989
Net (income) loss attributable to noncontrolling interest (3 ) 3
Net income attributable to company $ 522 $ 992
Basic and diluted net income per share $ 0.60 $ 1.13
Basic weighted average common shares outstanding 874 876
Diluted weighted average common shares outstanding 875 879
(a) During the nine months ended September 30, 2019, Halliburton recognized a pre-tax charge of $308 million related to asset impairments and severance costs. During the nine months ended September 30, 2018, Halliburton recognized a pre-tax charge of $265 million related to a write-down of its remaining investment in Venezuela, consisting of receivables, fixed assets, inventory and other assets and liabilities.
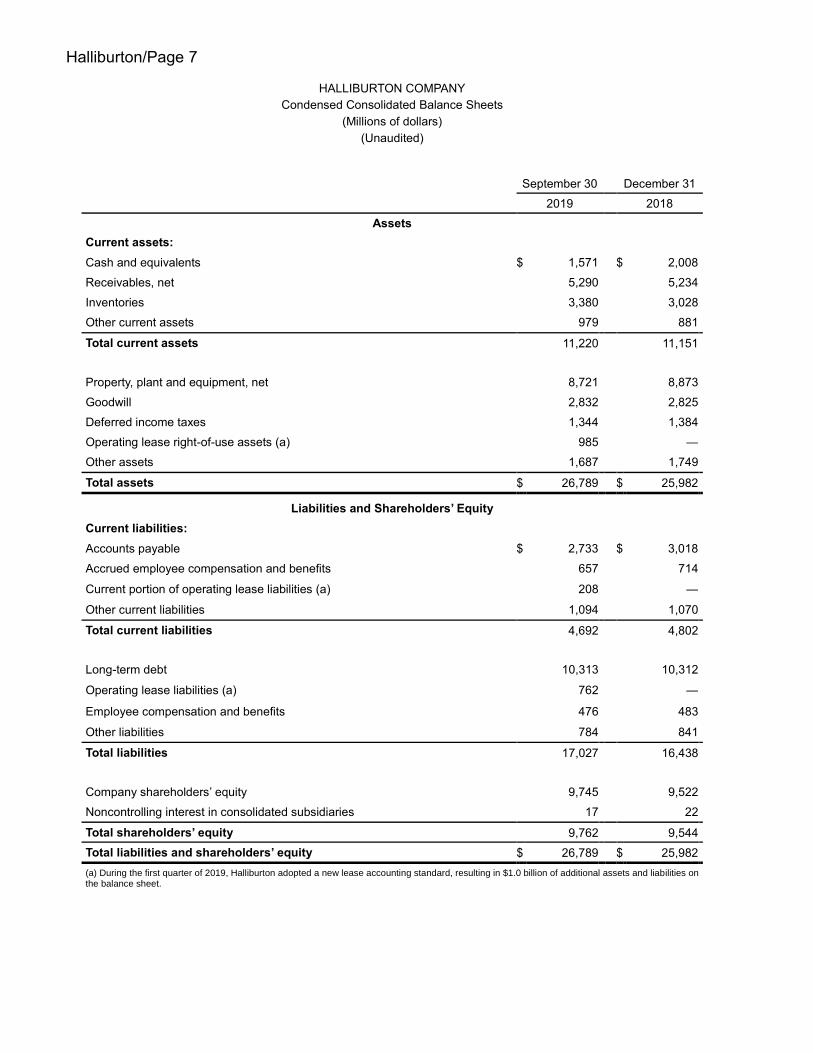
Halliburton/Page 7
HALLIBURTON COMPANY
Condensed Consolidated Balance Sheets
(Millions of dollars)
(Unaudited)
September 30 December 31
2019 2018
Assets
Current assets:
Cash and equivalents $ 1,571 $ 2,008
Receivables, net 5,290 5,234
Inventories 3,380 3,028
Other current assets 979 881
Total current assets 11,220 11,151
Property, plant and equipment, net 8,721 8,873
Goodwill 2,832 2,825
Deferred income taxes 1,344 1,384
Operating lease right-of-use assets (a) 985 —
Other assets 1,687 1,749
Total assets $ 26,789 $ 25,982
Liabilities and Shareholders’ Equity
Current liabilities:
Accounts payable $ 2,733 $ 3,018
Accrued employee compensation and benefits 657 714
Current portion of operating lease liabilities (a) 208 —
Other current liabilities 1,094 1,070
Total current liabilities 4,692 4,802
Long-term debt 10,313 10,312
Operating lease liabilities (a) 762 —
Employee compensation and benefits 476 483
Other liabilities 784 841
Total liabilities 17,027 16,438
Company shareholders’ equity 9,745 9,522
Noncontrolling interest in consolidated subsidiaries 17 22
Total shareholders’ equity 9,762 9,544
Total liabilities and shareholders’ equity $ 26,789 $ 25,982
(a) During the first quarter of 2019, Halliburton adopted a new lease accounting standard, resulting in $1.0 billion of additional assets and liabilities on the balance sheet.
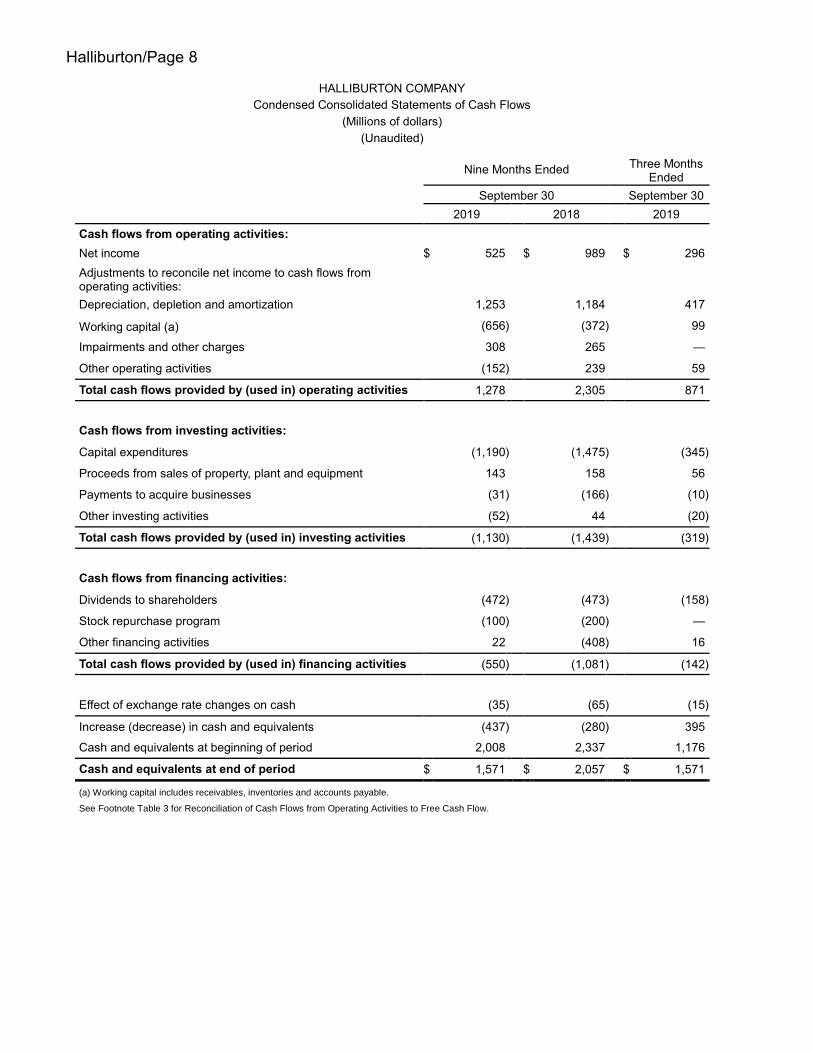
Halliburton/Page 8
HALLIBURTON COMPANY
Condensed Consolidated Statements of Cash Flows
(Millions of dollars)
(Unaudited)
Nine Months Ended Three Months Ended
September 30 September 30
2019 2018 2019
Cash flows from operating activities:
Net income $ 525 $ 989 $ 296
Adjustments to reconcile net income to cash flows from operating activities:
Depreciation, depletion and amortization 1,253 1,184 417
Working capital (a) (656 ) (372 ) 99
Impairments and other charges 308 265 —
Other operating activities (152 ) 239 59
Total cash flows provided by (used in) operating activities 1,278 2,305 871
Cash flows from investing activities:
Capital expenditures (1,190 ) (1,475 ) (345 )
Proceeds from sales of property, plant and equipment 143 158 56
Payments to acquire businesses (31 ) (166 ) (10 )
Other investing activities (52 ) 44 (20 )
Total cash flows provided by (used in) investing activities (1,130 ) (1,439 ) (319 )
Cash flows from financing activities:
Dividends to shareholders (472 ) (473 ) (158 )
Stock repurchase program (100 ) (200 ) —
Other financing activities 22 (408 ) 16
Total cash flows provided by (used in) financing activities (550 ) (1,081 ) (142 )
Effect of exchange rate changes on cash (35 ) (65 ) (15 )
Increase (decrease) in cash and equivalents (437 ) (280 ) 395
Cash and equivalents at beginning of period 2,008 2,337 1,176
Cash and equivalents at end of period $ 1,571 $ 2,057 $ 1,571
(a) Working capital includes receivables, inventories and accounts payable.
See Footnote Table 3 for Reconciliation of Cash Flows from Operating Activities to Free Cash Flow.
Halliburton/Page 9
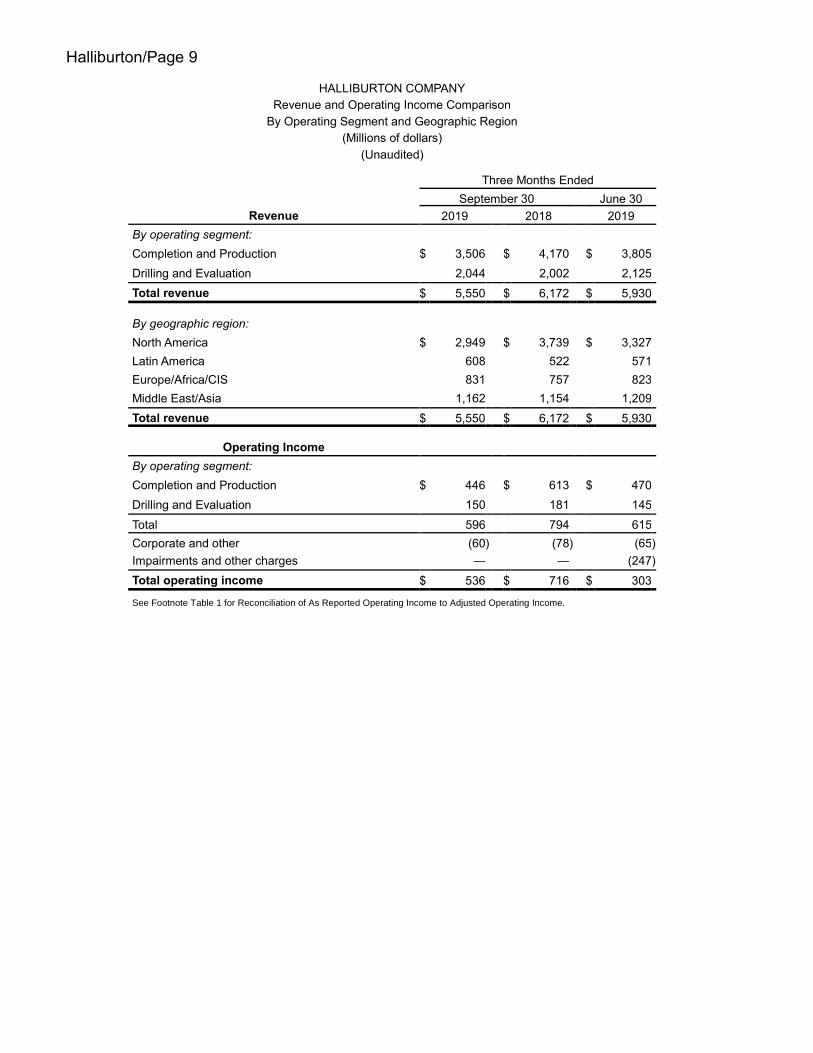
HALLIBURTON COMPANY
Revenue and Operating Income Comparison
By Operating Segment and Geographic Region
(Millions of dollars)
(Unaudited)
Three Months Ended
September 30 June 30
Revenue 2019 2018 2019
By operating segment:
Completion and Production $ 3,506 $ 4,170 $ 3,805
Drilling and Evaluation 2,044 2,002 2,125
Total revenue $ 5,550 $ 6,172 $ 5,930
By geographic region:
North America $ 2,949 $ 3,739 $ 3,327
Latin America 608 522 571
Europe/Africa/CIS 831 757 823
Middle East/Asia 1,162 1,154 1,209
Total revenue $ 5,550 $ 6,172 $ 5,930
Operating Income
By operating segment:
Completion and Production $ 446 $ 613 $ 470
Drilling and Evaluation 150 181 145
Total 596 794 615
Corporate and other (60 ) (78 ) (65 )
Impairments and other charges — — (247 )
Total operating income $ 536 $ 716 $ 303
See Footnote Table 1 for Reconciliation of As Reported Operating Income to Adjusted Operating Income.
Halliburton/Page 10
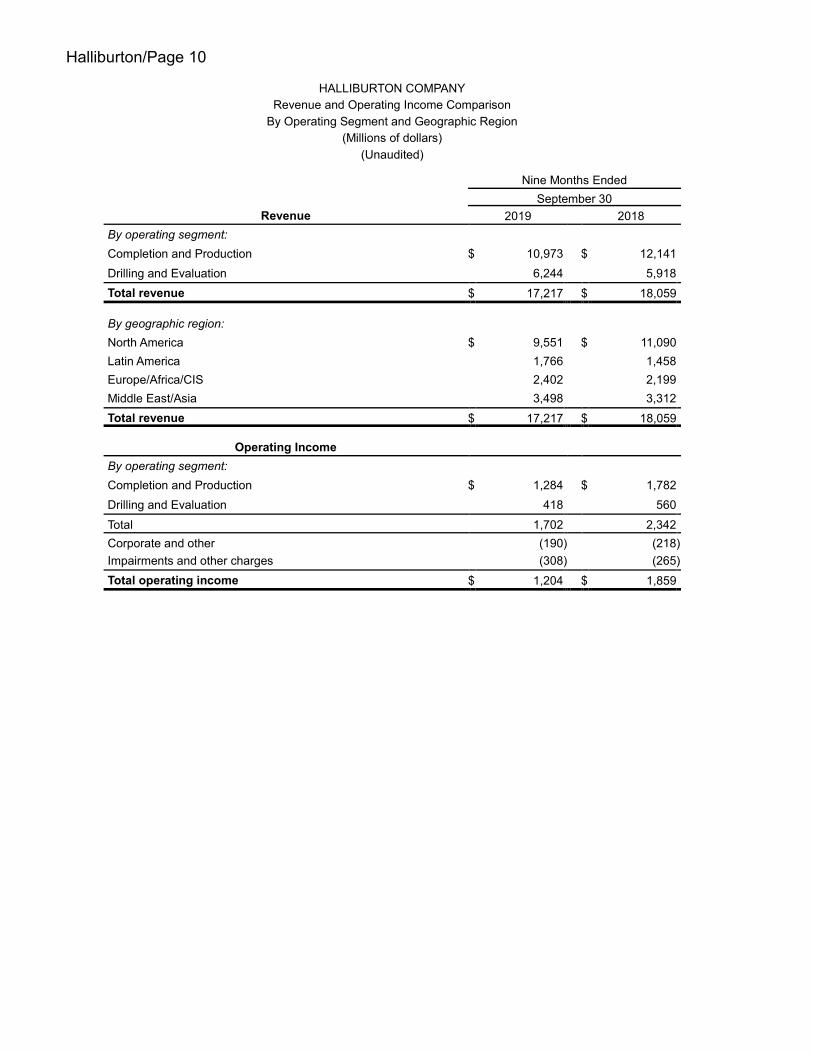
HALLIBURTON COMPANY
Revenue and Operating Income Comparison
By Operating Segment and Geographic Region
(Millions of dollars)
(Unaudited)
Nine Months Ended
September 30
Revenue 2019 2018
By operating segment:
Completion and Production $ 10,973 $ 12,141
Drilling and Evaluation 6,244 5,918
Total revenue $ 17,217 $ 18,059
By geographic region:
North America $ 9,551 $ 11,090
Latin America 1,766 1,458
Europe/Africa/CIS 2,402 2,199
Middle East/Asia 3,498 3,312
Total revenue $ 17,217 $ 18,059
Operating Income
By operating segment:
Completion and Production $ 1,284 $ 1,782
Drilling and Evaluation 418 560
Total 1,702 2,342
Corporate and other (190 ) (218 )
Impairments and other charges (308 ) (265 )
Total operating income $ 1,204 $ 1,859
Halliburton/Page 11
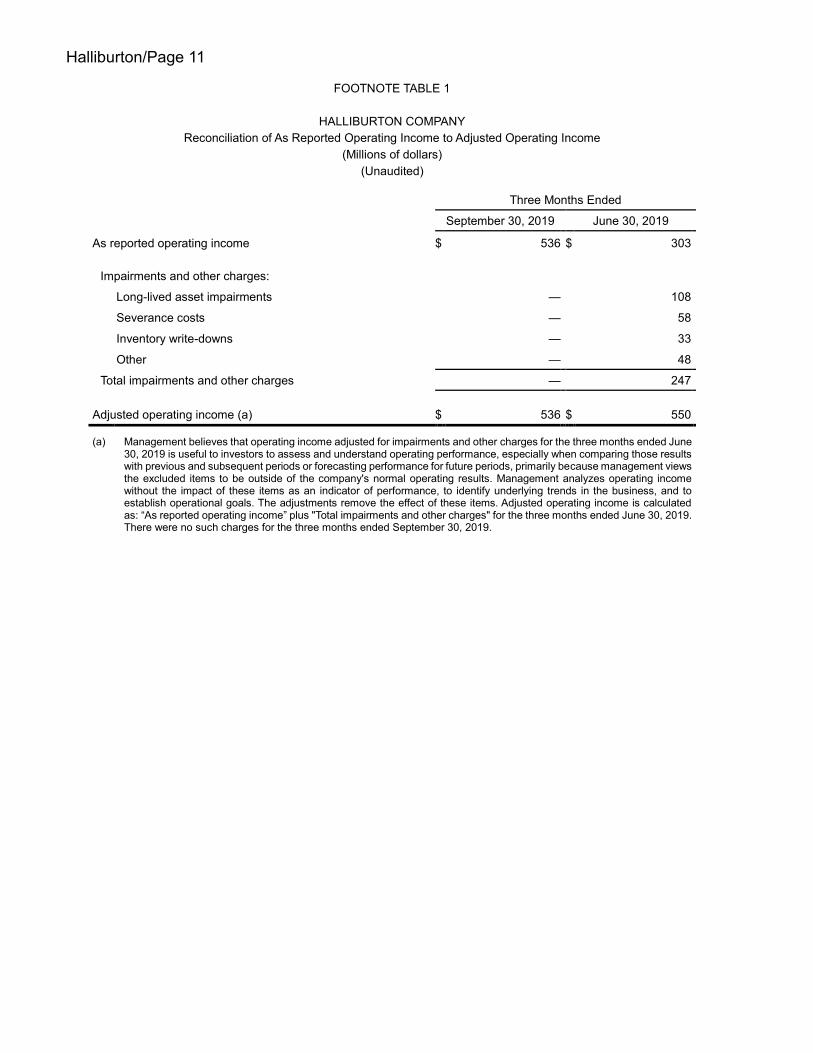
FOOTNOTE TABLE 1
HALLIBURTON COMPANY
Reconciliation of As Reported Operating Income to Adjusted Operating Income
(Millions of dollars)
(Unaudited)
Three Months Ended
September 30, 2019 June 30, 2019
As reported operating income $ 536 $ 303
Impairments and other charges:
Long-lived asset impairments — 108
Severance costs — 58
Inventory write-downs — 33
Other — 48
Total impairments and other charges — 247
Adjusted operating income (a) $ 536 $ 550
(a) Management believes that operating income adjusted for impairments and other charges for the three months ended June 30, 2019 is useful to investors to assess and understand operating performance, especially when comparing those results with previous and subsequent periods or forecasting performance for future periods, primarily because management views the excluded items to be outside of the company's normal operating results. Management analyzes operating income without the impact of these items as an indicator of performance, to identify underlying trends in the business, and to establish operational goals. The adjustments remove the effect of these items. Adjusted operating income is calculated as: “As reported operating income” plus "Total impairments and other charges" for the three months ended June 30, 2019. There were no such charges for the three months ended September 30, 2019.
Halliburton/Page 12
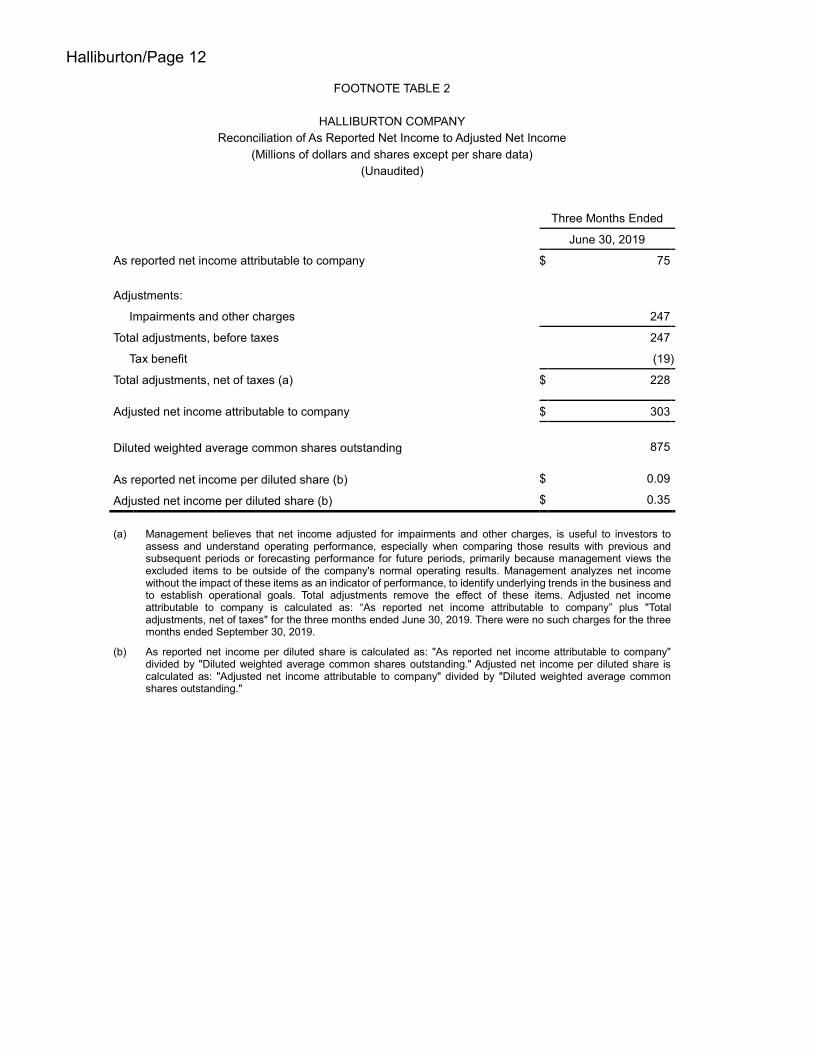
FOOTNOTE TABLE 2
HALLIBURTON COMPANY
Reconciliation of As Reported Net Income to Adjusted Net Income
(Millions of dollars and shares except per share data)
(Unaudited)
Three Months Ended
June 30, 2019
As reported net income attributable to company $ 75
Adjustments:
Impairments and other charges 247
Total adjustments, before taxes 247
Tax benefit (19 )
Total adjustments, net of taxes (a) $ 228
Adjusted net income attributable to company $ 303
Diluted weighted average common shares outstanding 875
As reported net income per diluted share (b) $ 0.09
Adjusted net income per diluted share (b) $ 0.35
(a) Management believes that net income adjusted for impairments and other charges, is useful to investors to
assess and understand operating performance, especially when comparing those results with previous and subsequent periods or forecasting performance for future periods, primarily because management views the excluded items to be outside of the company's normal operating results. Management analyzes net income without the impact of these items as an indicator of performance, to identify underlying trends in the business and to establish operational goals. Total adjustments remove the effect of these items. Adjusted net income attributable to company is calculated as: “As reported net income attributable to company” plus "Total adjustments, net of taxes" for the three months ended June 30, 2019. There were no such charges for the three months ended September 30, 2019.
(b) As reported net income per diluted share is calculated as: "As reported net income attributable to company" divided by "Diluted weighted average common shares outstanding." Adjusted net income per diluted share is calculated as: "Adjusted net income attributable to company" divided by "Diluted weighted average common shares outstanding."
Halliburton/Page 13
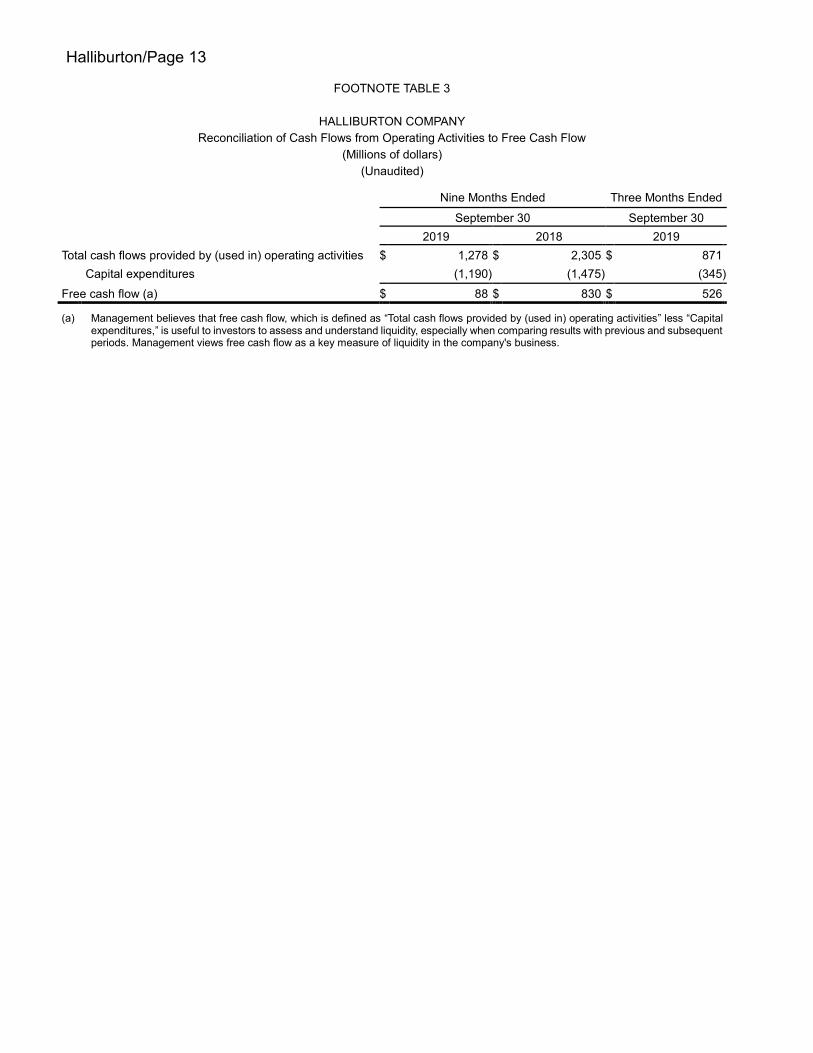
FOOTNOTE TABLE 3
HALLIBURTON COMPANY
Reconciliation of Cash Flows from Operating Activities to Free Cash Flow
(Millions of dollars)
(Unaudited)
Nine Months Ended Three Months Ended
September 30 September 30
2019 2018 2019
Total cash flows provided by (used in) operating activities $ 1,278 $ 2,305 $ 871
Capital expenditures (1,190 ) (1,475 ) (345 )
Free cash flow (a) $ 88 $ 830 $ 526
(a) Management believes that free cash flow, which is defined as “Total cash flows provided by (used in) operating activities” less “Capital expenditures,” is useful to investors to assess and understand liquidity, especially when comparing results with previous and subsequent periods. Management views free cash flow as a key measure of liquidity in the company's business.
Halliburton/Page 14
Conference Call Details
Halliburton Company (NYSE: HAL) will host a conference call on Monday, October 21, 2019, to discuss its third quarter 2019 financial results. The call will begin at 8:00 AM Central Time (9:00 AM Eastern Time). Please visit the website to listen to the call via live webcast. You may also participate in the call by dialing (888) 393-0263 within North America or +1 (973) 453-2259 outside of North America. A passcode is not required. Attendees should log in to the webcast or dial in approximately 15 minutes prior to the start of the call.
A replay of the conference call will be available on Halliburton’s website until October 28, 2019. Also, a replay may be accessed by telephone at (855) 859-2056 within North America or +1 (404) 537-3406 outside of North America, using the passcode 6347766.