1 PRESS RELEASE IGD SIIQ SPA: THE BOARD OF DIRECTORS APPROVES THE DRAFT SEPARATE AND CONSOLIDATED FINANCIAL STATEMENTS, AS WELL AS THE CORPORATE SUSTAINABILITY REPORT, AT 31 DECEMBER 2018 RESULTS AT 31 DECEMBER 2018: Recurring net income (FFO): €79.7 million (+21.4%); Rental income: €151.8 million, +9.2% (LFL Italy +1.3%, Romania +2.9%) Net rental income: €124 million, +10.9% Sales of retailers in Italian malls + 2.2%; financial occupancy Italy 97.2%; Romania 97.1% Further improvement in financial indicators: Loan to Value 45.8%; average cost of debt 2.7% Market value of the portfolio €2,412.2 million (+8.3%); EPRA NNNAV per share: €11.45 (+0.4%) Dividend: the Board of Directors will propose that shareholders approve a dividend of 50 euro cents per share The ninth corporate sustainability report approved Bologna, 26 February 2019. Today, in a meeting chaired by Elio Gasperoni, the Board of Directors of IGD - Immobiliare Grande Distribuzione SIIQ S.p.A. (“IGD” or the “Company”), a major player in Italy’s retail property market and listed on the STAR segment of the Italian Stock Exchange, examined and approved the draft separate and consolidated financial statements at 31 December 2018. “2018 marks both an end and a starting point as we reach the last year of the Business Plan 2016-2018 and embark on the Strategic Plan 2019-2021 approved in November. The results shown in the Annual Report 2018 enabled execution of the Business Plan 2016-2018 which had challenging targets. More in detail, with regard to FFO, once again in 2018 IGD beat the +20% target announced and achieved growth of 21.4%. The operating margins exceeded targets, as did financial management” stated Claudio Albertini, IGD’s Chief Executive Officer. “In an environment of constant change, IGD is proving that it has a structure capable of responding quickly and concretely to new consumption models, giving increasingly more space to services, restaurants, technology and sustainability. All of this, along with the projects presented and approved together with the Strategic Plan, allow us to be confident about continuing along the Group’s growth path over the coming years”
Transcript
1
PRESS RELEASE
IGD SIIQ SPA: THE BOARD OF DIRECTORS APPROVES THE DRAFT SEPARATE AND CONSOLIDATED FINANCIAL
STATEMENTS, AS WELL AS THE CORPORATE SUSTAINABILITY REPORT, AT 31 DECEMBER 2018
RESULTS AT 31 DECEMBER 2018:
Recurring net income (FFO): €79.7 million (+21.4%);
Rental income: €151.8 million, +9.2% (LFL Italy +1.3%, Romania +2.9%)
Net rental income: €124 million, +10.9%
Sales of retailers in Italian malls + 2.2%; financial occupancy Italy 97.2%; Romania 97.1%
Further improvement in financial indicators: Loan to Value 45.8%; average cost of debt 2.7%
Market value of the portfolio €2,412.2 million (+8.3%);
EPRA NNNAV per share: €11.45 (+0.4%)
Dividend: the Board of Directors will propose that shareholders approve a dividend of 50 euro cents per
share
The ninth corporate sustainability report approved
Bologna, 26 February 2019. Today, in a meeting chaired by Elio Gasperoni, the Board of Directors of IGD -
Immobiliare Grande Distribuzione SIIQ S.p.A. (“IGD” or the “Company”), a major player in Italy’s retail
property market and listed on the STAR segment of the Italian Stock Exchange, examined and approved the
draft separate and consolidated financial statements at 31 December 2018.
“2018 marks both an end and a starting point as we reach the last year of the Business Plan 2016-2018 and
embark on the Strategic Plan 2019-2021 approved in November. The results shown in the Annual Report 2018
enabled execution of the Business Plan 2016-2018 which had challenging targets. More in detail, with regard to
FFO, once again in 2018 IGD beat the +20% target announced and achieved growth of 21.4%. The operating
margins exceeded targets, as did financial management” stated Claudio Albertini, IGD’s Chief Executive
Officer. “In an environment of constant change, IGD is proving that it has a structure capable of responding
quickly and concretely to new consumption models, giving increasingly more space to services, restaurants,
technology and sustainability. All of this, along with the projects presented and approved together with the
Strategic Plan, allow us to be confident about continuing along the Group’s growth path over the coming years”
2
OPERATING PERFORMANCE
Sales for retailers in the Group’s Italian malls rose 2.2% (+0.7% excluding the ESP extension inaugurated on 1
June 2017); growth was recorded in the second and fourth quarters. The fourth quarter, in particular, was
boosted by the positive impact of the sales posted during the week of Black Friday (footfalls +3.1%, testimony
to the fact that e-commerce did not have a substitution effect), in addition to a particularly good December
(sales rose +1.6% in the month). In terms of merchandise, Electronics (+8.2%), Services (+23.2%) and
Restaurants (+2.2%) grew across the network. Footfalls were down slightly compared to the prior year.
During the year 184 contracts were signed, 109 renewals and 75 new leases with rents stable (but +1.2%
excluding the only renewal completed in December).
In Romania, the economy continues to perform brilliantly, in terms of consumption and regional retail trends;
this dynamic, along with careful and effective portfolio management fueled a further increase in the occupancy
rate (97.1%) and the upside on renewals (+3.9%).
FINANCIAL – ECONOMIC RESULTS (FFO +21.4%)
Rental income rose 9.2% to €151.8 million explained by:
for around €1.7 million, like-for-like growth (+1.3%) in Italy. Malls (+1.5%) and hypermarkets (+0.9% ) were
up;
for around €10.9 million, higher revenue not like-for-like linked to the opening of the ESP extension on 1
June 2017 and the acquisition of 4 malls and a retail park in April 2018
for around €0.27 million, higher revenue like-for-like in Romania (+2.9%)
Net rental income amounted to €124.0 million, an increase of 10.9% against the same period of the prior
year.
Revenue from services came to €6.3 million and net revenue from services was €0.8 million higher than in the
previous year.
The Porta a Mare project generated revenue from trading (around €4.4 million) as a result of the sale of 14
residential units, 14 garages and 1 parking place (the total of the units sold/committed, therefore, now
represents 90.7% of the total saleable area).
Core business Ebitda amounted to €113.7 million, an increase of 12.4% compared to 31 December 2017. Core
business revenue increased (including as a result of the larger real estate portfolio), offset by a less than
proportional increase in operating costs. The core business Ebitda Margin came to 71.9%, an increase of 220
bps compared to the prior year (69.7%). The freehold core business Ebitda (relative to freehold properties)
came to 80.3%, an increase of 110 basis points against December 2017.
3
Financial expense decreased (-5.4%) to €32.5 million, despite the increase in the net financial positon: the
downward trend in the average cost of debt, which came to 2.7% (vs 2.8% in December 2017), was, therefore,
confirmed.
The Group’s portion of net profit, therefore, amounted to €46.4 million in the year, down with respect to
2017 (-46.3%) which reflects the difference in writedowns and fair value adjustments which were negative,
versus positive (for around €23.9 million) in 2017.
Funds from Operations (FFO) rose 21.4% compared to 31 December 2017 to €79.7 million, exceeding the
growth target announced in August 2018 (at least +20%).
ASSET MANAGEMENT AND DEVELOPMENT PIPELINE
During the year IGD continued with its asset management activities: in addition to the acquisition, which closed
in April, of 4 assets in located in northern Italy that are part of important shopping centers in their respective
catchment areas, in May a new midsize store was opened in the Gran Rondò Shopping Center in Crema and the
restyling of the mall façade, as well as the multi-level parking garage, were also completed.
On 21 December the building permit was received (issued pursuant to the agreement signed on 15 November)
relating to the Officine Storiche section of the “Porta a Mare” Project in Livorno, which will make it possible
resume work on the completion of 43 residential units and the area of around 15,600 m2 which will be
dedicated to retail, the biggest and most attractive portion of the entire project.
Two significant restyling and remodeling projects are also currently underway at the Casilino Shopping Center
in Rome the Fonti del Corallo Shopping Center in Livorno. Both projects call for the downsizing of the
hypermarket and the creation of new spaces inside the mall: work is being done, specifically, on including
services which will make the shopping center more attractive to returning and first time visitors. Work on both
projects is expected to be completed in 2019.
On 7 November a strategic agreement was signed with COOP Alleanza 3.0 relative to 18 hypermarkets with a
fair value of around €520 million which calls for:
revision of the lease terms, namely a lengthening of the expiration of all the leases covered under the
agreement through 2037 and the adjustment of a few rents with a view to increased stability and
sustainability;
remodeling of 5 assets which could benefit from increasing the number of stores/services in the malls
by downsizing the hypermarket in order to increase the center’s appeal.
4
PORTFOLIO AND ASSET VALUATION
The market value of the IGD Group’s real estate portfolio reached €2,412.2 million, an increase of 8.3%
compared to December 2017. The main changes relate to the acquisition of the portfolio comprising 4
shopping malls and a retail park in April 2018 and the impact of the strategic agreement signed with Coop
Alleanza 3.0., along with the downsizing of the hypermarket in the Fonti del Corallo shopping center which is
not part of the Agreement.
The like-for-like portfolio in Italy (excluding the shopping centers subject to remodeling) was up slightly:
malls rose +0.43% (+€4.5 million) and the gross initial yield came to 6.23%;
hypermarkets were also up by +1.6% (+€7.5 million) and the gross initial yield came to 6.07%.
Looking at the entire perimeter (like-for-like plus the shopping centers that will be remodeled and, therefore,
reclassified as smaller hypermarkets and larger malls) the following change took place:
malls rose +18.19% (+€242.2 million) and the gross initial yield came to 6.41%;
hypermarkets were 9.51% lower (-€61.6 million) and the gross initial yield came to 6.08%.
In Romania the value of the real estate portfolio reached €154.8 million at 31 December 2018, lower than the
€159.5 million posted at 31 December 2017, with a gross initial yield of 6.8%.
The Net Initial Yield, calculated using EPRA criteria, reached 5.3% for the Italian portfolio (5.4% topped up)
and 5.8% for the Romanian portfolio (6.2% topped up).
The EPRA NNNAV reached €1,263 million or €11.45 per share. The figure is 0.4% higher versus 31 December
2017 (€11.40 per share, recalculated to take into account the capital increase completed on 23 April 2018) 1
.
FINANCIAL STRUCTURE
The IGD Group’s net financial debt came to €1,107.9 million at 31 December 2018, a slight increase with
respect to December 2017, including as result of the debt financed portion of the acquisition, while financial
indicators like the gearing ratio (which came to 0.88x compared to 0.94x at year-end 2017) and the loan-to-
value (which came to 45.8% vs 47.4% at year-end 2017) improved.
The Interest Cover Ratio (ICR) improved markedly, coming in at 3.47x (vs. 2.93x in 2017).
1 Taking into account cash and the new number of shares amounting to 110,341,903.
5
DIVIDEND
The Board of Directors proposed that shareholders approve, subject to the approval of the financial statements
for the year ending 31 December 2018 and the Board of Directors’ Report, a dividend of 50 euro cents per
share (the distribution of a total of €55.2 million or 69.3% of the FFO)
The dividend yield on the stock price recorded at 25 February 2018 would be equal to approx. 8%.
OUTLOOK 2019
The Company expects to continue along its growth path in line with the targets in the 2019-2021 Strategic Plan.
The Company estimates that FFO will grow in a range of between +6% and +7% in 2019.
THE NINTH CORPORATE SUSTAINABILITY REPORT APPROVED
The Board of Directors approved the Corporate Sustainability Report together with the Annual Report. As in
2017, the CSR approved was subject to Limited Assurance by PricewaterhouseCoopers which certified
compliance with the most important international standards (the GRI Standards).
This report, which maintains the structure of the 2017 CSR, contains three additions:
1. Reporting on the extent the targets found in the 2016-2018 Plan have been achieved;
2. Specific reference to 10 (out of 17) UN Millennium Goals and reporting on the steps taken by IGD to
achieve them;
3. Elements to be used to assess the impact of 3 sustainability projects.
The performances of the company during the year are reported in the different chapters of the CSR, organized
based on the acronym G.R.E.A.T. (Green, Responsible, Ethical, Attractive, Together):
• Green: consumption of electricity was reduced, thanks also to the solar panels installed (active in 5 shopping
centers) and the use of LED lighting (found in 16 shopping centers); another 2 key assets received BREEAM IN
USE certification (Tiburtino in Rome and Katanè in Catania) and the UNI EN ISO 14001 environmental
certification process continued (17 centers are certified, in addition to the headquarters or 74% of the centers
IGD decided to certify); the use exclusively, as of 2017, of renewable energy.
• Responsible: the second year of the Corporate Welfare Plan with the participation of almost all employees; a
total of almost €5 million was spent between 2017 and 2018 on plans for volunteer measures at shopping
centers focusing on shopping center safety involving earthquake proofing and the installation of anti-intrusion
bollards.
• Ethical: the 3-star legality rating (the highest achievable) obtained in 2016 was confirmed; UNI ISO 37001
anticorruption certification was obtained in Romania; changes were made to the privacy policy in order to
protect the data that stakeholders entrust the company with.
6
• Attractive: restyling begun at Centro Casilino in Rome and Fonti del Corallo in Livorno which focuses on
increasing the sustainability of the buildings; the renewal of the tenant and merchandising mix continued
resulting in the introduction of 27 new brands (15.1% of the total brands added during the year); 530 free
events were organized in the year for a total investment by the shopping centers of €3.3 million; further work
was done on the innovation project including the introduction of chatbots (virtual assistants active 24/7) in 3
shopping malls, the structured use of Instagram, as well as Poste Italiane lockers in 2 shopping centers; an
agreement was entered into for the use of Amazon Lockers in 27 shopping centers.
• Together: as part of stakeholder engagement a specific “Project Listen” or “Progetto Ascolto” was developed
for visitors (and non) of the shopping centers; IGD’s social role in communities was confirmed by the more than
14,600 jobs offered, partnerships with around 800 local suppliers, the fact that local brands account for 40% of
the brands found in the malls and involvement of 238 local associations.
Operating income statement at 31 December 2018
N.B.: Certain cost and revenue items have been reclassified or offset which explains the difference with respect to the
financial statements.
(a) (b) D
CONS_2017 CONS_2018 (b)/(a)
Revenues from freehold activities 126.3 139.3 10.3%
Revenues from leasehold activities 12.6 12.5 -1.3%
Total income from rental activities 138.9 151.8 9.2%
Rents and payable leases -10.2 -10.3 0.5%
Direct costs from rental activities -16.8 -17.5 3.9%
Net rental income 111.9 124.0 10.9%
Revenues from services 6.2 6.3 2.2%
Direct costs from services -5.8 -5.2 -11.2%
Net services income 0.4 1.1 n.a.
Headquarters personnel -6.6 -6.7 1.9%
G&A expenses -4.4 -4.7 6.1%
CORE BUSINESS EBITDA (Operating income) 101.2 113.7 12.4%
Core business Ebitda Margin 69.7% 71.9%
Revenues from trading 5.1 4.4 -13.1%
Cost of sale and other trading costs -5.8 -5.5 -5.2%
Operating results from trading -0.7 -1.1 50.4%
EBITDA 100.5 112.6 12.1%
Ebitda Margin 66.9% 69.3%
Impairment and Fair Value adjusments 23.9 -30.3 n.a.
Depreciations and provisions -1.2 -1.1 -6.5%
EBIT 123.2 81.2 -34.0%
FINANCIAL MANAGEMENT -34.3 -32.5 -5.4%
EXTRAORDINARY MANAGEMENT -0.1 -0.1 -10.3%
PRE-TAX PROFIT 88.7 48.7 -45.2%
Taxes -2.3 -2.3 0.0%
PROFIT FOR THE PERIOD 86.5 46.4 -46.3%
Profit/Loss for the period related to third parties 0.0 0.0 n.a.
GROUP NET PROFIT 86.5 46.4 -46.3%
GROUP CONSOLIDATED
7
OTHER RESOLUTIONS
Calling of the Annual General Meeting in ordinary session
IGD’s Board of Directors also resolved to convene the Company’s Annual General Meeting in ordinary session on 10 April
2019, in first call and, if necessary, in second call on 11 April 2019, to resolve on the following agenda:
1. Separate financial statements at 31.12.2018; Directors' report on operations; External auditors' report; Report of
the Board of Statutory Auditors; Presentation of the consolidated financial statements at 31.12.2018;related and
consequent resolutions;
2. Allocation of the net earnings for the year and distribution of the dividend to Shareholders; related and
consequent resolutions;
3. Report on compensation in accordance with Art. 123-ter, paragraph 6, of Legislative Decree n. 58/98; related and
consequent resolutions;
4. Authorization to buy and sell treasury shares; related and consequent resolutions.
IGD’s Board of Directors will propose that the shareholders, meeting in ordinary session, approve the payment
of a dividend of €0.50 per share which equates, based on the recent stock price of €6, to a dividend yield of
approximately 8%.
The dividend will be payable as from 13 May 2019 , with shares going ex-div n. 3 on 15 May 2019. Pursuant to
Art. 83-terdecies of Legislative Decree n.58 of 24 February 1998 n. 58, the shareholders of IGD at the record
date (14 May 2019) will be entitled to receive the dividend.
La prima data utile per lo stacco della cedola n. 3 sarà il 13 maggio 2019, con pagamento a decorrere dal 15
maggio 2019. Ai sensi dell’art. 83-terdecies del D.Lgs. del 24 febbraio 1998 n. 58, avranno diritto al dividendo
coloro che risulteranno Azionisti di IGD al termine della giornata contabile del 14 maggio 2019 (c.d. record
date).
Approval of the Authorization to buy and sell treasury shares
The Shareholders will also be called upon to resolve on the authorization to purchase and dispose of treasury
shares, after revoking the prior authorization granted by the shareholders on 1 June 2018, as follows:
Motivation: (i) trading and hedging transactions and (ii) invest liquidity; (iii) allow for the use of the treasury
shares in transactions pertaining to operating activities and business projects consistent with the Company's
strategic guidelines, in relation to which it is beneficial to trade, swap, contribute, or otherwise dispose of the
shares; (iv) fulfill obligations stemming from debt instruments convertible into or exchangeable for equity; and
(v) fulfill obligations stemming from stock option or stock grant programs in place for employees or members
of the Board of Directors of the Company and/or direct or indirect subsidiaries.
Maximum number of treasury shares which may be purchased: the purchases may be made on one or more
occasions up to the maximum allowed under the law;
8
Expiration of the shareholders’ authorization: the authorization to purchase treasury shares is requested for a
period of eighteen months as from the date of shareholders’ authorization; there is no time limit on the
authorization to dispose of the shares;
Methods and purchase price of the treasury shares: the purchases shall be made in accordance with Art. 132 of
the Uniform Finance Act and Art. 144-bis, first paragraph, letters b), c) and d-ter), of the Regulations for
Issuers, or any other applicable laws and regulations in effect at the time of the transactions, and must be
purchased at prices satisfying the provisions of Art. 5(1) of European Commission Regulation EC n. 596/2014 of
16 April 2004 or any other applicable provisions in effect at the time of the transaction.
Assessment of independent status
IGD’s Board of Directors verified, based on the information provided by the interested parties to the Company
that the 7 (seven) independent directors (Luca Dondi dall’Orologio, Elisabetta Gualandri, Sergio Lugaresi, Livia
Salvini, Rossella Saoncella, Timothy Guy Michele Santini and Eric Jean Véron) still qualify as independent in
accordance with and pursuant to Art. 148, paragraph 3, of Legislative Decree n. 58/1998, the Corporate
Governance Code promoted by the Italian Stock Exchange and Art. 16 of Consob Regulation n. 20249/2017 .
Approval of the Report on Corporate Governance and Ownership Structure and the Compensation Report
The Board of Directors approved the Report on Corporate Governance and Ownership Structure, which forms
an integral part of the annual report, as well as, in accordance with the recommendation of the Appointments
and Compensation Committee, the Compensation Report, the first section of which, pursuant to Art. 123-ter,
par. 6 of Legislative Decree. 58/98, will be voted on by shareholders during the next Shareholders’ Meeting.
Transfer of the registered office
The Board of Directors approved, pursuant to art. 2 of IGD’s bylaws, the transfer the company’s registered
office to Via Trattati Comunitari Europei 1957-2007, n. 13 in Bologna.
The documents will be made available to the public – as well as published on IGD’s website
http://www.gruppoigd.it/Governance - at the Company’s registered office, Borsa Italiana S.p.A. and on the
authorized storage system www.emarketstorage.com in accordance with the law and applicable regulations.
“Carlo Barban, IGD S.p.A.’s Financial Reporting Officer, declares pursuant to para. 2, article 154-bis of Legislative Decree n.
58/1998 (“Testo Unico della Finanza” or TUF) that the information reported in this press release corresponds to the
underlying records, ledgers and accounting entries”.
Please note that in addition to the standard financial indicators provided for as per the IFRS, alternative performance
indicators are also provided (for example, EBITDA) in order to allow for a better evaluation of the operating performance.
These indicators are calculated in accordance with standard market procedures.
IGD - Immobiliare Grande Distribuzione SIIQ S.p.A.
Immobiliare Grande Distribuzione SIIQ S.p.A. is one of the main players in Italy’s retail real estate market: it develops and manages shopping centers throughout the country and has a significant presence in Romanian retail distribution. Listed on the Star Segment of the Italian Stock Exchange, IGD was the first SIIQ (Società di Investimento Immobiliare Quotata or real estate investment trust) in Italy. IGD has a real estate portfolio valued at circa €2,412.2 million at 31 December 2018, comprised of, in Italy, 25 hypermarkets and supermarkets, 27 shopping malls and retail parks, 1 plot of land for development, 1 property held for trading and an additional 5 real estate properties. Following the acquisition of the company Winmark Magazine SA in 2008 14 shopping centers and an office building, found in 13 different Romanian cities, were added to the portfolio. An extensive domestic presence, a solid financial structure, the ability to plan, monitor and manage all phases of a center’s life cycle, leadership in the retail real estate sector: these qualities summarize IGD’s strong points.
The press release is available on the website www.gruppoigd.it, in the Investor Relations section, and on the website www.imagebuilding.it, in the Press Room section.
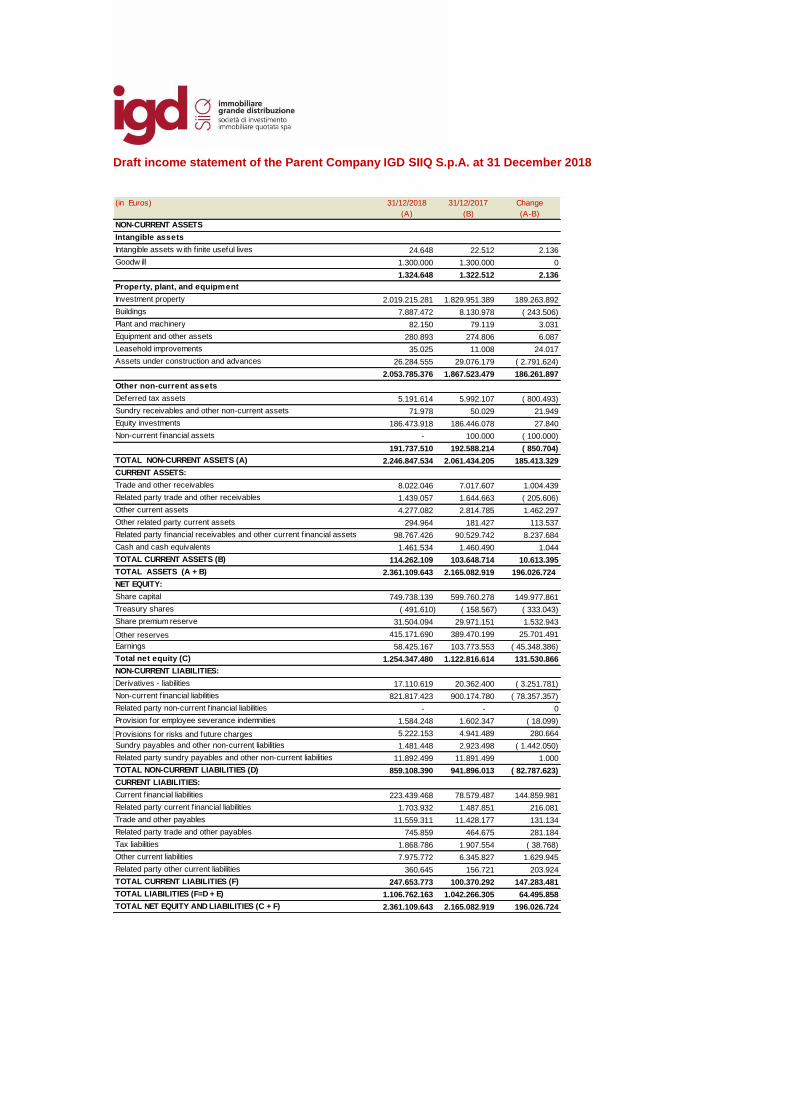
Please find attached the IGD Group’s income statement, statement of financial position, statement of cash flows and net financial position, as well as the operating income statement, at 31 December 2018 and Income statement, stamen of financial position and statement of cash flow of the parent company IGD SIIQ Spa at 31 December 2018.