Pressure dependence of the low-temperature crystal structure and phase transition behavior ofCaFeAsF and SrFeAsF: A synchrotron x-ray diffraction study
S. K. Mishra,1 R. Mittal,1,* S. L. Chaplot,1 S. V. Ovsyannikov,2 D. M. Trots,2 L. Dubrovinsky,2 Y. Su,3 Th. Brueckel,3,4
S. Matsuishi,5 H. Hosono,5 and G. Garbarino6
1Solid State Physics Division, Bhabha Atomic Research Center, Trombay, Mumbai 400 085, India2Bayerisches Geoinstitut, Universitat Bayreuth, Universitatsstrasse 30, D-95440 Bayreuth, Germany
3Juelich Centre for Neutron Science, IFF, Forschung. Juelich, FRM II, Lichtenbergstr. 1, D-85747 Garching, Germany4Institut fuer Festkoerperforschung, Forschungszentrum Juelich, D-52425 Juelich, Germany
5Frontier Research Center, Tokyo Institute of Technology, 4259 Nagatsuta-cho, Midori-ku,Yokohama 226-8503, Japan6European Synchrotron Radiation Facility, BP 220, 38043 Grenoble, France
(Received 9 May 2011; revised manuscript received 5 August 2011; published 21 December 2011)
We report systematic investigation of high pressure crystal structures and structural phase transition up to46 GPa in CaFeAsF and 40 GPa in SrFeAsF at 40 K using powder synchrotron x-ray diffraction experimentsand Rietveld analysis of the diffraction data. We find that CaFeAsF undergoes orthorhombic to monoclinicphase transition at Pc = 13.7 GPa while increasing pressure. SrFeAsF exhibits coexistence of orthorhombic andmonoclinic phases over a large pressure range from 9 to 39 GPa. The coexistence of the two phases indicatesthat the transition is of first order in nature. Unlike in the 122 compounds (BaFe2As2 and CaFe2As2), we do notfind any collapse tetragonal transition. The transition to a lower symmetry phase (orthorhombic to monoclinic)in 1111 compounds under pressure is in contrast with the transition to a high symmetry phase (orthorhombicto tetragonal) in 122-type compounds. On heating from 40 K at high pressure, CaFeAsF undergoes monoclinicto tetragonal phase transition around 25 GPa and 200 K. Further, it does not show any post-tetragonal phasetransition and remains in the tetragonal phase up to 25 GPa at 300 K. The dPc/dT is found to be positive for theCaFeAsF and CaFe2As2, however the same was not found in case of BaFe2As2.
Crystal structures and phase transitions are vital to super-conductivity in iron-based compounds.1–20 These compoundsoccur in five different structural classes2 (namely, FeSe,LiFeAs, BaFe2As2, LaFeAsO/SrFeAsF, and Sr3Sc2O5Fe2As2)but share a common layered structure based on a planar layerof iron atoms joined by tetrahedrally coordinated pnictogen(Pn = P, As) or chalcogen (S, Se, Te) anions arranged ina stacked sequence separated by alkali, alkaline-earth, orrare-earth (Ba, Ca, Sr, Eu) and oxygen/fluorine blocking layers.It is now widely thought that the interaction that leads to thehigh Tc superconductivity originates within these commoniron layers, similar in nature to the common copper oxygenbuilding block found in the copper oxide (cuprate). However,structurally three key differences are found among the FeAsand cuprate compounds. First, in the FeAs compounds thepnictogen/chalcogen anions are placed above and below theplanar iron layer as opposed to the planar copper-oxygenstructure of the cuprates. Second, ability to substitute or dopedirectly into the active pairing layers of FeAs compoundsand finally the parent compounds of the new Fe-basedsuperconductors share a similar electronic structure with allfive d orbitals of the Fe contributing to a low density of statesat the Fermi level, which is in contrast to the cuprates whereparent compounds are Mott insulators with well-defined localmagnetic moments. These similarities have inspired a flurry oftheoretical and experimental works1–30 in Fe pnictides-basedmaterials.
At ambient condition, these compounds crystallize intetragonal symmetry with no magnetic order (i.e., paramag-netic in nature). The parent compounds of iron-pnictides un-
dergo a first- or second-order structural transition below roomtemperature (typically in the range of 100–210 K), from tetrag-onal to orthorhombic structure, and magnetic transition fromnonmagnetic to stripe antiferro-magnetic structure.2–7,22,24,29,30
The structural transition and magnetic ordering can happensimultaneously or successively depending on the compound.It has been confirmed both experimentally and theoreticallythat the magnetic order of Fe at low temperature is stripelikeantiferromagnetism often referred to as spin density wave(SDW).2–7 Upon changing the carrier concentration, applyingexternal pressure or by charge neutral doping, the magneticorder suppresses, and the materials become superconducting.In the 1111-family (both RFeAsO and MFeAsF, R = rare earthand M = Ca and Sr), magnetic transition temperature (TN ) islower than structural transition temperature (TS). This seems tosuggest that the magnetic transition is induced by the structuraltransition. In case of M′Fe2As2 (M′ = Ba, Sr, Ca, and Eu)compounds, (at ambient pressure with decreasing temperature)the structural and magnetic transitions are found29,30 to happensimultaneously (a first-order transition). However, recenthigh pressure powder x-ray synchrotron diffraction studieson BaFe2As2 show that at low temperature (33 K), thesetransitions occur at different pressures.19 It is not clear whetherthe magnetic transition is induced by the structural transitionand what is the driving force of the structural transition.These two important questions are crucial to understand theformation of the stripe antiferromagnetic order in the parentcompounds.
The magnetism is intimately related to the crystal structureboth in terms of the Fe-As bond length and As-Fe-As bondangle. The antiferromagnetic ordering can be suppressed by
S. K. MISHRA et al. PHYSICAL REVIEW B 84, 224513 (2011)
various ways such as by changing the carrier concentration,applying external pressure, or by charge neutral doping. Thecommon FeAs building block is considered as a criticalcomponent to stabilize superconductivity. The combinationof strong bonding between Fe-Fe and Fe-As sites (and eveninterlayer As-As in the 122-type systems), and the geometryof the FeAs4 tetrahedra plays a crucial role in determining theelectronic and magnetic properties of these compounds. Forinstance, the two As-Fe-As tetrahedral bond angles seem toplay a crucial role in optimizing the superconducting transitiontemperature. The highest Tc values are found only when anAs-Fe-As/Fe-As-Fe tetrahedral bond angle is close to the idealvalue of 109.47◦. The detailed interplay between the crystalstructure, magnetic ordering, and superconductivity is hardlyunderstood.
High pressure experiments play an important role in thefield of superconductivity and also provide information aboutthe understanding of its mechanism. The superconductingtransition temperature (Tc) in FeAs compounds is found toincrease14–21 over 50 K by application of pressure. Despitethe importance of the evolution of superconducting transitiontemperature (Tc) with pressure to understand the mechanism ofsuperconducting properties of Fe-based materials, there is lackof information on the detailed pressure dependence of theirstructural properties. Recently, we reported the pressure effectson CaFe2As2 and BaFe2As2 (122-type compounds) usingpowder synchrotron x-ray diffraction technique. Rietveldanalysis of the high pressure powder x-ray diffraction datashowed19 that at 300 K in the Ba-compound the collapsedtetragonal transition occurs at 27 GPa. The transition pressurevalue is found to be much higher as compared to the Ca-compound where the transition occurs at 1.7 GPa. However,at low temperature (33 K), structural phase transition fromthe orthorhombic to tetragonal phase in the Ba-compoundoccurred at about 29 GPa (while increasing pressure), whichis much higher than the transition pressure of 0.3 GPa at 40 K,as known in case of the Ca-compound.19 We have not foundany evidence of a post collapsed tetragonal phase transition inCaFe2As2 up to 51 GPa (at 300 K) and 37.8 GPa (at 40 K).It is important to note that transition to a collapsed phase
occurs in the two compounds at nearly the same values of unitcell volume and ct/at ratio. Although five different types2 ofFe-based superconductors have been reported in literature, the122 FeAs-based superconductors seem to be the most studied(of the five types). On the other hand 1111-type compoundshave not gotten considerable attention from the scientificcommunity. In this paper we present systematic investigationof pressure effect on crystal structure, and structural phasetransition behavior of CaFeAsF and SrFeAsF at 40 K usingpowder-diffraction technique. Detailed Rietveld analysis ofthe diffraction data shows that both the compounds undergoa structural phase transition from orthorhombic to monoclinicphase on compression. While CaFeAsF undergoes a fairlysharp transition at around 13.7 GPa, SrFeAsF exhibits alarge phase coexistence region (from 9 to 40 GPa) with theorthorhombic phase fraction continuously decreasing withincrease of pressure. Possible correlation between structureevolutions with pressure and superconductivity in Fe-basedsuperconductor is also discussed.
II. EXPERIMENTS
The pressure-dependent powder x-ray diffraction measure-ments were carried out using the ID-27 beam line at theEuropean Synchrotron Radiation Facility (ESRF, Grenoble,France). An applied pressure was generated by membranediamond anvil cells (DACs). We employed a stainless steelgasket preindented to the thickness of ∼40–50 μm, with acentral hole of 150 μm in diameter and filled with heliumas pressure transmitting media. The pressure was determinedfrom the shift of the fluorescence line of the ruby. A powderysample of ∼30–40 μm in diameter and 10 μm in thicknesswas situated in the center of one of the diamond anvil’s tips.The wavelength of the x-ray (0.3738 A) was selected anddetermined using a Si(111) monochromator and the iodine K-edge. The sample-to-image plate (MAR345) detector distancewas refined using the standard diffraction data of Si. To cool theDAC, a continuous helium flow CF1200 DEG Oxford cryostatwas used. Precaution was taken to obtain stable temperatureand pressure conditions prior to each acquisition. The precision
0 10 20 30 40 500
50
100
150
200
250
300
0 10 20 30 40 500
50
100
150
200
250
300
Ortho-
rhom
bic
CaFeAsFTetragonal
Monoclinic
Monoclinic
Tem
pera
ture
(K
)
Pressure (GPa)
Tet
rago
nal
Orthorhombic +Monoclinic
SrFeAsF
Ortho-
rhom
bic
Phase coexistance
Pressure (GPa)
Tet
rago
nal
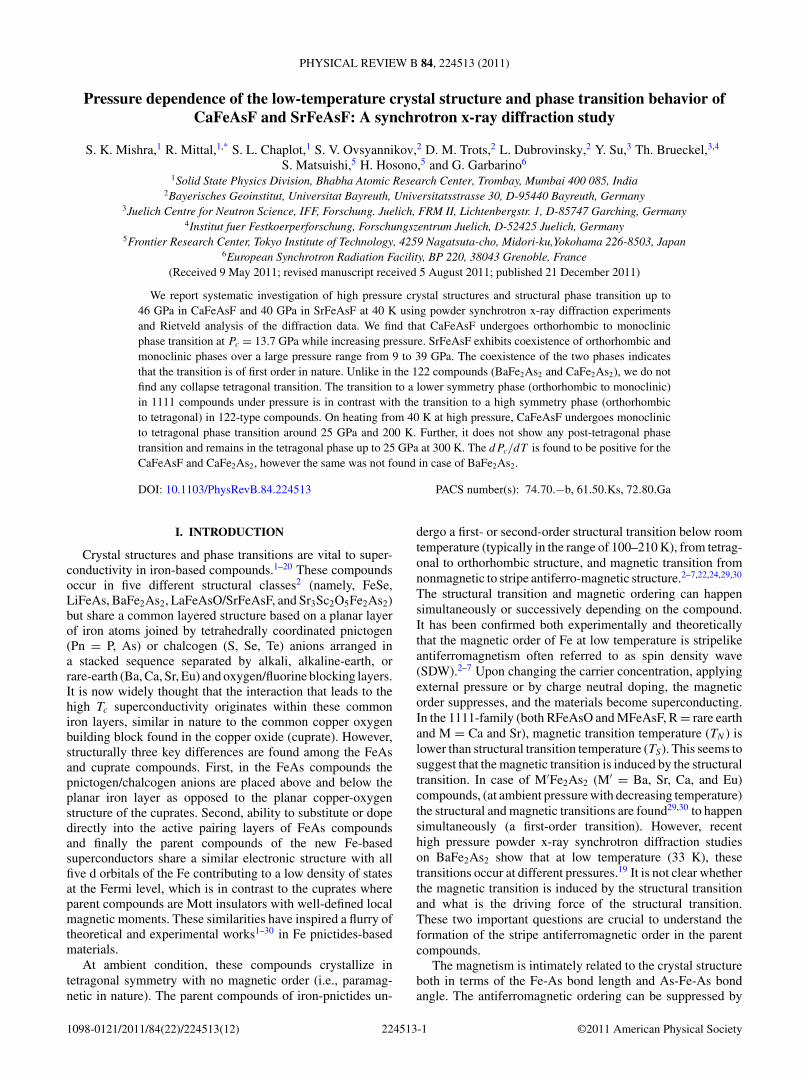
FIG. 1. (Color online) The pressure-temperature path (indicated by blue, dashed line and arrows) as followed in our measurements onCaFeASF and SrFeAsF. Symbols correspond to the pressure-temperature conditions where measurements were made. The solid lines throughthe symbols are a guide to the eye. The phases, namely tetragonal, orthorhombic, and monoclinic, as identified by Rietveld refinement of thediffraction data are indicated over ranges shown by red lines and arrows.
224513-2
PRESSURE DEPENDENCE OF THE LOW-TEMPERATURE . . . PHYSICAL REVIEW B 84, 224513 (2011)
and accuracy of the temperature measurement is better than0.1 K and 0.2 K, respectively. During the measurements, theCaFeAsF and SrFeAsF samples were first cooled to 40 K,and then pressure was increased along a path indicated inFig. 1. Typical exposure times of 20 seconds were employedfor the measurements. Preferred orientation of crystal grainsis observed along different axes in different loadings, whichis common in high-pressure experiments. The diffractionpatterns indicate preferred orientation of the samples along[211] and [132] for measurements on CaFeAsF and SrFeAsF,respectively.
The two-dimensional (2D) powder images were integratedusing the program FIT2D31 to yield intensity vs 2θ plot.The structural refinements were performed using the Rietveldrefinement program FULLPROF.32 In all the refinements thebackground was defined by a sixth-order polynomial in 2θ . AThompson-Cox-Hastings pseudo-Voigt with axial divergenceasymmetry function was chosen to define the profile shapefor the powder synchrotron x-ray diffraction peaks. Thescale factor, background, and half-width parameters, alongwith mixing parameters, lattice parameters, and positionalcoordinates, were refined.
III. RESULT AND DISCUSSION
The powder synchrotron x-ray diffraction measurements forMFeAsF (M = Ca, Sr) at ambient conditions confirmed single-
5 10 15 20 25
15.7 16.1
15.6 15.8
40 K
2θ (degree)
Inte
nsit
y (a
rb. u
nits
)
5.8 GPa
(400)O
(040)O
(220)T
(b)
(a)CaFeAsF300 K
0.6 GPa
FIG. 2. (Color online) Observed (solid black circles), calculated(continuous red/dark gray line), and difference (bottom blue/mediumgray line) profiles obtained after the Rietveld refinement of CaFeAsFat (a) 0.6 GPa and 300 K in tetragonal phase (space group P 4/nmm)and (b) 5.8 GPa and 40 K in orthorhombic phase (space groupCmma). Inset in (a) shows the (220) reflection of the tetragonal phaseand in (b) shows the splitting/broadening of the (220) reflection ofthe tetragonal phase at 40 K and provides unambiguous signature fororthorhombic structure.
phase samples consistent with the published reports.22,24–26
The effects of pressure inhomogeneity on the phase transitionbehavior of FeAs-based compounds have been reported inliterature.14–19 In the present measurements we have usedhelium as a pressure transmitting medium, which is believed33
to give the best hydrostatic conditions at present. However,effect of inhomogeneity could not be completely ruled out andcould have some influence on the results obtained on thesecompounds.
A. Phase transition of CaFeAsF at 40 K
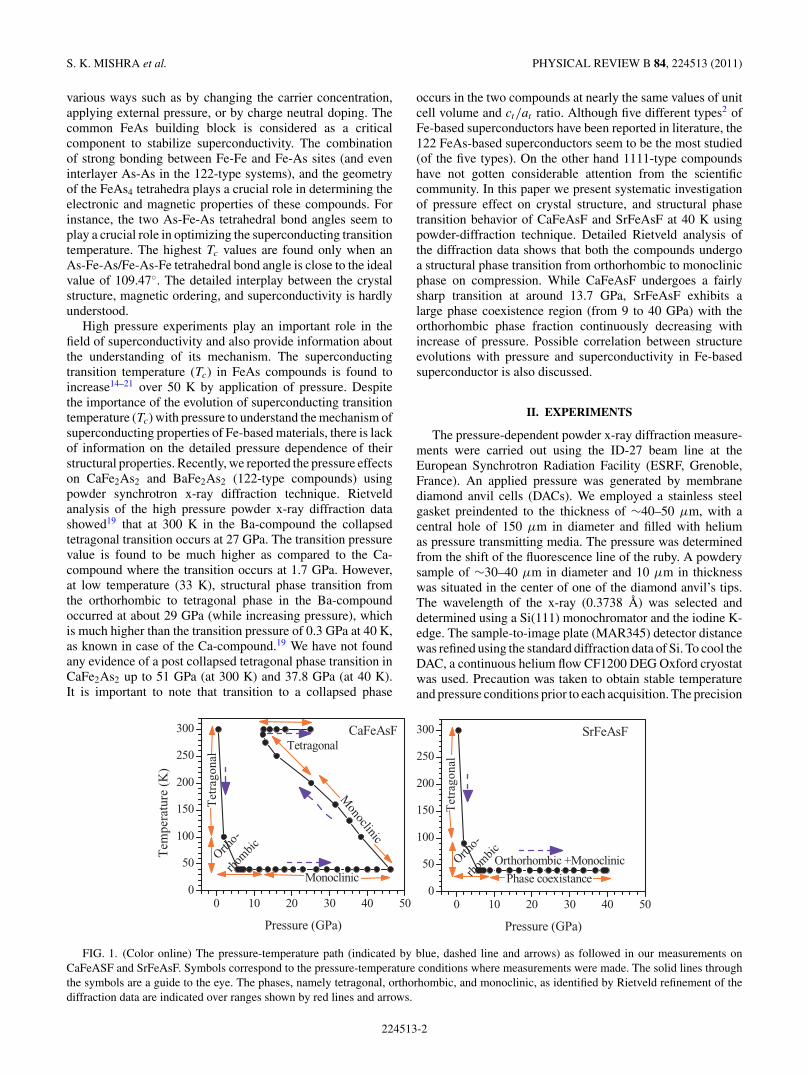
At ambient condition, CaFeAsF crystallizes in tetragonalstructure with space group P 4/nmm without magnetic or-dering. On cooling it undergoes a tetragonal to orthorhombicphase transition at 134 K, while magnetic ordering in the formof a SDW sets in at around 114 K, respectively. Figures 2(a) and2(b) show a Rietveld refinement of powder synchrotron data at300 K (0.6 GPa) and at 40 K (5.8 GPa), respectively. Splittingof (220)T peak of tetragonal phase at 300 K unambiguouslyconfirms the orthorhombic structure at 40 K (see inset).
The pressure-dependent powder x-ray diffraction measure-ments were carried out at 40 K and at pressures between 5.8to 46.2 GPa. The data show significant changes with pressureespecially in terms of dissimilar broadening of various peaks.The most prominent changes have been observed in peaksaround 2θ = 11◦, which become broader with increasing pres-sure above 12 GPa. Figure 3 depicts a portion of the powder
11.5 12.0 12.57.5 8.0 8.5
5.8 (GPa)
11.6 (GPa)
23.0 (GPa)
34.9 (GPa)
41.5 (GPa)
15.8 (GPa)
20.3(GPa)
29.3 (GPa)
2θ (degree)
Inte
nsi
ty (
arb
. un
its)
40 KCaFeAsF
FIG. 3. Evolution of the powder-synchrotron x-ray diffractionpatterns of CaFeAsF at 40 K and selected pressure.
224513-3
S. K. MISHRA et al. PHYSICAL REVIEW B 84, 224513 (2011)
2 4 6 8 10 12
11.0 11.5 12.0
11.0 11.5 12.0
11.0 11.5 12.0
11.5 12.0 11.0 11.5 12.0
2 4 6 8 10 12
(b)
TCmma P4/nmm
P4/nmm (T) + Cmma (O)
Inte
nsit
y (a
rb. u
nits
)
(a)
CaFeAsF
Cmma
2θ (degree)
(g)
(c)
OT
P4/nmm+ Cmma
(e)Pbcm
2θ (degree) 2θ (degree)
(d)
40 K and 20.3 GPa
Pmmn
(f) P2/nP2/n (M)
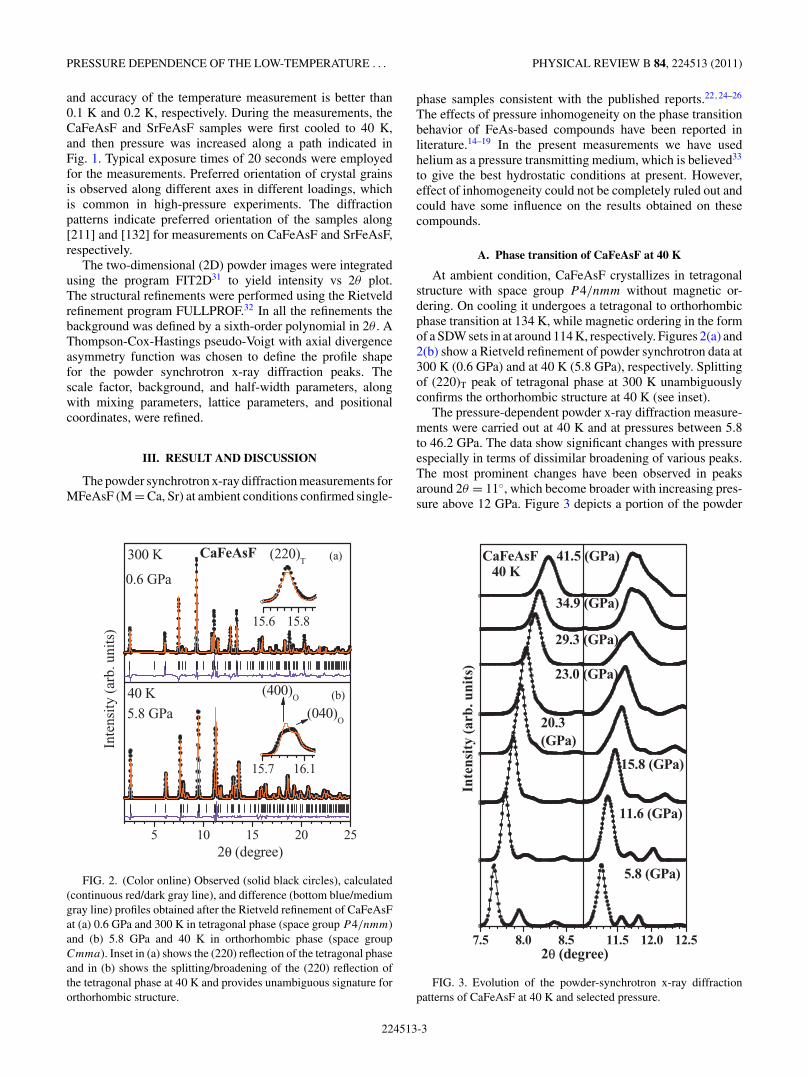
FIG. 4. (Color online) Observed (solid black circles), calculated(continuous red/dark gray line), and difference (bottom blue/mediumgray line) profiles obtained after the Rietveld refinement of CaFeAsFat 40 K and 20.3 GPa using different models, namely (a) an or-thorhombic (Cmma); (b), (c) a combination of tetragonal (P 4/nmm)and an orthorhombic (Cmma); (d), (e) an orthorhombic (Pmmn,Pbcm); and (f), (g) monoclinic (P 2/n) phases, respectively.
x-ray diffraction patterns of CaFeAsF at selected pressure.Detailed Rietveld refinement of the powder-diffraction data
shows that diffraction patterns at 40 K could be indexedusing the orthorhombic structure (space group Cmma) upto 12 GPa. The Rietveld refinements proceeded smoothly,revealing a monotonic decrease in lattice constant and cellvolume with increasing pressure. The response of structuralparameters to pressure is strongly anisotropic (as will beshown below in Fig. 9). Further increase of pressure above12 GPa leads to even higher compression of the interlayerspacing (lattice parameter c). However, attempts to employthe same orthorhombic structural model in the refinements[Fig. 4(a)] proved unsatisfactory, and a progressive worseningof the quality of the Rietveld fits with increasing pressure wasfound. The most apparent signature of the subtle structuraltransformation that occurs above 12 GPa is the inabilityof orthorhombic structure (space group Cmma) to accountsatisfactory for the peaks around 11◦. For more clarity it isshown in Fig. 4(a) that the diffraction data at 20.3 GPa cannotbe indexed with the orthorhombic phase. Extra broadening(splitting) of peaks suggests either lowering of the symmetryor coexistence of another high symmetry phase.
Recently, we reported in BaFe2As2 compounds that lowtemperature orthorhombic (space group Fmmm) and roomtemperature tetragonal (space group I4/mmm) phases coexistover a large pressure range above 29 GPa.19 In view ofthis, to account for the peak broadening in the pressure-dependence diffraction data on CaFeAsF, we have exploredthe possibility of coexistence of low temperature orthorhombic(space group Cmma) and room temperature tetragonal (spacegroup P 4/nmm) phases. The powder-diffraction data above12 GPa are refined using these coexisting phases, and theresults are shown in Figs. 4(b) and 4(c). The green color line(online only and marked with T) represents the additionaltetragonal phase. While the profile around 11.5◦ could be
5 10 15 20 25 11.0 11.5 12.07.5 8.0 8.5
40 K 11.6 GPa
Cmma
2θ ((degree)
Cmma
P2/n
P2/n
2θ ((degree)2θ ((degree)
Cmma
P2/n
40 K 20.3 GPa
(a)40 K
41.5 GPa
P2/n
(c) CaFeAsF
40 K and 20.3 GPa (b) CaFeAsF
Inte
nsit
y (a
rb. u
nits
)
40 K and 20.3 GPa
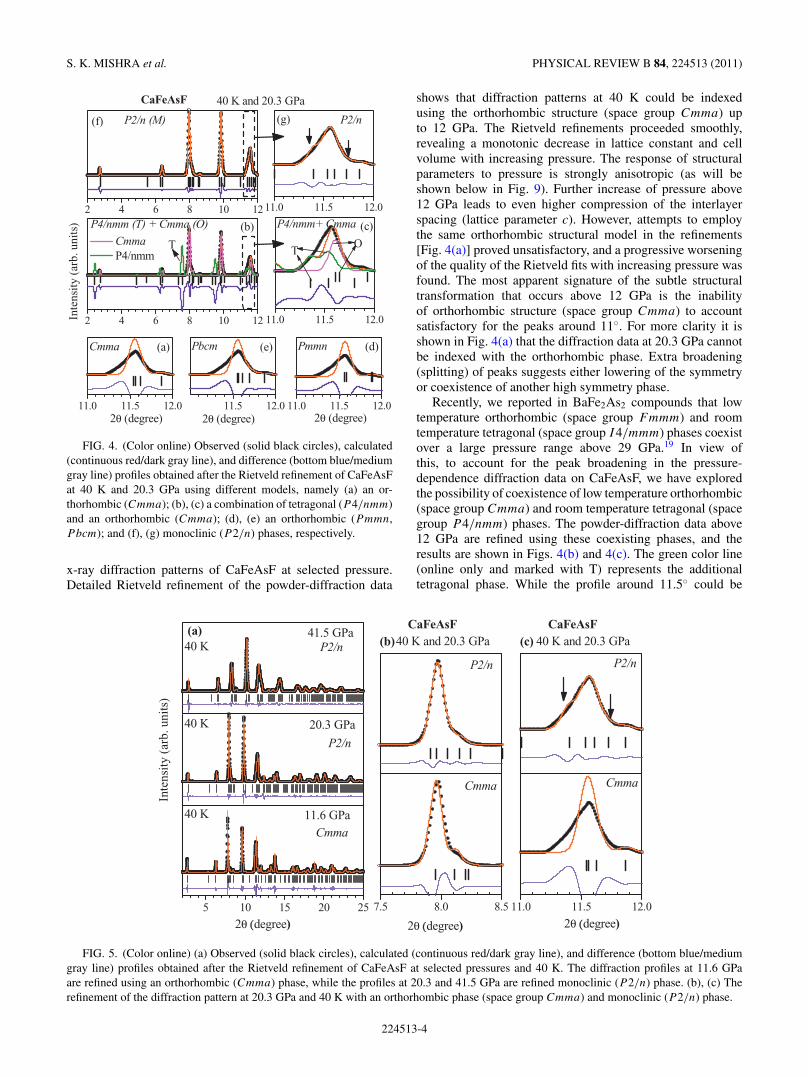
FIG. 5. (Color online) (a) Observed (solid black circles), calculated (continuous red/dark gray line), and difference (bottom blue/mediumgray line) profiles obtained after the Rietveld refinement of CaFeAsF at selected pressures and 40 K. The diffraction profiles at 11.6 GPaare refined using an orthorhombic (Cmma) phase, while the profiles at 20.3 and 41.5 GPa are refined monoclinic (P 2/n) phase. (b), (c) Therefinement of the diffraction pattern at 20.3 GPa and 40 K with an orthorhombic phase (space group Cmma) and monoclinic (P 2/n) phase.
224513-4
PRESSURE DEPENDENCE OF THE LOW-TEMPERATURE . . . PHYSICAL REVIEW B 84, 224513 (2011)
TABLE I. Results of Rietveld refinement of the crystal structure for CaFeAsF at selected pressure and 40 K. The measurements werecarried out using a focused x-ray monochromatic beam of wavelength = 0.3738 A. The data collected up to 25◦ have been used to determinethe reported parameters. The atomic positions for space group Cmma (No. 67): Ca (4g)(0, 1/4, z), Fe (4b) (1/4, 0, 1/2), As (4g) (0, 1/4, z)and F (4a) (1/4, 0, 0). The atomic positions for space group P 12/n1 (No. 13, unique axis b and cell choice 2): Ca (2f)(3/4, y, 1/4), Fe (2e)(3/4, y, 3/4), As (4g) (3/4, y, 1/4), and F (4a) (3/4, y, 3/4).
At 5.72 GPa and 40 K 29.3 GPa and 40 K
Orthorhombic phase (space group Cmma) Monoclinic phase (space group P 12/n1)Atoms Positional coordinates Positional coordinates
fitted (forcefully), the calculated peaks around 2.5◦, 7.9◦, and9.8◦ arising due to the tetragonal phase are not observed inthe experiments. This unsatisfactory quality of the Rietveldfit of the diffraction data suggests that the possibility of thephase coexistence of orthorhombic and tetragonal phases isnot favored. The dissimilar broadening of peaks and inabilityto Rietveld fit the powder-diffraction patterns using a phase-coexistence model suggests a reduction of symmetry from theorthorhombic symmetry (space group Cmma).
We have further explored various possibilities, namely,orthorhombic symmetry with space group Pbcm and Pmmn,monoclinic structure with space group P 12/n1, etc. [seeFigs. 4(d)–4(g)], to identify the correct space group. We foundthat orthorhombic space groups (Pbcm, Pmmn) also could notfit structural data very well, and the monoclinic structure withspace group P 12/n1 (No. 13, unique axis b and cell choice2) could successfully index all the peaks [see Figs. 4(f) and4(g)]. It is well documented in literature that many isostructuralFe-based materials undergo a structural phase transition to themonoclinic phase with temperature and pressure.34,35 Rietveldrefinements employing this structural model are satisfactoryfor all the diffraction patterns up to the highest pressure mea-sured by us. A careful inspection and analysis of diffractiondata reveal that CaFeAsF transforms to the monoclinic struc-ture at Pc = 13.7 GPa even though the monoclinic distortionis quite small. The monoclinic angle as a function of pressureshows a sharp discontinuity at the transition pressure at 13.7GPa. The monoclinic angle (β) shows a very small changefrom 90.5◦ to 91.2◦ on increase in pressure from 13.7 GPa to46.2 GPa. However, the small monoclinicity has significantlyimproved the fit quality between the observed and calculatedprofiles, as shown in Fig. 5. The detailed structural parametersand goodness of fit for CaFeAsF at selected pressure and40 K, as obtained from powder-synchrotron diffraction data,are given in Table I. Schematic diagrams of the crystalstructure in the orthorhombic and monoclinic phases are shownin Fig. 6.
B. Phase transition of SrFeAsF at 40 K
SrFeAsF also crystallizes in tetragonal structure withspace group P 4/nmm at ambient condition. On cooling itundergoes a structural phase transition to orthorhombic phasearound 180 K, followed by paramagnetic to antiferromagnetic
cm=co
am ao
bo bm
Ca
F
Fe
As
FIG. 6. (Color online) The relation between the unit-cell param-eter of the low pressure orthorhombic phase and that of the highpressure monoclinic phase. ao, bo, co, and am, bm, and cm are celledges in the orthorhombic and monoclinic phases, respectively. Therelationship between the unit-cell parameter in the orthorhombic andmonoclinic phases can be approximately described as ao = am + bm,bo = am − bm, co = cm. The colored solid circles represent the atoms:Ca, white; Fe, red/dark gray; As, green/gray; and F, blue/medium grayin the unit cell.
224513-5
S. K. MISHRA et al. PHYSICAL REVIEW B 84, 224513 (2011)
5 10 15 20 25
15.50
15.2
40 K
2θ (degree)
Inte
nsity
(arb
. uni
ts)
5.8 GPa(b)
(a) SrFeAsF 300 K0.6 GPa
FIG. 7. (Color online) Observed (solid black circles), calculated(continuous red/dark gray line), and difference (bottom blue/mediumgray line) profiles obtained after the Rietveld refinement of SrFeAsFat (a) 0.6 GPa and 300 K in tetragonal phase (space group P 4/nmm)and (b) 5.8 GPa and 40 K in orthorhombic phase (space groupCmma). Inset in (a) shows the (220) reflection of the tetragonal phaseand in (b) shows the splitting/broadening of the (220) reflection ofthe tetragonal phase at 40 K and provides unambiguous signature fororthorhombic structure.
transition at 133 K. Figures 7(a) and 7(b) depict results ofRietveld refinement of powder synchrotron data at 0.6 GPa and300 K and 5.8 GPa and 40 K, respectively. At low temperature,we found that refinement for SrFeAsF can be carried outin the orthorhombic structure consistent with literature. Theobservation is unambiguously confirmed by comparing the(220)T peak of tetragonal phase at ambient temperature (seeinset).
As in the case of CaFeAsF, the powder-diffraction patternsof SrFeAsF also show significant changes with pressure. Toobtain the pressure dependence of the structural parameters,detailed Rietveld refinement of the powder-synchrotron x-raydiffraction data are carried out. Similar to CaFeAsF, we noticebroadening/splitting of some of the peaks around 9 GPa.At this pressure, the diffraction data could not be refinedusing either the orthorhombic or the monoclinic phase, asindicated in Fig. 8. However, a two-phase refinement withboth the orthorhombic and monoclinic space groups is foundsuccessful, and all the observed diffraction peaks could beindexed (see Fig. 8).
We find that orthorhombic and monoclinic phases coexistover a large pressure range from 9 GPa to the highest pressureof 40 GPa attained in our experiment. The percentage of themonoclinic phase continuously increases with pressure andreaches 98% at 40 GPa. The coexistence of both the phasesindicates that the structural phase transition from orthorhombicto monoclinic phase is of first order. The fit between theobserved and calculated profiles is quite satisfactory, and some
5 10 15 20 25 11.0 11.5
40 K & 9.0 GPa
Inte
nsit
y (a
rb. u
nits
)
2θ (degree)
40 K
2θ (degree)
9.0 GPa
40 K 22.3 GPa
40 K 34.0 GPa
(b)
(a) SrFeAsF40 K 39.8 GPa
Cmma + P2/n
Two Phase
Two Phase
Two Phase
Two Phase
P2/n
Cmma
Two Phase
FIG. 8. (Color online) (a) Observed (solid black circles), cal-culated (continuous red/dark gray line), and difference (bottomblue/medium gray line) profiles obtained after the Rietveld refinementof SrFeAsF at selected pressures and 40 K. The diffraction profilesat 9.0, 22.3, 34.0, and 39.8 GPa are refined using a combinationof orthorhombic (Cmma) and monoclinic (P 2/n) phases. Upperand lower vertical tick marks above the difference profiles indicatepeak positions of orthorhombic (Cmma) and monoclinic (P 2/n)phases, respectively. (b) The refinement of the diffraction pattern at9.0 GPa and 40 K with an orthorhombic phase (space group Cmma), amonoclinic (P 2/n) phase, and a combination of orthorhombic (spacegroup Cmma) and monoclinic (P 2/n) phases.
of them are shown in Fig. 8. The detailed structural parametersand goodness of fit for SrFeAsF at selected pressure and40 K, as obtained from powder-synchrotron diffraction data,are given in Table II.
In our earlier measurements for BaFe2As2 we found thatthe coexisting region for orthorhombic and tetragonal phasewas very large.19 In the case of the fluorine-based 1111-typeCa/Sr compounds the transition pressures are found to bevery similar. These observations are in contrast to the case ofBaFe2As2 and CaFe2As2, where the compound with smallerionic radii (CaFe2As2) show phase transition at much lowerpressure (0.3 GPa) at 40 K as compared to the BaFe2As2,where transition at 40 K occurs at 29 GPa.19
C. Pressure evolution of structural parameters at 40 K
As mentioned previously, superconductivity in iron-arsenide materials is associated with lattice distortion andsuppression of magnetic ordering.19,36,37 The detailed inter-play between the crystal structure, magnetic ordering, andsuperconductivity is hardly understood up to now, which isto some extent due to the lack of precise structural data.
224513-6
PRESSURE DEPENDENCE OF THE LOW-TEMPERATURE . . . PHYSICAL REVIEW B 84, 224513 (2011)
TABLE II. Results of Rietveld refinement of the crystal structure for SrFeAsF at selected pressure and 40 K. The measurements werecarried out using a focused x-ray monochromatic beam of wavelength = 0.3738 A. The data collected up to 25◦ have been used to determinethe reported parameters. The atomic positions (Wycoff) for both the space groups are the same as given in Table I.
At 5.8 GPa and 40 K 22.1 GPa & 40 K
Orthorhombic phase space group Cmma
Two phase: orthorhombic + monoclinic space group (Cmma +P12/n1)
At ambient conditions, MFeAsF (M = Ca/Sr) crystallizesin the ZrCuSiAs-type structure (space group P 4/nmm, Z
= 2). The crystal structures of all the iron-pnictides sharea common 2D FeAs layer, where Fe atoms form a 2D-square sublattice with As atoms sitting at the center of thesesquares but off the Fe plane (above and below the planealternately). These are made of alternating Ca/SrF and FeAslayers. The Fe and F atoms lie in planes, while the As andCa/Sr atoms are distributed on each side of these planesfollowing a chessboard pattern. They undergo a tetragonalto orthorhombic phase transition at 134 and 180 K followedby magnetic transitions at 114 and 133 K for CaFeAsF andSrFeAsF, respectively.22,24 Applications of internal pressure(chemical pressure) suppress both orthorhombic structure andantiferromagnetic state, leading to emergence of supercon-ductivity. For example, the critical superconducting transitiontemperature Tc ∼ 4 K in the Co-substituted Fe site in SrFeAsF;Tc ∼ 22 K in the Co-substituted Fe site in CaFeAsF; andTc ∼ 31 K, 52 K, and 56 K, respectively, in the La-, Nd-,and Sm-substituted Sr site in SrFeAsF was observed.23–28 Inaddition to this, it was also found that systematically replacingR from La, Ce, Pr, Nd, and Sm in RFeAsO1−δ resulted ina gradual decreases in the a-axis lattice parameters and anincrease in superconducting transition temperature.23–28,36,37
Superconducting transition temperature (Tc) of different Fe-based superconductors is indeed correlated to their structuralproperties.36–40 A systematic trend between Tc and the Fe-As-Fe angles may be expected because the exchange couplings aredirectly related to the Fe-As-Fe bond angle and Fe-Fe/Fe-Asbond distances. It is found that the highest Tc is obtained whenthe Fe-As-Fe reaches the ideal value of 109.47◦ for the perfectFeAs tetrahedron with the least lattice distortion.36–40 Thissuggests that the most effective way to increase Tc in Fe-basedsuperconductors is to decrease the deviation of the Fe-As-Febond angle from the ideal FeAs tetrahedron, as the geometryof the FeAs tetrahedron might be correlated with the densityof states near the Fermi energy.
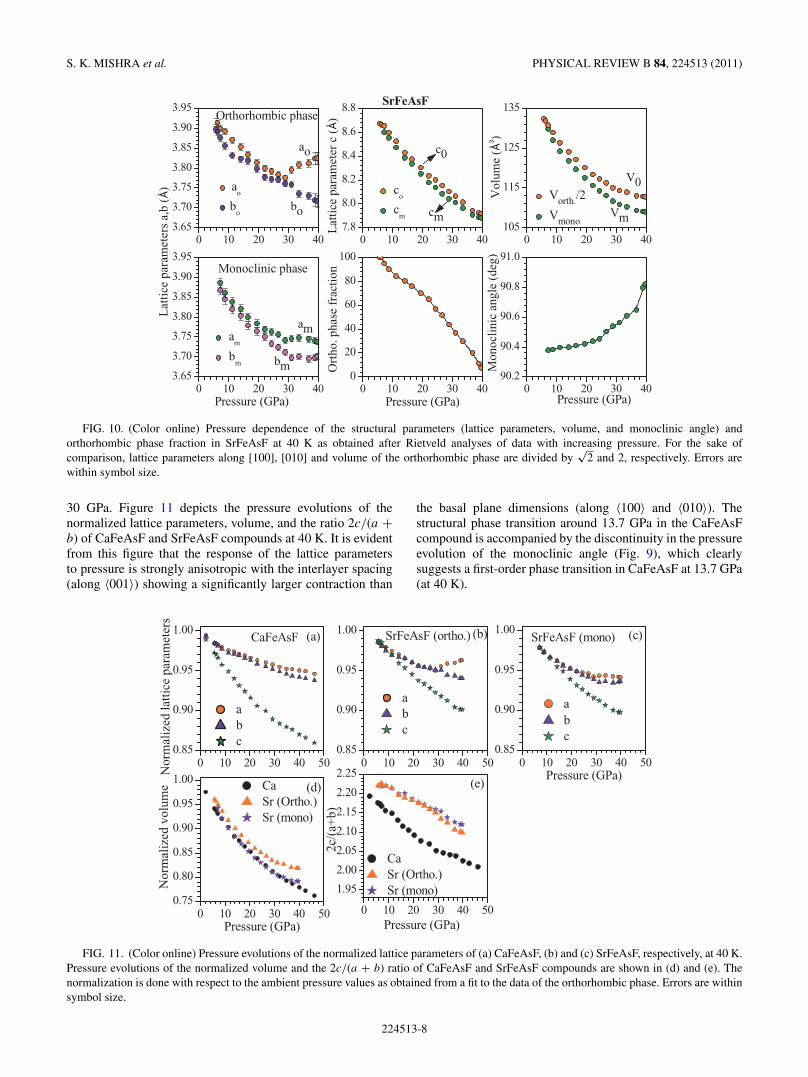
In view of this, we have carried out detailed structuralanalysis as a function of pressure. Figures 9 and 10 show the
pressure dependence of the structural parameters of CaFeAsFand SrFeAsF at 40 K. For easy comparison in Figs. 9–11, wehave used converted lattice parameters for the orthorhombicphase (a = ao/
√2, b = bo/
√2, and c = co) and for the
monoclinic phase (a = am, b = bm, and c = cm). It is clearfrom Figs. 9 and 10 that at 40 K on increasing pressure,the lattice parameters monotonically decrease in the entirerange of our measurements for CaFeAsF, while the a-latticeparameter of SrFeAsF exhibits anomalous increase beyond
0 10 20 30 403.6
3.7
3.8
3.9
0 10 20 30 40 507.2
7.6
8.0
8.4
0 10 20 30 4095
105
115
125
0 10 20 30 40 5090.0
90.5
91.0
91.5
ba
Orth
o.O
rtho.
CaFeAsF
CaFeAsF
CaFeAsF
Mono.
Mono.
Orth
o.
Mono.
Latti
ce p
aram
eter
s a,b
(Å)
CaFeAsF
Latti
ce p
aram
eter
c (Å
)
Vol
ume
(Å3 )
Pressure (GPa)
Mon
oclin
ic a
ngle
(deg
)
FIG. 9. (Color online) Pressure dependence of the structuralparameters (lattice parameters, volume, and monoclinic angle) ofCaFeAsF at 40 K as obtained after Rietveld analyses of data withincreasing pressure. For the sake of comparison, lattice parametersalong [100], [010] and volume of the orthorhombic phase are dividedby
√2 and 2, respectively, and lattice parameters of monoclinic phases
are plotted in a standard (cab: P 12/n1) setting. Errors are withinsymbol size.
224513-7
S. K. MISHRA et al. PHYSICAL REVIEW B 84, 224513 (2011)
0 10 20 30 403.65
3.70
3.75
3.80
3.85
3.90
3.95
0 10 20 30 407.8
8.0
8.2
8.4
8.6
8.8
0 10 20 30 40105
115
125
135
0 10 20 30 400
20
40
60
80
100
0 10 20 30 403.65
3.70
3.75
3.80
3.85
3.90
3.95
0 10 20 30 4090.2
90.4
90.6
90.8
91.0
bo
ao
SrFeAsF
ao
bo
Orthorhombic phase
cm
c0
co
cm
Lat
tice
par
amet
er c
(Å
)
Vm
V0 Vorth.
/2
Vmono
Vol
ume
(Å3 )
Pressure (GPa)
Ort
ho. p
hase
fra
ctio
n
Pressure (GPa)
bm
am a
m
bm
Monoclinic phase
Lat
tice
par
amet
ers
a,b
(Å)
Mon
ocli
nic
angl
e (d
eg)
Pressure (GPa)
FIG. 10. (Color online) Pressure dependence of the structural parameters (lattice parameters, volume, and monoclinic angle) andorthorhombic phase fraction in SrFeAsF at 40 K as obtained after Rietveld analyses of data with increasing pressure. For the sake ofcomparison, lattice parameters along [100], [010] and volume of the orthorhombic phase are divided by
√2 and 2, respectively. Errors are
within symbol size.
30 GPa. Figure 11 depicts the pressure evolutions of thenormalized lattice parameters, volume, and the ratio 2c/(a +b) of CaFeAsF and SrFeAsF compounds at 40 K. It is evidentfrom this figure that the response of the lattice parametersto pressure is strongly anisotropic with the interlayer spacing(along 〈001〉) showing a significantly larger contraction than
the basal plane dimensions (along 〈100〉 and 〈010〉). Thestructural phase transition around 13.7 GPa in the CaFeAsFcompound is accompanied by the discontinuity in the pressureevolution of the monoclinic angle (Fig. 9), which clearlysuggests a first-order phase transition in CaFeAsF at 13.7 GPa(at 40 K).
0 10 20 30 40 500.85
0.90
0.95
1.00
0 10 20 30 40 500.85
0.90
0.95
1.00
0 10 20 30 40 500.85
0.90
0.95
1.00
0 10 20 30 40 500.75
0.80
0.85
0.90
0.95
1.00
0 10 20 30 40 50
1.95
2.00
2.05
2.10
2.15
2.20
2.25
(a)
abc
Nor
mal
ized
latt
ice
para
met
ers
CaFeAsF (b)
abc
SrFeAsF (ortho.) (c)SrFeAsF (mono)
abc
Pressure (GPa)(d)
CaSr (Ortho.)Sr (mono)
CaSr (Ortho.)Sr (mono)
Nor
mal
ized
vol
ume
Pressure (GPa)
(e)
2c/(
a+b)
Pressure (GPa)
FIG. 11. (Color online) Pressure evolutions of the normalized lattice parameters of (a) CaFeAsF, (b) and (c) SrFeAsF, respectively, at 40 K.Pressure evolutions of the normalized volume and the 2c/(a + b) ratio of CaFeAsF and SrFeAsF compounds are shown in (d) and (e). Thenormalization is done with respect to the ambient pressure values as obtained from a fit to the data of the orthorhombic phase. Errors are withinsymbol size.
224513-8
PRESSURE DEPENDENCE OF THE LOW-TEMPERATURE . . . PHYSICAL REVIEW B 84, 224513 (2011)
0 10 20 30 4015
17
19
21
23
0 10 20 30 402.55
2.60
2.65
2.70
2.75
0 10 20 30 4060
80
100
120
0 10 20 30 402.1
2.2
2.3
2.4
2.5
Mono.
Mono.
Mono.
Ortho.
Ortho.
Ortho.
Mono.Ortho.
Pol
yhed
ral v
olum
e (Å
3 )
CaFeAsF
Fe-
Fe
(Å)
Fe-
As-
Fe
angl
es (
deg)
Pressure (GPa)F
e-A
s (Å
)
FIG. 12. (Color online) Pressure dependence of the polyhedralvolume, Fe-As-Fe bond angle, and Fe-Fe/Fe-As bond length ofCaFeAsF at 40 K as obtained after Rietveld analyses of data withincreasing pressure. Errors are within symbol size.
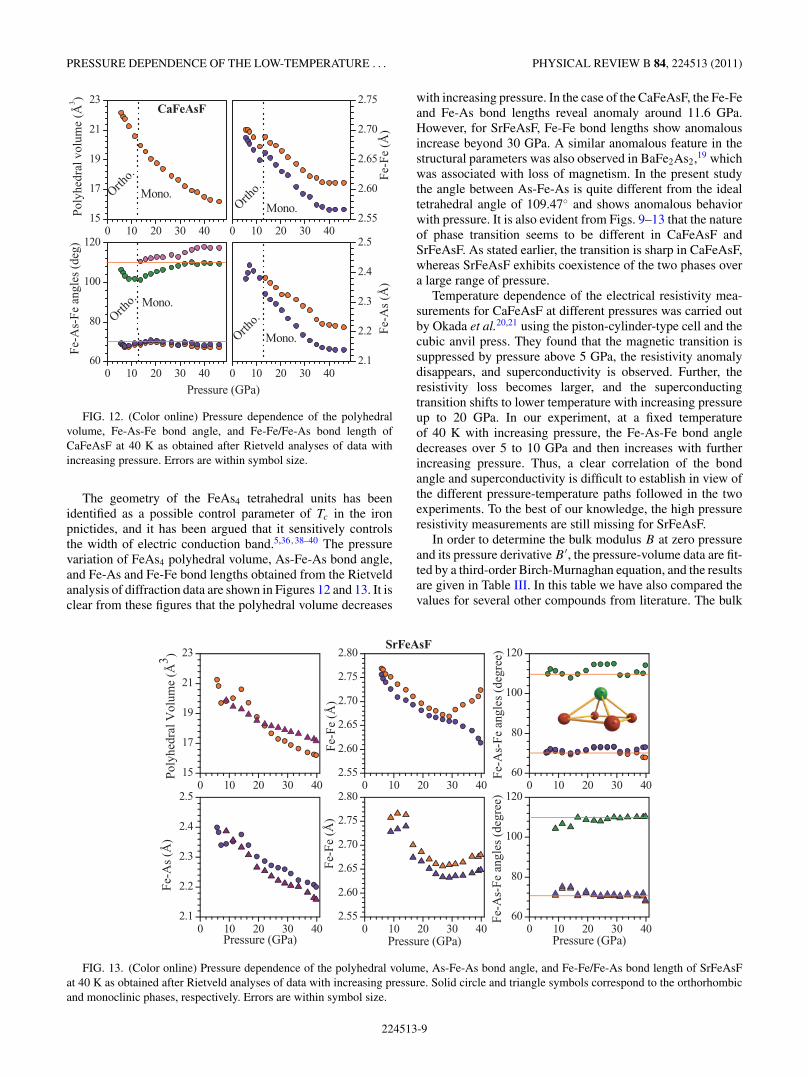
The geometry of the FeAs4 tetrahedral units has beenidentified as a possible control parameter of Tc in the ironpnictides, and it has been argued that it sensitively controlsthe width of electric conduction band.5,36,38–40 The pressurevariation of FeAs4 polyhedral volume, As-Fe-As bond angle,and Fe-As and Fe-Fe bond lengths obtained from the Rietveldanalysis of diffraction data are shown in Figures 12 and 13. It isclear from these figures that the polyhedral volume decreases
with increasing pressure. In the case of the CaFeAsF, the Fe-Feand Fe-As bond lengths reveal anomaly around 11.6 GPa.However, for SrFeAsF, Fe-Fe bond lengths show anomalousincrease beyond 30 GPa. A similar anomalous feature in thestructural parameters was also observed in BaFe2As2,19 whichwas associated with loss of magnetism. In the present studythe angle between As-Fe-As is quite different from the idealtetrahedral angle of 109.47◦ and shows anomalous behaviorwith pressure. It is also evident from Figs. 9–13 that the natureof phase transition seems to be different in CaFeAsF andSrFeAsF. As stated earlier, the transition is sharp in CaFeAsF,whereas SrFeAsF exhibits coexistence of the two phases overa large range of pressure.
Temperature dependence of the electrical resistivity mea-surements for CaFeAsF at different pressures was carried outby Okada et al.20,21 using the piston-cylinder-type cell and thecubic anvil press. They found that the magnetic transition issuppressed by pressure above 5 GPa, the resistivity anomalydisappears, and superconductivity is observed. Further, theresistivity loss becomes larger, and the superconductingtransition shifts to lower temperature with increasing pressureup to 20 GPa. In our experiment, at a fixed temperatureof 40 K with increasing pressure, the Fe-As-Fe bond angledecreases over 5 to 10 GPa and then increases with furtherincreasing pressure. Thus, a clear correlation of the bondangle and superconductivity is difficult to establish in view ofthe different pressure-temperature paths followed in the twoexperiments. To the best of our knowledge, the high pressureresistivity measurements are still missing for SrFeAsF.
In order to determine the bulk modulus B at zero pressureand its pressure derivative B ′, the pressure-volume data are fit-ted by a third-order Birch-Murnaghan equation, and the resultsare given in Table III. In this table we have also compared thevalues for several other compounds from literature. The bulk
0 10 20 30 4015
17
19
21
23
0 10 20 30 402.55
2.60
2.65
2.70
2.75
2.80
0 10 20 30 4060
80
100
120
0 10 20 30 402.1
2.2
2.3
2.4
2.5
0 10 20 30 402.55
2.60
2.65
2.70
2.75
2.80
0 10 20 30 4060
80
100
120
Pol
yhed
ral V
olum
e (Å
3 )
SrFeAsF
Fe-
Fe
(Å)
Fe-
As-
Fe
angl
es (
degr
ee)
Fe-
As-
Fe
angl
es (
degr
ee)
Fe-
As
(Å)
Pressure (GPa)
Fe-
Fe
(Å)
Pressure (GPa) Pressure (GPa)
FIG. 13. (Color online) Pressure dependence of the polyhedral volume, As-Fe-As bond angle, and Fe-Fe/Fe-As bond length of SrFeAsFat 40 K as obtained after Rietveld analyses of data with increasing pressure. Solid circle and triangle symbols correspond to the orthorhombicand monoclinic phases, respectively. Errors are within symbol size.
224513-9
S. K. MISHRA et al. PHYSICAL REVIEW B 84, 224513 (2011)
TABLE III. Comparison of the bulk modulus (B) and its pressure derivative (B ′) of various Fe-based compounds. The standard errors ofthe fit are given in brackets. In case of the orthorhombic phase of CaFeAsF, the fit resulted in large error bar in pressure derivative (B ′), and soit has been fixed at 4.0. The bulk modulus of monoclinic phase of CaFeAsF has been fitted with a fixed value of B ′ at 4.0 and also with varyingB ′, with the χ 2 = 0.6532 and 0.3569, respectively, which is significantly lower in the latter case.
Temperature Bulk modulus Pressure derivative PressureCompound (K) at P = 0 (GPa) of bulk modulus range (GPa) Phase Reference
modulus in the high-pressure monoclinic phases of CaFeAsFappears larger than that in the orthorhombic phase. However,the values of the bulk moduli for the two phases of SrFeAsF arequite similar. The B values of tetragonal SmFeAsO0.81F0.19
38
and LaFeAsO0.9F0.139 are somewhat lower than those of
CaFeAsF and SrFeAsF. The bulk modulus values of othermaterials such as FeSe and Fe1.03Se0.57Te0.43 are much smallerthan those of FeAs compounds.
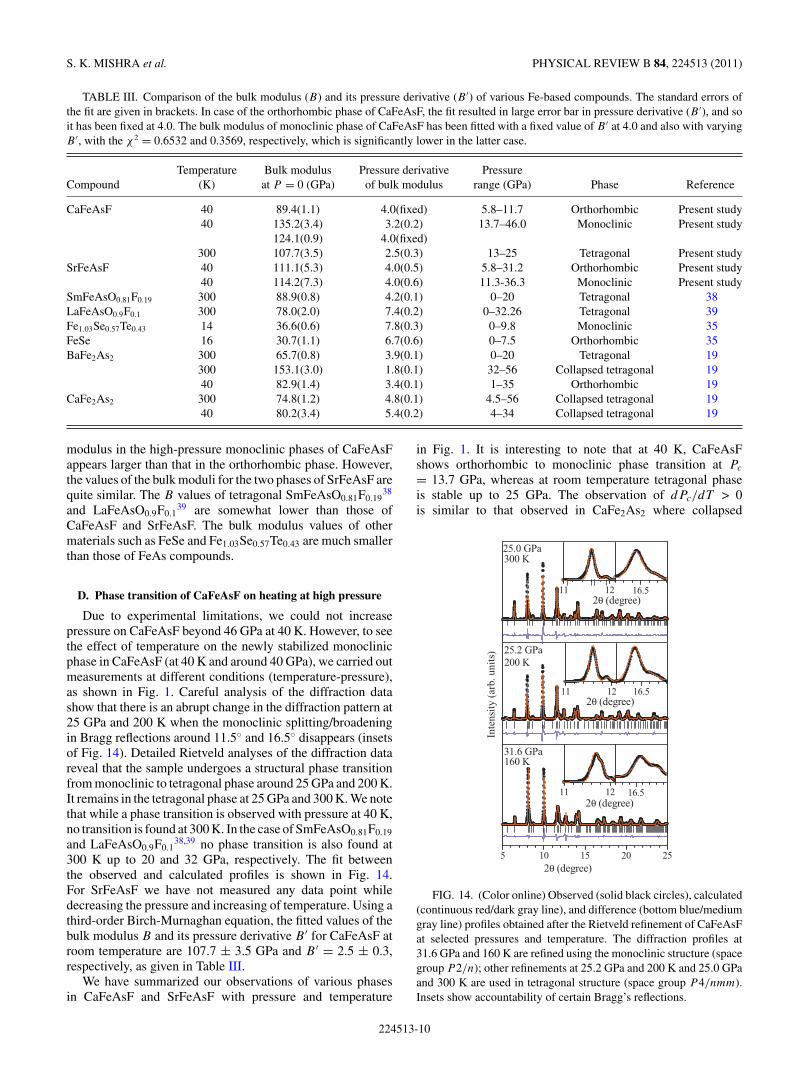
D. Phase transition of CaFeAsF on heating at high pressure
Due to experimental limitations, we could not increasepressure on CaFeAsF beyond 46 GPa at 40 K. However, to seethe effect of temperature on the newly stabilized monoclinicphase in CaFeAsF (at 40 K and around 40 GPa), we carried outmeasurements at different conditions (temperature-pressure),as shown in Fig. 1. Careful analysis of the diffraction datashow that there is an abrupt change in the diffraction pattern at25 GPa and 200 K when the monoclinic splitting/broadeningin Bragg reflections around 11.5◦ and 16.5◦ disappears (insetsof Fig. 14). Detailed Rietveld analyses of the diffraction datareveal that the sample undergoes a structural phase transitionfrom monoclinic to tetragonal phase around 25 GPa and 200 K.It remains in the tetragonal phase at 25 GPa and 300 K. We notethat while a phase transition is observed with pressure at 40 K,no transition is found at 300 K. In the case of SmFeAsO0.81F0.19
and LaFeAsO0.9F0.138,39 no phase transition is also found at
300 K up to 20 and 32 GPa, respectively. The fit betweenthe observed and calculated profiles is shown in Fig. 14.For SrFeAsF we have not measured any data point whiledecreasing the pressure and increasing of temperature. Using athird-order Birch-Murnaghan equation, the fitted values of thebulk modulus B and its pressure derivative B ′ for CaFeAsF atroom temperature are 107.7 ± 3.5 GPa and B ′ = 2.5 ± 0.3,respectively, as given in Table III.
We have summarized our observations of various phasesin CaFeAsF and SrFeAsF with pressure and temperature
in Fig. 1. It is interesting to note that at 40 K, CaFeAsFshows orthorhombic to monoclinic phase transition at Pc
= 13.7 GPa, whereas at room temperature tetragonal phaseis stable up to 25 GPa. The observation of dPc/dT > 0is similar to that observed in CaFe2As2 where collapsed
5 10 15 20 25
11 12 16.5
11 12 16.5
11 12 16.5
160 K
2θ (degree)
Inte
nsity
(arb
. uni
ts)
31.6 GPa
25.0 GPa
200 K25.2 GPa
300 K
2θ (degree)
2θ (degree)
2θ (degree)
FIG. 14. (Color online) Observed (solid black circles), calculated(continuous red/dark gray line), and difference (bottom blue/mediumgray line) profiles obtained after the Rietveld refinement of CaFeAsFat selected pressures and temperature. The diffraction profiles at31.6 GPa and 160 K are refined using the monoclinic structure (spacegroup P 2/n); other refinements at 25.2 GPa and 200 K and 25.0 GPaand 300 K are used in tetragonal structure (space group P 4/nmm).Insets show accountability of certain Bragg’s reflections.
224513-10
PRESSURE DEPENDENCE OF THE LOW-TEMPERATURE . . . PHYSICAL REVIEW B 84, 224513 (2011)
tetragonal phase transition occurs at a lower pressure (0.3GPa) at a low temperature (50 K) in comparison to 1.7 GPaat 300 K. However, this behavior of dPc/dT may not holdfor Ba/Sr compounds.19 In addition to this, the transition to alower symmetry phase (orthorhombic to monoclinic) in 1111(CaFeAsF/SrFeAsF) compound under pressure is in contrastwith the high symmetry phase (orthorhombic to tetragonal) in122 (BaFe2As2/CaFe2As2)-type compounds.
IV. CONCLUSION
We have investigated the effect of pressure on the crystalstructure and structural phase transition behavior at 40 Kin CaFeAsF and SrFeAsF using powder-synchrotron x-raydiffraction and Rietveld analysis technique. We found thatboth the compounds undergo structural phase transition fromorthorhombic to monoclinic phase with increasing pressure.CaFeAsF undergoes a fairly sharp orthorhombic to monoclinicphase transition at 13.7 GPa with increasing pressure. On theother hand, SrFeAsF exhibits coexistence of orthorhombicand monoclinic phases over a large pressure range from 9
to 39 GPa. The coexistence of the two phases indicates thatthe transition is of first order. On heating from 40 K at highpressure, CaFeAsF undergoes monoclinic to tetragonal phasetransition around 25 GPa and 200 K. Further, it does not showany post-tetragonal phase transition up to 25 GPa at 300 K.We note that the 1111-compound (CaFeAsF) undergoes phasetransition to a lower symmetry phase (i.e., orthorhombic tomonoclinic) under pressure, in contrast with the transition toa higher symmetry phase (i.e., orthorhombic to tetragonal)observed in 122-type compounds (BaFe2As2 and CaFe2As2).We have also determined the bulk modulii in these compoundsthat confirm their soft nature analogous to other compounds inthe FeAs family.
ACKNOWLEDGMENTS
R. Mittal and S. K. Mishra thank the Department of Scienceand Technology (DST), India for providing financial supportto carry out synchrotron x-ray diffraction at the EuropeanSynchrotron Radiation Facility, Grenoble, France.
*[email protected]. Izyumov and E. Kurmaev, High-Tc SuperconductorsBased on FeAs Compounds, (Springer, Verlag, Hamburg,2010); J. S. Schilling, in Handbook of High Tempera-ture Superconductivity: Theory and Experiments, edited byJ. R. Schrieffer and J. S. Brooks (Spinger Verlag, Hamburg,2007); H. Takashi and N. Mori, in Studies of High TemperatureSuperconductors, edited by A. Narlikar (Nova Science, New York,1996).
2J. Paglion and R. L. Greene, Nat. Phys. 6, 645 (2010).3I. I. Mazin and M. D. Johannes, Nat. Phys. 5, 141 (2009);G. Yu, Y. Li, E. M. Motoyama, and M. Greven, ibid. 5, 873 (2009).
4F. Wang and D.-H. Lee, Science 332, 200 (2011).5J. Zhao, Q. Huang, C. D. Cruz, S. Li, J. W. Lynn, Y. Chen, M. A.Green, G. F. Chen, G. Li, Z. Li, J. L. Luo, N. L. Wang, and P. Dai,Nature Materials 7, 953 (2008).
6C. de la Cruz, Q. Huang, J. W. Lynn, J. Li, W. Ratcliff II, J. L.Zarestky, H. A. Mook, G. F. Chen, J. L. Luo, N. L. Wang, andP. Dai1, Nature (London) 453, 899 (2008).
7I. I. Mazin, D. J. Singh, M. D. Johannes, and M. H. Du, Phys. Rev.Lett. 101, 057003 (2008); T. Yildirim, ibid. 101, 057010 (2008);C. Feng, H. Yao, W. F. Tsai, J. P. Hu, and S. A. Kivelson, Phys. Rev.B 77, 224509 (2009).
8Y. Kamihara, T. Watanabe, M. Hirano, and H. Hosono, J. Am.Chem. Soc. 130, 3296 (2008).
9K. Ishida, Y. Nakaii, and H. Hosono, J. Phys. Soc. Jpn 78, 062001(2009); T. Imai, K. Ahilan, F. L. Ning, T. M. McQueen, andR. J. Cava, Phys. Rev. Lett. 102, 177005 (2009).
10X. H. Chen, T. Wu, G. Wu, R. H. Liu, H. Chen, and D. F. Fang,Nature (London) 453, 761 (2008).
11M. Rotter, M. Tegel, and D. Johrendt, Phys. Rev. Lett. 101, 107006(2008).
12R. Mittal, L. Pintschovius, D. Lamago, R. Heid, K.-P. Bohnen,D. Reznik, S. L. Chaplot, Y. Su, N. Kumar, S. K. Dhar,
A. Thamizhavel, and Th. Brueckel, Phys. Rev. Lett. 102, 217001(2009).
13R. Mittal, Y. Su, S. Rols, M. Tegel, S. L. Chaplot, H. Schober,T. Chatterji, D. Johrendt, and Th. Brueckel, Phys. Rev. B 78, 224518(2008).
14H. Takahashi, K. Igawa, K. Arii, Y. Kamihara, M. Hirano, andH. Hosono, Nature (London) 453, 376 (2008).
15M. S. Torikachvili, S. L. Bud’ko, N. Ni, and P. C. Canfield, Phys.Rev. Lett. 101, 057006 (2008).
16T. Park, E. Park, H. Lee, T. Klimczuk, E. D. Bauer, F. Ronning,and J. D. Thompson, J. Phys.: Condens. Matter 20, 322204 (2008);P. L. Alireza, Y. T. Chris Ko, J. Gillett, C. M. Petrone, J. M. Cole,G. G. Lonzarich, and S. E. Sebastian, J. Phys.: Condens. Matter 21,012208 (2009).
17C. F. Miclea, M. Nicklas, H. S. Jeevan, D. Kasinathan, Z. Hossain,H. Rosner, P. Gegenwart, C. Geibel, and F. Steglich, Phys. Rev.B 79, 212509 (2009); T. Terashima, M. Kimata, H. Satsukawa,A. Harada, K. Hazama, S. Uji, H. S. Suzuki, T. Matsumoto, andK. Murata, J. Phys. Soc. Jpn. 78, 083701 (2009).
18H. Okada, K. Igawa, H. Takahashi, Y. Kamihara, M. Hirano,H. Hosono, K. Matsubayashi, and Y. Uwatoko, J. Phys. Soc. Jpn.77, 113712 (2008).
19R. Mittal, S. K. Mishra, S. L. Chaplot, S. V. Ovsyannikov,E. Greenberg, D. M. Trots, L. Dubrovinsky, Y. Su, Th. Brueckel,S. Matsuishi, H. Hosono, and G. Garbarino, Phys. Rev B 83, 054503(2011) and references therein.
20H. Okada, H. Takahashi, S. Matsuishi, M. Hirano, H. Hosono,K. Matsubayashi, Y. Uwatoko, and H. Takahashi, Phys. Rev. B 81,054507 (2010).
21H. Okada, H. Takahashi, H. Takahashi, S. Matsuishi, M. Hirano,and H. Hosono, J. of Phys.: Confer. Series 200, 012151 (2010).
22Y. Xiao, Y. Su, R. Mittal, T. Chatterji, T. Hansen, C. M. N. Kumar,S. Matsuishi, H. Hososno, and Th. Brueckel, Phys. Rev. B 79,060504(R) (2009).
S. K. MISHRA et al. PHYSICAL REVIEW B 84, 224513 (2011)
23T. Hanna, Y. Muraba, S. Matsuishi, K. Kodama, S.-i. Shamoto, andH. Hosono, Phys. Rev. B 84, 024521 (2011).
24Y. Xiao, Y. Su, R. Mittal, T. Chatterji, T. Hansen, S. Price, C. M.N. Kumar, J. Persson, S. Matsuishi, Y. Inoue, H. Hososno, andTh. Brueckel, Phys. Rev. B 81, 094523 (2010).
25S. Matsuishi, Y. Inoue, T. Nomura, H. Yanagi, M. Hirano, andH. Hosono, J. Am. Chem. Soc. 130, 14428 (2008).
26T. Nomura, Y. Inoue, S. Matsuishi, M. Hirano, J. E. Kim, K. Kato,M. Takata, and H. Hosono, Supercond. Sci. Technol. 22, 055016(2009).
27G. Wu, Y. L. Xie, H. Chen, M. Zhong, R. H. Liu, B. C. Shi, Q. J.Li, X. F. Wang, T. Wu, Y. J. Yan, J. J. Ying, and X. H. Chen, J. ofPhys: Conden. Matter 21, 142203 (2009); L.-F. Zhu and B.-G. Liu,Euro Phys. Lett. 85, 67009 (2009).
28X. Zhu, F. Han, P. Cheng, G. Mu, B. Shen, and H.-H. Wen, EuroPhys. Lett. 85, 17011 (2009); P. Cheng, B. Shen, G. Mu, X. Zhu,F. Han, B. Zeng, and H.-H. Wen, Europhys. Lett. 85, 67003 (2009).
29S. D. Wilson, Z. Yamani, C. R. Rotundu, B. Freelon, E. Bourret-Courchesne, and R. J. Birgeneau, Phys. Rev. B 79, 184519(2009); J.-Q. Yan, A. Kreyssig, S. Nandi, N. Ni, S. L. Bud’ko,A. Kracher, R. J. McQueeney, R. W. McCallum, T. A. Lograsso,A. I. Goldman, and P. C. Canfield, ibid. 78, 024516 (2008).
30A. I. Goldman, D. N. Argyriou, B. Ouladdiaf, T. Chatterji,A. Kreyssig, S. Nandi, N. Ni, S. L. Bud’ko, P. C. Canfield, andR. J. McQueeney, Phys. Rev. B 78, 100506(R) (2008); Y. Xiao,Y. Su, M. Meven, R. Mittal, C. M. N. Kumar, T. Chatterji, S. Price,J. Persson, N. Kumar, S. K. Dhar, A. Thamizhavel, andTh. Brueckel, ibid. 80, 174424 (2009).
31A. P. Hammersley, Report No. EXP/AH/95-01 (1995).32J. Rodriguez-Carvajal, Physica B 192, 55 (1992).33N. Tateiwa and Y. Haga, Rev. Sci. Instrum. 80, 123901 (2009).34W. Bao, Y. Qiu, Q. Huang, M. A. Green, P. Zajdel, M. R.
Fitzsimmons, M. Zhernenkov, S. Chang, M. Fang, B. Qian, E. K.Vehstedt, J. Yang, H. M. Pham, L. Spinu, and Z. Q. Mao, Phys. Rev.Lett. 102, 247001 (2009).
35N. C. Gresty, Y. Takabayashi, A. Y. Ganin, M. T. McDonald,J. B. Claridge, D. Giap, Y. Mizuguchi, Y. Takano, T. Kagayama,Y. Ohishi, M. Takata, M. J. Rosseinsky, S. Margadonna,and K. Prassides, J. Am. Chem. Soc. 131, 16944 (2009);S. Margadonna, Y. Takabayashi, Y. Ohishi, Y. Mizuguchi,Y. Takano, T. Kagayama, T. Nakagawa, M. Takata, and K. Prassides,Phys. Rev. B 80, 064506 (2009).
36Clarina de la Cruz, W. Z. Hu, Shiliang Li, Q. Huang, J. W. Lynn,M. A. Green, G. F. Chen, N. L. Wang, H. A. Mook, Qimiao Si, andPengcheng Dai, Phys. Rev. Lett. 104, 017204 (2010).
37C. R. Rotundu, D. T. Keane, B. Freelon, S. D. Wilson, A. Kim, P. N.Valdivia, E. Bourret-Courchesne, and R. J. Birgeneau, Phys. Rev.B 80, 144517 (2009) and references therein.
38G. Garbarino, R. Weht, A. Sow, A. Sulpice, P. Toulemonde,M. Alvarez-Murga, P. Strobel, P. Bouvier, M. Mezouar, andM. Nunez-Regueiro, Phys. Rev. B 84, 024510 (2011).
39G. Garbarino, P. Toulemonde, M. Alvarez-Murga, A. Sow,M. Mezouar, and M. Nunez-Regueiro, Phys. Rev. B 78, 100507(2008).
40K. Horigane, H. Hiraka, and K. Ohoyama, J. Phys. Soc. Jpn 78,074718 (2009).