Journal of the O PTICAL of SOCIETY AMERICA VOLUME 48, NUMBER 11 NOVEMBER, 1958 Pressure Modulation of Infrared Absorption.* I. Entire Vibration-Rotation Bands JAMES C. GFERT AND DUDLEY WILLIAMS Department of Physics, The Ohio State University, Ohio (Received June 6, 1958) The effects of pressure modulation on the total absorption JA (v)dv of rotation-vibration bands of carbon monoxide, nitrous oxide, methane, and propane have been investigated. Although the ultimate limitations of pressure modulation as a detection technique have not yet been completely established, the present results are in qualitative agreement with predictions based on the earlier studies of Howard, Burch, and Williams. Modulation is of use in distinguishing weak absorption bands from background absorption in the atmosphere. In strong absorption bands, the wings are enhanced in the modulated spectrum; in weak bands, the modulated spectrum approximates that obtained by conventional methods. Possible applications of pressure modulation are suggested. INTRODUCTION THE advantages of modulation techniques in the T radio-frequency and microwave regions are familiar. The Stark effect and the Zeeman effect have been employed in these regions but are not applicable in the infrared region, since the ordinarily available electric and magnetic fields do not produce sufficiently large splitting of spectral lines. The present study was undertaken with a view to employing periodic pressure variation as a method of modulating the absorption spectra of gases. The success of such a technique might find practical application in the routine study of the spectra of gases and might with suitable arrangements also provide a sensitive method of obtaining "curves of growth" of atmospheric absorption bands. The work of Howard e al. 1 had shown the possibility of expressing the total or integrated absorption JA ()dv of an entire band in terms of such sample parameters * Supported in part by the U. S. Air Force through the Geo- physics Research Directorate of Air Force Cambridge Research Center, Air Research and Development Command. 1 Howard, Burch, and Williams, J. Opt. Soc. Am. 46,186 (1956); 46, 237 (1956); 46, 242 (1956); 46, 334 (1956); 46, 452 (1956). Note.-These papers give a review of the extensive literature deal- ing with band and line intensitites and present a comparison of relations (1) with expressions anticipated by earlier theoretical band models. It should be noted that the present work does not depend on the exact form of the functional relation given in (1); the important point is that JA (v)dv=f(P,p,w) and fA (v)dv is therefore susceptible to pressure modulation. Variation of line in- tensities will be considered in a later paper. as the total pressure P the partial pressure of the absorbing gas p, and the absorber concentration w. In studies of water vapor and carbon dioxide, it was found to be possible to fit observed values of total absorption to expressions of the following forms: for weak bands, f A (v)dv= cw(P+p)k (1) for strong bands, f A (v)dv= C+D logw +K log(P+p), where c, k, C, D, and K are empirically determined constants. In these expressions A(v) represents the fractional absorption at frequency v and the integration includes the entire band; it was shown that for wide limits of slit widths A(v)dv=fA'(v)dv where A'(v) is the effective fractional absorption in the small frequency interval centered at frequency v. From (1) it can be seen that the total absorption of an entire band can be modulated by periodic variation of P, p, or w. Earlier studies 2 had shown that the total absorption of an entire band is also slightly dependent on absolute temperature. This dependence is probably even some- 2 J. N. Howard and Robert M. Chapman, J. Opt. Soc. Am. 42, 423 (1952); 42, 856 (1952). 765
Transcript
Journal of the
O PTICALof
SOCIETYAMERICA
VOLUME 48, NUMBER 11 NOVEMBER, 1958
Pressure Modulation of Infrared Absorption.* I. Entire Vibration-Rotation BandsJAMES C. GFERT AND DUDLEY WILLIAMS
Department of Physics, The Ohio State University, Ohio(Received June 6, 1958)
The effects of pressure modulation on the total absorption JA (v)dv of rotation-vibration bands of carbonmonoxide, nitrous oxide, methane, and propane have been investigated. Although the ultimate limitationsof pressure modulation as a detection technique have not yet been completely established, the presentresults are in qualitative agreement with predictions based on the earlier studies of Howard, Burch, andWilliams. Modulation is of use in distinguishing weak absorption bands from background absorption in theatmosphere. In strong absorption bands, the wings are enhanced in the modulated spectrum; in weak bands,the modulated spectrum approximates that obtained by conventional methods. Possible applications ofpressure modulation are suggested.
INTRODUCTION
THE advantages of modulation techniques in theT radio-frequency and microwave regions arefamiliar. The Stark effect and the Zeeman effect havebeen employed in these regions but are not applicablein the infrared region, since the ordinarily availableelectric and magnetic fields do not produce sufficientlylarge splitting of spectral lines. The present study wasundertaken with a view to employing periodic pressurevariation as a method of modulating the absorptionspectra of gases. The success of such a technique mightfind practical application in the routine study of thespectra of gases and might with suitable arrangementsalso provide a sensitive method of obtaining "curves ofgrowth" of atmospheric absorption bands.
The work of Howard e al.1 had shown the possibilityof expressing the total or integrated absorption JA ()dvof an entire band in terms of such sample parameters
* Supported in part by the U. S. Air Force through the Geo-physics Research Directorate of Air Force Cambridge ResearchCenter, Air Research and Development Command.
1 Howard, Burch, and Williams, J. Opt. Soc. Am. 46,186 (1956);46, 237 (1956); 46, 242 (1956); 46, 334 (1956); 46, 452 (1956).Note.-These papers give a review of the extensive literature deal-ing with band and line intensitites and present a comparison ofrelations (1) with expressions anticipated by earlier theoreticalband models. It should be noted that the present work does notdepend on the exact form of the functional relation given in (1);the important point is that JA (v)dv=f(P,p,w) and fA (v)dv istherefore susceptible to pressure modulation. Variation of line in-tensities will be considered in a later paper.
as the total pressure P the partial pressure of theabsorbing gas p, and the absorber concentration w. Instudies of water vapor and carbon dioxide, it was foundto be possible to fit observed values of total absorptionto expressions of the following forms:
for weak bands, f A (v)dv= cw(P+p)k
(1)for strong bands, f A (v)dv= C+D logw
+K log(P+p),
where c, k, C, D, and K are empirically determinedconstants.
In these expressions A(v) represents the fractionalabsorption at frequency v and the integration includesthe entire band; it was shown that for wide limits ofslit widths A(v)dv=fA'(v)dv where A'(v) is theeffective fractional absorption in the small frequencyinterval centered at frequency v. From (1) it can be seenthat the total absorption of an entire band can bemodulated by periodic variation of P, p, or w.
Earlier studies2 had shown that the total absorptionof an entire band is also slightly dependent on absolutetemperature. This dependence is probably even some-
2 J. N. Howard and Robert M. Chapman, J. Opt. Soc. Am. 42,423 (1952); 42, 856 (1952).
765
J. C. GILFERT AND D. WILLIAMSV
7SPECTROMETERENTRANCE SLIT
FIG. 1. Schematic diagram of modulation equipment.
what less than the T dependence predicted from theo-retical considerations of single lines.3 Hence the depar-ture from isothermal conditions in the sample can beneglected in considering the total absorption of anentire band provided temperature changes are small.
For an isothermal process in which a gas is compressedfrom volume V0 to volume V, as suggested in Fig. 1,one may write Vo/V=P/Po=p/po=wIwo. For such acase the equations in (1) reduce to the forms,
for weak bands, fA (v)dv= CP(k+i) |
for strong bands, fA (v)dv= C2+logPD+K
absorption cell. As the shaft rotated, the pressure P ofthe gas in the absorption cell was modulated approxi-mately sinusoidally at 8 cps.
The optical system formed the first image of theNernst glower or incandescent filament at the center ofthe absorption cell and the second image at the entranceslit of a Perkin-Elmer Model 12C spectrometer. Withan absorbing gas in the absorption cell, the radiationreaching the detector in the spectrograph had an 8-cpscomponent. The amplifier employed was a Perkin-ElmerModel 107; the output signal from the amplifier wasrectified with a Perkin-Elmer mechanical rectifier drivenby the 8-rps shaft. The mechanical rectifier was alignedwith the eccentric so that only those signal componentsin phase with pressure modulation were integrated inthe output filter.
After preliminary tests had demonstrated that themodulation technique was basically sound, steps weretaken to maximize the amplitude of the pressure modu-lation by filling all "dead space" in the reservoir with amachined aluminum block and by reducing the length
(2)
Equations (2) apply to a modulation of the pressure ina cell of fixed length, for which w is directly proportionalto p at a given temperature. The constants C, and C2depend upon the empirical constants in (1) and uponthe initial values of Po, pa, and wo. For an adiabaticprocess, the corresponding equations invlove y in addi-tion to the other quantities in (2). From (2) the modu-lation of total absorption produced by a given amplitudeof total pressure variation can readily be calculated.
Equations (2) give little information concerning theshape of an observed absorption band; however, theconstant C2 includes constant C in (1), which is associ-ated with the "black" central portions of a strong bandwhere absorption is complete. These portions of a strongband are not affected by changes in total pressure P;therefore, any modulation effects would be expected tooccur in the wings of the band.
EXPERIMENTAL METHODS
A schematic diagram of the apparatus is shown inFig. 1. The shaft speed of a 1-hp, 1725-rpm motor wasreduced to approximately 8 rps by means of a pulleysystem. An eccentric mounted on the 8-rps shaft wasconnected by an aluminum rod to the center of a circularneoprene diaphragm; the eccentric was adjustable infive steps between 1 in. and 2 in. from the shaft. Thediaphragm was edge mounted to a reservoir consistingof a 3.5-in. length of 8-in. i.d. brass tubing, which wasconnected by a short length of flexible tubing to the
3 V. Weisskopf, Z. Physik. 75, 287 (1932).
FIG. 2. Conventional and modulated spectra of the carbon mon-oxide spectrum. In part (A), w= 12 atmos-cm of CO; in part (B),w= 1.2 atmos-cm. Total pressure P= 1 atmos. Nitrogen was usedas a "broadening gas." Prnax/Pmin= 1.3.
(B)CO 1.25 ATMO-CM
I' X J
111ll II 1-1 u I IW 8 8 8 Q 8 °0 -0 8 °0
X T 11 10 ,N , N N N
766 Vol. 48
November 1958 PRESSURE MODULATION OF
of the flexible coupling tube. From volume considera-tions, an isothermal pressure ratio Pmax/Pmin of 1.6 wascalculated on the assumption that the neoprene dia-phragm was taut throughout the stroke; a static pres-sure ratio of 1.4 was actually obtained. In normal opera-tion a mixture of gases with a total pressure of 1 atmoswas introduced; the average pressure during a totalcycle was found to be 0.864 atmos. A simple calculationindicated that reconciliation of the measured para-meters required the assumption that after a few cyclesthe average temperature of the gas over the modulationcycle becomes equal to the ambient temperature. In thepresent study no measurement of "instantaneous"pressures or temperatures over the cycle was attempted.
One serious shortcoming of the present experimentalarrangement was imposed by the use of the neoprenediaphragm. The diaphragms employed showed rapidfatigue for large displacements and hence limited thepressure ratios obtainable. A further disadvantage ofthe use of a flexible diaphragm was that total pressuresof the order of 1 atmos had to be employed since theouter surface of the diaphragm was exposed to theatmosphere itself. A different form of compressor hasbeen planned for future experiments. An improvedmethod of filling is also indicated. The present methodrequires nitrogen purging of the entire system followedby admission of known volumes of the absorbing gas.The composition of the final mixture is inferred eitherfrom the constituent volumes or by comparison ofJfA'(v)dv of the conventional spectrum with a calibra-tion curve. Thorough mixing of the sample is assuredby operating the pressure modulator for several minutes.
RESULTS
The apparatus described above has been used toobtain prism spectra of several typical gases. One of thepossible advantages of a modulation system is the eli-mination of background absorption due to atmosphericgases-chiefly water vapor and carbon dioxide. Com-parison of the results obtained by modulation methodswith those obtained by conventional chopping tech-niques on the same samples are shown in Figs. 2 to 5.The conventional spectra were obtained with the normal13-cps chopper for which the Model 107 amplifier wasdesigned. The modulated spectra were obtained with8-cps modulation; at this frequency, the amplifierresponse was approximately 0.9 that obtained at 13cps. The decision to use 8 cps for the modulator wasbased on power considerations and on the limitationson the life of the neoprene diaphragms. The gain settingof the amplifier used for obtaining the modulated spectratraces was 5.4 times that used for the conventionalspectra; since no noise is visible in the background, itwould appear that additional gain could be effectivelyemployed.
In Fig. 2 are shown the results obtained for carbonmonoxide. The upper traces show the familiar atmos-pheric bands of carbon dioxide and water vapor with
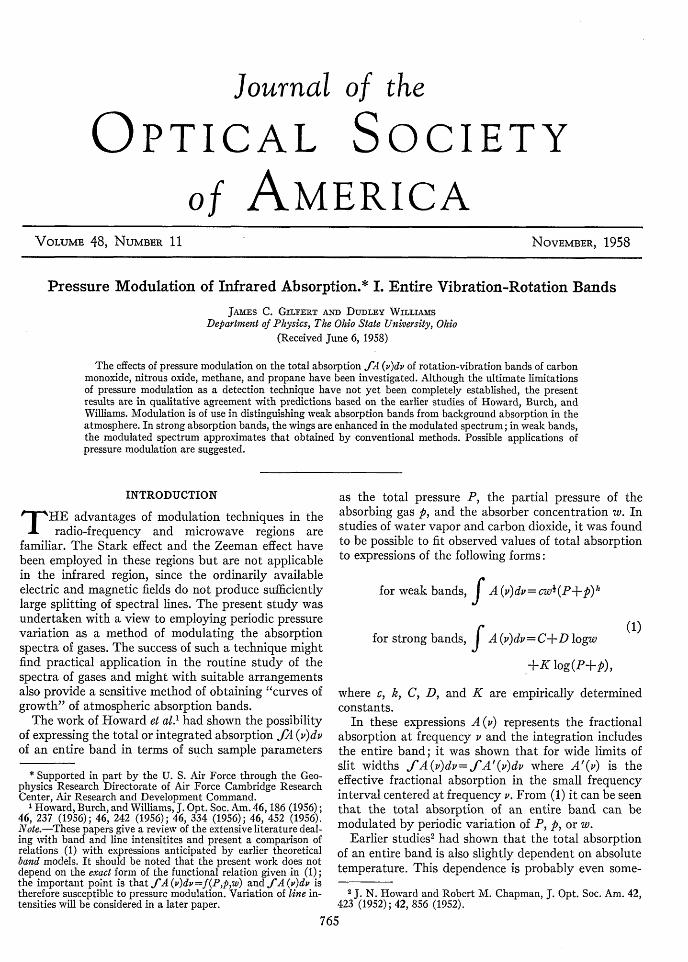
FIG. 3. Conventional and modulated spectra of nitrous oxide.In part (A), w= 12 atmos-cm; in part (B), w= 1.2 atmos-cm inpart (C), w=0.12 atmos-cm. Total pressure with N added= 1atmos .P,,a/Pm in= 1 .3.
INFRARED ABSORPTION 767
J. C. GILFERT AND D. WILLIAMS
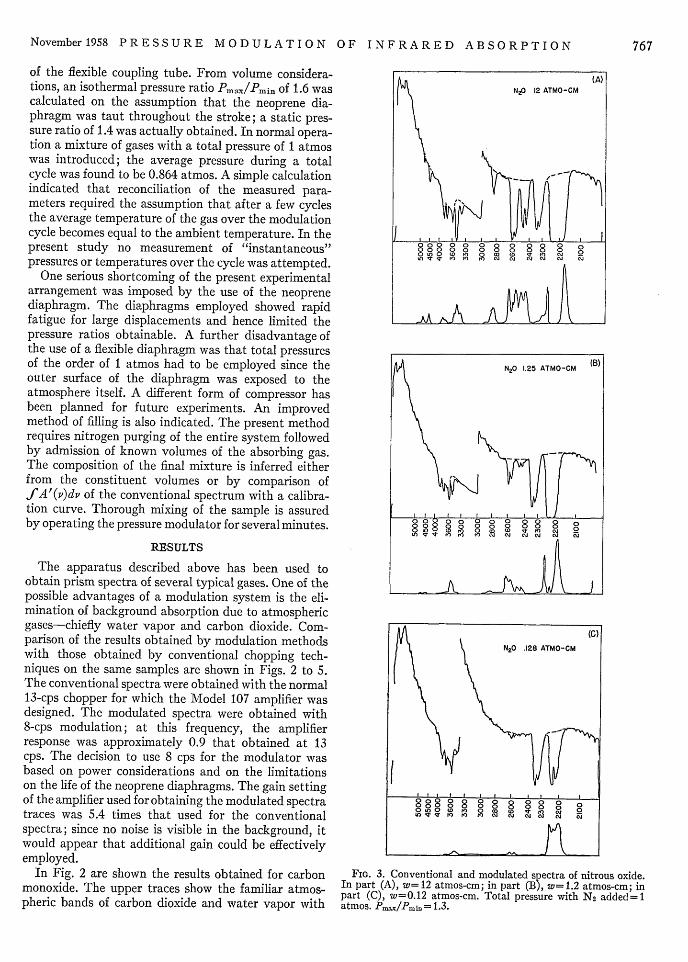
FIG. 4. Conventionalsorber concentration w,same as in Fig. 2.
and modulated spectra of methane. Ab-total pressure P, and Pa/Pmin are the
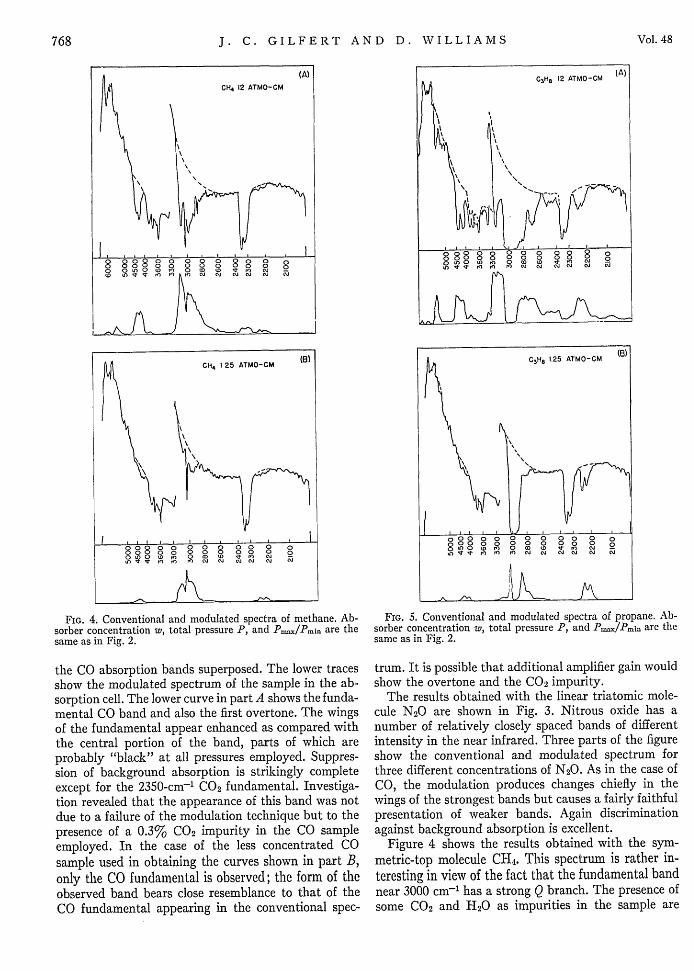
FIG. 5. Conventional and modulated spectra of propane. Ab-sorber concentration w, total pressure P, and Prnax/Pmi are thesame as in Fig. 2.
the CO absorption bands superposed. The lower tracesshow the modulated spectrum of the sample in the ab-sorption cell. The lower curve in part A shows the funda-mental CO band and also the first overtone. The wingsof the fundamental appear enhanced as compared withthe central portion of the band, parts of which areprobably "black" at all pressures employed. Suppres-sion of background absorption is strikingly completeexcept for the 2350-cm-l CO2 fundamental. Investiga-tion revealed that the appearance of this band was notdue to a failure of the modulation technique but to thepresence of a 0.3% CO2 impurity in the CO sampleemployed. In the case of the less concentrated COsample used in obtaining the curves shown in part B,only the CO fundamental is observed; the form of theobserved band bears close resemblance to that of theCO fundamental appearing in the conventional spec-
trum. It is possible that additional amplifier gain wouldshow the overtone and the CO 2 impurity.
The results obtained with the linear triatomic mole-cule N 20 are shown in Fig. 3. Nitrous oxide has anumber of relatively closely spaced bands of differentintensity in the near infrared. Three parts of the figureshow the conventional and modulated spectrum forthree different concentrations of N 20. As in the case ofCO, the modulation produces changes chiefly in thewings of the strongest bands but causes a fairly faithfulpresentation of weaker bands. Again discriminationagainst background absorption is excellent.
Figure 4 shows the results obtained with the sym-metric-top molecule CH4. This spectrum is rather in-teresting in view of the fact that the fundamental bandnear 3000 cm-l has a strong Q branch. The presence ofsome CO2 and H20 as impurities in the sample are
CH4 1 25 ATMO-CM (3)
8 , 8 8 a, 8 a aU0 8 it 0f re 0) ,i e0CJLI t
Vol. 48768
November1958 PRESSURE MODULATION OF INFRARED ABSORPTION
apparent from the small bands near 2350 cm-l and 3700cm-l, respectively, while the presence of the band near2200 cm-' is attributable to residual N20 remaining asa contamination from earlier studies of this gas. Itmight be pointed out that several of the weaker CH4bands are readily observable in the modulated spectrumbut might be confused with background absorption inthe conventional spectrum.
The appearance of the Q branch of the 3000-cm-'band in the modulated spectra is rather interesting. Atthe high concentration the Q branch appears as a de-pression as shown in Fig. 4(A). This suggests that theabsorption in the Q branch is so intense that pressurevariations serve to alter the absorption only slightly.The modulated spectrum shown in Fig. 4(B) for thelower absorber concentration presents the Q branch asa maximum. This result indicates that for this lowerabsorber concentration the absorption of the Q branchis more affected by pressure variations than the absorp-tion of the adjacent P and R branches.
The spectrum of propane CH 3 CH2 CH3 shown inFig. 5 was investigated with a view to determining theeffects of pressure modulation on a spectrum consistingof many extremely closely spaced lines. As indicated inthe figure, many absorption bands are present in thenear infrared. For the strongest bands pressure modu-lation produces changes only in the wings of the bandseven for low absorber concentrations. This would seemto indicate that the rotational lines are so closely spacedthat the entire central portions are unaffected by furtherpressure changes once a pressure of 1 atmos has been
attained. It will be interesting to investigate the effectsof pressure modulation at much lower values of the totalpressure.
DISCUSSION OF RESULTS
The results of the present study are in qualitativeagreement with those to be expected on the basis ofearlier studies.' In view of this agreement, furtherstudies are being undertaken with a view to obtainingstill larger sample compression ratios and to obtainingestimates of the ultimate signal-to-noise ratios to beexpected in the near infrared. As pointed out, there isevery indication that higher amplification can be usedto advantage; the present work was intentionallylimited to commercially available amplifiers commonlyavailable in spectroscopy laboratories.
The present results are sufficiently encouraging towarrant the suggestion of the use of pressure modulationin routine studies of the spectra of gases. The chief ad-vantages would appear to lie in its ability to distinguishweak absorption bands from background absorption.
ACKNOWLEDGMENTS
The authors wish to express their appreciation to Mr.Darrell Burch for many helpful discussions, and to Dr.D. W. Magnuson and Dr. DeForrest Smith for a dis-cussion of their earlier technique of "sample modula-tion." One of the authors (Dudley Williams) would liketo express his thanks to the Guggenheim Foundationfor the grant of a fellowship held while the present studywas being planned.