25
Prestasi Ekonomi Suku Keempat Tahun 2018 Gabenor Bank Negara Malaysia 14 Februari 2019 Sidang Akhbar
Prestasi Ekonomi Suku Keempat Tahun 2018
Gabenor
Bank Negara Malaysia
14 Februari 2019
Sidang Akhbar
Sidang akhbar akan meliputi:
Prestasi ekonomi pada suku keempat tahun 2018
Perkembangan monetari dan kewangan
2
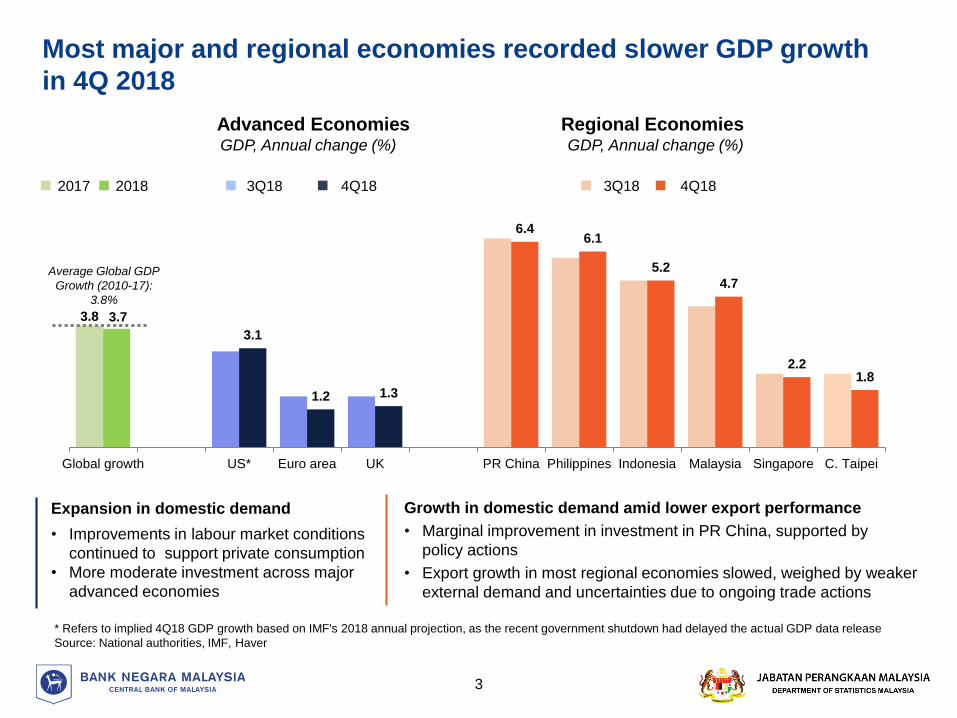
Most major and regional economies recorded slower GDP growth
in 4Q 2018
Advanced Economies
3.8 3.7
3.1
1.2 1.3
6.46.1
5.2
4.7
2.21.8
Global growth US* Euro area UK PR China Philippines Indonesia Malaysia Singapore C. Taipei
Regional EconomiesGDP, Annual change (%) GDP, Annual change (%)
* Refers to implied 4Q18 GDP growth based on IMF's 2018 annual projection, as the recent government shutdown had delayed the actual GDP data release
Source: National authorities, IMF, Haver
3
3Q18 4Q18
Growth in domestic demand amid lower export performance
• Marginal improvement in investment in PR China, supported by
policy actions
• Export growth in most regional economies slowed, weighed by weaker
external demand and uncertainties due to ongoing trade actions
Expansion in domestic demand
• Improvements in labour market conditions
continued to support private consumption
• More moderate investment across major
advanced economies
3Q18 4Q18
Average Global GDP
Growth (2010-17):
3.8%
2017 2018
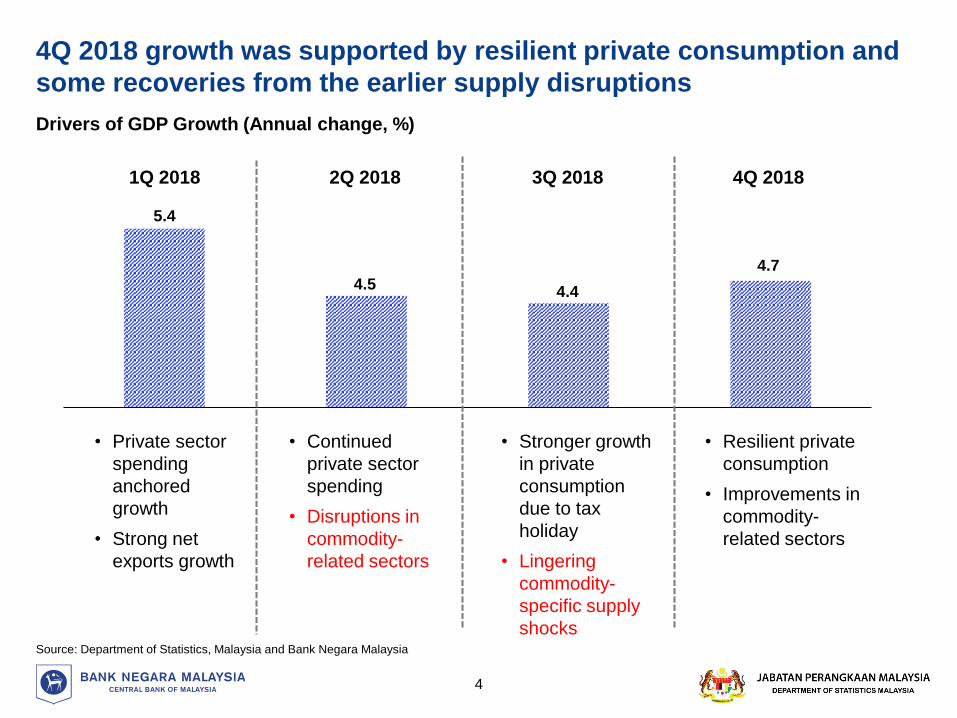
4Q 2018 growth was supported by resilient private consumption and
some recoveries from the earlier supply disruptions
Source: Department of Statistics, Malaysia and Bank Negara Malaysia
• Resilient private
consumption
• Improvements in
commodity-
related sectors
• Stronger growth
in private
consumption
due to tax
holiday
• Lingering
commodity-
specific supply
shocks
1Q 2018 2Q 2018 3Q 2018 4Q 2018
5.4
4.54.4
4.7
• Private sector
spending
anchored
growth
• Strong net
exports growth
• Continued
private sector
spending
• Disruptions in
commodity-
related sectors
Drivers of GDP Growth (Annual change, %)
4

The Malaysian economy expanded by 4.7% in 4Q 2018
On the supply side, services and manufacturing
sectors remained the key drivers of growth
1 Numbers may not add up due to rounding and exclusion of import duties
Source: Department of Statistics, Malaysia and Bank Negara Malaysia
On the demand side, growth continued to be
anchored by the private sector
Annual change, % /
Ppt contribution to GDP
5
-2
0
2
4
6
8
4Q-17 1Q-18 2Q-18 3Q-18 4Q-18
Agriculture Mining Construction
Manufacturing Services GDP Growth
Annual change, % /
Ppt contribution to GDP1
4.75.9 5.4 4.5 4.45.9 5.4 4.5 4.4 4.7
-4
-2
0
2
4
6
8
4Q-17 1Q-18 2Q-18 3Q-18 4Q-18
Private consumption Private investmentPublic consumption Public investmentChange in stocks Net exportsGDP growth

Growth expanded by 4.7% in 2018 supported by resilient private
sector activities amid temporary supply disruptions
Commendable growth in 2018
Source: Department of Statistics, Malaysia and Bank Negara Malaysia
Annual change, %
GDP
6
6.0
5.1
4.2
5.9
4.7
0
1
2
3
4
5
6
7
2014 2015 2016 2017 2018
Factors Influencing Growth in 2018
• Resilient private sector spending
• Lift from net exports
• Continued expansion in the services
and manufacturing sectors
• Disruptions in commodity-related
sectors in 2Q and 3Q 2018
• Government spending rationalisation
1.1
3.0
-6
-4
-2
0
2
4
6
8
-30
-20
-10
0
10
20
30
40
4Q-17 1Q-18 2Q-18 3Q-18 4Q-18
% of GNIRM billion
Secondary Income
Primary Income
Services
Goods
Current Account Balance, % of GNI (RHS)
7
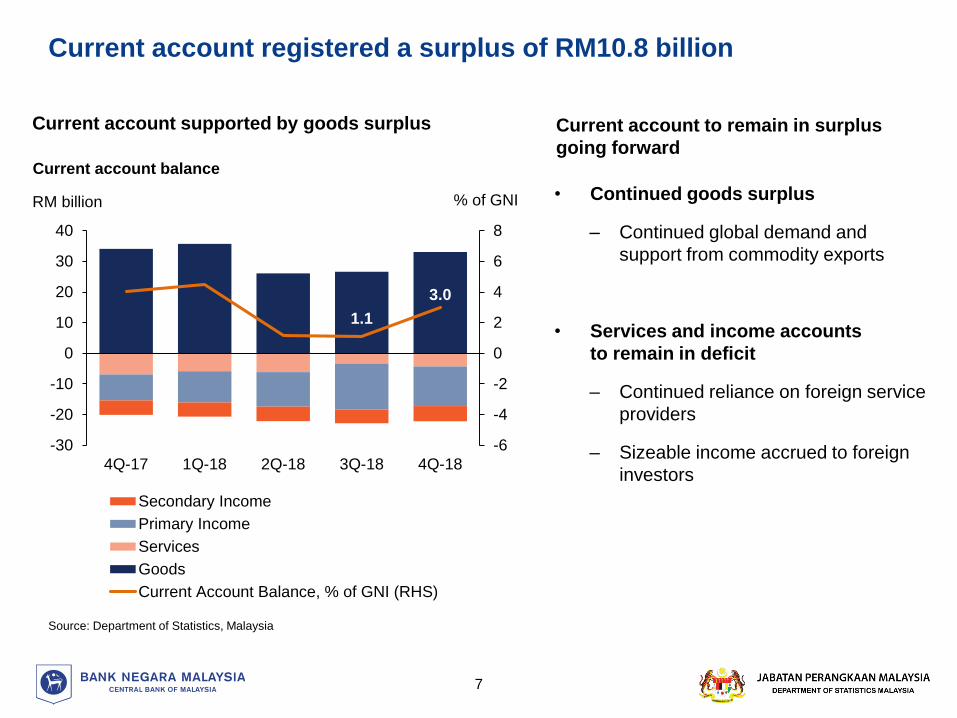
Current account registered a surplus of RM10.8 billion
Current account supported by goods surplus Current account to remain in surplus
going forwardCurrent account balance
• Continued goods surplus
– Continued global demand and
support from commodity exports
• Services and income accounts
to remain in deficit
– Continued reliance on foreign service
providers
– Sizeable income accrued to foreign
investors
Source: Department of Statistics, Malaysia
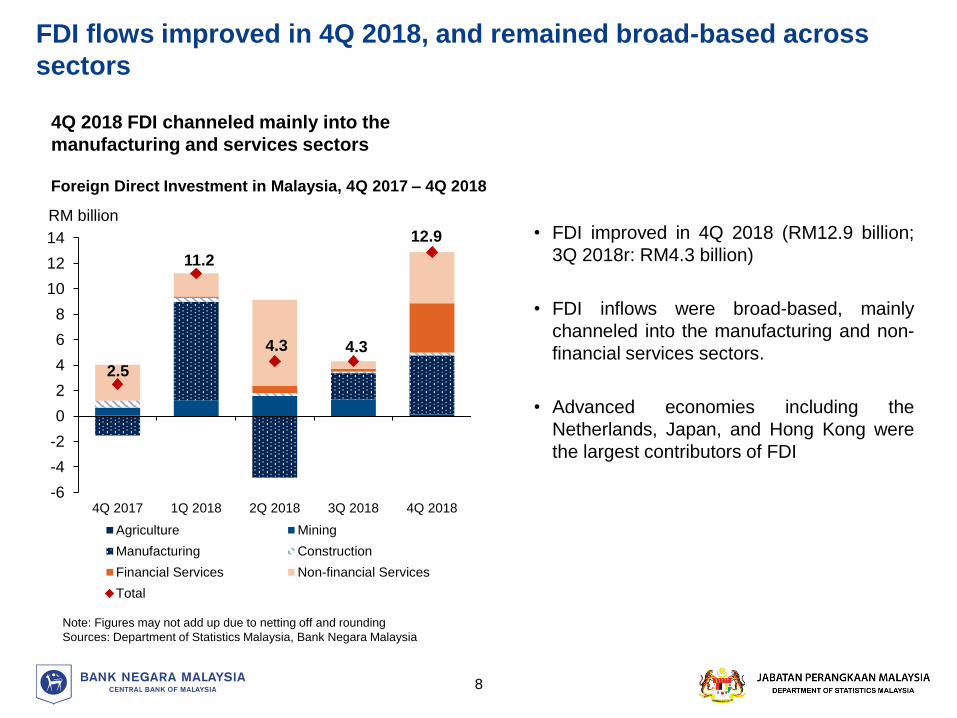
FDI flows improved in 4Q 2018, and remained broad-based across
sectors
Note: Figures may not add up due to netting off and rounding
Sources: Department of Statistics Malaysia, Bank Negara Malaysia
Foreign Direct Investment in Malaysia, 4Q 2017 – 4Q 2018
2.5
11.2
4.3 4.3
12.9
-6
-4
-2
0
2
4
6
8
10
12
14
4Q 2017 1Q 2018 2Q 2018 3Q 2018 4Q 2018
Agriculture Mining
Manufacturing Construction
Financial Services Non-financial Services
Total
4Q 2018 FDI channeled mainly into the
manufacturing and services sectors
8
• FDI improved in 4Q 2018 (RM12.9 billion;
3Q 2018r: RM4.3 billion)
• FDI inflows were broad-based, mainly
channeled into the manufacturing and non-
financial services sectors.
• Advanced economies including the
Netherlands, Japan, and Hong Kong were
the largest contributors of FDI
RM billion

Monetary and Financial Developments
9

Headline inflation declined in 4Q 2018
• In 2018, headline inflation averaged 1.0%
– Headline inflation during the quarter
declined as transport inflation turned
negative.
• In 2019, inflation is expected to average
moderately higher
– Impact of the consumption tax policy will
start to lapse towards the end of the year.
– The inflation outlook is subject to risks
related to the trajectory of global oil prices.
– Underlying inflation is expected to be
broadly stable.
*Note: Core inflation, which is a measure of underlying inflation, excludes the estimated direct impact of changes in consumption tax policies
Source: Department of Statistics, Malaysia and Bank Negara Malaysia
Contribution to Headline Inflation by Component
-2
-1
0
1
2
3
4
5
3Q 4Q 1Q 2Q 3Q 4Q 1Q 2Q 3Q 4Q
2017 2018
Net impact of consumption tax policy changes
Other price-administered items
Fuel
Price-volatile items (e.g. fresh food items)
Core inflation (ppt)
Headline inflation (%)
Core inflation* (%)
10
Annual change, % /
Ppt contribution to GDP
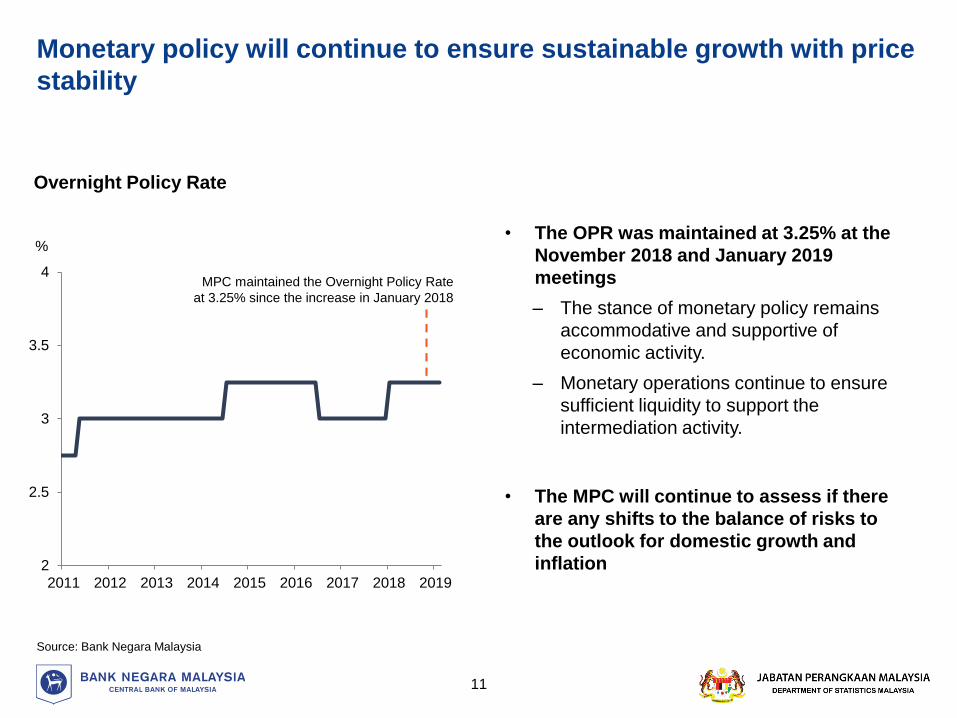
Monetary policy will continue to ensure sustainable growth with price
stability
• The OPR was maintained at 3.25% at the
November 2018 and January 2019
meetings
– The stance of monetary policy remains
accommodative and supportive of
economic activity.
– Monetary operations continue to ensure
sufficient liquidity to support the
intermediation activity.
• The MPC will continue to assess if there
are any shifts to the balance of risks to
the outlook for domestic growth and
inflation
Source: Bank Negara Malaysia
%
Overnight Policy Rate
2
2.5
3
3.5
4
2011 2012 2013 2014 2015 2016 2017 2018 2019
MPC maintained the Overnight Policy Rate
at 3.25% since the increase in January 2018
R
11
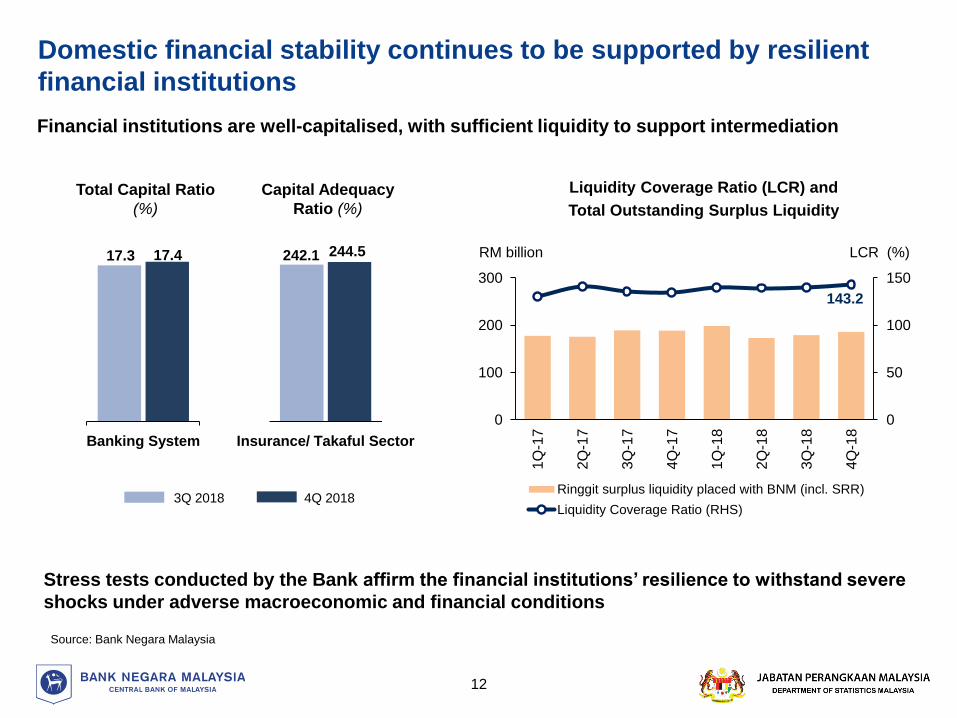
Financial institutions are well-capitalised, with sufficient liquidity to support intermediation
Stress tests conducted by the Bank affirm the financial institutions’ resilience to withstand severe
shocks under adverse macroeconomic and financial conditions
Source: Bank Negara Malaysia
RM billion LCR (%)
0
50
100
150
0
100
200
300
1Q
-17
2Q
-17
3Q
-17
4Q
-17
1Q
-18
2Q
-18
3Q
-18
4Q
-18
Ringgit surplus liquidity placed with BNM (incl. SRR)
Liquidity Coverage Ratio (RHS)
Liquidity Coverage Ratio (LCR) and
Total Outstanding Surplus Liquidity
Total Capital Ratio
(%)
Capital Adequacy
Ratio (%)
4Q 20183Q 2018
Insurance/ Takaful SectorBanking System
Domestic financial stability continues to be supported by resilient
financial institutions
12
242.1 244.517.3 17.4
143.2
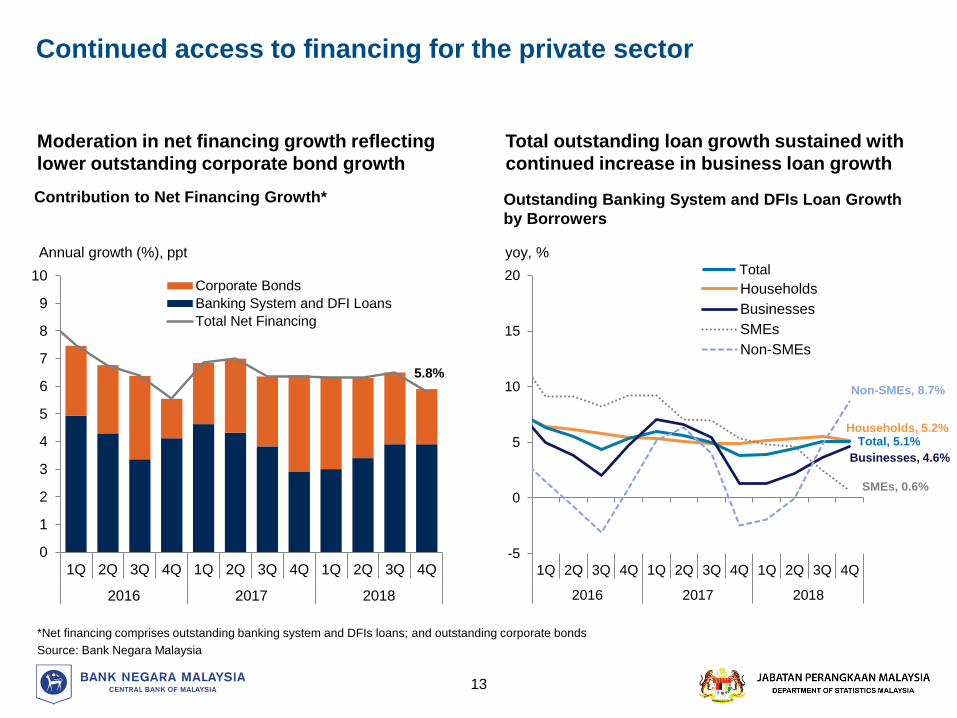
Continued access to financing for the private sector
Moderation in net financing growth reflecting
lower outstanding corporate bond growth
*Net financing comprises outstanding banking system and DFIs loans; and outstanding corporate bonds
Source: Bank Negara Malaysia
Total outstanding loan growth sustained with
continued increase in business loan growth
Contribution to Net Financing Growth*
0
1
2
3
4
5
6
7
8
9
10
1Q 2Q 3Q 4Q 1Q 2Q 3Q 4Q 1Q 2Q 3Q 4Q
2016 2017 2018
Corporate Bonds
Banking System and DFI Loans
Total Net Financing
Annual growth (%), ppt
-5
0
5
10
15
20
1Q 2Q 3Q 4Q 1Q 2Q 3Q 4Q 1Q 2Q 3Q 4Q
2016 2017 2018
Households
Businesses
SMEs
Non-SMEs
Outstanding Banking System and DFIs Loan Growth
by Borrowers
13
5.8%
Businesses, 4.6%
Total, 5.1%Households, 5.2%
yoy, %
Non-SMEs, 8.7%
SMEs, 0.6%
Total
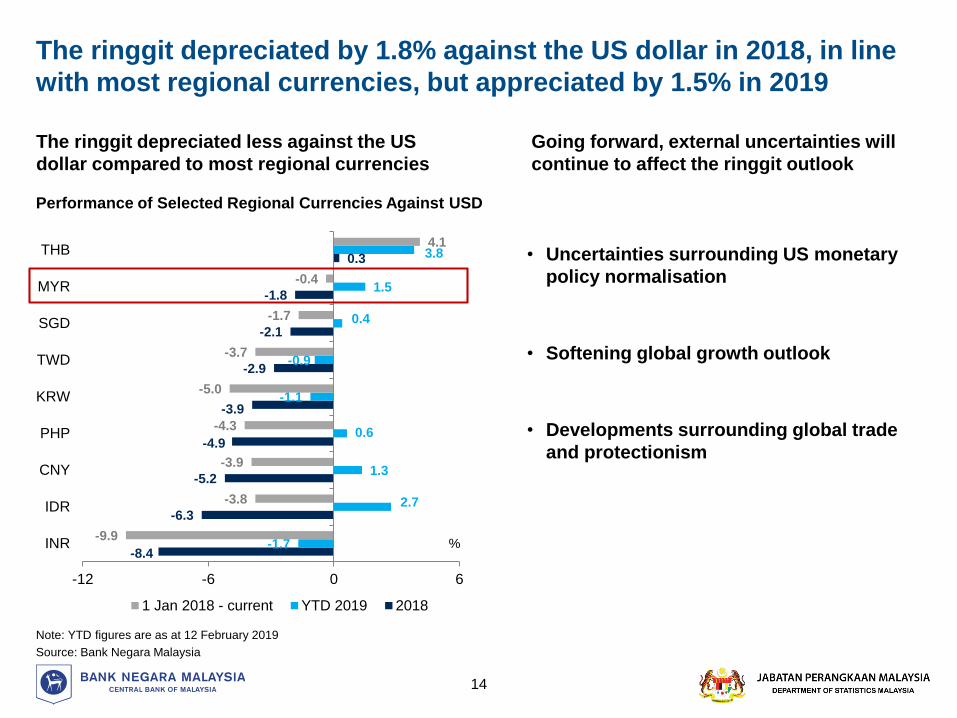
The ringgit depreciated less against the US
dollar compared to most regional currencies
-8.4
-6.3
-5.2
-4.9
-3.9
-2.9
-2.1
-1.8
0.3
-1.7
2.7
1.3
0.6
-1.1
-0.9
0.4
1.5
3.8
-9.9
-3.8
-3.9
-4.3
-5.0
-3.7
-1.7
-0.4
4.1
-12 -6 0 6
INR
IDR
CNY
PHP
KRW
TWD
SGD
MYR
THB
1 Jan 2018 - current YTD 2019 2018
The ringgit depreciated by 1.8% against the US dollar in 2018, in line
with most regional currencies, but appreciated by 1.5% in 2019
%
Going forward, external uncertainties will
continue to affect the ringgit outlook
• Uncertainties surrounding US monetary
policy normalisation
• Softening global growth outlook
• Developments surrounding global trade
and protectionism
Performance of Selected Regional Currencies Against USD
Note: YTD figures are as at 12 February 2019
Source: Bank Negara Malaysia
14

External debt edged lower and continues to remain manageable
Note: Numbers may not add up due to rounding
Source: Department of Statistics, Malaysia and Bank Negara Malaysia
Limited rollover risk as more
than half is represented by
medium- to long-term debt
Malaysia’s External Debt by MaturityEnd-4Q 2018: RM924.9 bn; % share
Close to a third is denominated
in ringgit……while risks from FX debt is
mostly subject to prudential
safeguards
Medium- to long-term
56%
Short-term
44%
Malaysia’s External Debt by Currency End-4Q 2018: RM924.9 bn; % share
Ringgit-denominated debt
31%
Foreign currency-denominated debt
69%
Trade credits
• Backed by export earnings
and self-liquidating
13%
24%
Intercompany loans
• Flexible/concessionary
terms
Interbank borrowings
(31.6%) and non-
resident deposits (7.3%)
• Banks required to hold
liquidity buffers and observe
the limits on funding and
maturity mismatches
Malaysia’s foreign-currency
denominated external debt in 4Q 2018 % share
39%
16%
8%
Bonds and notes
Others
63%
15

Reserves remain adequate and are not the only means to meet
external obligations
1.0
0.0
0.2
0.4
0.6
0.8
1.0
1.2
1.4
1.6
1.8
2.0
0
20
40
60
80
100
120
140
160
180
200
2010 2012 2014 2016 2018
Net International Reserves
Reserves/ST ext debt (RHS)
Reserves-to-ST external debt
coverage at 1.0x adequate to
facilitate international transactions
Net International Reserves
USD billion Times
Banks account for about 75%
of short-term external debt
Banks have sufficient FCY
liquid assets to meet
external debt obligations
RM billion
16
* Comprises exposures to unrelated counterparties that can be susceptible to sudden withdrawal shocks
** STED refers to Short-Term External Debt
Source: Department of Statistics, Malaysia and Bank Negara Malaysia
Debt-at-risk1
64
251
136
0
50
100
150
200
250
300
Banks'FCY STED**
Banks' FCYliquid assets
Interbank borrowing
(intragroup)38%
Interbank borrowing (non
intragroup)12%
NR deposits24%
Intercompany loans4%
Trade credits13%
Others6%
External debt of the
banking sector (75%)
Loans
3%
Breakdown of Malaysia’s Short-Term
External Debt by Instrument
(End-4Q 2018: RM405.3 bn; % share)

In 2019, the Malaysian economy is likely to remain on a steady
growth path
17
2018
• Trend moderation after an exceptionally strong performance in 2017
• Economy impacted by one-off factors, namely, supply side shocks and post-
elections policy uncertainty
2019
• Global growth reverting to long-term trajectory
• Resilience of private consumption and continuation of civil engineering projects
• Recovery from supply side shocks
• Commencement of new production facilities (RAPID, E&E, retail outlet expansion)
• Materialisation of approved manufacturing investment

Q & A
18

Additional Information
19

The Malaysian economy grew by 4.7% in the fourth quarter
21
Note: 2 Numbers do not add up due to rounding and exclusion of import duties
component
Source: Department of Statistics, Malaysia
Note: 1 Numbers do not add up due to rounding
Source: Department of Statistics, Malaysia
Real GDP
(Annual change, %)
Share,
%
(2018)
2017 2018
2018
1Q 2Q 3Q 4Q
Domestic demand
(excluding stocks)91.6 6.5 5.6 4.1 5.6 6.9 5.6
Private Sector 72.8 7.5 7.2 5.2 7.5 8.5 7.7
Consumption 55.5 7.0 8.1 6.9 8.0 9.0 8.5
Investment 17.4 9.3 4.5 0.5 6.1 6.9 4.4
Public Sector 20.1 3.3 0.1 -0.1 -1.4 1.1 0.4
Consumption 12.8 5.4 3.3 0.4 3.1 5.2 4.0
Investment 7.3 0.1 -5.2 -1.0 -9.8 -5.5 -4.9
Net exports of
goods
and services
8.4 -1.9 13.4 62.4 1.7 -7.5 9.9
Exports 70.6 9.4 1.5 3.7 2.0 -0.8 1.3
Imports 62.2 10.9 0.1 -2.0 2.1 0.1 0.2
Change in stocks
(RM billion)-1.3 1.1 -16.2 -5.0 2.8 -6.5 -2.1
GDP (y-o-y) 1001 5.9 4.7 5.4 4.5 4.4 4.7
GDP (q-o-q growth,
seasonally
adjusted)
- - - 1.4 0.3 1.6 1.4
Real GDP
(Annual change, %)
Share, %
(2018)2017 2018
2018
1Q 2Q 3Q 4Q
Services 55.5 6.2 6.8 6.5 6.5 7.2 6.9
Manufacturing 23.0 6.0 5.0 5.3 4.9 5.0 4.7
Mining and
Quarrying7.9 1.0 -1.5 0.1 -2.2 -4.6 0.5
Agriculture 7.8 7.2 -0.4 2.8 -2.5 -1.4 -0.4
Construction 4.5 6.7 4.2 4.9 4.7 4.6 2.6
Real GDP 1002 5.9 4.7 5.4 4.5 4.4 4.7
20
Add. Info
1
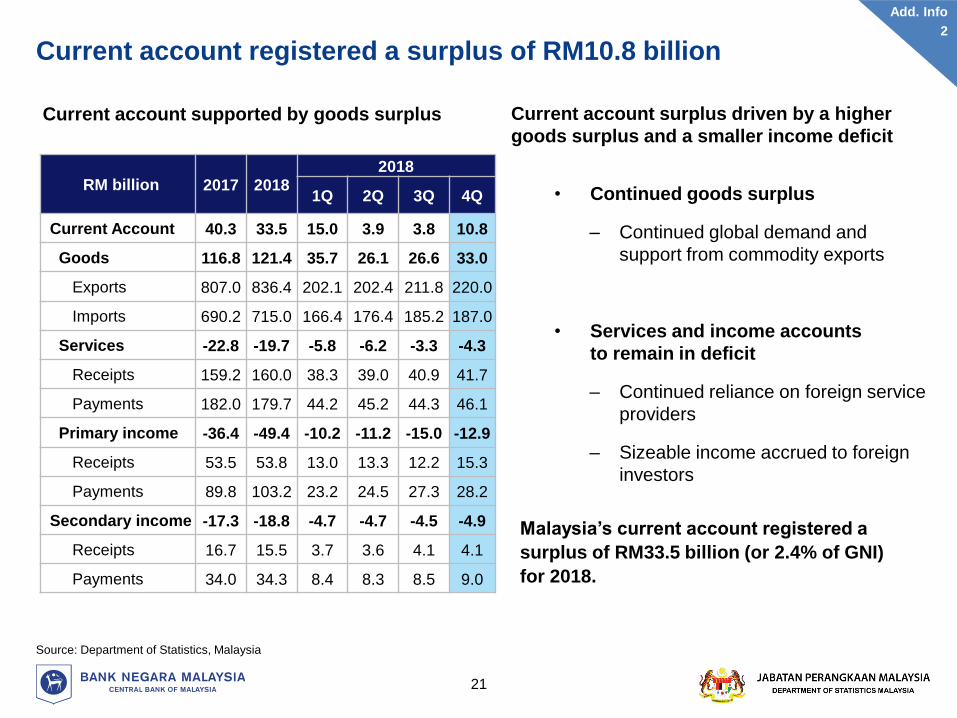
Current account registered a surplus of RM10.8 billion
Source: Department of Statistics, Malaysia
RM billion 2017 20182018
1Q 2Q 3Q 4Q
Current Account 40.3 33.5 15.0 3.9 3.8 10.8
Goods 116.8 121.4 35.7 26.1 26.6 33.0
Exports 807.0 836.4 202.1 202.4 211.8 220.0
Imports 690.2 715.0 166.4 176.4 185.2 187.0
Services -22.8 -19.7 -5.8 -6.2 -3.3 -4.3
Receipts 159.2 160.0 38.3 39.0 40.9 41.7
Payments 182.0 179.7 44.2 45.2 44.3 46.1
Primary income -36.4 -49.4 -10.2 -11.2 -15.0 -12.9
Receipts 53.5 53.8 13.0 13.3 12.2 15.3
Payments 89.8 103.2 23.2 24.5 27.3 28.2
Secondary income -17.3 -18.8 -4.7 -4.7 -4.5 -4.9
Receipts 16.7 15.5 3.7 3.6 4.1 4.1
Payments 34.0 34.3 8.4 8.3 8.5 9.0
Current account supported by goods surplus Current account surplus driven by a higher
goods surplus and a smaller income deficit
Malaysia’s current account registered a
surplus of RM33.5 billion (or 2.4% of GNI)
for 2018.
• Continued goods surplus
– Continued global demand and
support from commodity exports
• Services and income accounts
to remain in deficit
– Continued reliance on foreign service
providers
– Sizeable income accrued to foreign
investors
21
Add. Info
2
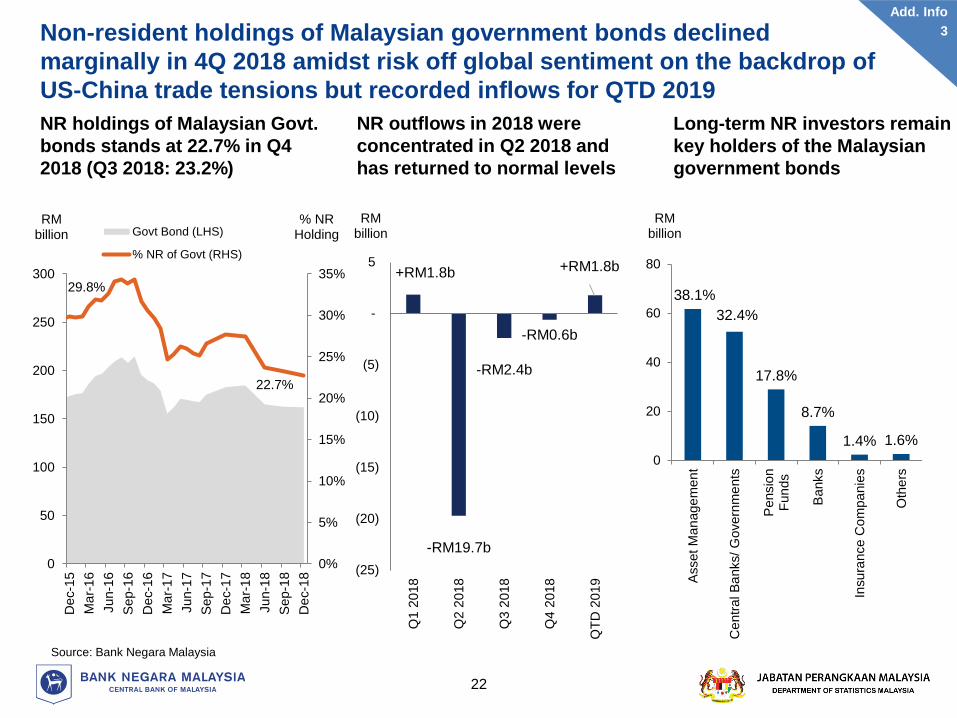
Non-resident holdings of Malaysian government bonds declined
marginally in 4Q 2018 amidst risk off global sentiment on the backdrop of
US-China trade tensions but recorded inflows for QTD 2019
22.7%
0%
5%
10%
15%
20%
25%
30%
35%
0
50
100
150
200
250
300
De
c-1
5
Ma
r-1
6
Jun-1
6
Sep-1
6
De
c-1
6
Ma
r-1
7
Jun-1
7
Se
p-1
7
De
c-1
7
Ma
r-1
8
Jun-1
8
Sep-1
8
De
c-1
8
% NR Holding
RM billion Govt Bond (LHS)
% NR of Govt (RHS)
29.8%
NR holdings of Malaysian Govt.
bonds stands at 22.7% in Q4
2018 (Q3 2018: 23.2%)
NR outflows in 2018 were
concentrated in Q2 2018 and
has returned to normal levels
Long-term NR investors remain
key holders of the Malaysian
government bonds
+RM1.8b
-RM19.7b
-RM2.4b
-RM0.6b
+RM1.8b
(25)
(20)
(15)
(10)
(5)
-
5
Q1 2
018
Q2 2
018
Q3 2
018
Q4 2
018
QT
D 2
019
RM billion
38.1%
32.4%
17.8%
8.7%
1.4% 1.6%
0
20
40
60
80
Asset
Man
age
men
t
Ce
ntr
al B
anks/
Govern
me
nts
Pensio
nF
un
ds
Banks
Insu
rance C
om
pa
nie
s
Oth
ers
RM billion
Source: Bank Negara Malaysia
Add. Info
3
22
Add. Info
3

2.4
2010 2012 2014 2016 2018
56
23
8 8 5
Services Mfg. Mining Agri. Const.
76.3 98.5
12.617.4
0
10
20
0
50
100
150
2008 2018
Size of Bond MarketCapital Ratio (RHS)
Malaysia’s macroeconomic fundamentals continue to remain strong
despite domestic and external headwinds/challenges
Broad-based sources of growth Favourable labour market
conditions
Deeper financial markets,
resilient banking system and
strong financial buffers
Continued current account
surplus
% of GNI
Current Account Balance
Malaysia GDP by Economic Sectors (2018)
% share of GDP
% of
nominal
GDP
Size of Bond Market
and Banking Capital Ratio %
Source: Department of Statistics, Malaysia and Bank Negara Malaysia p preliminary
Employment
Growth %
2017 2018
2.0
2.4*
* Bank Negara Malaysia estimates using data from the Quarterly Labour Force Survey published by DOSM
** Note: HK= Hong Kong, CN=China, SG= Singapore, UK= United Kingdom, JP=Japan, DE=Germany, ID=Indonesia, KR=South Korea, LU= Luxembourg, NIEs include Hong Kong, Chinese Taipei and Korea
10.8
2017 2018
8.6
Manufacturing
Wage Growth %
Conducive investment
destination for foreign investors
Outstanding FDI of RM 631bn
by Source Country (as at 4Q 2018)
RM Billion120
75 74
43 41 3927 22 21 18
SG JP HK NL US CH DE UK VG NO
ROW
Market
% share of exports
Diversified export market
and productProduct
% share of exports
E&E
Non-E&E
Commodities
PR ChinaNIEs
G3
ASEAN
38
46
16
2018
26
29
1414
18
2018
Add. Info
4
23
Add. Info
4

-4
-2
0
2
4
6
8
10
19
80
19
82
19
84
19
86
19
88
19
90
19
92
19
94
19
96
19
98
20
00
20
02
20
04
20
06
20
08
20
10
20
12
20
14
20
16
20
18
Global growth reverting to its long term growth trajectory
Note: The long term growth rates (1980-2018) for global, advanced and emerging market are 3.5%, 2.4% and 4.5%, respectively.
Source: National authorities and IMF
2.9
1.8
6.6
2.5
1.6
6.2
US Euro Area China
• 2018 • 2019f
Avg. GDP Growth
(2000-18): 2.1%
Avg. GDP Growth
(2000-18): 1.4%
Avg. GDP Growth
(2000-18): 9.1%
GDP growth in most major economies are trending towards their long term trend
Selected Major EconomiesGDP, Annual change (%)
Emerging Market Economies
World growthAdvanced Economies
Global Growth and Major RegionsGDP, Annual change (%)
Long-term avg. (1980 – 2018)
World: 3.5%
Advanced: 2.4%
EME: 4.5%
24
Add. Info
5
Add. Info
5

End
25


