27
Presto as a Service Tips for operation and monitoring Taro L. Saito Treasure Data, Inc. [email protected] January 20, 2015 Presto Meetup Japan @ FreakOut, Roppongi
| Date post: | 16-Jul-2015 |
| Category: |
Technology |
| Upload: | taro-l-saito |
| View: | 1,805 times |
| Download: | 2 times |

Presto as a Service Tips for operation and monitoring
Taro L. Saito Treasure Data, Inc. [email protected] January 20, 2015 Presto Meetup Japan @ FreakOut, Roppongi

About Me: @taroleo • 2007 University of Tokyo. Ph.D.
– XML DBMS, Transaction Processing • Relational-Style XML Query. ACM SIGMOD 2008
• ~ 2014 Assistant Professor at University of Tokyo – Genome Science Research
• Distributed Computing
• 2014.3月~ Treasure Data – Software Engineer, MPP Team Leader
2

My Open Source Projects
• sqlite-jdbc – SQLite DBMS for Java – 1file =1DB
• snappy-java – Fast compression library – More than 100,000 downloads/month
• Used in Spark, Parquet, etc.
• msgpack-java • UT Genome Browser (UTGB)
– Visualization of massive amount of genome science data
3
Topics
• Presto as a Service in Treasure Data – Error Recovery – Presto Deployment
• Tips for Monitoring Presto – JSON API – Presto + Fluentd
4

Treasure Data: Presto as a Service
5
Presto Public Release

Hive
TD API / Web Console Interactive query
batch query
Presto
Treasure Data
PlazmaDB: MessagePack Columnar Storage
td-presto connector

Deployment • Building Presto takes more than 20 minutes.
• Facebook frequently releases new versions
• Let CircleCI build Presto – Deploy jar files to private Maven repository – We sometime use non-release versions
• for fixing serious bugs • hot-fix patches
• Integration Test – td-presto connector
• PlazmaDB, Multi-tenant query scheduler • Query optimizer
– Run test queries on staging cluster
7

Production: Blue-Green Deployment • http://martinfowler.com/bliki/BlueGreenDeployment.html
• 2 Presto Coordinators (Blue/Green)
– Route Presto queries to the active cluster – No down-time upon deployment
• Launch Presto worker instances with chef <- less than 5 min. in AWS • Inactive clusters is used for pre-production testing and customer support
– Investigation and tuning of customer query performance – Trouble shooting
8
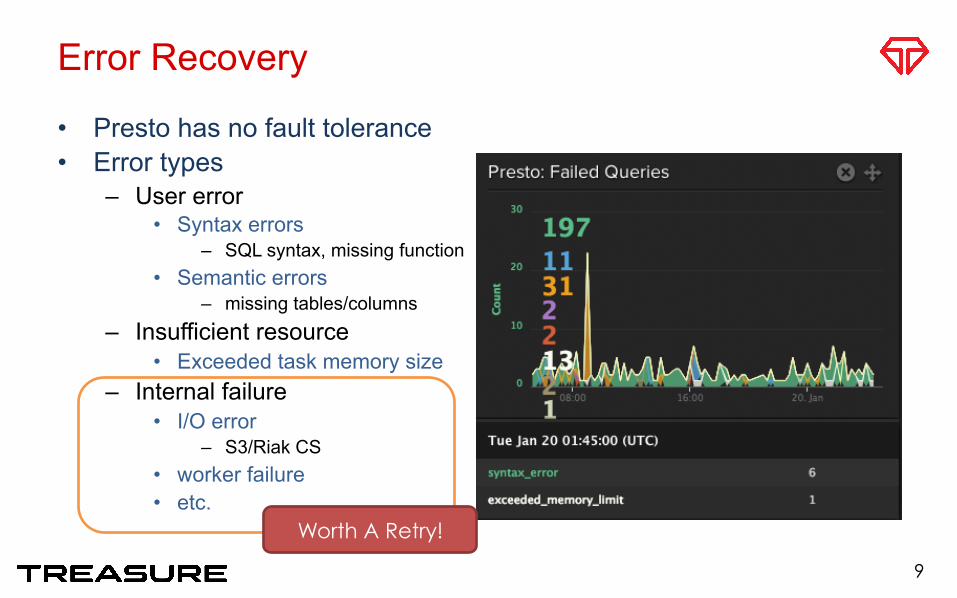
Error Recovery • Presto has no fault tolerance • Error types
– User error • Syntax errors
– SQL syntax, missing function • Semantic errors
– missing tables/columns – Insufficient resource
• Exceeded task memory size – Internal failure
• I/O error – S3/Riak CS
• worker failure • etc.
9
Worth A Retry!

Failed Query Rate
10
11
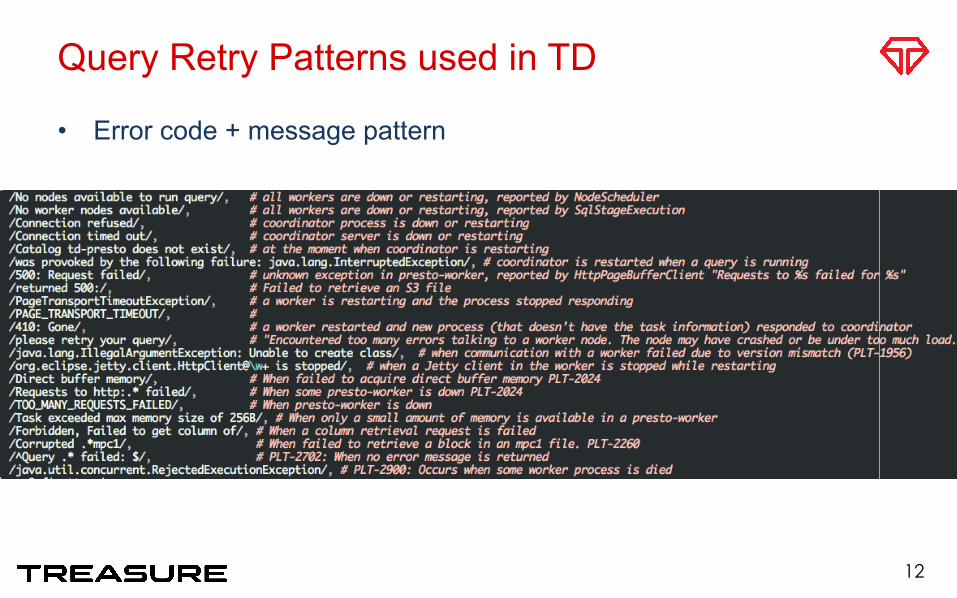
Query Retry Patterns used in TD • Error code + message pattern
12

Monitoring Presto • REST API for monitoring Presto state
– JSON format
• (presto server IP):8080/v1/query – List of recent queries (BasicQueryInfo class)
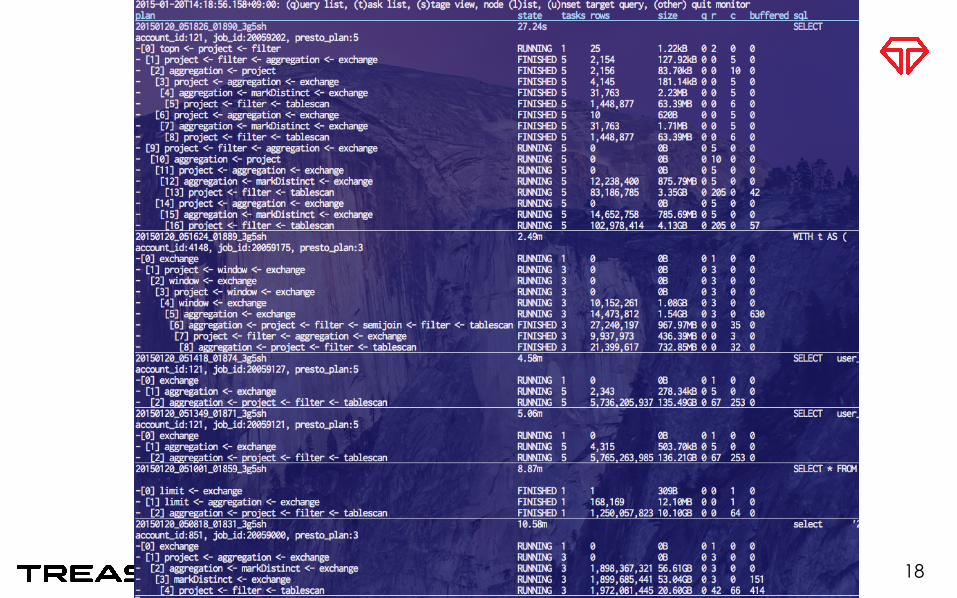
• (presto server IP):8080/v1/query/(query id) – Detailed query state information – Query plan, tasks and running worker IDs – Processed rows/data size
13
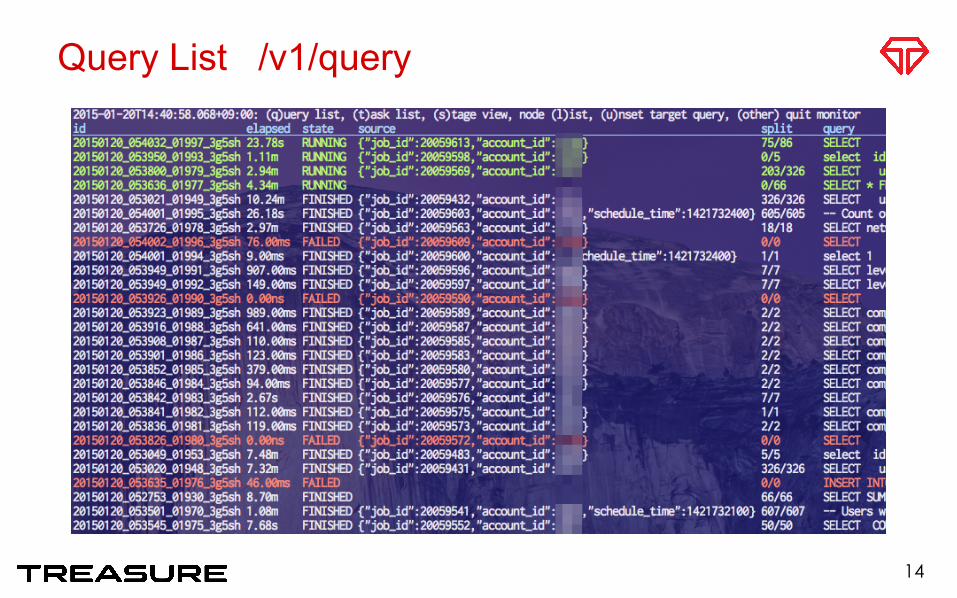
Query List /v1/query
14
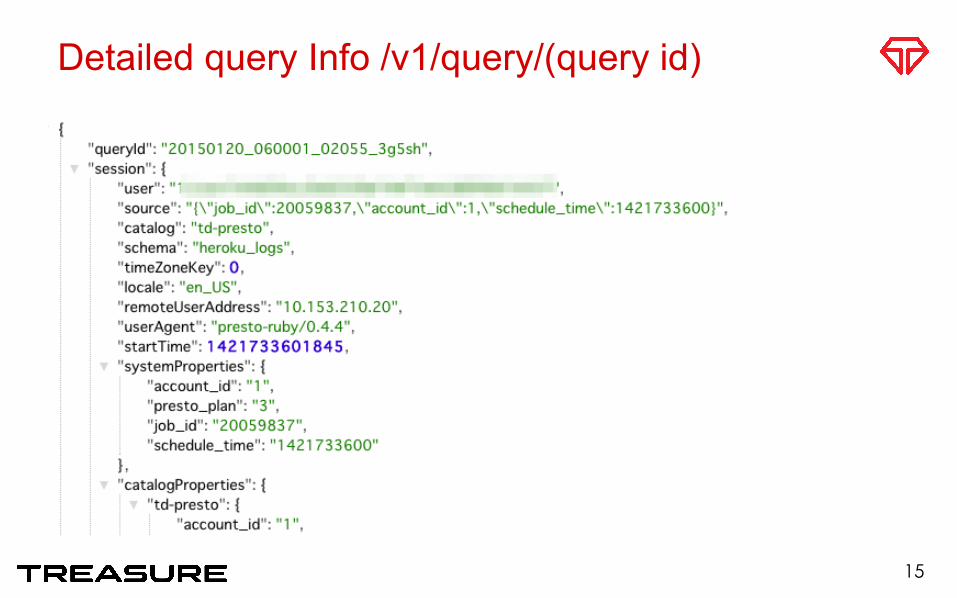
Detailed query Info /v1/query/(query id)
15

/ui/query-execution/(query id)
16
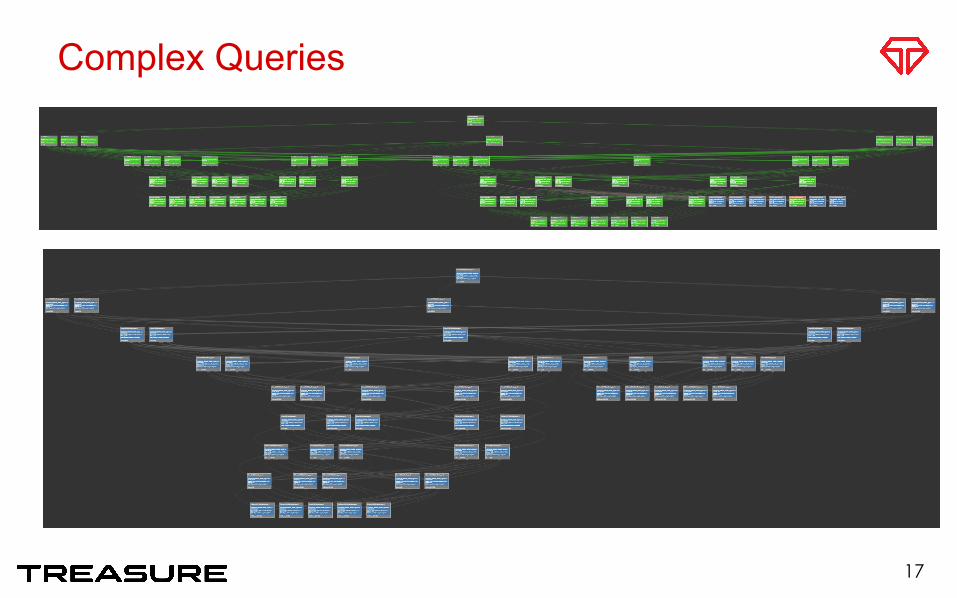
Complex Queries
17
18
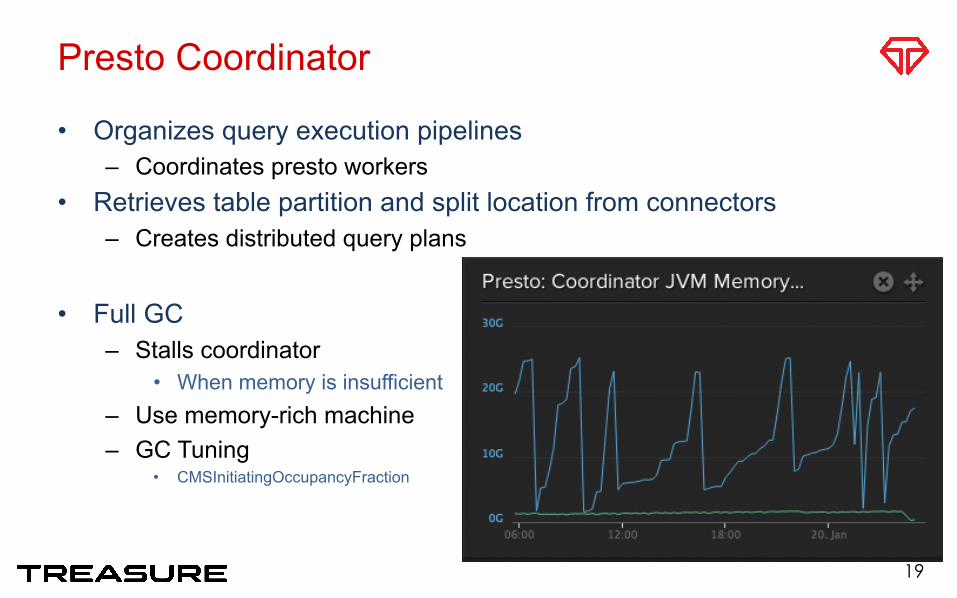
Presto Coordinator • Organizes query execution pipelines
– Coordinates presto workers • Retrieves table partition and split location from connectors
– Creates distributed query plans • Full GC
– Stalls coordinator • When memory is insufficient
– Use memory-rich machine – GC Tuning
• CMSInitiatingOccupancyFraction
19

Monitoring Presto with Fluentd
20
Hive
Presto

presto-metrics (Ruby) • https://github.com/xerial/presto-metrics
21

22
23

Detecting Anomaly • Started Query Rate (in 5min/15min)
– If no query has started, cluster may be down (or not started properly) • Processed rows in a query
– Sum up the number of the processed rows from all of the sub stages – Simple, but the most reliable measure
• Send an alert – HipChat notification – PagerDuty call
• JP/US team rotation
24
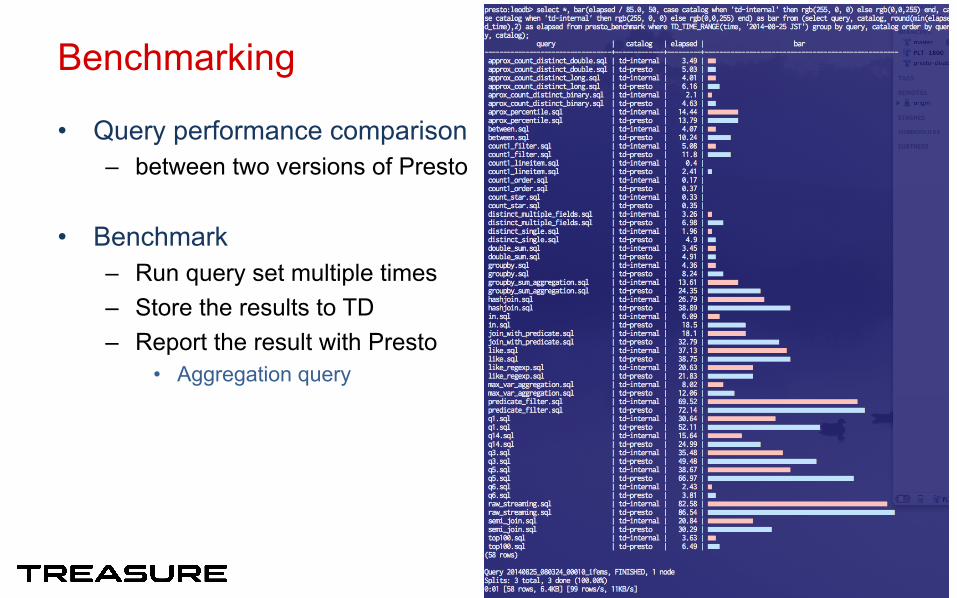
Benchmarking • Query performance comparison
– between two versions of Presto
• Benchmark – Run query set multiple times – Store the results to TD – Report the result with Presto
• Aggregation query
25

Presto Operation Tool • Prestop
– Our internal tool for managing multiple presto clusters
• written in Scala – Query monitoring – Benchmarking – Workload simulation
• stress testing
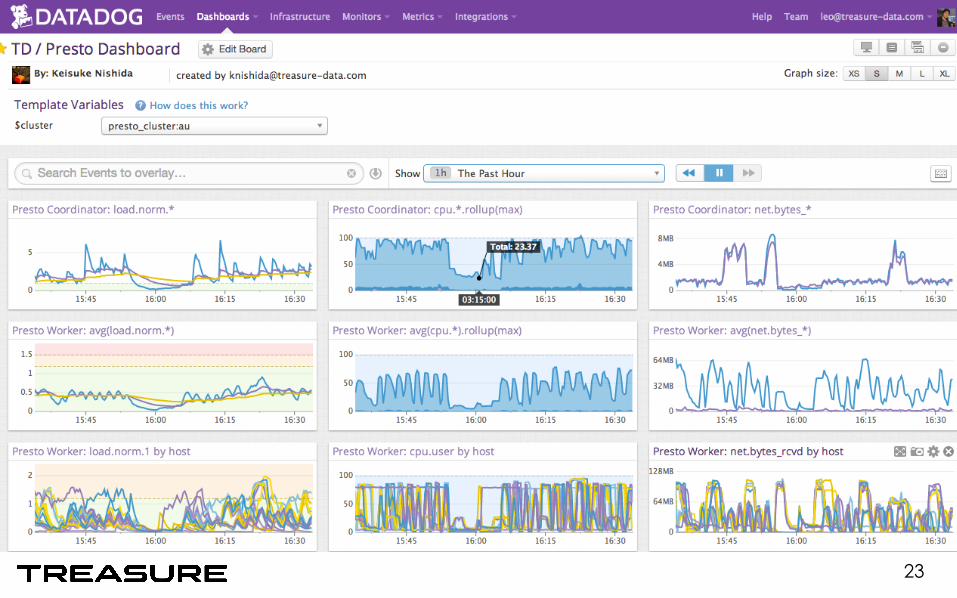
• Monitoring – Librato – Datadog – ChartIO (query stats)
26

WE ARE HIRING!
27
Check: www.treasuredata.com


