Page 1
Which results of measurement are obligatory
required for an optimized operation of a wastewater
treatment plant?
Speaker: Prof. Dr.-Ing. habil. Holger Scheer
Emscher Gesellschaft für Wassertechnik mbH, Essen
(Essen, Germany)
Presto-Seminar “Advanced Technologies and Ope-
ration of WWTP for an efficient nutrient removal“
May 23rd 2012
in St. Petersburg
_________________________________________________________________________________
Prof. Dr.-Ing. habil. Holger Scheer - Tel.: 0049 (0)201/3610-0 - E-Mail: [email protected]
Page 2
Content
1. Determination of representative measurements
2. Correct sampling in the influent
3. Important data required for optimization of operation
4. Real load of a wastewater treatment plant
4.1 Current rate of the connection
4.2 Real sludge load
5. Example for optimization of energy costs
6. Example for optimization of use of precipitant
7. Example from the field of sludge treatment
8. Summary
Page 3
1. Determnination of representative measurements
Usability guaranteed? (accuracy, systematics...)
Sufficient frequency in a represantive period (including the weekends)
Analytic quality control of the lab (if needed, external control)
Daily composite samples available for the needed parameters?
Sampling point suitable (e.g. because of internal material flows).
For the optimal operation of a wastewater treatment plant a possibly large database
is needed.
Records of: Amount of wastewater
Weather conditions
Wastewater temperature
Concentration of certain parameters
Check the parameters on:
Page 4
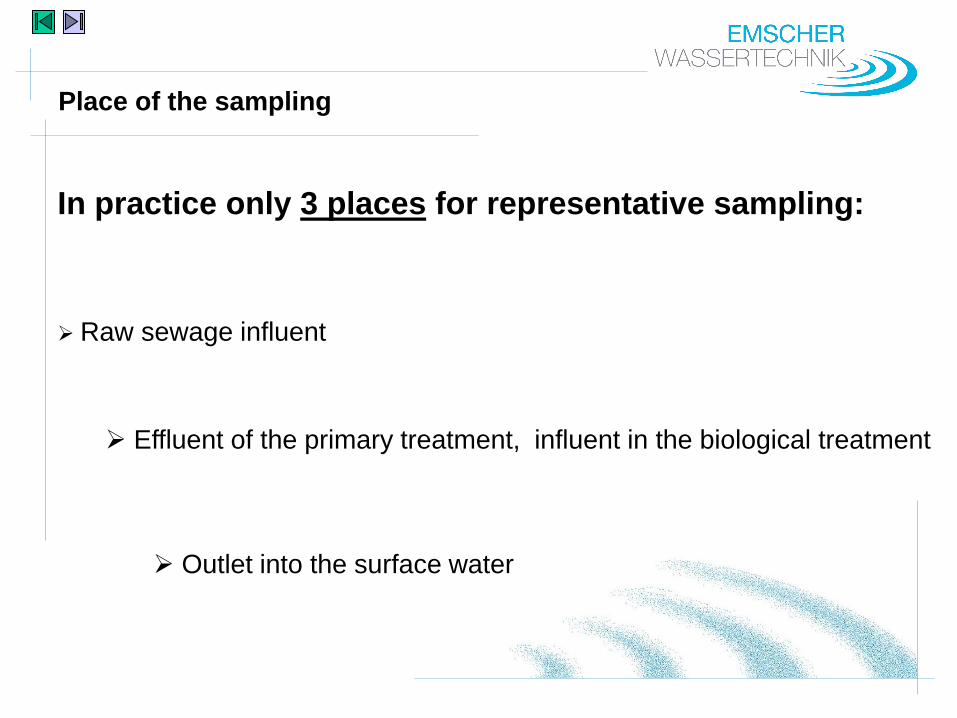
Place of the sampling
In practice only 3 places for representative sampling:
Raw sewage influent
Effluent of the primary treatment, influent in the biological treatment
Outlet into the surface water
Page 5
2. Correct sampling
Continuous (online) measurement of the concentrations of important parameters
in influent desirable, but not possible to realise without great technical effort.
Therefore Higher effort for sampling and analysis
Possibilities of the sampling:
Sample collectors in proportion to volume and stream-flow
Sample collectors linked to the stream-flow need a measurement signal
of the stream-flow.
Generally daily composite samples are collected.
Sample collectors in proportion to time
Used, when approach to the measurement signal to complex.
The sample collectors need a cylinder switchover for daily 12 2h composite samples
Daily CS Manual rating of the 2-h-CS with inflow of belonging intervalls.
Manual sampling
Grab samples taken every half an hour or hour combined into a 2h sample.
After that same as sampling in proportion to time.
Page 6
2. Correct sampling in the influent Q
[m
³/h]
Influent
BO
D5 C
onc.
Rainfall event
0 Time of day 24 - h 0 Time of day 24 - h
Time-proportional
Flow-proportinal
With sampling in one cylinder in proportion to time
Combined wastewater influent with low concentration rated as dry weather
Result of measurement often to high because of wrong sampling!
Page 7
3. Important and required data for the operation optimization
During the time period of one year :
1. Date and day
2. Mark dry weather days
3. Wastewater temperature in the efluent of the reactor
(As an alternative in the influent or efluent of the primary treatment)
4. Daily wastewater run off Qd in m³/d
5. Dry weather run off QD,d in m³/d
6. Measured concentration in mg/l from 24 h-composite sample of the
influent of the biological treatment
• COD, homogenized, CCOD
• COD of the filtration of the sample, SCOD
• BOD5, homogenised, CBOD
• Filtratable substances, XSS
• Kjeldahl nitrogen, TKN, homogenized, CTKN
• Ammonia nitrogen, SNH4
• Nitrate nitrogen, SNO3
• Total phosphor, homogenized, CP
• Acid capacity, SCA, in mmol/l
Recommendation
according to
ATV-DVWK-A 198
Page 8
Tabular compilation D
ate
Day
Weath
er
Waste
wate
r te
mpera
ture
All
days
DW
da
ys
CO
D.
CO
D f
iltra
te (
SC
OD)
CO
D h
om
og
. (C
CO
D)
BO
D5 h
om
og
. (C
BO
D)
Filt
rata
ble
su
bst. (
XS
S)
TK
B h
om
og
. (C
TK
N)
Am
mo
nia
nitro
. (S
NH
4)
Nitra
te n
itro
. (S
NO
4)
Ph
osp
ho
r,ho
mog
. (C
p)
Acid
ca
pa
c. (S
CA)
Influent Concentration
average
Page 9
Tabular compilation
Sludge water COD loads Ratios
Da
te
Day
Qd,s
ludgew
.
SN
H4
,slu
dge
w.
Sta
rt
Sto
p
(Bd,C
OD
)
Weekly
avera
ge
Bd,C
OD
,WA
2 W
eeks a
vera
ge
Bd,C
OD
,2W
A
SC
OD/C
CO
D
CB
OD/C
CO
D
XS
S/C
CO
D
CT
KN/C
CO
D
SN
H4/C
CO
D
CP/C
CO
D
SK
S/C
CO
D
average
Page 10
4. Current load in a wastewater treatment plant
WWTP-clasification in size class/definition of the size:
Decisive:
BOD5-load influent in 85 % of the dry weather days (85 %-fractile value)
Beware: Check the current rate of connection regularly!
Finding the 85 % value
at least 40 values of dry weather days (in 3 years)
Optimization of the aeration plant
Weekly average of the loads
Forming the weekly average
at least 4 daily loads in one week
Known annual progression (e.g. low-load or high-load period)
intensive sampling can be reduceed to 4 – 10 weeks
4.1 Current rate of connection
Recommendation
according to
ATV-DVWK-A 131
Page 11
4.2 Real sludge loading
The BOD5-sludge load BSS shows how much substrate of the biomass should be converted
per day:
[kg BSB5/(kg TS d)]
with BD = BOD5-daily load [kg BSB5/d] in influent of the aeration tank
VAT = Volume of the aeration tank [m3]
SSAT = Load of suspended solids in aeration tank [kg SS/m3]
Beware: Put in the correct values with correct reference!
AT SS
AT V
BOD d, B
BSS =
Page 12
4.2 Real sludge loading
Often the current sludge loading is significantly beneath the designed sludge loading.
Current sludge loading << Required sludge loading
Optimization of the operation with the aim to reduce the total sludge amount
in the system
Two ways to reduce the sludge amount:
Reduce the current total solids in the aeration tank
Shut down of the aeration tank – if possible -
Required sludge loading depends on the wastewater temperature ( Beware:
Nitrification), results in SSAT:
[kg SS/m3]
(f(T)) SS
B AT
V D
B
needed AT, SS
=
Page 13
Practical example to optimize the operation of the aeration tank
Required volume of the aeration tank VAT
Year 2010
0
1600
3200
4800
6400
Jan Feb Mrz Apr Mai Jun Jul Aug Sep Okt Nov Dez
VA
T
VAT present (4 tanks) VAT (2 tanks)
VAT (3 tanks) VAT required for max. load
Page 14
5. Examples of optimization of energy cost
Wastewater treatment plant size: 100.000 PE
BOD5-load 6.000 kg BOD5/d
Volume of the aeration tank 16.000 m³
SSAT-content (needed) 3,0 kg SS/m³
SSAT-content (operation) 4,3 kg SS/m³
Assumption:
SSAT-reduction: SSAT= 1,0 kg SS/m³
Reduction of the O2 demand due to lowered 0,2 kg O2/ kg BOD5
endogenous respiration
Reduction of the O2-demand 31.000 kg O2/ Month
for one month
Page 15
5. Examples of optimization of energy cost
-Value for pressure ventilation with = 0,65 (value quite good)
planar arrangement
Saving of O2-supply 48.000 kg O2 / Month
Oxygen entry ON= 1,4 kg O2 / kWh
Saving of kWh 34.000 KWh / Month
Costs per kWh 12 Cent
Monthly saving 4.000 Euro/Month
With operation optimization 20.000 Euro
after 5 months reduction
Page 16
6. Optimization of use of precipitant
Required concentration of precipitant Estimate through ßPrec -value
XMe = required precipitant in [mg Me/l Wastewater]
XP,Fäll = Phosphor to percipitate in [mg P/l Wastewater]
AMMe = atomic mass of the metal (Me) in [mg/mmol]
AMP = atomic mass of the phosphor in [mg/mmol]
Reference value for ßPrec : simulataneous, pre and precipitation: ßPrec = 1,2
Flocculation filtration ßPrec = 2,5
If ßPrec = 1,2, resulting:
Percipitation with Iron: 2,16 [kg Fe/kg PFäll]
Percipitation with Aluminium: 1,05 [kg Al/kg PFäll]
Recommendation
according to
ATV-DVWK-A 202
] [mmol/mmol
P AM
Fäll P, X
Me AM
Me X
Prec β =
Page 17
with
XP,Fäll Phosphor to precipitate
CP,ZB Pges in influent of the aeration tank (after prim. treatment)
CP,Mit Operation average in efluent of the clarifier
XP,BM needed Phosphor for cell building
XP, BioP biological P-Elimination
CP,Mit = 1,5 mg/l
Phosphor to precipitate: XP,Prec = CP,ZB - CP,Mit - XP,BM - XP,BioP [mg/l]
6. Optimization of use of precipitant
XP,Fäll = 8,9 – 1,5 – 2,2 – 3,3 = 1,9 mg/l
CP,ZB = 8,9 mg/l
XP,BM = 2,2 mg/l XP,Bio-P = 3,3 mg/l
Page 18
7. Examples in the field of sludge treatment
Equation: V • SS = constant
V1 • SS1 = V2 • SS2 V1 / V2 = SS2 / SS1
Example:
Raw sludge from the primary treatment 2,5% SS
Raw sludge from the aeration tank 0,7% SS
Amount of sludge:
Primary treatment sludge 70 m³ / d
Surplus sludge 240 m³ / d
Total sludge 310 m³ / d
SS-content of the combined sludge: (70 • 2,5 + 240 • 0,7) / 310 = 1,1% SS
Through flow thickener:
Achievable solids (according to the design) 4,0 % SS
Real solids (on the plant) 2,5 % SS
V1 • TS1 = V2 • TS2
310 • 1,1 = V2 • 4,0 V2 = 85 m³/d
310 • 1,1 = V2 • 2,5 V2 = 135 m³/d 60% more water !
Page 19
8. Summary
1. Measurements have to be representative
2. Mind correct sampling
=> often: less is more
3. Influent often not enough analysed
4. Wastewater treatment plants in many places not optimized
5. Technical optimization of the operation should be performed
6. In many places can the cost saving potential be achieved in a short
period of time
Page 20
Prof. Dr.-Ing. habil. Holger Scheer
Emscher Gesellschaft für Wassertechnik mbH
Brunnenstraße 37
45128 Essen
Tel.: 0049 (0)201/3610 - 0 Fax: 0049 (0)201/3610 - 100
E-Mail: [email protected]
Homepage: www.ewlw.de
Author´s address