Int. J. Curr. Res. Med. Sci. (2016). 2(9): 22-37 22 International Journal of Current Research in Medical Sciences ISSN: 2454-5716 www.ijcrims.com Volume 2, Issue 9 -2016 Original Research Article Prevalence and Risk Factors of Placenta Previa in Saudi Arabia and Sudan 2016 Dr. Itedal Abdelraheem Mohamed Ahmed Department of Anatomy, Faculty Medicine, Najran University, Najran, KSA *Corresponding author: [email protected]Abstract This is a descriptive cross-sectional study conducted in Alshaikh Mohamed Ali Fadul Hospital in Sudan and Najran University Hospital in the Kingdom of Saudi Arabia during July 2015-July 2016. In antenatal clinic pregnant women were scanned in their third trimester by sonographic ultrasound. After completion of the one year data regarding the detailed obstetrical and surgical history were recorded in a questionnaire form. The data were analyzed using Statistical Social Package for Social SciencesVersion20SPSS. All analyses were performed using descriptive crosstabs and to determine and arrangement the risk factors by using model logistic regression. Total number of deliveries during the study period was 400. Of them 125 (31.25%) by pp. Of the latter 65 (16.25%) and 60 (15% ) were diagnosed as placenta previa in both study groups in Sudan and KSA respectively. The incidence of placenta previa was directly related to the previous cesarean sections71 (17.75 %), parity55 (13.75 %), previous placenta previa 32 (8%) by crosstabs. These risk factors represented by the following equations by using logistic regression. (Y)Log p/1-p =1.679+ 1.365* pervious cesarean section + 0.768* parity. (Y)Log p/1-p =1.354+1.752* pervious cesarean section+ 1.602*previous placenta previa+1.191*assisted conception. Keywords: Development of Placenta, Prevalence of Placenta Previa, and Risk Factors of Placenta Previa 1. Introduction In this study we examined the following as risk factors of placenta previa: pervious cesarean section, parity, medical complication, uterine anomaly, previous placenta previa, assisted conception, with placenta previa. The placenta is first organ to develop of the fetus and has several fascinating and critical functions. It mediates implantation and establishes the interface for nutrient and gas exchange between the maternal and fetal circulation as well as initiating maternal recognition of pregnancy, altering local immune environment and altering maternal cardiovascular and metabolic functions through the production of pancreatic and endocrine hormones. Abnormalities in any one of these functions can be associated with poor pregnancy outcome, ranging from the mild intrauterine growth restriction (IUGR) to the severe implantation failure and embryonic, fetal or perinatal death. Croos, 2006 who described how placental development and function are regulated and the potential role for primary placental pathologies in explaining a variety of risk factors and complication in human pregnancy. DOI: http://dx.doi.org/10.22192/ijcrms.2016.02.09.003
Transcript
Int. J. Curr. Res. Med. Sci. (2016). 2(9): 22-37
22
International Journal of Current Research inMedical Sciences
ISSN: 2454-5716www.ijcrims.com
Volume 2, Issue 9 -2016
Original Research Article
Prevalence and Risk Factors of Placenta Previa inSaudi Arabia and Sudan 2016
Dr. Itedal Abdelraheem Mohamed AhmedDepartment of Anatomy, Faculty Medicine, Najran University, Najran, KSA
This is a descriptive cross-sectional study conducted in Alshaikh Mohamed Ali Fadul Hospital in Sudan and NajranUniversity Hospital in the Kingdom of Saudi Arabia during July 2015-July 2016. In antenatal clinic pregnant womenwere scanned in their third trimester by sonographic ultrasound. After completion of the one year data regarding thedetailed obstetrical and surgical history were recorded in a questionnaire form. The data were analyzed usingStatistical Social Package for Social SciencesVersion20SPSS. All analyses were performed using descriptivecrosstabs and to determine and arrangement the risk factors by using model logistic regression.Total number of deliveries during the study period was 400. Of them 125 (31.25%) by pp. Of the latter 65 (16.25%)and 60 (15% ) were diagnosed as placenta previa in both study groups in Sudan and KSA respectively. The incidenceof placenta previa was directly related to the previous cesarean sections71 (17.75 %), parity55 (13.75 %), previousplacenta previa 32 (8%) by crosstabs. These risk factors represented by the following equations by using logisticregression.
Keywords: Development of Placenta, Prevalence of Placenta Previa, and Risk Factors of Placenta Previa
1. Introduction
In this study we examined the following as riskfactors of placenta previa: pervious cesareansection, parity, medical complication, uterineanomaly, previous placenta previa, assistedconception, with placenta previa.
The placenta is first organ to develop of the fetusand has several fascinating and critical functions.It mediates implantation and establishes theinterface for nutrient and gas exchange betweenthe maternal and fetal circulation as well asinitiating maternal recognition of pregnancy,
altering local immune environment and alteringmaternal cardiovascular and metabolic functionsthrough the production of pancreatic andendocrine hormones. Abnormalities in any one ofthese functions can be associated with poorpregnancy outcome, ranging from the mildintrauterine growth restriction (IUGR) to thesevere implantation failure and embryonic, fetalor perinatal death. Croos, 2006 who describedhow placental development and function areregulated and the potential role for primaryplacental pathologies in explaining a variety ofrisk factors and complication in humanpregnancy.
Onwere, et al.2011defined placenta previa (PP)as abnormally implanted placenta over ornearthe internal cervical os within 2 cm. Placentapreviahas also been defined as the presence ofplacental tissue over or near the internal cervicalos. PP can be classified into four types based onthe location of the placenta relative to the cervicalos: complete or total previa, in which the placentacovers the entire cervical os; partial previa, inwhich the margin of the placenta covers part butnot all of the internal os; marginal previa, inwhich the edge of the placenta lies adjacent to theinternal os; and low-lying placenta, in which theplacenta is located near (2 to 3 cm) but notdirectly adjacent to the internal os. (Cunningham,et al 2009 and Clark, 2004).
A low lying placenta occurs in 5% of pregnanciesat 16-18 weeks gestation but are evident in only0.5% pregnancies at term(Neilson 2003). Thechange of placental position results from theformation of the lower uterine segment and whichmoves the placenta upwards with the expandinguterus. The incidence of placenta previa is higherin women with a previous caesarean section andincreases in prevalence with each caesareansection(Love and Wallace 1996).The incidence ofplacenta previa was 1.17% (Parijchatt, et al.2009).
In United States, placenta previa occurs in 0.3-0.5% of all pregnancies. The risks increase 1.5-to 5-foldwith a history of cesarean delivery. Ofall placenta previa, the frequency of completeplacenta previa ranges from 20-45%, partialplacenta previa accounts for approximately30%, and marginal placenta previa accounts forthe remaining 25-50% (Singh, et al. 1981).Inindia, according to (Taipale, et al. 1998), theincidence of placenta previa in cases withprevious cesarean section was found to be 3.9percent as compared to an overall incidence of 1.9percent (p <0.01)The proportion of patients with aplacenta previa is increasing as a consequence ofCS. The incidence increases almost linearly aftereach previous CS and as the risks of such acomplication increase with increasingparity,future reproductive intentions are veryrelevant to any individual decision foroperative delivery (David, et al. 2010). Anotherstudy the maximum numbers of cases of placenta
previa are reported after previous I and PreviousII lower segment cesarean section i.e. 35.7% and30.35% respectively see appendixes Table 2.6(Afshan, et al. 2013).
In the meta-analysis of 37 previously publishedstudies from 21 countries, the overall pooledrandom effects odds ratio was 2.20 (95% CI 1.96-2.46). Another study is consistent with those ofthe meta-analysis as the pooled odds ratio for thesix population-based cohort studies that analyzedsecond births only was 1.51 95% CI 1.39-1.65.(Ipek, et.al. 2011). There is an increased risk ofplacenta previa in the subsequent pregnancy afterCS delivery at first birth, but the risk is lower thanpreviously estimated. Given the placenta previarate in England and the adjusted effect of previousCS, 359 deliveries by CS at first birth wouldresult in one additional case of placenta previa inthe next pregnancy (Ipek, et al. 2011). PreviousPP (OR=5.17; 95%,CI= 5.61-7.62) was risk factorfor CS delivery through the study population andcontrols. (Davood, et al.2008).
Women with PP and prior cesarean section are athigh risk for placenta accrete due to lastingdamage to the myometrium and endometrium(Ananth, et al.2003).The previous cesareansection is an important risk factor for thedevelopment of placental complications. Theincidence of placenta previa in the control groupwas 0.33%, opposite to the 1.86% incidence afterone cesarean section (p<0.001), 5.49% after twocesarean sections and as high as 14.28% afterthree cesarean sections in obstetrichistory(Milosević, et al.2009).
Halima, et al.2011 reported the 5267 obstetricaladmissions as: two hundred twenty six werediagnosed as cases of PP. The overall incidencewas( 4.2%n = 5267). Out of these 226 patients, 89were multipara, 99 were grandmultipara andrest were primigrvidas. One hundred sixtypatients had previous history of one or morecaesarean section. From the available data itisconcluded that there is an association betweenincidence of PP with the increase in parity.
From the other study, the one risk factorfor placenta praevia was grand multiparity[OR=2.1 (95% CI 1.6-7.1)] see appendixes table2.3. Birth records of 93 cases with PPcomplicated 0.73% of all deliveries included in
Int. J. Curr. Res. Med. Sci. (2016). 2(9): 22-37
24
the study (n=12834 .(Multiparity was morecommon in patients with placentaprevia78.5%,P<0.001 (Davood, et al. 2008).
Several risk factors for PP exist includingmultiparity, multiple gestations, advancedmaternal age, prior cesarean delivery,myomectomy scarred uterus, manual removal ofplacenta and smoking (Crane, et al.2000).
The use of ART is associated with an increasedrisk of PP. The findings suggest that the increasedrisk may be caused by factors related to thereproductive technology (Romundstad, et al.2006).There were 457 cases of PP 1.2% amongthe 37,702 pregnancies analyzed. Risk factors forplacenta previa included a technology-assistedconception, OR, 4.8; 95% CI, 2.9–7.8 (Hung etal.2007) . Placenta previa were recorded in 13.9per 1000 singleton births. Risk factors for PP,included IVF-ET, RRs = 1.38 and 2.94 (Matsudal,et al.2011).
Factors that significantly associated with uterineabnormalities (odds ratio) odds ratio12.79, 95%CI1.67-97.65. The history of uterine abnormalitiessuch as leiomyoma or uterine septumweresignificantly higher in women with PP than in thecontrol group (Parijchatt, et al. 2009).
There were 457 cases of PP (1.2%) among the37.702 pregnancies analyzed. Risk factors for PPincluded gestational hypertensive diseases 16(3.5) 640 (1.7) 0.01 and gestational diabetes 36(7.9) 2403 (6.5) 0.21 overt diabetes 1 (0.2) 80(0.2) 0.63 (Hung, et al. 2007).
Previous PP (OR=5.17; 95%,CI= 5.61-7.62) wasrisk factor for placenta previa through the controlstudy population (Davood, et al.2008).
2. Materials and Methods
This study comprises two designs the first one is acommunity-based descriptive cross-sectionalqualitative study conducted in Saudi and AlshikhMohamed Ali Fadul Hospital in Omdurman inKhartoum State, Sudan and in department ofObstetrics &Gynecology Najran UniversityHospital, University of Najran Saudi Arabia(KSA)to estimate frequency of occurrence ofplacenta previa after previous cesarean section
and to assess the association of PP and cesareansection during the period (July 2015-July 2016).Two stages sampling technique with probabilityproportionate to the size of population was used.In the first stage pertaining to the study wascollected from the pregnant women throughquestionnaire designed to include the followingdatabase potential confounding variablesincluded: previous cesarean section, parity,uterine anomaly, previous placenta previa,assisted conception, pre-existing hypertension,gestational hypertension, gestational diabetes. Inthe second stage placenta previa was diagnosedby ultrasonography. Primary data has beencollected through data collecting sheet:questionnaires which include dependent andindependent variables. The questionnaires usedwere designed to capture all qualitative data onindicators which were identified to be used in thisstudy. The completed questionnaires wereverified every day and data was entered into aspecifically designed SPSS access database. In theclinics all women were scanned in the thirdtrimester of pregnancy for foetal wellbeing andplacental localization after taking detailedobstetrical history and clinical examination.The doctor and staff nurse on duty in theclinic were trained to enter the information inthe form.
3. Results
Data was collected during the period July 2015-July 2016from 400 pregnant women. Thiscomprises 200 from each department of obstetricsand gynecology in Alshikh Mohamed Ali FadulHospital in Sudan and Hospitals at NajranKingdom Saudi Arabia. In the antenatal clinics,all pregnant women were scanned in theirthird trimester of pregnancy for foetal wellbeingand placental localization after taking detailedobstetrical history and clinical examination. Thepercent of frequencies was calculated toexamine the relationship between parity, perviouscesarean section and age. Also, the number ofthe cesarean section, ethnicity, uterine anomaly,previous placenta previa, assisted conception,pregnancy complications and multiplepregnancies was recorded. As well as, theprevious pregnancy interval and site of placentawith placenta previa was recorded.
Int. J. Curr. Res. Med. Sci. (2016). 2(9): 22-37
25
Table 1 shows 125(31.2%) of all selected samplewomen were found to have placenta previa.Pregnant women in Omdurman city 65(16.2%)
compared to their counterparts in Najran city60(15%) with placenta previa.
Table 1 Shows the distribution of placenta previa in Sudan and KSA
esFigure (1) shows the distribution of previous cesarean section in Omdurman city- Sudan.
Figure (2) shows the distribution of previous cesarean section in Najran city-KSA
Int. J. Curr. Res. Med. Sci. (2016). 2(9): 22-37
26
Table 2 Shows the relation between placentaprevia and previous cesarean section in the studypopulation. It shows that (71) women (17.75 %)in both study groups in Omdurman City andNajran City have both placenta previa andprevious cesarean section. This is in comparison
to (220) women (55.0 %) who have normalplacenta and no history of previous cesareansection. Using chi square test for the associationbetween placenta previa and previous cesareansection is highly statistically significant (p<0.000) Sig. (2-sided).
Table 2 Shows the association between placenta previa and previous cesarean section inSudan and KSA*
Placenta previaPrevious Cesarean SectionAbsent Present Total %
The association between placenta previa and previous cesarean section is (p <0.000)
Figures 3 and 4 shows the distribution of parity tobe cross tabulated with placenta previa to test theassociation between the two conditions. Theparity women constituted one, two, three and
more than three births and prime gravida about22(11.0%), 29(14.5%), 25(12.5%), 76 (38.0%),48 (24.0%) in Sudan and 57(28.5%), 46(23.5%),26 (13.0%) and 29 (14.5%) in KSA respectively.
Figure (3) shows the distribution of parity among the study populationin Omdurman city- Sudan.
Int. J. Curr. Res. Med. Sci. (2016). 2(9): 22-37
27
Figure (4) shows the distribution of parity among the study populationin Najran city-KSA
Table 3 represents the cross tabulation betweenplacenta previa and parity in the two groups of thestudy population. It shows that 118 (29.5 %)multiparous have the highest frequency amongthe study population. At the same time 55 (13.75%) of them have the highest frequency of
presence of placenta previa. This is in comparisonto the rest of women 63 (17.0%) who has noplacenta previa. Using Pearson Chi-Squareshowed a significantly high association betweenplacenta previa and parity (p <0.000).
Table 3 Shows the association between placenta previa and parity inSudan and KSA *
The association between placenta previa and parity is (p <0.000) Sig
Figure (7: A, B & C) shows the distribution of thepregnancy complications of placenta previa: pre-existing hypertension11(5.50%), gestational
hypertension 12(6.0%) and gestationaldiabetes19(9.5%) in Sudan.
Int. J. Curr. Res. Med. Sci. (2016). 2(9): 22-37
28
Figures (7: A, B & C) Distribution of pregnancy complications among the study in Sudan. n = 200
Table 4shows women with pre-existinghypertension were less likely to have placentaprevia 2 (1.0%), gestational hypertension 12(6.0%) and gestational diabetes 8 (4.0%) inSudan. Using Pearson Chi-Square showed no
significant association between PP and pregnancycomplications p <0. 551, p <0. 382 p <0. 566respectively and there had lowest placenta previarisks.
Table 4 Shows pregnancy complications and rate of placenta previa in Sudan
Patientcharacteristic
Women withplacenta previa
Women withoutplacenta previa
Total % statisticalsignificance
Preexistinghypertension
2 (1.0%) 9(4.5%) 11(5.5%) p <0. 551
Gestationalhypertension
12(6.0%) 6(3.0%) 18(9%) p <0. 382
Gestationaldiabetes
8 (4.0%) 11(5.5%) 19(9.5%) p <0. 566
The association between placenta previa pregnancy complications (p <0. 551), p <0. 382 and p <0. 566Insig.
A B
C
Int. J. Curr. Res. Med. Sci. (2016). 2(9): 22-37
29
Also Figures (8: A, B & C) shows the pre-existinghypertension 13 (6.5%), gestational hypertension
11(5.5%) and gestational diabetes 14 (7.0%) inKSA.
Figures (8: A, B & C) Distribution of pregnancy complications among the study KSA. n =200
Table 5 Shows women with pre-existinghypertension were less likely to have PP 3(1.5%),gestational hypertension 2 (1.0%) and gestationaldiabetes 5 (2.5%) in KSA. Using Pearson Chi-
Square showed no significantly associationbetween placenta previa and pregnancycomplications p <0. 818, p <0. 652 and p <0. 862respectively and had lowest PP risks.
Table 5 Shows pregnancy complications and rate of placenta previa in KSA
Patientcharacteristic
Women withplacenta previa
Women withoutplacenta previa
Total % statisticalsignificance
Preexistinghypertension
3(1.5%) 10 (5.0%) 13(6.5%) p <0. 818
Gestationalhypertension
2 (1.0%) 9(4.5%) 11(5.5%) p <0. 652
Gestational diabetes 5 (2.5%) 9 (4.5%) 14(7%) p <0. 862
The association between placenta previa pregnancy complications (p <0. 818), p <0. 652 and p <0.862Insig.
A B
C
Int. J. Curr. Res. Med. Sci. (2016). 2(9): 22-37
30
Figure (9) shows 4(2%) out of the 200 womenwere identified to have uterine anomaly in Sudan.
This is going to be cross tabulated with placentaprevia presence and tested for association.
Figure (9) shows the distribution of uterine anomaly among the study population in Sudan
Table 6 represents the cross tabulation betweenplacenta previa and uterine anomaly in the studypopulation in Sudan. It shows that who have noplacenta previa with uterine anomaly. This is in
comparison to 132 women (66%) who havenormal placenta. Using Pearson Chi-Square itshowed no significant association betweenplacenta previa and uterine anomaly (p <0.746).
Table 6 shows the association between placenta previa and uterine anomaly in Sudan
Total 196 (98 %) 4 (2 %) 200 (100 %)The association between placenta previa and uterine anomaly is (p <0.746) Insig.
Figure (10) shows 20(10.0%) out of the 200women were identified to have uterine anomalyin KSA. This is going to be cross tabulated with
placenta previa presence and tested forassociation.
Figure (10) showing the distribution of Uterine Anomaly among the study population in KSA
Int. J. Curr. Res. Med. Sci. (2016). 2(9): 22-37
31
Table 7 represents the cross tabulation betweenplacenta previa and uterine anomaly in the studypopulation in KSA. It shows that 9 women haveplacenta previa with uterine anomaly. This is in
comparison to 130 women (65 %) who havenormal placenta. Using Pearson Chi-Square itshowed no significant association betweenplacenta previa and uterine anomaly (p <0.562).
Table 7 shows the association between placenta previa and uterine anomaly in KSA
Total 181 (90.5%) 19 (9.5%) 200 (100 %)The association between placenta previa and uterine anomaly (p <0.562Insig.
Among the 200 pregnancies on each one, 12(6.0%) ) in Sudan and 57 (28.5%) in KSA were
pregnant through assisted conception as shownby Figures (11.12).
Figure (11) shows the distribution of assisted conception among the study in Sudan
Table 8 represents the cross tabulation betweenplacenta previa and assisted conception in thestudy population in Sudan. 2(1%) of them havePP with assisted conception, this is in comparison
to 126 women (63.5%) who have normalplacenta. Using Pearson Chi-Square it showed nosignificant association between placenta previaand assisted conception (p <0.455).
Table 8 shows the association between placenta previa and assisted conception in Sudan
Total 188 (94 %) 12 (6 %) 200 (100 %)The association between placenta previa and assisted conception (p <0. 455) Insig.
Int. J. Curr. Res. Med. Sci. (2016). 2(9): 22-37
32
Figure (12) shows the distribution of assisted conception among the study population in KSA
Table 9 represents the cross tabulation betweenplacenta previa and assisted conception in thestudy population in KSA. 8(4 %) have placentaprevia with assisted conception. This is incomparison to 91 women (45.5 %) who have
normal placenta. Using Pearson Chi-Square itshowed no significantly association betweenplacenta previa and assisted conception (p <0.072).
Table 9 shows the association between placenta previa and assisted conception in KSA
Total 143 (94 %) 57 (28.5 %) 200 (100 %)The association between placenta previa and assisted conception (p <0. 072) Insig.
Figures (13.14) shows pervious PP was present in36 (9%) of the 200 Sudanese pregnancies and
pervious PP was present in 12(3%) of the 200Saudi pregnancies.
Figure (13) shows the distribution of Previous Placenta Previa among the study population in Sudan
Int. J. Curr. Res. Med. Sci. (2016). 2(9): 22-37
33
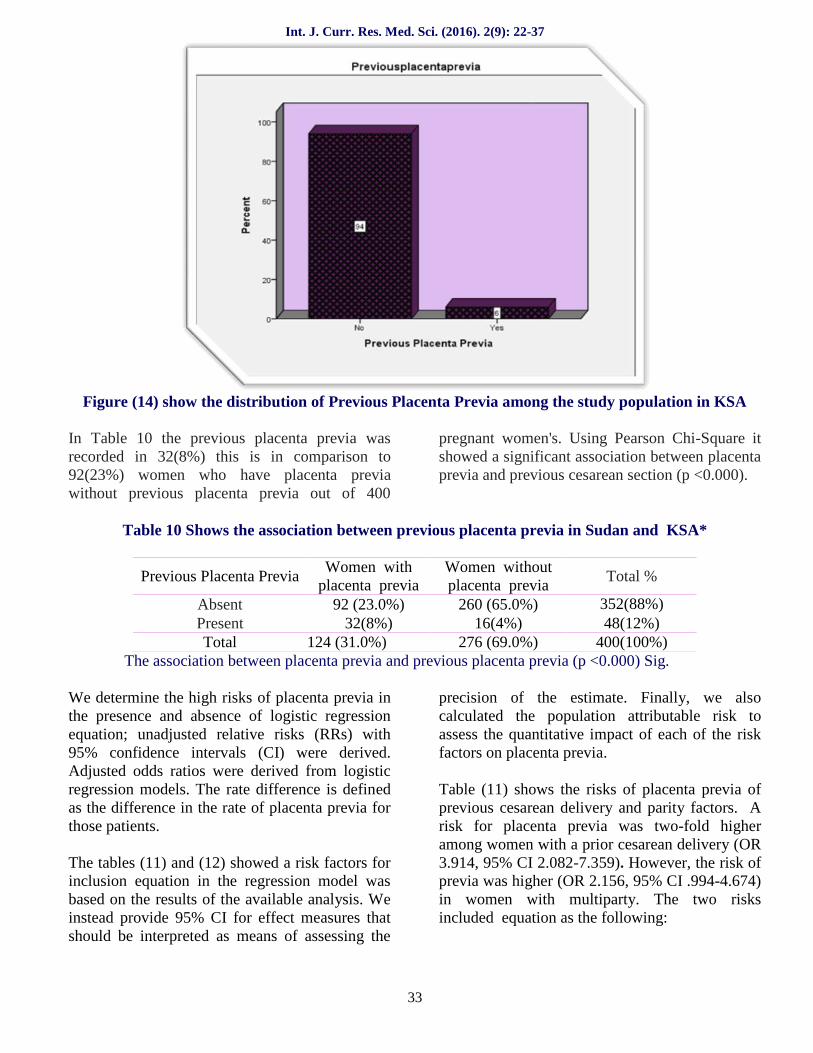
Figure (14) show the distribution of Previous Placenta Previa among the study population in KSA
In Table 10 the previous placenta previa wasrecorded in 32(8%) this is in comparison to92(23%) women who have placenta previawithout previous placenta previa out of 400
pregnant women's. Using Pearson Chi-Square itshowed a significant association between placentaprevia and previous cesarean section (p <0.000).
Table 10 Shows the association between previous placenta previa in Sudan and KSA*
The association between placenta previa and previous placenta previa (p <0.000) Sig.
We determine the high risks of placenta previa inthe presence and absence of logistic regressionequation; unadjusted relative risks (RRs) with95% confidence intervals (CI) were derived.Adjusted odds ratios were derived from logisticregression models. The rate difference is definedas the difference in the rate of placenta previa forthose patients.
The tables (11) and (12) showed a risk factors forinclusion equation in the regression model wasbased on the results of the available analysis. Weinstead provide 95% CI for effect measures thatshould be interpreted as means of assessing the
precision of the estimate. Finally, we alsocalculated the population attributable risk toassess the quantitative impact of each of the riskfactors on placenta previa.
Table (11) shows the risks of placenta previa ofprevious cesarean delivery and parity factors. Arisk for placenta previa was two-fold higheramong women with a prior cesarean delivery (OR3.914, 95% CI 2.082-7.359). However, the risk ofprevia was higher (OR 2.156, 95% CI .994-4.674)in women with multiparty. The two risksincluded equation as the following:
Int. J. Curr. Res. Med. Sci. (2016). 2(9): 22-37
34
Table (11) Shows risk factors of placenta previa in pregnancies after previous cesarean section andparity in Sudan
Y: Log odds of the outcome codded (0,1).A: Constant, intercept, the coefficient of Y when X= 0B: It is the rate of change in Y with any change in XX: The independent variable that predict the probability of the outcome.(Y) Log p/1-p =1.679+ 1.365* Pervious cesarean Section + 0.768* Parity
Table (12) shows the risks of PP were previouscesarean delivery , previous placenta previa andassisted conception factors. A risk for PP two-fold higher among women with a prior cesareandelivery (OR 5.765, 95% CI 2.989-11.120).
However, the risk of PP was higher (OR 18.208,95% CI 2.133-155.424) in women with previousplacenta previa and assisted conception (OR .304,95% CI .127-.730).
Table (12) Shows risk factors of placenta previa in pregnancies after previous cesarean section,previous placenta previa and assisted conception in KSA
Figure (15) shows risk factors which award forincidence of placenta previa in Omdurman andNajran:
Figure (15) Shows a risk factors of incidence of placenta previa.
4. Comments
The study shows that susceptibility ofplacenta previa increases with frequency ofprevious cesarean section, results in damage tothe myometrium and endometrium. This studyrevealed an association of placenta previa withincreasing previous placenta previa and parity inSudan and KSA.
The results obtained with many studies conductedaround the world that confirmed a 2 -5 foldincreases risk of placenta previa with previoushistory of CS, David et al 2010and Afshan, et al.2013 showed that the proportion of pregnantwomen with a placenta previa is increasing as aconsequence of previous caesarean section.Moreover, (Ipek, et.al. 2011) confirmed thepositive linear correlation between placenta previaand caesarean section.
This study found that a multiparous woman is athigh risk of developing placenta previa than awoman of low parity in Sudan and KSA. Halimi2011 reported that women of higher parity have ahigher incidence of developing placenta previa.Also Davood, et al. 2008 showed that multiparitywas more common in patients with placentaprevia. The findings showed a significantincidence of placenta previa after previousplacenta previa in Sudan and KSA.
In the present study, the relationship betweenplacenta previa and uterine anomaly isinsignificant in Sudan and KSA, may be that dueto the small number of patient in our study.Parijchatt et al. 2009 reported a relationshipbetween placenta praevia and uterine anomaly.
The findings of this study show that adjustmentfor potentially confounding factors did notsubstantially alter the association between the useof assisted conception and the occurrence ofplacenta previa in Sudan and KSA. The results ofthe risk factors for placenta previa do not agreewith their reported by Hung et al.2007 but isassociated with an increased risk of placentaprevia in KSA based on the findings of the modellogistic regression method.
In this study showed that women with pre-existing hypertension were less likely to haveplacenta previa. Gestational diabetes andgestational hypertension showed no statisticsignificant association with placenta previa inSudan and KSA. These do not agree with thefindings suggested by Hung et al. 2007. This maybe due to environmental factors.
The findings showed a significant incidence ofplacenta previa after previous placenta previa inSudan and KSA approve with Davood, et al basedto the crosstab analysis. Also am using modellogistic regression method to determined andarranged the risk factors of placenta previa.
Int. J. Curr. Res. Med. Sci. (2016). 2(9): 22-37
36
5. Condensation
Placenta praevia remains a risk factor formaternal complications after previouscaesarean section, paratiy, previous placentaprevia and assisted conception but the commona risk factor was previous caesarean sectionagree with the findings estimated in previousstudies.
6. Acknowledgements
Many thanks and appreciations go to member ofSaudi and Alshikh Mohamed Ali Fadul Hospitalsin Omdurman city in Sudan and NajranUniversity Hospital Department of Obstetrics &Gynecology in Kingdom Saudi Arabia whoencouraged and supported the idea of this work.
References
1. Croos J; (2006). Placental Function inDevelopment and disease. Reproduction,Fertility and development. 18 (1): 71-73.
2. Onwere C, Gurol-Urganci I ,Cromwell DA,et al; (2011). Maternal morbidity associatedwith placenta previa among women who hadelective caesarean section. Eur JObstetGynecol 159 (1): 62-66.
3. Cunningham FG, Leveno KJ, Bloom SL, et al;(2009). Obstetrical hemorrhage. WilliamsObstetrics.(23rd ed.). New York: McGraw-Hill: 757-803.
6. Love, C.D. and Wallace, E.M; (1996).Pregnancies Complicated By PlacentaPrevia: What Is Appropriate Management?An International Journal of Obstetrics &Gynaecology 103 (1): 864-867.
7. Parijchatt A, Tongswatwong P; (2009). RiskFactors Associated with Placenta Previa atMaharat Nakorn Ratchasima Hospital: ThaiJournal of Obstetrics and GynaecologyOctober 17 (1): 212-218.
8. Singh Pm, Rodrigues C And Gupta An;(1981). Placenta previa and previouscesarean Section. Acta Obstetricia EtGynecologica Scandinavica 60 (1): 367–368.
9. Taipale P, Hiilesmaa V and Ylostalo P;(1998). Transvaginal ultrasonography at 18–23 weeks in predicting placenta previa atdelivery. Ultrasound in Obstetrics &Gynecology 12 (1): 422–425.
10. David M and Philip N Bakerk; (2010).Obstetrics and Gynaecology: An evidence-based text for MRCOG (2nd ed.) HolderArnold, an imprint of Hder education London;315-316,408.
11. Afshan A, Samina K, Ayesha I and Misbah K;(2013). Pervious Cesarean Birth. A RiskFactor for Placenta Previa. Esculapio 9 (1):120-122.
12. Ipek G, David A , Leroy C, et al; (2011). Riskof placenta previa in second birth after firstbirth cesarean section: a population-basedstudy and meta-analysis. BMC Pregnancy andChildbirth 11 (1): 95.
13. Davood S, Kazem P and Sepideh E; (2008).Selected Pregnancy Variables in Women withPlacenta Previa. Iran Research Journal ofObstetrics and Gynecology 1(1): 1-5.
14. Ananth CV, Cande V, Demissie K, SmulianJC, et al; (2003). Placenta previa in singletonand twin births in the United States, 1989through 1998: a comparison of risk factorprofiles and associated conditions. Am JObstetGynecol 188: 275-281.
15. Milosević J1, Lilić V, Tasić M, et al; (2009).Placental complications after a previouscesarean section. Med Pregl 62 (5-6): 212-216.
16. Halimi S; (2011). Association of placentaprevia with multiparty and previous cesareansection. JPMI 25 (2): 139-142.
17. Crane JM, Van den Hof MC, Dodds L, et al;(2000). Maternal complications with placentaprevia. Am J Perinatol 17 (1): 101-105.
18. Romundstad L, Romundstad P, Sunde A, etal; (2006). Increased risk of placenta previa inpregnancies following IVF/ICSI; acomparison of ART and non-ART pregnanciesin the same mother. Human Reproduction 21(1): 2353–2358.
Int. J. Curr. Res. Med. Sci. (2016). 2(9): 22-37
37
19. Hung T, Hsieh C, Hsu J, et al; (2007). Riskfactors for placenta previa in an Asianpopulation. International Journal ofGynecology and Obstetrics 97 (1): 26–30.
20. Matsuda Y, Hayashi K, ShiozakiAr, et al;(2011). Comparison of risk factors forplacental abruption and placenta previa. J.Obstet. Gynaecol 37 (6): 538–546.
Access this Article in Online
Website:www.ijcrims.com
Subject:Medicine
Quick Response Code
DOI: 10.22192/ijcrms.2016.02.09.003
How to cite this article:Itedal Abdelraheem Mohamed Ahmed. (2016). Prevalence and Risk Factors of Placenta Previa in SaudiArabia and Sudan 2016. Int. J. Curr. Res. Med. Sci. 2(9): 22-37.DOI: http://dx.doi.org/10.22192/ijcrms.2016.02.09.003