An-Najah National University Faculty of Graduate Studies Prevalence of Asthma and Allergy and Their Risk Factors Among An–Najah National University Students - Nablus - Palestine By Wafa Allam Theeb Minawi Supervisor Dr. Mohammad Musmar Co-supervisor Dr. Samar Ghazal/ Musmar Submitted in Partial Fulfillment of the Requirements for the Degree of Master in Public Health, Faculty of Graduate Studies, at An – Najah National University, Nablus, Palestine. 2005
Transcript
An-Najah National University Faculty of Graduate Studies
Prevalence of Asthma and Allergy and Their Risk Factors Among An–Najah National University
Students - Nablus - Palestine
By Wafa Allam Theeb Minawi
Supervisor Dr. Mohammad Musmar
Co-supervisor Dr. Samar Ghazal/ Musmar
Submitted in Partial Fulfillment of the Requirements for the Degree of Master in Public Health, Faculty of Graduate Studies, at An – Najah National University, Nablus, Palestine.
2005
- III -
TO
MY PARENTS
SISTERS, BROTHERS, AND FRIENDS
WITH LOVE AND RESPECT
- IV -
Acknowledgment
I would like to express my special, deep thanks to my supervisor Dr.
Mohamed Musmar and co-supervisor Dr. Samar Ghazal \ Musmar, for
their supervision, guidance, support and help throughout this study.
I am also grateful to An – Najah University staff and students, Arabic
computer Technicians, volunteers and managers who continue to make this
study possible.
- V -
Table of Contents Subject PageDedication III Acknowledgments IV Table of contents V List of tables IX List of figures XI Glossary XIIIAbstract XIVChapter One: Literature Review & Aim of the Study 1 1.1. Definitions of asthma and allergy 2 1.2. Pathophysiology of asthma and allergy 2 1.3. Common types of allergies 3 1.4. Prevalence of asthma and allergy 4 1.5. Causes and triggers of asthma and allergy 8 1.6. Asthma 15 1.7. Rhinitis 19 1.8. Food allergies 211.9. Stinging insect allergy 23 1.10. Anaphylaxis 24 1.11. Eczema 25 1.12. Allergic conjunctivitis 26 1.13. Drug allergies 27 1.14. Asthma and Allergy In Palestine 28 1.15. Cost of allergy 28 1.16. Prevention 291.17. Treatment 31 1.18. Public health challenges 34 1.19. Aim of the study 361.20. Research hypothesis 37 Chapter Two: Methodology 38 2.1. Introduction 39 2.2. Population of the study 39 2.3. Data collection 39 2.3.1. Questionnaire Component 40 2.3.2. Experimental Part : Peak Flow Meter 41 2.4. Procedure 422.5. Data analysis 44 2.5.1. Analysis of descriptive studies 44 2.5.2. Analysis of medical history 44 2.5.3. Analysis of relationship 44
- VI -
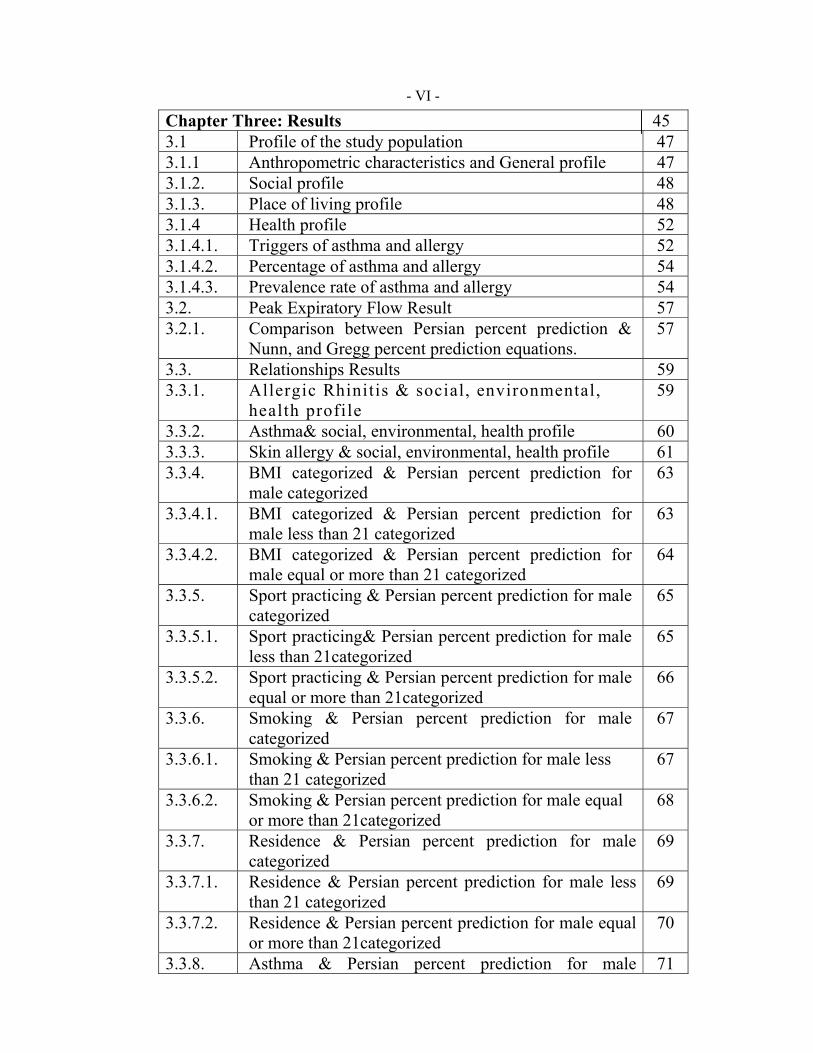
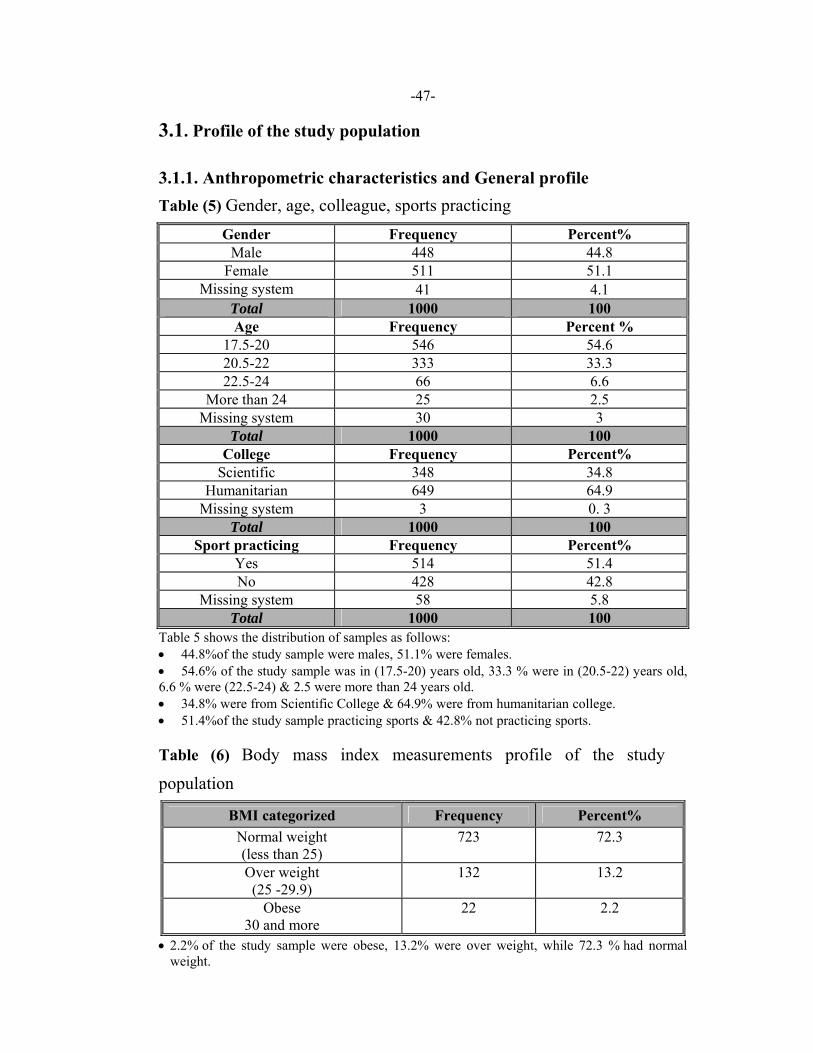
Chapter Three: Results 45 3.1 Profile of the study population 47 3.1.1 Anthropometric characteristics and General profile 47 3.1.2. Social profile 48 3.1.3. Place of living profile 483.1.4 Health profile 52 3.1.4.1. Triggers of asthma and allergy 52 3.1.4.2. Percentage of asthma and allergy 543.1.4.3. Prevalence rate of asthma and allergy 54 3.2. Peak Expiratory Flow Result 57 3.2.1. Comparison between Persian percent prediction &
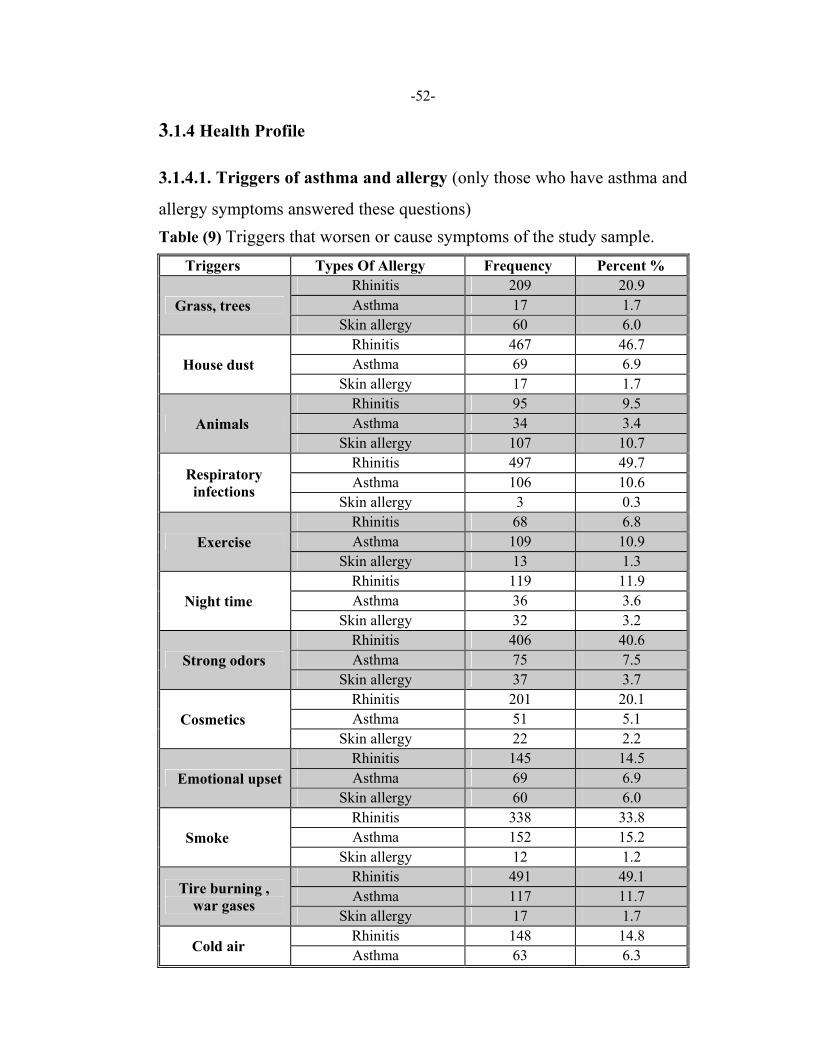
Table 9 Triggers that worsen or cause symptoms of population samples 52
Table 10 Percentage of asthma and allergy 54 Table 11 Prevalence rate of asthma and allergy 54 Table 12 Distribution of allergic disease according to the study
sample genders 55
Table 13 Distribution of allergic disease according to the study sample residence 56
Table 14 Comparison between Persian percent prediction, Nunn, and Gregg percent prediction equations for males groups.
57
Table 15 Comparison between Persian percent prediction and Nunn and Gregg percent prediction equations for females groups
58
Table 16 Allergic rhinitis& social, environmental, health profile relationships 59
Table 17 Asthma & social, environmental, health profile relationships 60
Table 19 BMI categorized & Persian percent prediction for male less than 21 categorized 63
Table 20 BMI categorized & Persian percent prediction for male equal or more than 21 categorized 64
- X -
Table 21 Sport practicing & Persian percent prediction for male less than 21 categorized 65
Table 22 Sport practicing & Persian percent prediction for male equal or more than 21 categorized 66
Table 23 Smoking & Persian percent prediction for male Less than 21 categorized 67
Table 24 Smoking & Persian percent prediction for male equal or more than 21 categorized 68
Table 25 Residence & Persian percent prediction for male less than 21 categorized 69
Table 26 Residence & Persian percent prediction for male equal or more than 21 categorized 70
Table 27 Asthma & Persian percent prediction for male less than 21 categorized 71
Table 28 Asthma & Persian percent prediction for male equal or more than 21 categorized 72
Table 29 BMI & Persian percent prediction for female less than 21 categorized 73
Table 30 BMI & Persian percent prediction for female equal or more than 21 categorized 74
Table 31 Sports & Persian percent prediction for female less than 21 categorized 75
Table 32 Sports & Persian percent prediction for female equal or more than 21 categorized 76
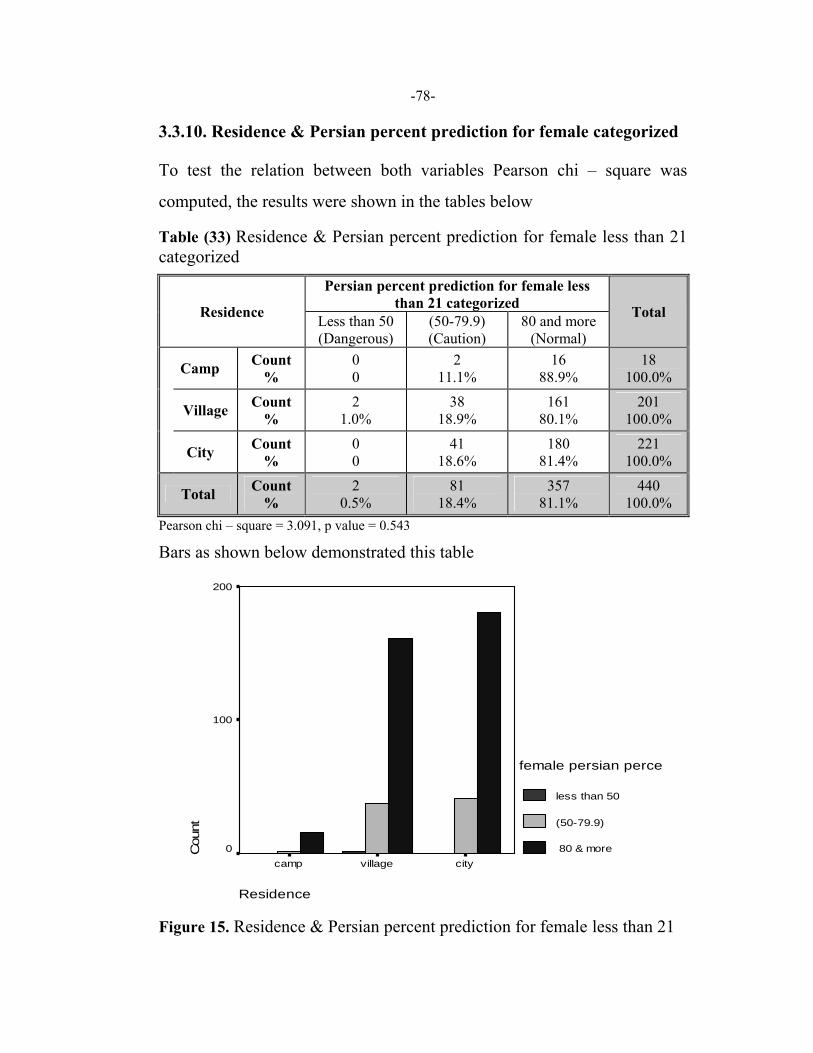
Table 33 Residence & Persian percent prediction for female less than 21 categorized 77
Table 34 Residence & Persian percent prediction for female equal or more than 21 categorized 78
Table 35 Smoking & Persian percent prediction for female less than 21 categorized 79
Table 36 Smoking & Persian percent prediction for female equal or more than 21 categorized 80
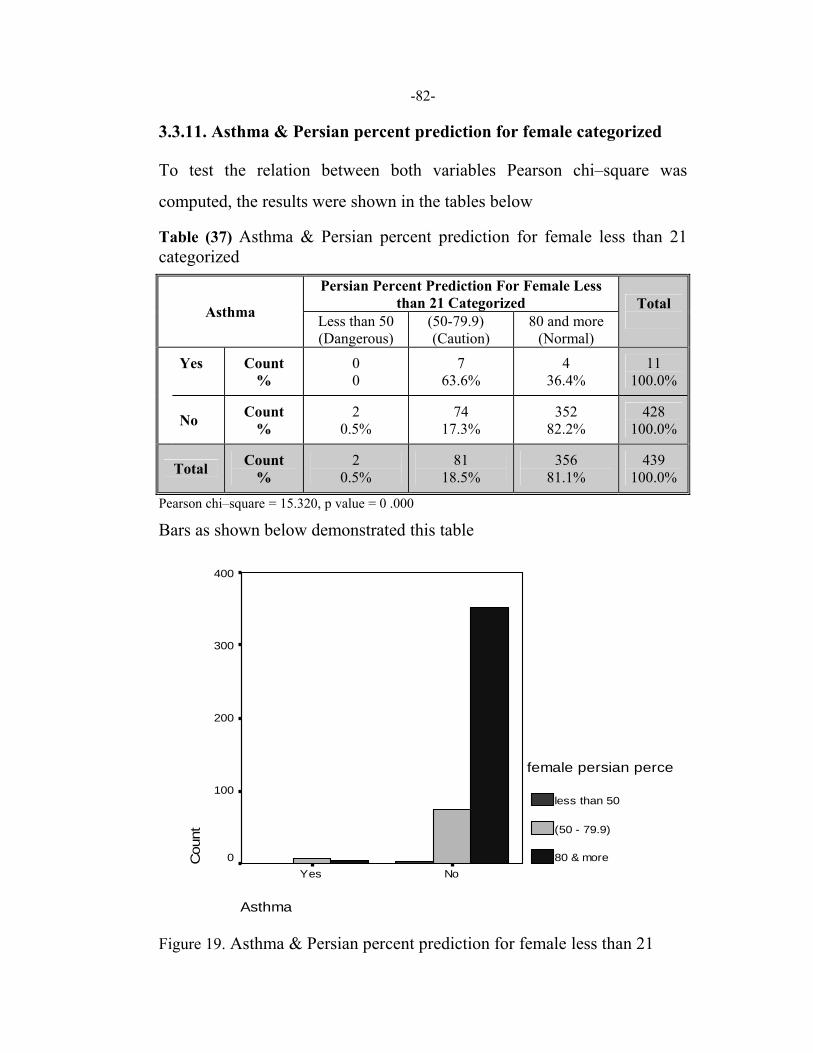
Table 37 Asthma & Persian percent prediction for female less than 21 categorized 81
Table 38 Asthma & Persian percent prediction for female equal or more than 21 categorized 82
- XI -
Lists of Figures Figure Title Page
Figure 1 BMI & Persian percent prediction for male Less than 21 relation ship 63
Figure 2 BMI & Persian percent prediction for male equal or more than 21 relation ship 64
Figure 3 Sport practicing & Persian percent prediction for male less than 21 65
Figure 4 Sport practicing & Persian percent prediction for maleequal or more than 21 relation ship 66
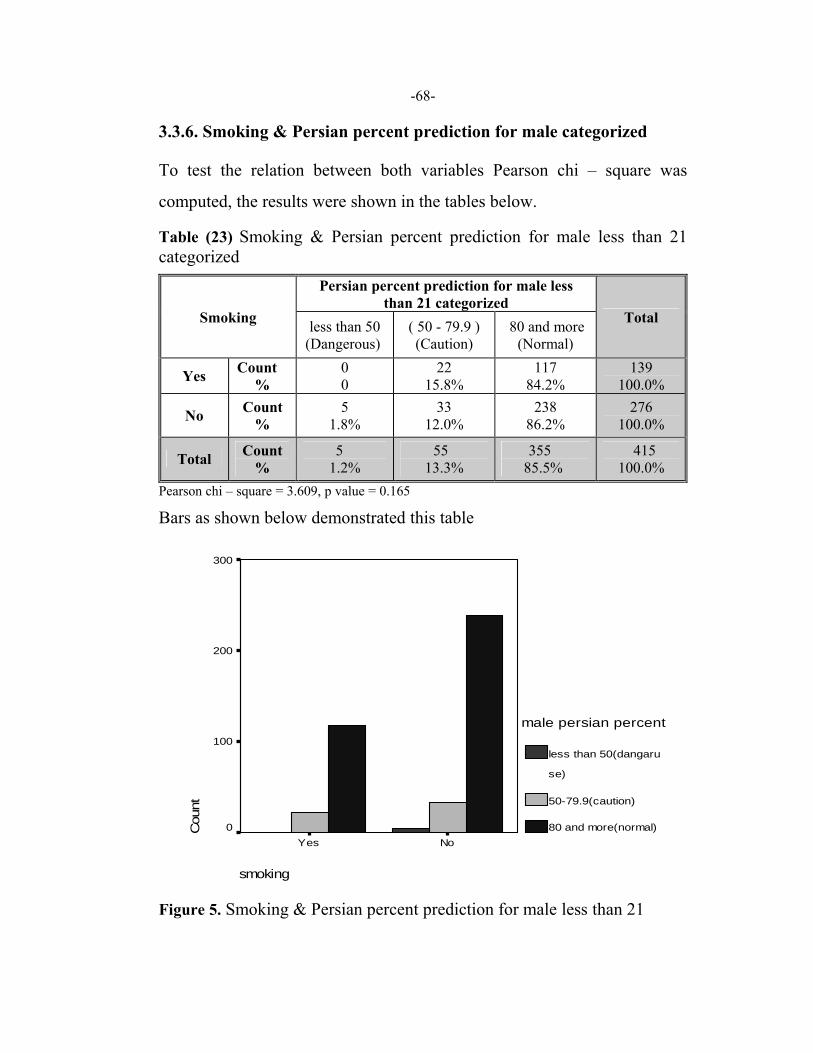
Figure 5 Smoking & Persian percent prediction for male less than 21 relation ship 67
Figure 6 Smoking & Persian percent prediction for male equal or more than 21 relation ship 68
Figure 7 Residence & Persian percent prediction for male less than 21 relation ship 69
Figure 8 Residence & Persian percent prediction for male equal and more than 21 relation ship 70
Figure 9 Asthma & Persian percent prediction for male less than 21 relation ship 71
Figure 10 Asthma & Persian percent prediction for male equal or more than 21 relation ship 72
Figure 11 BMI & Persian percent prediction for female less than 21 relation ship 73
Figure 12 BMI & Persian percent prediction for female equal or more than 21 relation ship 74
Figure 13 Sport & Persian percent prediction for female less than 21 relation ship 75
Figure 14 Sport practicing & Persian percent prediction for female equal or more than 21 relation ship 76
Figure 15 Residence & Persian percent prediction for female less than 21 relation ship 77
Figure 16 Residence & Persian percent prediction for female equal or more than 21 relation ship 78
Figure 17 Smoking & Persian percent prediction for female less than 21 relation ship 79
Figure 18 Smoking & Persian percent prediction for female equal or more than 21 relation ship 80
Figure 19 Asthma & Persian percent prediction for female less than 21 relation ship 81
Figure 20 Asthma & Persian percent prediction for female equal or more than 21 relation ship 82
- XII -
Glossary • Allergen: a foreign substance that triggers an allergic response in a
susceptible person.
• Allergies: are hypersensitivity reactions of the immune system to
specific substances called allergens.
• Asthma: a eversible obstruction of airway due to bronchial
hyperactivity, associated with inflammation of the airway.
• Atopy: refers to the inherited predisposition to allergic disease.
• BMI: body mass index.
• Chest tightness: A symptom of asthma caused by over inflation of the
lungs due to the difficulty in pushing air out through obstructed air
passages.
• ECRHS: The European community respiratory health survey.
• Eczema: is an inherited skin sensitivity that can be easily irritated by
many factors.
• IgE: The immune system makes immunoglobulin type E (IgE)
antibodies against that specific allergy producing substance, or allergens.
• ISAAC: international study of asthma and allergies in childhood.
• NHIS: national health interview survey.
• NSAIDs: non-steroidal anti – inflammatory drug.
• Peak expiratory flow (PEF): is the maximum flow achieved during
- XIII -
Expiration delivered with maximal force starting from the level of
maximal lung inflation.
• Peak flow meter: a small, portable monitoring device that measures the
amount of effort to force air out of the lungs.
• PFTs: Pulmonary function tests.
• Prevalence: the prevalence of a disease is the number of cases defined
population at specified point time (R.Beaglehole, et al).
• Rhinitis: is inflammation of the membrane tissue in the nose , causing
sneezing, a runny nose , and a blocked nose.
• The Forced Expiratory Volume in 1 second (FEV1) is the volume of air
expired in the first second. This is an important predictor of outcomes in
patients with COPD.
• Triggers: An Irritating substance or condition to which a person reacts
when they are exposed.
• Wheeze: a symptom of asthma caused by the whistling sound made
when air is pushed past an obstruction or narrowed area of an airway.
• Persian: study were to derive equations for the prediction of normative
spirometry values for a large population of Persians in Isfahan..
- XIV -Prevalence of Asthma and Allergy and Their Risk
Factors Among An–Najah National University Students - Nablus - Palestine
By Wafa Allam Theeb Minawi
Supervisor Dr. Mohammad Musmar
Co-supervisor Dr. Samar Ghazal/ Musmar
Abstract Asthma and allergic conditions have become more prevalent during the
past three decades. Asthma causes significant morbidity and mortality and
has resulted in a towering public health burden. Inhalant allergic
conditions such as seasonal and perennial allergic rhinitis are also quite
common. The effect of asthma and allergy on an individual's quality of
life and the extent to which it may restrict daily activities is often
overlooked. Controlling allergies can significantly decrease health care
cost as the purpose of asthma and allergy treatment is to manage the
disease in order to live as normal a life as possible and this also can be
done by providing community and professional education.
The purpose of this study, a first of its kind in this age group in Palestine,
is to estimate the prevalence of asthma and allergy among young adult
population in Palestine represented by An- Najah University students.
The study sample consisted of around 1000 randomly selected students
from all colleges of the University. The researcher collected the data
through student group interview. Self reported questionnaire were filled,
then PEF measurement was done based on the expert panel report 2.The
results were recorded and the level of error was corrected for by using
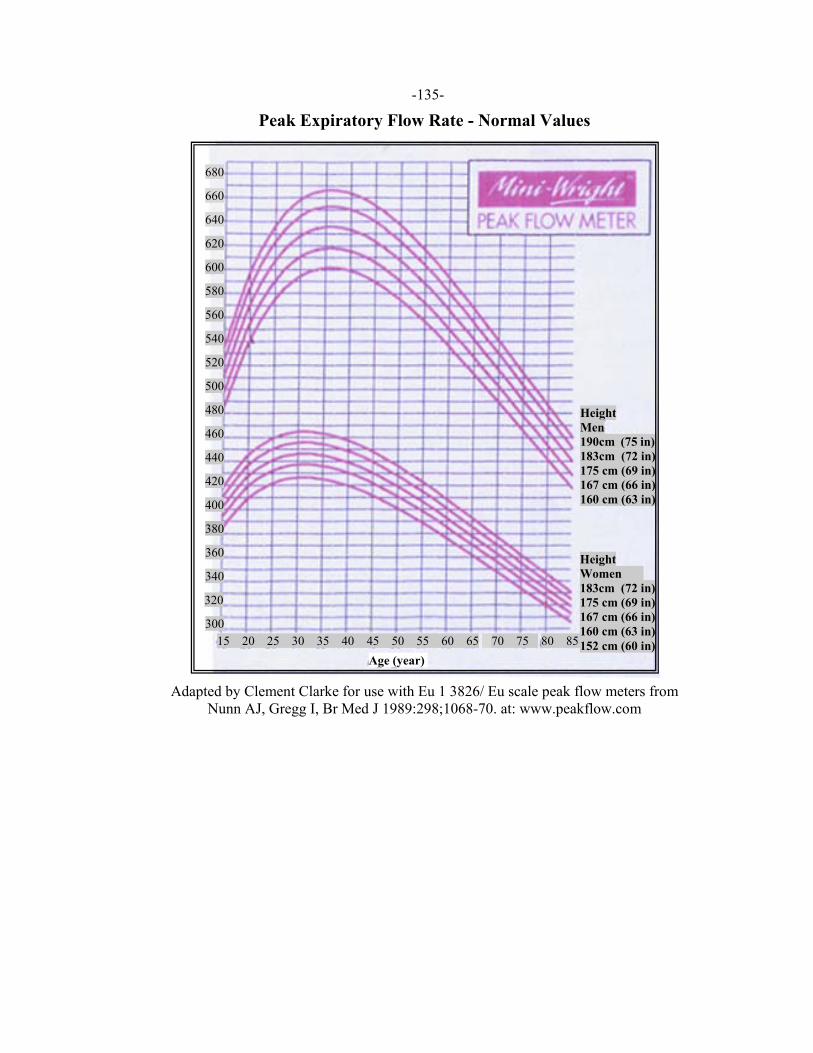
equation for PEF derived by Millar et al 1992. Predicted values were
calculated for each individual with the Persian equations & Nunn and
- XV -
Gregg equations.
All data of the questionnaire and PEF measurement for the study sample
were entered into the computer and computed using SPSS program and
applying Chi–square test, with 95 % level of significant (P value =
0.05).Although some results were inconsistent with the literature,
especially those related to global asthma and allergy risk factors, we had
important positive results.
The following points worth reporting:
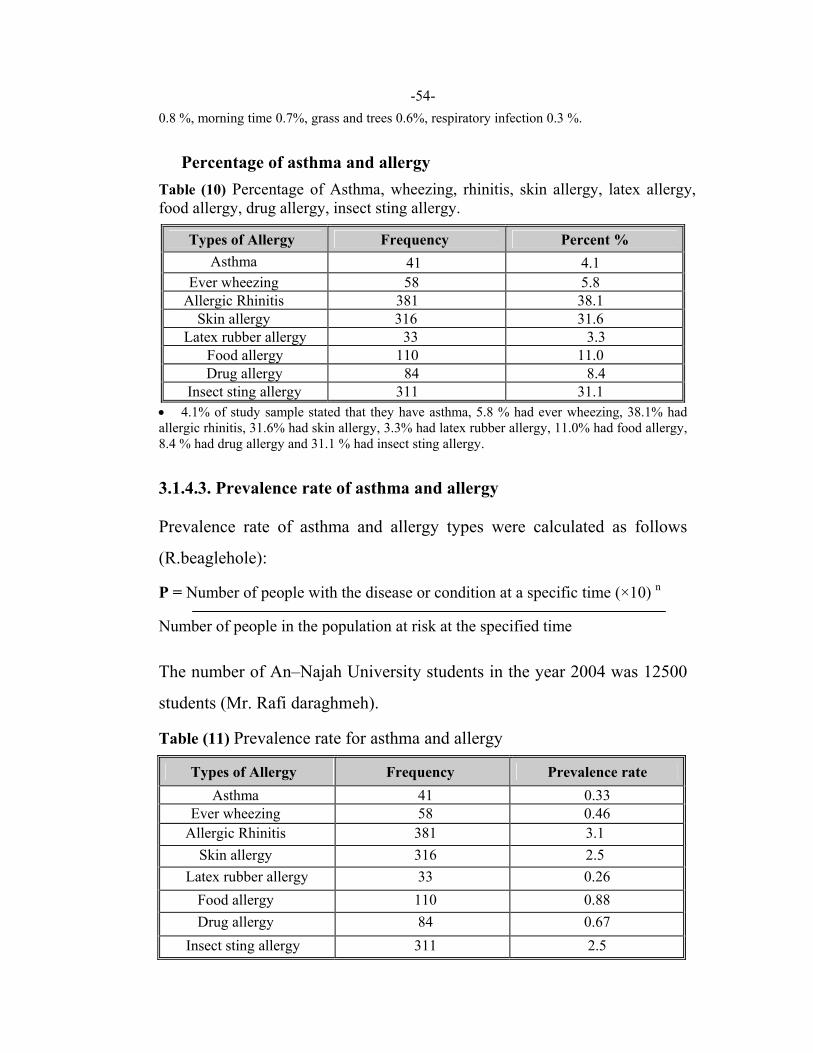
• Physical diagnosis asthma prevalence was 0.33% and the prevalence of
ever wheezing was 0.46%, the prevalence of allergic rhinitis, skin allergy,
latex rubber allergy, food allergy, drug allergy and insect sting allergy
were 3.1 % 2.5% 0.26% 0.88% 0.67% and 2.5% respectively.
• The prevalence of asthma and allergy in Palestine was markedly lower
than that of Israel; however, our results were close to another study
carried out in Duzce in Turkey.
• Our results indicate male predominance for those who have asthma &
skin allergy.
• Upon the distribution of allergic disease for study samples according to
their residence, the results show that the highest percentage of asthmatic
subjects were from villages, and the highest percentage for those who
have skin allergy were from the camps.
• Prevalence of asthma in our study doesn't appear to be related to the
social or environmental factor.
• Neither gender nor residence & environmental factors have statistically
- XVI -
significant relationship with allergic rhinitis.
• Poor housing conditions of refugee camps dampness (which
encourages the growth of moulds, dust, mites, ect.) might explain the
double percentage of skin allergy in refugee camps than other places.
• Adult Palestinian have minimally lower peak expiratory flow value
and prediction equations based on European population may not perform
well for them .Adoption of Persian equation for PEF seems to be more
accurate for young adult Palestinians.
• Further studies on large scale for asthma and allergy in Palestine, and
the proper use & value of PEF for Palestinians are called for.
CHAPTER ONE
LITERATURE REVIEW
AND AIM OF THE STUDY
-2-
Literature Review And Aim of the Study
1.1. Definitions of Asthma and Allergy
Allergies are hypersensitivity reactions of the immune system to specific
substances called allergens, the most severe form of allergy is anaphylactic
shock, which is a medical emergency, (www.hon.ch\library). Asthma has
been defined as reversible obstruction of airway due to bronchial
hyperactivity, associated with inflammation of the airway, (Tatter Field et
al, 2002). Asthma and allergic conditions have become more prevalent
during the past three decades, (Eupton et al, 2000).As one of the United
States most common chronic conditions, asthma causes significant
morbidity and mortality and has resulted in a towering public health
burden. In the United States, asthma was primary reason for 10.4 million
office visits and 1.8 million emergency department (ED) visits in year
2000,(CDC 2000-2001). Inhalant allergic conditions such as seasonal and
perennial allergic rhinitis are also quite common; they affect as many as 40
to 50 million people in the United States and often accompany asthma,
(Nayak, 2003).
1.2. Pathophysiology of Asthma and Allergy
Although links between allergy and asthma have been known for many
years, they were recently reemphasized. In fact, estimates show that 60 to
78 percent of people who have asthma also suffer from allergic rhinitis,
which is implicated as a trigger for asthma attacks among adults and
children. Controlling allergic rhinitis appears to help control the symptoms
of asthma, (Nayak 2003). However, more focused linkage studies have
identified some common chromosomal linkage between atopic dermatitis
-3-
(AD) and asthma. The AD linkages do correspond with known asthma
loci, indicating that AD shares genetic determinants with asthma, (Foister
et al 1998,and Beyer et al 2000). Allergy comes about when the immune
system, which is there to protect us from harmful invaders like viruses and
bacteria, reacts to a normally harmless substance like pollen. The immune
system makes immunoglobulin type E (IgE) antibodies against that
specific allergy – producing substance, or "allergens", these IgE antibodies
attach to the surfaces of two types of immune system cells: mast cells and
basophiles. When these IgE antibodies encounter the allergen they were
manufactured to recognize–like the pollen grain–they attack it and trigger
the cells to release packets of chemicals they contain, those chemicals
include histamine and other compounds that cause the symptoms like
runny nose itchy eyes and sneezing that you know as an allergy, (MFMER,
2004).
1.3. Common Types of Allergies
The following are different types of allergies described in the medical
literature, (cross et al 1998):
• Asthma
• Rhinitis – both seasonal (hay fever) and perennial
• Food allergy
• Stinging insect allergy
• Anaphylaxis
• Eczema
• Allergic Conjunctivitis
• Drug allergy
-4-
1.4. Prevalence of asthma and allergy
The European community respiratory health survey (ECRHS) which was the first study to assess the geographical variations in asthma and allergy among adults , has shown that there are large geographical differences in the prevalence of asthma, atopy and bronchial responsiveness, with high
prevalence rate in English speaking countries and low prevalence rates in the Mediterranean region and Eastern Europe, (Janson et al, 2001).
1.4.1. Asthma and allergy prevalence worldwide
• In 1998 international study of asthma and allergies in childhood (ISAAC)
steering committee conducted study to investigate worldwide prevalence
of asthma, allergicrhino conjunctivitis, and atopic eczema. A total of
463801 children aged 13-14 years in 155 collaborating centers in 56
countries results showed differences of between 20 fold and 60 fold
between centers in the prevalence of symptoms of allergy. For asthma
symptoms, the highest 12-month prevalence were from centers in the UK,
Australia, New Zealand and republic of Ireland, followed by centers in
North, central and South America. The lowest prevalence was from centers
in several eastern European countries, Indonesia, Greece, China, Taiwan,
Uzbekistan, India, and Ethiopia. For allergic rhino conjunctivitis, the
centers with the highest prevalence were scattered across the world. The
centers with lowest prevalence were similar to those for asthma symptoms.
For atopic eczema, the highest prevalence came from scattered centers
including some from Scandinavia and Africa that were not among centers
with the highest asthma prevalence, the lowest prevalence rates of atopic
eczema were similar in centers as for asthma symptoms. (ISAAC, 1998).
-5-
1.4.2. Allergy prevalence in the Middle East countries
• According to a study on the prevalence of asthma in children living in
villages ,cities and refugee camps in Palestine, in autumn of 2000, the
crude prevalence rate for wheezing –ever," wheezing in the previous 12
month, and physician –diagnosed asthma" were 17.1, 8.8, 9.4 %
respectively, with urban area having higher prevalence rate than rural
areas. Within urban areas, refugee camps had higher prevalence rate than
cities, the prevalence of asthma and asthma symptoms in Palestine appears
to be close to that of Jordan, but is much lower than Israel, (El–Sharif et al,
2002).
• Another study was carried out on the differences in the prevalence of
asthma and current wheeze between Jews and Arabs, showed that the
prevalence of asthma and current wheeze was significantly higher in
Jewish children compared with Arab children. The asthma prevalence was
7.8% for Jewish children and 4.9% for Arab children, (Shohat et al, 1997).
• A study of prevalence of self – reported allergic conditions in adult
population in Israel showed that allergic conditions were higher in the
Israeli Arab population and those with low income and low education
Level, (Shahar and Lorber, 1999).
• Screening for asthma and associated risk factors among urban
schoolchildren in Abha city, Saudi Arabia showed that the prevalence of
asthma in schoolchildren in Abha is greater than that reported from most
developing countries and closer to the rates reported in developed
Countries, (Al Shehri et al, 2000).
• Prevalence of asthma symptoms was surveyed in Omani school children,
-6-
the results showed that the estimated mean national 12-month prevalence
of any wheeze, night waking with wheeze, speech limiting wheeze and
exercise wheeze were respectively 7.8%, 3.5%, 3.2% and 6.4% for the (6 -
7) year age group and 8.9% 2.9%,4% and 19.2% for the 13-14 year age
group. Both age groups reported high Prevalence of night cough (19.6 %
and 20.9% in the younger and the older children respectively). The
prevalence of self – reported asthma diagnosis was higher in the older age
(20.7%) vs. (10.5 %), in the younger age group, the diagnosis of asthma
was more common in boys, (Riyami et al, 2001).
• A cross –section study on the Frequency of allergic rhinitis in school –
age children (7-18) in Tehran showed that 23.5% of screened children had
allergic rhinitis (AR).The total prevalence for asthma was 3.5%, and 7.2%
in AR subjects, the prevalence 7.2% in the AR subjects. The prevalence of
cautanous allergy also was 35.8% in children with AR. The positive
history of atopy (AR, asthma or cautanous allergy) in the first-degree
relative was detected in 47.9%, of (AR) cases, (Ghazi et al, 2003).
1.4.3. Asthma and allergy prevalence in Western countries
• International study of asthma and allergies among children in 2 Canadian
cities. (Hamilton Saskatoon) showed that The prevalence of eczema was
slightly higher in Saskatoon in both age groups, 6-7 years old and 13- 14
years old (Habbick et al,1999).
• Results from the national health interview survey (NHIS) in the United
States indicate that gender and age affect the prevalence of asthma. This
study showed that: In children, the prevalence of asthma is higher in boys
than girls. The male – to –female ratio of asthmatic is 3:2 among children
-7-
ages 6-11 and increases to an 8:5 ratio among those ages 12-17. In adults,
and particularly among those ages 45-74, the gender ratio reverses. In this
age –groups, asthma is more prevalent in Women, (Mannino et al, 1998).
• A study on the prevalence of asthma and other atopic diseases in
Australian children showed that the prevalence of wheeze was
Significantly higher in boys (27.4%) than girls (21.7%). Children born in
Australia were more likely to report current wheeze than those born
elsewhere, (Robertson et al, 1998).
• A study about prevalence of asthma and allergy (part of ISAAC study) in
Scandinavia and eastern Europe showed that the prevalence of wheezing
among the 13-14 year old children was high in Finland and Sweden, low in
Estonia Latvia and Poland , and very low in Albania, Romania, Russia,
Georgia and Uzbekistan (except Samarkand). The prevalence of itching
eyes and flexural dermatitis varied in a similar manner between the three
regions. The regional differences were less pronounced among the 6-7 year
old children in the seven participating centers. The highest prevalence of
rhinitis was recorded in April –July in Scandinavia and during the winter
months in the other countries. The prevalence of atopy related disorders
was higher in Scandinavia than in Estonia, Latvia and Poland, which in
turn had a higher prevalence than five other countries of Eastern Europe
with a culture less similar to Western Europe, (Jorksten et al, 2004).
1.4.4. Asthma and allergy prevalence in China
• An (ISAAC) study about prevalence of asthma and allergy in Hong Kong
school children at age (13-14) year showed that the prevalence rates of
asthma ever, wheeze ever, and current wheeze were 11,20 and 12%,
-8-
respectively, and were greater in boys. Rhinitis affected slightly over half
of the subjects (52%) and eczema was reported by a sixth (15%), while
current rhinitis and current eczema were present in 44% and 3.6% of
children, respectively. Parental education and passive smoking were not
important factors when compared to previous epidemiology data obtained
in 1992, the prevalence rates for asthma ever and wheeze ever had
increased by 71 and 255%, respectively, in Hong Kong school children.
The severity of asthma and respiratory symptoms showed a similar
increasing trend, (Leung et al, 2004).
1.4.5. Asthma and allergy prevalence in Africa
International (ISAAC) study of asthma and allergies in 6-7 year old carried
out in Nigeria primary school children demonstrated a high prevalence of
atopic conditions among children in Ibadan, Nigeria, with more than three
fifths of the children who had current wheezing also showing symptoms of
other atopic diseases, (Falade et al, 2004). In review all the pervious
studies, the prevalence of asthma and allergy are generally lower in Middle
East than in more developed countries and there are not enough
comprehensive studies about asthma and allergies prevalence in Arab
countries, including Palestine.
1.5. Causes and triggers of asthma and allergy
The tendency to have asthma and other atopic disease is inherited, probably on several genes. The increase in prevalence of asthma over the past two to three decades is unlikely to be explained by a change in genetic
constitution and more likely reflects environmental changes leading to
condition being activated in an increased number of genetically susceptible
people. International comparisons of prevalence suggest a correlation with
-9-
the process of "westernization" or modernization, (Taylor 1995). Perhaps
the rapid increase in vehicular traffic that has occurred in recent years, and
its associated emissions, has been one of the major contributory factors to
sharp rise in the prevalence of allergic disease. The finding from various
experimental and epidemiological studies, (Peterson, Saxon 1996), has
supported this prevalence.
1.5.1. Out door allergens (such as tree, grass, weed pollens and mold
spores).
A study was carried out in the southern part of Switzerland in 1990 - 1993
to determine the spectrum of cutaneous sensitivity to a large amount of
pollens and several perennial allergens. At the top of allergens list were
grasses – pollens (72 % of the patient had sensitivity). Of real interest in
this study area are, besides the classical allergy – inducing pollens, those of
chestnut, parietaria, olive tree, ash tree, and cupressaceous (for example
cypress). Chestnut pollens represent about 30% of the airborne pollens in
this region, 30% of the patient had sensitivity against dust mites. And 20 %
against cats. Sensitivity against mould spores was 2- 9 %, (Gilardiet et al
1994).The exact prevalence of fungal allergy is not known. Studies based
on skin tests suggest that at least 3-10 % of adults and children worldwide
are affected by fungal allergy, (Bush et al 2001, Kurupet et al 2000).
1.5.2. Indoor allergens
(Such as house dust mites, cockroaches, animal dander, painting,
environmental tobacco smoke, volatile organic compound). Home
dampness at least maintains currently symptomatic asthma, allergic rhinitis
and atopic dermatitis, and increase the susceptibility to common colds and
possibly to other respiratory infections, (Kilpelainen et al 2001).
-10-
• Cockroaches: increasing interest has been developing about the role of
cockroach allergens in asthma and allergy. The presences of anti –
cockroach IgE has been shown to be a risk factor for acute asthma in a
number of recent studies. It tends to be most important in asthmatics living
in poor inner city accommodation, (Rosentreich et al 1997).
• Animal dander: Hypersensitivity in proximity to animals has also been
known for a long time. A variety of animals can lead to sensitization, cats
produce three main allergens: FeId 1 is a protease,and is found on the fur,
within sebaceous glands, and in saliva. FeId 1 survives well in the
domestic environment, and has been detected in homes 10 years after a cat
was last present, (Peat et al 1991).
• Indoor exposure to formaldehyde, volatile organic compound and
house dust mite significantly increased the risk of having asthma,
(Rumchev 2004).
• Environmental tobacco smoke (ETS) contains over 4000 compounds
including several carcinogens, irritants, and toxic agents. There is
convincing evidence of parental smoking causing asthma in children, but
the evidence on (ETS) exposure and development of adult asthma is
limited, (Jaakkola 2000). This question is of major public health relevance,
as the occurrence of both (ETS) exposure and asthma is relatively common
in working place, (Thorn et al 2001). A study conducted on the effect of
(ETS) and asthma in adulthood, indicating an increased risk of asthma in
relation to (ETS), (Jaakkola et al 2004).The same study provides evidence
of the effect of (ETS) exposure on development of asthma in adulthood,
both workplace and home (ETS) exposure seem to be of importance. The
adverse effect of cumulative workplace exposure seems to be strong, but
-11-
from a preventive point of view it is also important that past – year (ETS)
exposure has a great effect on people's risk developing asthma and this
study indicates that (ETS) is an important preventable cause of asthma in
adulthood, (Jaakkola et al 2004).
1.5.3. Smoking
There has been well – known association between tobacco smoking and
chronic obstructive pulmonary disease. The Piipari study, within its design
aspects, suggests smoking to be an underestimated contributing factor to
asthma development, (Piipari et al 2004). A review paper, further
strengthens the argument that smoking produces adverse effects in the
airway of asthmatic individuals, (Thomson et al 2004).
1.5.4. Diet and drugs
The occurrence of asthma and allergy are related to lifestyle factors,
dietary pattern may be one of the contributing factors. Analysis of the first
nutrition and health survey in Taiwan indicates that protein – rich and fat –
rich foods of animal origin were associated with a higher prevalence of
asthma in teenagers, (Huang et al, 2001). According to Thorn, antioxidant
nutrients, especially vitamin C and E, Selenium, and Zinc appear to be
necessary in asthma treatment, (Thorn 2001). There is a convincing
evidence that body mass index (BMI) has increased in the last 10-30 years
in developed countries. A rise in the prevalence of asthma in these
countries seems to have occurred over the same time period, (Turn bull et
al 2004). BMI has been associated with asthma symptoms and severity in a
large number of studies of adults, (Scachter et al 2001 and Jarvis et al
2002) and children (Castro et al 2001), although in some populations the
associations is limited to girls (Fegueroa et al 2001), and women, (Chen et
-12-
al 2002). An ecological analysis was performed to measure international
association between paracetamol sales and atopic disease prevalence in
children and adults. Published data from ISAAC and ECRHS were used.
(Paracetamol sales were high in west European countries, and were
positively associated with asthma symptoms, eczema and allergic
rhinoconjunctivitis in children (ISAAC) and with wheeze diagnosis
asthma, rhinitis and bronchial responsiveness in adults (ECRHS), (Newson
et al 2000).
A limited number of worldwide studies have provided estimate of the
prevalence of aspirin intolerant asthma (AIA) that ranges from 1-2 up to
20%, (Hedman et al 1999). The prevalence of respiratory symptoms
triggered by aspirin, Non –Steroidal Anti – Inflammatory Drugs (NSAIDs)
use was found to be 10 –11 % in patients with asthma and 2.5% in non –
asthmatic, (Vally et al 2001).
1.5.5. Environmental and occupational exposure
In subsequent analyses of combine ECRHS data set, a higher risk factor
for asthma was found in farmers, painters, plastic workers, cleaners and
agricultural workers. Working as a cleaner increased the risk of asthma by
> 30%. After creating a job exposure matrix, asthma was found to be
associated with high dose exposure to biological and mineral dust, as well
as exposure to gases and fumes. The proportion of asthma attributed to
occupational exposure was estimated to be 5-10%, (Kongevinas et al
1999). Air pollutants can be broadly broken into photochemical oxidants
(ozone and NOx), sulphur dioxide and SO2 particulate complexes, acid
aerosols (such as sulphuric and nitric acid) and particulates. Several
epidemiological studies revealed a concomitant increase in the prevalence
-13-
of allergic disease with the number of vehicles on the road, during the past
40 years. The global vehicular fleet has expanded 10- fold, and
investigators have predicted that the number of vehicles will increase even
further during the next 20-30 years. Estimation by the United Nations
indicates that more than 600 million people who live in cities and towns
world wide are exposed to unhealthy and dangerous levels of motor –
vehicle –generated air pollutants, (Braun – Fahrland et al 2004).
1.5.6. Genetic factor
ADAM33 was the first major novel gene associated with airway
remodeling and airway hyper responsiveness in asthma. ADAM33 were
located at chromosome 20 p13. There are other regions which were
Previously identified on chromosome 5q31-33, 9q, 11q, 12q, 14q, 20q,
21q. Identification of ADAM33 will open new ways of treating asthma,
the potential benefit may be – identification of persons at risk of asthma,
and provide opportunity for early prevention such as allergen avoidance or
early introduction of medication; Protein products of these genes are
potential drug targets, opening the way to causative rather than
symptomatic treatment in the form of anti–inflammatory and
bronchodilator drugs, (Dr. S.K. Agarwal and Dr. J.K. samaria 2002).
Deficiency of platelet - activating factor (PAF) acetylhydrolase is another
important factor. There are evidences that several genotypes contribute to
PAF acetlyhdrolase and predispositions to asthma, including a novel
compound mutation (279F\Q281R) which results in the loss of PAF
acetylhdrolase activity and that expression of the Q281R cDNA resulted in
the production of protein without enzymatic activity, (Stafforini et al
1999).
-14-
1.5.7. Family history
A study confirmed earlier data that parental history of asthma and allergy
is most strongly associated with early – onset persistent asthma and
suggested that among genetically predisposed children, an early – life
environmental exposure, maternal smoking during pregnancy, favors the
development of early – onset asthma that persists into later early
childhood, (James et al 2001).
1.5.8. Rhinitis
A higher prevalence of asthma in subjects with reported nasal allergy was
found in several analyses of local data. The association between perennial
rhinitis and asthma was analysed using the combined European
Community Respiratory Health Survey (ECRHS) database. Subjects with
perennial rhinitis were more likely to have current asthma and bronchial
hyper responsiveness (BHR) than subjects without perennial rhinitis.The
association between perennial rhinitis and asthma remained significant
after adjustment for possible confounders such as atopy, and was found in
both atopic and non atopic subjects, rhinitis was also found to be an
independent risk factor for onset of asthma, (Laynaert et al 1999).
1.5.9. Gender
Females had a lower risk of asthma with onset before 15 year of age but a
higher risk of adult onset asthma than males, (Demarco et al 2000).
1.5.10. Socioeconomic status
The association between socioeconomic status and respiratory health has
received little analysis; kigevinas reported that in the Spanish centers,
bronchitis was more common in unemployed than employed subjects were,
-15-
even after adjusting for smoking, lung function and indoor risk factor,
(Kigevinas et al 1998).
1.5.11. Disease and infection
The role of0 current or recent infections have been analyzed on local data
from three centers. In Uppsala, subjects with serological signs of a current
or recent Chlamydia pneumonia infection were more likely to have
reported wheeze than subjects without infections. A correlation was also
found between titers of Chlamydia pneumonia immunoglobulin – an (IgE)
antibodies and bronchial responsiveness (Ferrari et al 2000). No
association was found between tuberculin reactivity and total serum IgE
and specific serum IgE levels, (Omenaas et al 2000).
1.5.12. Childhood risk factor
Delaying the introduction of milk other than breast milk until at least 4
months of age may protect against asthma and atopy later in childhood.
These findings are relevant to our understanding of the cause of childhood
asthma and also to public health. Although further studies and analyses are
required to confirm these benefits and to understand better the mechanisms
concerned, public health interventions promoting an increased duration of
exclusive breast-feeding may help to reduce the morbidity prevalence of
childhood asthma, (Odd et al 1999). Exposure of children younger than 1
year, compared with aged 1-5 years, to stables and consumption of farm
milk was associated with lower frequencies of asthma, hay fever and
atopic sensitization, (Riedler et al 2001).
1.6. Asthma
Asthma is a chronic respiratory disease characterized by episodes of
-16-
attacks or inflammation and narrowing of small airway in response to
asthma "trigger". Asthma attacks can vary from mild to life – threatening
and involves shortness of breath, cough, wheezing, chest pain or tightness,
or a combination of these symptoms. Many factors can trigger an asthma
attack, which include allergens, infections, exercise, abrupt changes in the
weather, or exposure to airway irritants, such as tobacco smoke, and
diseases such as gastro esophageal reflux disease. Symptom pattern can
vary as duration, severity and frequency, (The Cleveland clinic 2004).
1.6.1. Types of asthma
1. Work – related asthma
In 1995, the American college of chest physicians published a consensuses
statement classifying types of asthma found in the work place.
Occupational asthma is defined as a disease characterized by variable
airflow limitation and \ or bronchial hyper – responsiveness due to causes
and conditions attributable to a particular working environment and not to
stimuli encountered outside the work place. Work – aggravated asthma is
defined as concurrent asthma worsened by nontoxic or physical stimuli in
the work place, (Yeung 1995).
2. Exercise–induced asthma (EIA), or exercise–induced bronchospasm
Defined as a condition in which exercise or vigorous physical activity
triggers acute bronchospasm in persons with heightened airway reactivity.
It is observed primarily in persons who are asthmatic but can also be found
in patients with atopy, allergic rhinitis, or cystic fibrosis, and even in
healthy persons. (EIA) is often a neglected diagnosis, and the underlying
asthma may be silent in as many as 50% of patient, except with exercise.
-17-
Exercise, particularly running and cold weather exercise, induces asthmatic
reactions in about 17 million Americans, (J Resp Dis 2002).
3. Asthma in pregnancy
Asthma is the most common condition that affects the lung during
pregnancy; about 4 percent of pregnant women have asthma. With good
asthma treatment during pregnancy, most women can breathe easily, stay
healthy, have a normal pregnancy, and give birth to healthy baby, (Annesi
et al 2001).
1.6.2. Complications of Asthma:
In most stages, asthma is a reversible condition, which means symptoms
and airway flow obstruction significantly improve with treatment.
Conversely, in a small percentage of asthmatics, the airway obstruction
doesn’t reverse, and these patients end up with chronic obstructive
pulmonary disease (COPD), chronic bronchitis (CB) or Emphysema,
(Silva, 2004).Complications associated with most medications used for
asthma are relatively rare, however, in those patients requiring long – term
corticosteroid use, complications may include osteoporosis, immuno
suppression, cataracts, weigh gains, psychiatric disorders, diabetes, a
vascular necrosis, (Djukanovic 1992). The risk of these complications is
far less with inhaled corticosteroids than with oral corticosteroids.
Nevertheless, in patients with moderate or severe asthma whose disease
has been well controlled with high – dose inhaled corticosteroids, every
efforts should be made to reduce the dose to as low as possible while
maintaining good asthma control and minimizing the risk of exacerbations,
(Djukanovic 1992).
-18-
1.6.3. Disability
Asthmatics adapt their lifestyle to accommodate their asthma. In addition,
they do not lead a "normal" life, (CDC, 1998). Over 12.7 million working
days are lost due to asthma each year. 42 % of people with asthma say that
traffic fumes stop them from walking and shopping in congested areas.
40% of people with asthma avoid smoky pubs and restaurants, up to 56 %
of people with asthma are sensitive to pet allergens, and up to 90% of
people with asthma are sensitive to house dust mites, (Asthma UK2004).
61% of all asthma patients and 73% of children report that they limit sports
participation or exercise, find it difficult to sleep through the night, and
make unplanned trips to physicians, (CDC 1998).
1.6.4. Asthma mortality
Asthma mortality is associated with multiple factors, including delay in
care, poor compliance, and lack of access to health care, theophylline
toxicity, and overuse of B – agonist medications, (Siptzer et al 1992).
Speculation about the recent decline in asthma deaths has pointed to the
more judicious use of prophylactic treatment, particularly inhaled steroids,
(Goldman et al 2000).On average, 1 .400 people die from asthma each year
in the UK, (Asthma UK 2004). The asthma mortality rate in Israel during
the years 1980 to 1997 was low, stable, and there was no difference in the
asthma death rate and place of death between Jews and Arabs, suggesting
that in this population, genetic predisposition is not likely to be a risk
factor for mortality, (Picard et al 1997).
1.6.5. Asthma management
A patient's history includes frequency and severity of symptoms that occur
with activities of daily living.The expert report 2 was issued in 1997
-19-
further refined effective asthma management based on the following
components: (1) Objective measure of lung function (2) Environmental
control measures (3) Comprehensive pharmacologic therapy, and (4)
Patient education. See table 1. (National asthma education and prevention
program: expert panel report 2: 1997).
Table (1) Graphics Guide to Asthma Severity
1.7. Rhinitis
Rhinitis is inflammatio1.n of the membrane tissue in the nose, causing sneezing, a runny nose, and sense of nasal obstruction. There are two major causes of rhinitis: an allergy called "allergic rhinitis ", and an over activity of the nerves in the nasal tissue called "vasomotor rhinitis", (Scoppa, 1996).
Disease Level Indication Severe Moderate Mild
With minimal exercise. e.g. walking on level quickly.
With mild exercise, e.g. climbing stairs rabidly, carrying groceries
With heavy exercise only , e.g. running or cycling.
Symptoms with activity
More than twice per wk.
1 – 2 per week. 1–2 per month. Nocturnal awakenings
FEV1<60 percent of predicted. Peak flows rarely more than 70 percent of predicted with large day to day variability.
FEV1 * 60 to 75 percent of predicted. AM peak flow less than 85 percent of PM peak flow; wide day to day variability.
Normal most of the time. AM and PM peak flows vary less than 10 percent among and within days.
Lung functions
Multiple asthma medications on a regular basis.
Inhaled steroids (low does) regularly, beta agonists as needed.
Intermittent beta agonists.
Medication use
Including inhaled steroids at moderate to high dose.
-20-
1.7.1. Classification of rhinitis
1. Atopic rhinitis: there are three types of atopic rhinitis.
A) Seasonal allergic rhinitis (also known as hay fever). This is triggered
by allergy to pollens, including trees in spring, grasses in summer, and
weeds in fall, symptoms include sneezing, itching, tickling in the nose,
runny or stuffy nose, and watery or itchy eyes. Seasonal rhinitis is
diagnosed primarily by medical history, (Durham, 1998).
B) Perennial rhinitis (year – round) with allergic triggers
These triggers include indoor allergens such as mold, house dust mite,
cockroach and animal dander. Foods commonly eggs, cows milk and
peanut can be triggers. Symptoms are the same as seasonal allergic rhinitis
but are experienced throughout the year, (MacKay and Durham, 1998).
C) Perennial rhinitis with non – allergic triggers, this type of rhinitis
Is not well understood. Although not triggered by allergy, it's an allergic
like condition with increased eosinophils (a special type of white blood
cell associated with allergy) in the lining and secretions of the nose.
Symptoms are the same as perennial rhinitis with allergic triggers,
diagnosis is determined from negative skin tests and a nasal smear test
positive for eosinophlis, nasal polyps can be a complication of this
condition, (MacKay and Durham, 1998).
2. Vasomotor rhinitis
Vasomotor rhinitis is caused by over activity of nerves in the nasal tissue,
this can occur when emotionally upset, irritated by certain air temperature
and humidity conditions (chilly weather, dry air from air – conditioning,
-21-
sudden changes in temperature or humidity), during pregnancy, and during
bacterial and viral infections, it can also be induced by drugs such as
alcohol, anti hypertensive agents, aspirin, oral contraceptives, chemicals
(cosmetics, smoke, noxious fumes) and from over use of decongestant
nasal drops or sprays.
Food induced rhinitis (gustatory rhinorrhea) may occur during
consumption of hot and spicy foods, (MacKay and Durham1998). The
national institute of allergy and infectious disease, (NIAID) estimates that"
the number of people suffering from allergic rhinitis may be as high as 35
million. Allergic rhinitis may not seem dangerous in it self, but it can play
a role in other diseases like asthma, and sinusitis, (NIAID 2002).
1.7.2. Complications of Allergic Rhinitis
Allergic rhinitis has a strong association with asthma, (Laynert et al, 1999). Another commonly associated condition is nasal polyps, which are growths of skin in the nasal tract that can cause obstruction and loss of smell and sinus and ear infection, (Dr. Josef Smith, 2005).
Allergic rhinitis also results in bad breath, a husky voice and sore throats, it worsens snoring and the tendency to sleep apnea in adults, it causes abnormal development of the mouth and teeth from chronic mouth breathing. The result is often in a high arched palate, crowded teeth and high dental costs, and results in eye infections because people rub itchy eyes. Some will even become allergic to eye drops of the preservative in the bottle, (Spector, 1999).
1.8. Food allergies
Food allergies are an abnormal response of the body to a certain food. It is important to know that this is different than a food intolerance, which does
-22-
not affect immune system, although some of the same signs may be
present, (Bindsley, 1998). Allergic reactions to food are IgE – mediated or
non – IgE mediated, which in turn, lead to a spectrum of clinical symptoms
observed in persons with allergic reactions to food, (Altman and
Chiaramont 1996). Only about 1.5 percent of adults and up to 6 percent of
children younger than 3 years in the US– (about 4 million people) has a
true food allergy, according to researchers who have examined the
prevalence of food allergies (Altman and Chiaramont 1996). It is critical
for people who have allergies to identify them, and to avoid foods that
cause allergic reactions. Some foods can cause severe illness and, in some
cases, a life threatening allergic reaction (anaphylaxis) that can constrict
airways in the lungs, severely lower blood pressure, and cause suffocation
by the swelling of the tongue or throat. An estimated 150 American die
each year from severe allergic reactions to food, (Sampson, 1998).
Peanuts, tree and shellfish are usually implicated in food – induced anaphylactic reactions while risk factor for food – induced anaphylaxis include (1) the presence of asthma , especially in patients with poorly
controlled disease ; (2)previous episodes of anaphylaxis ; and (3) a delay
or lack of immediate use of emergency medications (e.g. epinephrine,
antihistamines) to treat the allergic reaction (Sampson, 1998). According
to the national institute of allergy and infectious disease, it does not take
much of the food to cause a severe reaction in highly allergic people. In
fact, as little as 1/44.000 of a peanut kernel can cause an allergic reaction
for severely allergic individuals, (Bindsley 1998). Allergic symptoms may
begin within minutes to an hour after ingesting the food. Symptoms may
include: vomiting, diarrhea, cramps, hives, swelling, eczema, itching or
swelling of the lips, tongue, or mouth, itching or tightness in the throat,
-23-
difficulty breathing, wheezing, asthma, loss of consciousness and death,
(James 1996).
1.9. Stinging insect allergy
Insect stings usually cause transient local inflammation; however, allergic
hypersensitivity can result in more severe local reactions or generalized
systemic reactions. Large local reactions are usually late – phase IgE
mediated allergic reactions, with severe swelling (eight to 10 inches in
diameter) developing over 24 to 48 hours and resolving in two to seven
days. Systemic reactions also are IgE mediated and may cause one or more
signs and symptoms of anaphylaxis, including generalized urticaria,
angioedema, throat tightness, dyspnea , dizziness, and hypotensive shock,
(Yunginger,1998).The stinging insects that commonly cause severe
allergic reactions include bees (honey bees, bumblebees), vespids
(Vespidae family : yellow jackets, hornets, wasps), and fire ants
(solenopsis genus), (Yunginger, 1998).
Systemic reactions to insect stings are estimated to occur in 3 percent of
adults; approximately 1 percent of children have medical history of severe
sting reactions, (Golden 2003). Venom skin tests and immunotherapy are
indicated in patients with a history of systemic allergic reaction to an insect
sting, patients with a history of systemic sting reactions and positive
venom skin tests have been found, on average, to have a 50 percent risk of
experiencing another systemic reaction to a challenge sting (i.e. high risk
of anaphylaxis), (Golden 2000).
Morbidity and mortality from insect sting anaphylaxis can be virtually
eliminated by appropriate patient education about the risk of recurrent
-24-
reactions and the use of preventive and protective measures. Epinephrine is
the treatment of choice for acute anaphylaxis, venom immunotherapy is
recommended for use in patients who are at risk for severe systemic
reactions to future insect stings, (Golden 2003).
1.10. Anaphylaxis
Anaphylaxis is a term used to describe serious and rapid allergic reactions
usually involving more than one part of the body, which if severe enough,
can cause death, (Anaphylaxis campaign 1997).
1.10.1 Common causes of Anaphylaxis:
1) Food: especially nuts, some kinds of fruit, fish and less commonly
Spices, (Sampson, 1998 ).
2) Drugs: especially penicillin, anaesthetic drugs, some intravenous
infusion liquids, and contrast media used during x – rays. Aspirin and
NSAIDs can produce very similar reactions, (Med, 1993).
3) Latex: Mainly in rubber, latex gloves, catheters, other medical products,
but also in many things encountered in daily life. Sufferers are nearly
always health care workers, mainly nurses, or have other occupational
contact with latex, (Anaphylaxis campaign 1997).
4) Bee or wasp (yellow jacket) sting when these cause faintness, difficulty
in breathing, or rash or swelling of a part of the body, which has not been,
6) Exercise may precipitate such reactions in some (exercise–induced
-25-
anaphylaxis), and so may exercise after food, sometime apparently
irrespective of what the food is, but in other people after specific foods.
This is called "exercise – induced food – dependant anaphylaxis ".
Individuals at risk for experiencing exercise – induced anaphylaxis are
those with a history of personal or family atopy, (anaphylaxis campaign
1997).
1.10.2. Signs and Symptoms of Anaphylaxis
• Faintness and unconsciousness due to very low blood pressure
• Swelling (angioedema)
• Swelling in the throat, causing difficulty in swallowing or breathing.
• Asthma symptoms
• Vomiting
• Cramping abdominal pains
• Diarrhea
• Tingling feeling in the lips or mouth if the cause was a food such as nuts.
• Death due to obstruction to breathing or extreme low blood pressure (anaphylactic shock), (Allergy clin immunol, 1998).
1.11. Eczema
Eczema, or dermatitis as it is sometimes called, is an inherited skin
sensitivity that can be easily irritated by many factors including, stress,
water, some foods, irritants like soap and chemicals, allergic reactions,
cats, wool, infections and many others factors. Individuals with eczema
often have a family history of allergies, asthma, eczema, and hay fever.
-26-
Eczema patients are more likely to have severe reactions to bee, some
drugs like penicillin and some foods. The severity can range from hot, dry
and itchy skin to open, broken, and bleeding sores. Eczema affects more
than 10 million Americans, (Wuthrich, 1996). Atopic dermatitis often
occurs with allergies and frequently runs in families in which other family
members have asthma or hay fever. It usually begins in infancy and may
vary in severity during childhood and adolescence. It tends to become less
of problem in adulthood, unless patients were exposed to allergens or
irritants in the workplace. The exact cause of this disorder is unknown,
(www. hon. html).
1.11.1. Complications:
Loss of sleep and energy, social isolation and difficulty with aspects of
daily living can lead to severe disability, (Greaves, 2000).
1.11.2. Management
Because atopic dermatitis (AD) may be the entry point for the
development of subsequent allergic disease, it is essential that clinicians
across a spectrum of disciplines recognize that AD management must
include comprehensive concerns about asthma, allergic rhinitis, and food
allergy. Physician education and dissemination of the least clinical findings
are needed to raise awareness of the importance of AD management. The
proper treatment of AD may prevent the progression of greater IgE
production and the reaction in the skin, lungs, and nose, (Hanifin, 1999).
1.12. Allergic conjunctivitis
It is defined as irritation of the conjunctiva that covers the eye ball and the
inside of eyelids which lead to itchy, redness, swollen or even watery hurt
-27-
eye.This allergic reaction usually is caused by animal skin and secretions,
grass and ragweed , air pollution and smoke, skin medicine, perfumes, and
cosmetics, and viral and bacterial infections, (Stephen ,1998).
1.12.1. Management
Identification and avoidance of the allergens that cause symptoms is a
protective way against allergic conjunctivitis. (Stephen, 1998).
1.13. Drug allergies
According to a recent study published in the journal of the American
medical association, there are approximately 550.000 serious allergic
reactions to medications per year in hospitals throughout the United States,
(Lazarou, 1998).
It is unclear how prevalent drug allergies are among the general population
but allergic reactions to medications cause the highest number of
documented deaths from anaphylaxis each year. Penicillin alone is
responsible for about 5.440 cases of fatal anaphylaxis each year, which
account for an estimated 75% of the known annual US anaphylaxis deaths.
Most deaths occur in people who have no medical history of allergic
reactions. A voiding medication that triggers allergic reactions is still a
mainstay in protecting patients against anaphylaxis, (Nugent JS et al,
2003).
-28-
1.14. Asthma and Allergy according to Palestinian Ministry of Health
Table (2) the number of cases of asthma and allergy according to Palestinian Ministry of Health records are as follows: (Palestinian ministry of health, Nablus):
Year Age Asthma, COPD,CB,
Emphysema
Rhinitis Sinusitis
2003 15-24 174 23 29
2004 15-24 127 31 22 *Death due to asthma and allergy were not recorded*.
The differences of cases between tow years were due to the current
intifada, where our people are exposed to different kinds of war gases,
destruction, tire burning due to Israeli occupation which in turn affect the
health of population, and could be an obstacle for higher education, and
health care provision, which be explained by political circumstance, and its
reflection of closuring between cities.
1.15. Cost of allergy
Allergic conditions cost the NHS one billion pound (£) a year according to
a new report. The study by scientists at Edinburgh University and St
George's hospital medical school in London revealed that 39% of children
and 30% of adults have been diagnosed with an allergy, including asthma.
Treating allergies accounted for 10% of primary care prescribing bills,
according to the researches, and overall amounted to more than one billion
of the NHS budget, when the costs of GP consultation, hospital stays and
medicines are included, (Asthma UK 2004). "The study underline the
urgent need for a concerted effort to understand the causes and treatments
of asthma and allergy, and to provide better standard of care for those who
are in need ", (Dr Matt Halls worth, 2005).
-29-
1.16. Prevention
The asthma and allergy research institutes objectives aimed to promote
prevention and best practice in asthma and other allergic and respiratory
diseases by providing community and professional education. (Asthma and
Allergy research 2004).
The first step in management once allergy has been diagnosed is allergen
avoidance. Nowadays most people spend more than 90% of their lives
indoors. Over the past 30 years, the home environment has changed
enormously with the introduction of soft furnishings, fitted carpets, and
central heating. Indoor ventilation has decreased – the rate at which indoor
air is exchanged for fresh air now 10 times lower than it was 30 years ago,
with a considerable increase both in humidity and in concentrations of
indoor pollutants and airborne allergens. As exposure to allergens is an
important cause of symptoms in sensitized patients, reducing exposure
should improve disease control, (Wood Cock and Custoric, 1998).
1.16.1. Strategies for reducing exposure to allergens
• Remove upholstered furniture from the bedroom. Wash bedding and
nightclothes in hot water (at least 130 F°) at least once a week.
• Decrease household humidity to less than 50 percent removes
humidifiers and check air conditioning units regularly for mold
contamination.
• Encase mattress, box spring and pillow in mite – proof covers minimize
dust, and pollen – collecting surfaces (e.g. shelving, stuffed animals, and
books).
-30-
• Minimize use of indoor ceiling fans.
• Use blinds or washable curtains with shades and clean them often. And
apply an acaricide such as benzyl benzoate, or denaturing agent, such as
tannic acid (3%). to carpet, especially in the bedroom.
• If possible, remove carpet from the bedroom.
• Avoid vacuuming when dust – sensitive persons are at home.
• Keep pets outside or at least out of bedrooms and of upholstered
furniture.
• Give pets their own washable beds and wash the beds often.
• Bathe or shower before bedtime to remove pollen from hair and body.
• Remove visible mold from walls and floors using a solution of water
and chlorine bleach, or product that contains chlorine or other fungicides.
• To control insects particularly cockroaches, wash dishes promptly.
Keep garbage closed containers outside of the home, remove or repair
sources of water (e.g. leading faucets, standing water in basements). Wipe
up food spills and keep food in tightly sealed containers.
• Stop smoking, (National asthma education and prevention program
,2002)
1.16.2. Benefit of Allergy Prevention
The effect asthma and allergy on an individual's quality of life and the
extent to which it may restrict daily activities is often overlooked. Yet, it is
an important part of understanding this condition and the benefits that
-31-
effective treatment can bring.
Controlling allergies can significantly decrease health care cost as follows:
1) Allergies are the 6 th leading cause of chronic disease in the United
States costing the health care system $ 18 billion annually, (AAAAI 1996 -
2001).
2) Health care provider visits for contact dermatitis and other eczemas,
which include atopic dermatitis, are 7 million per year. (CDC 1996).
3) In 2002, approximately 14 million office visits to health care providers
were attributed to allergic rhinitis, (CDC 2004).
4) An estimated 75% of admissions for asthma are avoidable and as many
as 90% of the deaths (1.400) from asthma are preventable, (Asthma UK
2004).
1.17. Treatment
The purpose of asthma and allergy treatment is to manage the disease in
order to live as normal a life as possible. This requires being well educated
about the disease and being an active player in managing it, (Asthma and
Allergy research 2004). A number of different types of medicines are
useful in treating asthma, but not all asthma medicines are appropriate for
every patient. Table (3) summarizes different methods of treatment for
allergies, (Cross et al 1998).
The successful treatment of asthma with immunosuppressive agents, such
as cyclosporine A, and use of monoclonal antibody in the other chronic
inflammatory conditions has suggested the use of a monoclonal antibody
to CD4 in patients with severe steroid–dependent asthma. This approach
-32-
seems to be the sunrise in a new era in the treatment of allergic disorders,
Allergen avoidance. Allergen avoidance. Allergen avoidance. Allergen avoidance. Allergen avoidance (may be life saving).
Antihistamine tablets or nasal spray.
Antihistamine tablets. Bronchodilator inhaler as required.
Soap substitute and regular use of emollients.
Specialist referral (for all cases of anaphylaxis) and need for dietetic support.
Corticosteroid nasal spray (cromoglycate first line in children).
Cromoglycate or nedocromil eye drops.
Corticosteroid inhaler (cromoglycate or nedocromil are alternatives for patients with mild disease).
Corticosteroid skin creams and ointments
Consider need for standby adrenaline (refer to allergist).
Short course(e.g. prednisolone 20mg \day for 5 days , peak season).
Never use corticosteroid eye drops without advice \ supervision ophthalmologist.
Consider adding regular long acting inhaled bronchodilator ( or theophylline tablets.
Antibodies for exacerbations.
For severe hay fever to allergist for consideration for immunotherapy.
Prednisolone tablets once daily in morning in lowest possible dose courses may be required at any time for exacerbations.
Referral to dermatologist for consideration of skin wraps , behavioral therapy , and (rarely) prednisolone tablets.
Consider immunotherapy (In allergy to bee or wasp venom) refer to allergist.
Table (3) Summery Of Approach for Treating Common Allergic Disorders
-33-
-34-
1.18. Public health challenges
Asthma, allergic rhinitis, and atopic dermatitis are leading causes of
chronic diseases in developed countries, (Eupton et al 2000). Prevention
and treatment of asthma and allergy, mortality, morbidity and disability
caused by asthma resulted in a towering public health challenges for the
United States, (Asthma UK 2004). These challenges are considered global
and can be adopted in the Middle East region; including Palestine, as such
studies indicate that there are numerous problems and major gabs in the
provision of optimal health care in the Middle East region because;
1) There are few (standard management protocols and clinical practice
guidelines on the management of asthma, particularly in primary health
Care), (Partridge and Alwan, 1997).
2) Inadequate education, make patients deny the diagnosis of asthma and
are not prepared to accept it, with serious negative implications for the
prospects of good control and favorable prognosis.
3) Lack of compliance seems to be a major problem in the region.
Although unaffordable treatment costs are undoubtedly a major factor,
insufficient education and impaired communication are probably the most
important causes.
4) Standardization and initiation of epidemiological studies to assess the
size of the problem of asthma throughout the region are needed and this
may involve use a standardized methodology to obtain information about
the prevalence of asthma in different regions.
5) Basic health care requirements for people are often inadequate in many
countries of the regions and national initiatives for the prevention and
-35-
control of this problem are generally lacking, serious steps for adoption of
strategies for the primary health care of asthma must be taken.
6) The increase in prevalence of asthma over the past two to three decades
is unlikely to be explained by a change in genetic constitution and more
likely reflects environmental changes leading to condition being activated
in an increased number of genetically susceptible people, environmental
factors should have been systematically investigated to decrease the rise of
allergic disease.
7) People are not empowered to share responsibility in managing and
monitoring their problem, and there are few organized educational
programmes for those affected and their families. In most countries of the
region, educational material for people with asthma and their families is
either unavailable or grossly deficient. There may be no access to the
essential tools for treatment such as drugs, especially at the primary health
care level. In many countries, the cost of treatment is too high for people to
afford, leading to discontinuation of treatment and poor follow – up. The
lack of appropriate health care at the primary health care level probably
leads to under diagnosis, especially among children.
8) Physicians being reluctant to label patients as asthmatic. Doctors falsely
reassuring mothers that their children will grow out of asthma and negative
cultural attitudes, sometimes also shared by pharmacists and other health
care professionals, towards the use of inhalers, (Partridge and Alwan,
1997).
-36-
1.19. Aim of the study
• The purpose of this study is to estimate the prevalence of asthma and
allergy among young adult population in Palestine represented by An-
Najah University students in Nablus.
• To investigate the relationship between asthma and allergy and risk
factors related to these diseases among the study population.
• To find the most common triggers that may cause or worsen symptoms
of asthma and allergy among the study group.
• To explore the profile of students who have asthma or allergy.
• To estimate a peak expiratory flow for Palestinian young adult depending
on Persian prediction equations and spotting the light about the need for a
local reference value for Palestinian adult.
• To inform authorities on health condition among young adult population
in Palestine.
-37-
1.20. Research hypothesis:
• Prevalence of asthma and allergy among An – Najah University students
to be relatively high.
• Presence of asthma and allergy risk factors among An-Najah University
student to be high.
• There is association between risk factors and asthma, allergy among An-
Najah University students.
• Adoption of Nunn & Gregg equation for PEF may perform well for
Palestinian adult.
CHAPTER TWO
METHODOLOGY
-39-
Methodology
2.1. Introduction
Nablus district is located in the northern part of the West bank, it is
bounded by Jenin from the north; Tulkarm from the west; Ramallah and
Jericho from the south and the Jordan river from the east, (ARIJ 1996). The geographical position of Nablus district in the northern part of west bank gives it a comparatively a low temperature range, (Nablus municipality, 2002). Located in Nablus, An–Najah National University
which is currently the largest University in the West Bank, with 16
colleges and 12500 enrolled students, (Public relation Department 2005).
2.2. Population of the Study
The study population was chosen from An–Najah university in Nablus.
The study sample consisted of total 1000 randomly selected students from
all colleges of the University whether scientific, humanitarian, or
community college. The percentage of students in the sample was
representing the percentage of students in each college. The age of the
students was at range of (18-27). Both males and females were included in
almost equal percentage.
2.3. Data Collection
Data were collected during the period of the first of September 2004 to the
end of December 2004, using structured interview and lung function
measurement by measuring the peak flow meter. Doctor Shashi Kumar has
designed our questionnaire that was adopted and used in the interview. It
was translated, evaluated, and reviewed by specialized physicians. A
pretest was carried out on 30 students to find the capacity of student to
-40-
understand the questionnaire wording then the questionnaire layout was
modified after the pilot testing. A total of 1116 questionnaire forms were
distributed, the total response rate in this study was 90 % (1007)
questionnaire were returned.
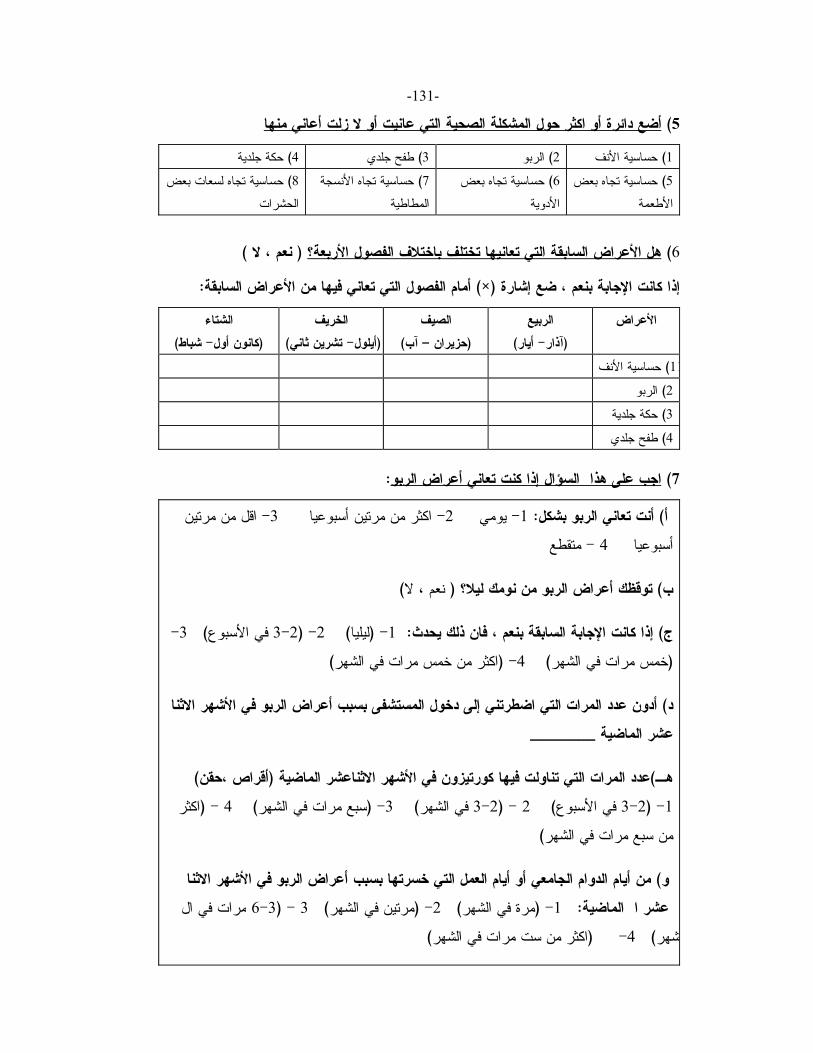
2.3.1. Questionnaire Component
The questionnaire spotted lights on several parts that play important role in
triggering asthma and allergy, refer to appendix (1) for full information
about questionnaire. The following are important components of the
questionnaire:
1. Sociodemographic Questions
Q1. Was about social history including age, sex, college, weight, sport, and
smoking.
Q2. Was about environmental history including residence, trees, allergen,
inside the home, type of cooling, type of heating, indoor animal and type
of pillow.
2. Asthma And Allergy History
(Q3-Q11): Were about triggers that cause or worsen the subject symptoms
including exercise, respiratory infections, weather changes, foods. The
symptoms included nasal, sinus, eyes, chest, eczema, asthma and allergy
problem (frequency and severity), and health problem other than asthma
and allergy.
3. Family History
Q12: covers the presence of family history for allergy.
-41-
2.3.2. Experimental Part: Peak Flow Meter
Pulmonary function tests (PFTs) are used for confirmation of diagnosis,
staging, and predicting prognosis in patients with COPD and asthma. The
standard PFTs is the forced expiratory spirogram in which a patient inhales
to maximal lung capacity (Total lung capacity) and exhales forcibly as
much as possible (to residual volume). Values of exhaled lung volume
versus time are recorded, (Jenkinson and martin 2003).
Peak expiratory flow (PEF) is the maximum flow achieved during an
expiration delivered with maximal force starting from the level of maximal
lung inflation. The value obtained may differ depending upon the physical
properties of the instrument used to measure it, (Eur Respir J 1997). In
October 1990, mini peak flow meters were made available on prescription
in the United Kingdom, in response to several years of campaigning by the
medical profession and the national asthma campaign for the wider use of
what was regarded as a crucial instrument in asthma control. The device
has been thoroughly validated as an accurate measure of peak expiratory
flow rate, which is highly correlated with other measures of pulmonary
function; predictive values for flow rate have been calculated.
Furthermore, the device is inexpensive, simple to use, and easy for patients
to understand. While spirometry remains the usual method of assessing
pulmonary function in hospital practice, peak flow meters have become
widely used in the management of patients by general practitioners. Many
patients are being given peak flow meters to take home, or are acquiring
them themselves, and the British thoracic society has recommended the
use of home recording for good asthma management.
There is good evidence that PEF, measured with a hand – held peak flow
-42-
meter, is both reliable and reproducible. A recent report suggests that PEF
may be more reproducible than FEV1, (Quanjer et al 1997).
2.4. Procedure
An agreement was obtained from An – Najah public health department, to
facilitate the researcher's work including students interviewing and PEF
measurements. The rate of researcher's visit to the university was four
visits each week, interviewing and measuring PEF for about 26 students
each day. The purpose of the study was explained to each group: First, the
researcher interviewed group of students and asked them to fill the
questionnaire, then PEF measurement was done between about noon and
early evening to reach maximal values, (Brand et al 1997). Based on the
expert panel report 2 (guideline for the diagnosis and management of
asthma 1997) as follows: The student was asked to
• Stand up
• Slide indicator to base of meter
• Take in deep breath
• Place mouthpiece in mouth and seal lips around it.
• Blow out as hard and fast as he/she can (one quick blow)
• Process was repeated 2 more times
• The highest number of the three efforts was recorded.
Since PEF is influenced by a subject's sex, ethnic origin, age, stature,
pathophisiological and physical factors, the results were recorded, and
level of error was corrected for by using the following equation for PEF
derived by (Miller et al 1992).
-43-
PEF Corrected = 0.00090 X (PEF recorded) ² + 0.373 X PEF recorded + 47.4
The following new revised prediction equations for PEF which was revised
by Nunn and Gregg are applied to get predicted value and then calculate
percent of predicted value by dividing corrected value/ predicted value
0.051H–0.0390A–1.607 0.042137H+0.16758A–4.86417 Lower limit of normal
0.07759H–0.0435A–1.369 0.07238H+0.246A–7.720 PEF¶ male
0.061H–0.0435A–1.369 0.058H+0.246A–7.720 Lower limit of normal
PEF: peak expiratory flow, H: height in cm, A: age in years, ¶: flows are in L·s–1
2.5. Data Analysis
All data of questionnaire and experimental part for 1000 students sample
were entered into the computer and computed using SPSS program and
applying Chi – square test, with 95 % level of significant ( P value = 0.05).
2.5.1. Analysis of Descriptive Studies
Tables containing descriptive studies were obtained, such as sex, age,
residence, BMI, environmental, social and living environment.
2.5.2. Analysis of Medical History
Tables for medical history were obtained, such as asthma and allergy
history, asthma and allergy triggers, and PEF measurement.
2.5.3. Analysis of Relationship
Relationship between risk factors, triggers, and some disease with asthma
and allergy among An–Najah University students were obtained, also
relation ship between sex, age, BMI, residence, smoking, sport practicing
and asthma with PEF measurement were obtained.
CHAPTER THREE
RESULTS
-46-
Results
3. The result of the study includes three main categories:
• Profile of the study population: anthropometric characteristics, general,
health, social and living environment and risk factors profiles.
• PEF measurements.
• Relationships.
-47-
3.1. Profile of the study population
3.1.1. Anthropometric characteristics and General profile Table (5) Gender, age, colleague, sports practicing
Gender Frequency Percent% Male 448 44.8
Female 511 51.1 Missing system 41 4.1
Total 1000 100 Age Frequency Percent %
17.5-20 546 54.6 20.5-22 333 33.3 22.5-24 66 6.6
More than 24 25 2.5 Missing system 30 3
Total 1000 100 College Frequency Percent%
Scientific 348 34.8 Humanitarian 649 64.9
Missing system 3 0. 3 Total 1000 100
Sport practicing Frequency Percent% Yes 514 51.4 No 428 42.8
Missing system 58 5.8 Total 1000 100
Table 5 shows the distribution of samples as follows: • 44.8%of the study sample were males, 51.1% were females. • 54.6% of the study sample was in (17.5-20) years old, 33.3 % were in (20.5-22) years old, 6.6 % were (22.5-24) & 2.5 were more than 24 years old. • 34.8% were from Scientific College & 64.9% were from humanitarian college. • 51.4%of the study sample practicing sports & 42.8% not practicing sports.
Table (6) Body mass index measurements profile of the study
population
BMI categorized Frequency Percent% Normal weight (less than 25)
723 72.3
Over weight (25 -29.9)
132 13.2
Obese 30 and more
22 2.2
• 2.2% of the study sample were obese, 13.2% were over weight, while 72.3 % had normal weight.
-48-
3.1. 2. Social profile Table (7) Marital status, job, smoking, smokers in the house
M. Status Frequency Percent% Married 43 4.3 Single 949 94.9
Missing system 8 0.8 Total 1000 100
Job Frequency Percent% Employee 18 1.8 Worker 10 1
Not working 936 93.6 Missing system 36 3.6
Total 1000 100 Smoker Frequency Percent%
Yes 176 17.6 No 811 81.1
Missing system 13 1.3 Total 1000 100
Smoker in house Frequency Percent% Yes 554 55.4 No 366 36.6
Missing system 80 8 Total 1000 100
• 4.3% of the study population was married & 94.9 % were single. • 1.8%of the study population was employees, while 1% was worker & 93.6 % were not working. • 17.6%of the study population were smokers, while 81.1%were not. • 55.4%of the study population had smokers in house, while 36.6%didnot.
3.1.3. Place of living profile
The place of living profile of the study population included (place of
living, living in university dormitories, how old is my house, the lay out of
my house, kind of trees, kind of building, kind of heating instrument, kind
of cooling instrument, kind of animals livings in house, kind of animals
livings around the house, kind of pillow used, # of family in house, #. of
rooms in house).
-49-Table (8) (place of living, living in university dormitories, how old is my house, the lay out of my house, kind of trees, kind of building, kind of heating instrument, kind of cooling instrument, kind of livings in house, kind of livings around the house, kind of pillow, covering of the ground, no. of family in house, no. of rooms in house).
Place of Living Frequency Percent% Camps 38 3.8 Village 550 55
City 410 41 Missing system 2 0.2
Total 1000 100 Living in Univ. dormitories Frequency Percent%
Yes 461 46.1 No 511 51.1
Missing system 28 2.8 Total 1000 100
How old is my house Frequency Percent% Less than 20 602 60.2
20-50 324 32.4 More than 50 63 6.3
Missing system 11 1.1 Total 1000 100
The lay out of house Frequency Percent% Factories 19 1.9
Kind of building Frequency Percent% Stone building 534 53.4
Asbestos building 31 3.1 Block building 410 41 Missing system 25 2.5
Total 1000 100 Type of Heating Frequency Percent%
Electricity 194 19.4 kerosene 119 11.9
Gas 418 41.8
-50-
Coal 208 20.8 Central heating 30 3
Conditioner 13 1.3 Space heaters 8 0.8
Missing system 10 1 Total 1000 100
Cooling instrument Frequency Percent% Fan 671 67.1
Conditioner 58 5.8 Windows of the house 265 26.5
Missing system 6 0.6 Total 1000 100
Animals living in a house Frequency Percent% Cat 113 11.3 Dog 16 1.6 Birds 90 9
Chicken 108 10.8 Goats 52 5.2
Pigeons 128 12.8 Other 23 2.3
Nothing 451 45.1 Missing system 19 1.9
Total 1000 100 Animals living near the house Frequency Percent%
Cat 224 22.4 Dog 58 5.8
Horses 41 4.1 Chicken 126 12.6
Cows And Goats 228 22.8 Other 25 2.5
Nothing 165 16.5 Missing system 23 2.3
Total 1000 100 Kind of Pillow Frequency Percent%
Cotton 382 38.2 Spring 274 27.4
Feathers 48 4.8 Wool 243 24.3 Other 42 4.2
Missing system 11 1.1 Total 1000 100
# of family in house Frequency Percent% 3 and less 56 5.6
4-6 291 29.1 7and more 694 69.4
Missing system 9 0.9
-51-Total 1000 100
# of rooms in house Frequency Percent% 2 and less 2 4.8
3 284 24.8 4 313 31.3 5 204 20.4
6 and more 180 18 Missing system 8 0.8
Total 1000 100 Cover of the floor Frequency Percent%
Carpets 751 75.1 Moqutte 141 14.1 No thing 101 10.1
Missing system 7 0.7 Total 1000 100
• 3.8%of the study sample was living in a camp, 55 % were living in a city & 41 % were living in a village. • 46.1% of the study sample live in university dormitories, 51.1 % did not. • 60.2% of the study lives in relatively new houses (less than 20 years). 32.8% live in houses 20-50years old, &3.6% live in old houses (>50 years old). • 1.9% of the study sample had their houses near factories, 17.2% near fields, 16% in crowded population & 62.9% in quiet living place. • 14.6%of the study sample had wooded trees around their houses, 42.4% had fruitful trees, 19.8 %had roses &20.1 % had other kinds. • 53.4%of the study sample lived in stone building, 3.1% in Asbestos building & 41 %in block building. • 19.4%of the study sample use electricity for heating, 11.9% used kerosene, 19.8 % used gas, 20.8% used coal, 3% used central heating, 1.3% used conditioner & 0.8 % used space heaters. • 67.1%of the study sample use fan for cooling, 5.8 % used conditioner & 26.5 % used windows. • 11.3%of the study sample have cats in their home, 1.6 % have dog, 9 % have birds, 10.8 % have chickens, 5.2% have goats, 12.8% have pigeons, 2.3% have other kinds of animals &around 45.1% have no animals at home. • 22.4%of the study sample have cats around the house, 5.8 % have dog, 4.1 % have horses, 12.6 % have chickens, 22.8% have goats and cows, 2.5 % have other kinds of animals & 16.5%have no animal around their houses. • 38.2%of the study sample use cotton pillow, 27.4 % use spring, 48 % use feather, 24.3 % use wool, & 4.2 % use other types of pillows. • 5.6%of the study sample had family member of three and less, and the majority (69.4%) had a large family of 7and more members. • 4.8%of the study sample have2 and less rooms, 24.8 %have 3 rooms, 31.3 % have 4 rooms, 20.4 % have 5 rooms & 18 % having 6 rooms. • 75.1% of the study sample use carpets for covering the floor, 14.1% of the study sample use moquette, and 10.1% of the study sample use nothing to cover their floor.
-52-
3.1.4 Health Profile
3.1.4.1. Triggers of asthma and allergy (only those who have asthma and
allergy symptoms answered these questions) Table (9) Triggers that worsen or cause symptoms of the study sample.
Triggers Types Of Allergy Frequency Percent %
Grass, trees Rhinitis 209 20.9 Asthma 17 1.7
Skin allergy 60 6.0
House dust Rhinitis 467 46.7 Asthma 69 6.9
Skin allergy 17 1.7
Animals Rhinitis 95 9.5 Asthma 34 3.4
Skin allergy 107 10.7
Respiratory infections
Rhinitis 497 49.7 Asthma 106 10.6
Skin allergy 3 0.3
Exercise Rhinitis 68 6.8 Asthma 109 10.9
Skin allergy 13 1.3
Night time Rhinitis 119 11.9 Asthma 36 3.6
Skin allergy 32 3.2
Strong odors Rhinitis 406 40.6 Asthma 75 7.5
Skin allergy 37 3.7
Cosmetics Rhinitis 201 20.1 Asthma 51 5.1
Skin allergy 22 2.2
Emotional upset Rhinitis 145 14.5 Asthma 69 6.9
Skin allergy 60 6.0
Smoke Rhinitis 338 33.8 Asthma 152 15.2
Skin allergy 12 1.2
Tire burning , war gases
Rhinitis 491 49.1 Asthma 117 11.7
Skin allergy 17 1.7
Cold air Rhinitis 148 14.8 Asthma 63 6.3
-53-
Skin allergy 8 0.8
Weather changes
Rhinitis 342 34.2 Asthma 123 12.3
Skin allergy 35 3.5
Drugs Rhinitis 99 9.9 Asthma 25 2.5
Skin allergy 61 6.1
Foods, food additives
Rhinitis 39 3.9 Asthma 27 2.7
Skin allergy 83 8.3
Latex Rhinitis 40 4.0 Asthma 14 1.4
Skin allergy 158 15.8
Menstrual cycle, pregnancy
Rhinitis 11 1.1 Asthma 6 0.6
Skin allergy 46 4.6
Morning time Rhinitis 116 11.6 Asthma 40 4.0
Skin allergy 7 0.7
Auto exhaust Rhinitis 339 33.9 Asthma 122 12.2
Skin allergy 16 1.6
Insect. Mold Rhinitis 183 18.3 Asthma 39 3.9
Skin allergy 172 17.2 *these percentages of triggers for those who have symptoms of the total study sample, the rest of percentage don’t have symptoms.* Table 9shows results for the triggers that worsen or cause symptoms of population samples as follows: • The triggers that have large effect on health of population sample for rhinitis were respiratory infections (49.7%), tire burning and war gases 49.1%, house dust 46.7%, strong odors 40.6%, auto exhaust 33.9%, smoke 33.8%, weather changes 34.2%, grass and trees 20.9%, and cosmetics 20.1%. Other triggers that have lesser effect on Rhinitis are: insect and mold 18.3%, cold air 14.8%, emotional upset 14.5%, night times 11.9 %, morning time 11.6%, drugs9.9%, animals 9.5%, exercise 6.8%, latex 4% foods 3.9%, menstrual cycle and pregnancy 1.1%. • The triggers that have large effect on health of population sample for asthma were smoke 15.2 %, weather changes 12.3%, auto exhaust 12.2%, tire burning and war gases 11.7%, exercise 10.9%, respiratory infection 10.6 %. Triggers with less effect on asthma were: strong odors 7.5 %, house dust 6.9%, emotional upset 6.9 %, cold air 6.3 %, cosmetics 5.1%, morning time 4%, insect and mold 3.9%, night time 3.6 %, animals 3.4%, foods and food additives 2.7%, drugs 2.5%, grass and trees 1.7 %, latex 1.4%, menstrual cycle and pregnancy 0.6 %. • The triggers that have large effect on health of population sample for skin allergy were insect and mold (17.2%), latex 15.8%, animals 10.7%, foods and food additives 8.3%, drugs 6.1%, emotional upset 6.0 %, menstrual cycle and pregnancy 4.6%, strong odors 3.7 %, weather changes 3.5%, night time 3.2 %, cosmetics 2.2%, triggers with less effect were: house dust, tire burning and war gases 1.7%, exercise 1.3%, auto exhaust 1.6%, smoke 1.2 %, cold air
-54-0.8 %, morning time 0.7%, grass and trees 0.6%, respiratory infection 0.3 %.
Percentage of asthma and allergy Table (10) Percentage of Asthma, wheezing, rhinitis, skin allergy, latex allergy, food allergy, drug allergy, insect sting allergy.
Types of Allergy Frequency Percent % Asthma 41 4.1
Ever wheezing 58 5.8 Allergic Rhinitis 381 38.1
Skin allergy 316 31.6 Latex rubber allergy 33 3.3
Food allergy 110 11.0 Drug allergy 84 8.4
Insect sting allergy 311 31.1 • 4.1% of study sample stated that they have asthma, 5.8 % had ever wheezing, 38.1% had allergic rhinitis, 31.6% had skin allergy, 3.3% had latex rubber allergy, 11.0% had food allergy, 8.4 % had drug allergy and 31.1 % had insect sting allergy.
3.1.4.3. Prevalence rate of asthma and allergy
Prevalence rate of asthma and allergy types were calculated as follows
(R.beaglehole):
P = Number of people with the disease or condition at a specific time (×10) n
Number of people in the population at risk at the specified time
The number of An–Najah University students in the year 2004 was 12500
-55-• Prevalence rate for asthma and allergy among An–Najah University students were 0.33 % for asthma , 0.46% for ever wheezing , 3.1% for allergic rhinitis, 2.5 % Skin allergy, 0.26 % for latex rubber allergy, 0.88 % food allergy, 0.67 % drug allergy and 2.5% insect sting allergy.
Table (12) Distribution of allergic diseases according to the study sample gender
Table 12 shows the distribution of allergic diseases among both sexes for the study sample, the results indicate male predominance for those who have asthma; 6 % for male & 2.4% for female, similar results were seen for those who have skin allergy; with the percentage of 35.7%, 27.5% respectively. The results show slightly higher shift for the males among those who have allergic rhinitis.
-57-Table (13) Distribution of allergic diseases according to the study sample Residence
Table 13 shows the distribution of allergic diseases for the study sample according to their residence. The results show that: 4.9% of village residents and 3.4% of city residents had asthma; however, there were not any cases from the refugee camps. • Regarding allergic rhinitis, 44.7% of camp residents claimed that they have AR, 39.1% of village residents and 36.3% of city residents had AR. • The highest percentage of skin allergy was among camp residents. About 60 % of camp residents, 36.4 % of village residents, and 22.4% of city residents of the study sample claimed that they have skin allergy.
Total Asthma No Yes Residence
38 38 0 Count Camp 100.0% 100.0% 0% %
549 522 27 Count Village 100.0% 95.1% 4.9% %
410 396 14 Count City 100.0% 96.6% 3.4% %
997 956 41 Count Total 100.0% 95.9% 4.1% %
Total Allergic Rhinitis No Yes Residence
38 21 17 Count Camp 100.0% 55.3% 44.7% %
550 335 215 Count Village 100.0% 60.9% 39.1% %
410 261 149 Count City 100.0% 63.7% 36.3% %
998 617 381 Count Total 100.0% 61.8% 38.2% %
Total Skin Allergy No Yes Residence
38 15 23 Count Camp 100.0% 39.5% 60.5% %
549 349 200 Count Village 100.0% 63.6% 36.4% %
410 318 92 Count City 100.0% 77.6% 22.4% %
997 682 315 Count Total 100.0% 68.4% 31.6% %
-58-
3.2. Peak Expiratory Flow Result
Peak expiratory flow measurement were taken for study samples then
prediction percent was calculated by using equations based on European or
USA populations (Nunn and Gregg) and equations for normative lung
function values for the Persian population (Golshan et al, 2003).
3.2.1. Comparison between Persian percent prediction, Nunn, and
Gregg percent prediction equations. Table (14) Male group comparison between Persian percent prediction, Nunn, and Gregg percent prediction equations.
Parameter Types of prediction equation
Percent Prediction categories
Frequency Percent%
Male<21 Persian
PP < 50 3 1.3 PP (50 -79.9) 27 11.6
PP ≥ 80 185 79.4 Total 215 92.3
Missing System 18 7.7 Total 233 100.0
Male<21 (Nunn And Gregg)
PP < 50 65 27.9 PP (50 -79.9) 102 43.8
PP ≥ 80 48 20.6 Total 215 92.3
Missing System 18 7.7 Total 233 100.0
Male≥21 Persian
PP < 50 0 0 PP (50 -79.9) 0 0
PP ≥ 80 183 88.0 Total 183 88.0
Missing System 25 12.0 Total 208 100
Male≥21 (Nunn And Gregg)
PP < 50 51 24.5 PP (50 -79.9) 81 38.9
PP ≥ 80 51 24.5 Total 183 88.0
Missing System 25 12.0 Total 208 100.0
* Correlation is significant at p value = 0.01* PP < 50 (danger), PP 50 -79.9 (caution), PP ≥ 80 (normal lung function) • Persian percent predictions of PEF for males who are less than 21 years old were: 1.3% less
-59-than 50 (danger), 11.6 % between 50 -79.9 (caution), 79.4 % were ≥ 80 (normal lung function). • While 88.0%, of male, who are more or equal to 21years old were normal and there were no danger or caution cases, when Persian equation was applied. • Nunn and Gregg percent prediction of PEF for males who are less than 21 years old were 27.9% less than 50 (danger), 43.8 % between 50 -79.9 (caution), 20.6 % were ≥ 80 (normal lung function). • Nunn and Gregg percent prediction of PEF for males who are more or equal to 21 years old were 24.5 % less than 50 (danger), 38.9 % between 50 -79.9 (caution ), 24.5 % were ≥ 80 (normal lung function).
Table (15) Female group comparison between Persian percent prediction, Nunn, and Gregg percent prediction equations.
Parameter Types of Prediction Equations
Percent PredictionCategories
Frequency Percent%
Female < 21 Persian
PP < 50 1 0.3 PP ( 50 -79.9) 46 15.2
PP ≥ 80 217 71.6 Total 264 87.1
Missing system 39 12.9 Total 303 100.0
Female < 21 (Nunn And Gregg)
PP < 50 78 25.7 PP ( 50 -79.9) 168 55.4
PP ≥ 80 18 5.9 Total 264 87.1
Missing system 39 12.9 Total 303 100.0
Female ≥21 Persian
PP < 50 22 11.1 PP ( 50 -79.9) 123 61.8
PP ≥ 80 31 15.6 Total 176 88.4
Missing system 23 11.6 Total 199 100.0
Female ≥21 (Nunn And Gregg)
PP < 50 46 23.1 PP ( 50 -79.9) 118 59.3
PP ≥ 80 12 6.0 Total 176 88.4
Missing system 23 11.6 Total 199 100.0
* Correlation is significant at p value = 0.01 PP < 50 (danger), PP 50 -79.9 (caution), PP ≥ 80 (normal lung function) • Persian percent predictions of PEF for females who are less than 21years old were: 0.3% less than 50 (danger), 15.2%between 50 -79.9 (caution), 71.6% were ≥ 80 (normal lung function). • While 15.6% of females who are more or equal to 21 years old were normal and 61.8% between 50 -79.9 (caution), 11.1% less than 50 (danger). • Nunn and Gregg percent prediction of PEF for females who are less than 21 years old were: 25.7 % less than 50 (danger), 55.4% between 50 -79.9 (caution), 5.9 % were ≥ 80 (normal lung function). • Nunn and Gregg percent prediction of PEF for females who are more or equal to 21 years
-60-old were 23.1 % less than 50 (danger), 59.3% between 50 -79.9 (caution), 6.0 % were ≥ 80 (normal lung function). • Note: missing value was relatively high in Q 9 & Q10 because nearly 100 subjects didn’t record their height which considered as important variables for prediction equations of PEF.
3.3. Relationships Results
To study the relationship between asthma, allergy and other variables such
as (Gender, smoking, smoking at home, Living place, the tree and grass
around the house, Kind of building that I live in, Kind of heating source,
Kind of cooling source, Kind of animals in house, Kind of animal around
the house, Kind of pillow used, # of family in my house, # of rooms in my
house, sports Practice, Heart problems ,Diabetes, Weight loss, Deep
diarrhea, Migraines, Anemia and Glaucoma),we computed the Chi square
between them , the results were as shown in the tables below.
3.3.1. Allergic Rhinitis & social, environmental, health profile
Table (16) Allergic rhinitis& social, environmental, health profile relationships
Variables Name Chi Value P Value Gender 0.296 0.587 Are you smoker 0.225 0.635 Are their smoker in your house 1.06 0.303 Living place 1.473 0.47 The tree and grass around the house 0.957 0.81 Kind of building that I live in it 3.4 0.18 Kind of heating source 5.97 0.42 Kind of cooling source 1.74 0.41 Kind of animals in house 6.75 0.455 Kind of animal around the house 5.07 0.53 Kind of pillow I use 4.97 0.29 # of family in my house 24.9 0.07 # of rooms in my house 9.58 0.65 Sports practice 4.65 0.3 Heart problems 0.17 0.67 Diabetes 0.022 0.881
• Their was statistically significant relationship (p value < 0.05) of allergic rhinitis and weight loss, deep sleeping, chronic respiratory infections, chronic abdominal pain, nasal polyps, anxiety, sleep apnea, chronic diarrhea, migraines, anemia . • Their was no statistically significant relationship (p value > 0.05) between allergic rhinitis and gender, smoking, smoker at home, living place, the tree and grass around the house, kind of building that I live in, kind of heating source, kind of cooling source, kind of animals in house, kind of animal around the house, kind of pillow I use, # of family in my house, # of rooms in my house, practice a sports, heart problems, diabetes, thyroid disorder, skin allergy, glaucoma.
3.3.2. Asthma& social, environmental, health profile
Table (17) Asthma & social, environmental, health profile relationships Variables Name Chi Value P Value
Gender 8.2 0.004 Are you smoker 5.6 0.018 Are their smoker in your house 1.31 0.252 Living place 3.04 0.219 The tree and grace around the house 4 0.259 Kind of building that I live in it 0.19 0.90 Kind of heating source 3.85 0.69 Kind of cooling source 2.55 0.27 Kind of animals in house 6.57 0.47 Kind of animal around the house 2.7 0.83 Kind of bellow I use 0.783 0.94 # of family in house 23.18 0.10 # of rooms in house 2.3 0.99 Practice a sports 0.18 0.66 Heart problems 8.47 0.004 Diabetes 0.13 0.71 Weight losing 0.02 0.86 Deep sleeping 1.3 0.24 Chronic respiratory infections 16.6 0 Chronic abdominal pain 0.14 0.707 Nasal polyps 35 0.06
• Their was statistically significant relationship (p value < 0.05) of asthma and gender, smoking, heart problems, chronic respiratory infections, osteoporosis, thyroid disorder, angina, chronic diarrhea, glaucoma. • Their was no statistically significant relationship (p value > 0.05) of asthma & smoker in house, living place, the tree and grass around the house, kind of building that I live in, kind of heating source, kind of cooling source, kind of animals in house, kind of animal around the house, kind of pillow I use, # of family in my house, # of rooms in my house, practice a sports, allergy test, diabetes, weight loss, deep sleeping , chronic abdominal pain, nasal polyps, anxiety, skin allergy, sleep apnea, migraines, anemia.
3.3.3. Skin allergy& social, environmental, health profile
Table (18) Skin allergy & social, environmental and health profile relationships Variable Name Chi Value P Value
Gender 4.68 0.03 Are you smoker 0.232 0.63 Are there smoker in your house 1.17 0.278 Living place 18.7 0 The tree and grass around the house 1.98 0.57 Kind of building that I live in it 5.1 0.07 Kind of heating source 6.7 0.34 Kind of cooling source 0.35 0.838 Kind of animals in house 9.93 0.192 Kind of animal around the house 6.4 0.37 Kind of pillow I use 6.5 0.164 # Of family in house 37.9 0.002 # Of rooms in house 3.2 0.993 Practice a sport 2.9 0.086 Allergy test 12.9 0 Heart problems 9.57 0.002 Diabetes 0.82 0.36 Weight losing 3.9 .04 Deep sleeping 10.45 0.001 Chronic respiratory infections 3.8 0.05 Chronic abdominal pain 11.13 0.001 Nasal polyps 4 0.045 Anxiety 20.4 0 Thyroid disorder 8.8 0.003
• Their was statistically significant relationship (p value < 0.05) of skin allergy and gender, living place, # of family in house, allergy test, heart problems, deep sleeping , chronic abdominal pain, nasal polyps, anxiety, osteoporosis, thyroid disorder, skin allergy, sleep apnea, chronic diarrhea, migraines, glaucoma, ulcer kidney stone and Chronic respiratory infections • Their was no statistically significant relationship (p value > 0.05) skin allergy and smoking, smoker in house, the tree and grass around the house, kind of building that I live in it, kind of heating source, kind of cooling source, kind of animals in house, kind of animal around the house, kind of pillow I use, # of rooms in house, practice a sport, diabetes and anemia.
-64-
3.3.4. BMI categorized & Persian percent prediction for male categorized
To test the relation between both variables Pearson chi – square was
computed, the results were shown in the tables below.
Table (19) BMI categorized & Persian percent prediction for male less than 21 categorized
BMI Categorized
Persian Percent Prediction For Male Less Than 21 Categorized
Less than 50 (Dangerous)
(50-79.9) (Caution)
80 and more (Normal) Total
Normal ( < 25 ) % within BMI categorized
5 1.6%
49 15.3%
266 83.1%
320 100.0%
Overweight (25-29.9) Count% within BMI categorized
0 0
4 5.5%
69 94.5%
73 100.0%
Obese (30 & over) Count % within BMI categorized
0 0
1 7.1%
13 92.9%
14 100.0%
Total Count % within BMI categorized
5 1.6%
53 13.3%
348 85.5%
407 100.0%
Pearson chi – square = 7.095, p value = 0.131
Bars as shown below demonstrated this table
BMI categorized
obese (30 & over)over w t (25-29.9)
normal less than 25`
Cou
nt
300
200
100
0
male persian perce
less than 50
dangerouse
50-79.9 (caution)
80 and more(normal)
Figure 1. BMI & Persian percent prediction for male less than 21
-65-
Table (20) BMI categorized & Persian percent prediction for male equal or more than 21 categorized
BMI Categorized
Persian Percent Prediction For Male Equal Or More Than 21 Categorized
Less Than 50 (Dangerous)
(50-79.9) (Caution)
80 and More (Normal)
Total
Normal < 25 % Within BMI Categorized
1 0.3%
1 0.3%
318 99.4%
320 100.0%
Overweight (25-29.9) Count % Within BMI Categorized
0 0
0 0
73 100.0%
73 100.0%
Obese (30 & Over) Count % Within BMI Categorized
0 0
0 0
14 100.0%
14 100.0%
Total Count %Within BMI Categorized
1 0.2%
1 0.2%
405 99.5%
407 100.0%
Pearson chi – square = 0.546, p value = 0.969
Bars as shown below demonstrated this table
BMIcategorized
obese (30 & over)over w t (25-29.9)
normal less than 25`
Cou
nt
400
300
200
100
0
male persian perce
less than 50
(dangerouse)
50-79.9(caution)
80 and more(normal)
Figure 2. BMI & Persian percent prediction for male equal or more than
21
-66-
3.3.5. Sport practicing & Persian percent prediction for male
categorized
To test the relation between both variables Pearson chi–square was
computed, the results were shown in the tables below.
Table (21) Sport practicing & Persian percent prediction for male less than 21 categorized
Sport Practicing
Persian percent prediction for male less than 21 categorized
Total Less than 50 (Dangerous)
(50 -79.9) (Caution)
80 and more (Normal)
Yes Count %
3 1.1%
35 13.0%
231 85.9%
269 100.0%
No
Count %
1 0.8%
16 12.5%
111 86.7%
128 100.0%
Total Count %
4 1.0%
51 12.8%
342 86.1%
397 100.0%
Pearson chi – square = 0.121, p value = 0 .941
Bars as shown below demonstrated this table
sport practing
NoYes
Cou
nt
300
200
100
0
male persian perce
less than 50(dangaru
se)
50-79.9(caution)
80 and more(normal)
Figure 3. Sport practicing & Persian percent prediction for male less
than21
-67-
Table (22) Sport practicing & Persian percent prediction for male equal or more than 21 categorized
Sport Practicing
Persian percent prediction for male equal or more than 21 categorized
Total Less than 50 (Dangerous)
80 and more (Normal)
Yes
Count %
1 0.4%
268 99.6%
269 100.0%
No Count %
0 0
128 100.0%
128 100.0%
Total Count %
1 o.3%
396 99.7%
397 100.0%
Pearson chi – square = 0.472, p value = 0 .49
Bars as shown below demonstrated this table
sport practing
NoYes
Cou
nt
300
200
100
0
male persian perce
less than 50
(dangarouse)
80 and more(normal)
Figure 4. Sport practicing & Persian percent prediction for male equal or
more than 21
-68-
3.3.6. Smoking & Persian percent prediction for male categorized
To test the relation between both variables Pearson chi – square was
computed, the results were shown in the tables below.
Table (23) Smoking & Persian percent prediction for male less than 21 categorized
Smoking
Persian percent prediction for male less than 21 categorized
Total less than 50 (Dangerous)
( 50 - 79.9 ) (Caution)
80 and more (Normal)
Yes Count %
0 0
22 15.8%
117 84.2%
139 100.0%
No Count %
5 1.8%
33 12.0%
238 86.2%
276 100.0%
Total Count %
5 1.2%
55 13.3%
355 85.5%
415 100.0%
Pearson chi – square = 3.609, p value = 0.165
Bars as shown below demonstrated this table
smoking
NoYes
Cou
nt
300
200
100
0
male persian percent
less than 50(dangaru
se)
50-79.9(caution)
80 and more(normal)
Figure 5. Smoking & Persian percent prediction for male less than 21
-69-
Table (24) Smoking & Persian percent prediction for male equal or more than 21 categorized
Smoking
Persian percent prediction for male equal or more than 21 categorized
Total less than 50 (Dangerous)
(50-79.9) (Caution)
80and more (Normal)
Yes Count %
0 0
0 0
139 100.0%
139 100.0%
No Count %
1 0.4%
1 0.4%
274 99.3%
276 100.0%
Total Count %
1 0.2%
1 0.2%
413 99.5%
415 100.0%
Pearson chi – square = 1.012, p value = 0 .603
Bars as shown below demonstrated this table
smoking
NoYes
Cou
nt
300
200
100
0
male persian percent
less than 50(dangaru
se)
50-79.9(caution)
80 and more(normal)
Figure 6. Smoking & Persian percent prediction for male equal or more
than 21
-70-
3.3.7. Residence & Persian percent prediction for male categorized
To test the relation between both variables Pearson chi – square was
computed, the results were shown in the tables.
Table (25) Residence & Persian percent prediction for male less than 21 categorized
Residence
Persian percent prediction for male less than 21 categorized
Total Less than 50 (Dangerous)
(50 - 79.9) (Caution)
80 and more (Normal)
Camp
Count %
0 0
5 31.3%
11 68.8%
16 100.0%
Village Count %
5 1.8%
34 12.5%
233 85.7%
272 100.0%
City
Count %
0 0
15 11.3%
118 88.7%
133 100.0%
Total
Count %
5 1.2%
54 12.8%
362 86.0%
421 100.0%
Pearson chi – square = 7.916, p value = 0.095
Bars as shown below demonstrated this table
Residence
cityvillagecamp
Cou
nt
300
200
100
0
male persian perce
less than 50
(dangarouse)
50-79.9(caution)
80 and more(normal)
Figure 7. Residence & Persian percent prediction for male less than 21
-71-
Table (26) Residence & Persian percent prediction for male equal or more than 21 categorized
Residence
Persian percent prediction for male equal or more than 21 categorized Total
Less than 50(Dangerous)
(50-79.9) (Caution)
80 and more (Normal)
Camp
Count %
0 0
0 0
16 100.0%
16 100.0%
Village
Count %
1 0.4%
1 0.4%
270 99.3%
272 100.0%
City
Count %
0 0
0 0
133 100.0%
133 100.0%
Total
Count %
1 0.2%
1 0.2%
419 99.5%
421 100.0%
Pearson chi – square = 1.101, p value = 0.894
Bars as shown below demonstrated this table
Residence
cityvillagecamp
Cou
nt
300
200
100
0
male persian percent
less than 50(dangaru
se)
50-79.9(caution)
80 and more(normal)
Figure 8. Residence & Persian percent prediction for male equal and more
than 21
-72-
3.3.8. Asthma & Persian percent prediction for male categorized
To test the relation between both variables Pearson chi – square was
computed , the results were shown in the tables below.
Table (27) Asthma & Persian percent prediction for male less than 21 categorized
Asthma
Persian percent prediction for male less than 21 categorized
Total Less than 50 (Dangerous)
(50 - 79.9) (Caution)
80 and more (Normal)
Yes
Count %
0 0
4 16.0%
21 84.0%
25 100.0%
No
Count %
5 1.3%
51 12.8%
341 85.9%
397 100.0%
Total Count %
5 1.2%
55 13.0%
362 85.8%
422 100.0%
Pearson chi – square = 0.504, p value = 0.777
Bars as shown below demonstrated this table
Asthma
NoYes
Cou
nt
400
300
200
100
0
male persian percent
less than 50(dangaru
se)
50-79.9(caution)
80 and more(normal)
Figure 9. Asthma & Persian percent prediction for male less than 21
-73-
Table (28) Asthma & Persian percent prediction for male equal or more than 21 categorized
Asthma
Persian percent prediction for male equal or more than 21 categorized
Total Less than 50 (Dangerous)
(50-79.9) (Caution)
80and more (Normal)
Yes
Count %
0 0
0 0
25 100.0%
25 100.0%
No Count %
1 0.3%
1 0.3%
395 99.5%
397 100.0%
Total
Count %
1 0.2%
1 0.2%
420 99.5%
422 100.0%
Pearson chi – square = 0.127, p value = 0.939
Bars as shown below demonstrated this table
Asthma
NoYes
Cou
nt
500
400
300
200
100
0
male persian percent
less than 50(dangaru
se)
50-79.9(caution)
80 and more(normal)
Figure 10. Asthma & Persian percent prediction for male equal or more
than 21
-74-
3.3.8. BMI & Persian percent prediction for female categorized
To test the relation between both variables Pearson chi–square was
computed, the results were shown in the tables below.
Table (29) BMI & Persian percent prediction for female less than 21 categorized
Body Mass Index
Persian percent prediction for female less than 21 categorized
Total Less than 50(Dangerous)
(50-79.9) (Caution)
80 and more (Normal)
Normal less than 25
Count %
2 0.5%
73 19.7%
296 79.8%
371 100.0%
Over weight (25 - 29.9)
Count %
0 0
7 13.2%
46 86.8%
53 100.0%
Obese (30 & over)
Count %
0 0
0 0
5 100.0%
5 100.0%
Total
Count %
2 0.5%
80 18.6%
347 80.9%
429 100.0%
Pearson chi–square = 2.807, p value = 0.591
Bars as shown below demonstrated this table
BMI categorized
obese (30 & over)over w t (25-29.9)
normal less than 25`
Cou
nt
400
300
200
100
0
female persian perce
less than 50
dangerouse
( 50 -79.9 ) caution
80 & more normal
Figure 11. BMI & Persian percent prediction for female less than 21
-75-
Table (30) BMI & Persian percent prediction for female equal or more than 21 categorized
BMI categorized
Persian percent prediction for female equal or more than 21 categorized Total Less than 50
(Dangerous) (50-79.9) (Caution)
80and more (Normal)
Normal less than 25
Count%
62 16.7%
256 69.0%
53 14.3%
371 100.0%
Over weight (25-29.9)
Count%
5 9.4%
36 67.9%
12 22.6%
53 100.0%
Obese ( 30 & over )
Count%
0 0
3 60.0%
2 40.0%
5 100.0%
Total
Count%
67 15.6%
295 68.8%
67 15.6%
429 100.0%
Pearson chi – square = 6.426, p value = 0.170
Bars as shown below demonstrated this table
BMI categorized
obese (30 & over)over w t (25-29.9)
normal less than 25`
Cou
nt
300
200
100
0
female persian perce
less than 50
dangerouse
(50 - 78.9) caution
80 & more normal
Figure 12. BMI & Persian percent prediction for female equal or more than
21
-76-
3.3.9. Sport practicing & Persian percent prediction for female
categorized
To test the relation between both variables Pearson chi – square was
computed, the results were shown in the tables below.
Table (31) Sports & Persian percent prediction for female less than 21categorized
Sport practicing
Persian percent prediction for female less than 21 categorized Total Less than 50
(Dangerous) (50-79.9) (Caution)
80 and more (Normal)
Yes Count
% 0 0
27 15.2%
151 84.8%
178 100.0%
No Count %
2 0.8%
48 20.0%
190 79.2%
240 100.0%
Total Count %
2 0.5%
75 17.9%
341 81.6%
418 100.0%
Pearson chi – square = 3.215, p value = 0.200
Bars as shown below demonstrated this table
sport practing
NoYes
Cou
nt
200
100
0
female persian perc
less than 50
dangerouse
(50 - 79.9) caution
80 & more normal
Figure 13. Sport practicing & Persian percent prediction for female less
than 21
-77-
Table (32) Sports & Persian percent prediction for female equal or more than 21 categorized
Sport Practicing
Persian percent prediction for female equal or more than 21 categorized Total
Less than 50 (Dangerous)
(50-79.9) (Caution)
80 and more (Normal)
Yes Count
% 24
13.5% 123
69.1% 31
17.4% 178
100.0%
No Count %
38 15.8%
163 67.9%
39 16.3%
240 100.0%
Total Count %
62 14.8%
286 68.4%
70 16.7%
418 100.0%
Pearson chi–square = 0.484, p value = 0.785
Bars as shown below demonstrated this table
sport practing
NoYes
Cou
nt
200
100
0
female persian perc
less than 50
dangerouse
(50 - 79.9) caution
80 & more normal
Figure 14. Sport practicing & Persian percent prediction for female equal
or more than 21
-78-
3.3.10. Residence & Persian percent prediction for female categorized
To test the relation between both variables Pearson chi – square was
computed, the results were shown in the tables below
Table (33) Residence & Persian percent prediction for female less than 21 categorized
Residence
Persian percent prediction for female less than 21 categorized Total Less than 50
(Dangerous) (50-79.9) (Caution)
80 and more (Normal)
Camp Count %
0 0
2 11.1%
16 88.9%
18 100.0%
Village Count %
2 1.0%
38 18.9%
161 80.1%
201 100.0%
City Count %
0 0
41 18.6%
180 81.4%
221 100.0%
Total Count %
2 0.5%
81 18.4%
357 81.1%
440 100.0%
Pearson chi – square = 3.091, p value = 0.543
Bars as shown below demonstrated this table
Residence
cityvillagecamp
Cou
nt
200
100
0
female persian perce
less than 50
(50-79.9)
80 & more
Figure 15. Residence & Persian percent prediction for female less than 21
-79-
Table (34) Residence & Persian percent prediction for female equal or more than 21 categorized
Residence
Persian percent prediction for female equal or more than 21 categorized Total
Less than 50 (Dangerous)
(50-79.9) (Caution)
80 and more (Normal)
Camp Count %
2 11.1%
12 66.7%
4 22.2%
18 100.0%
Village Count %
33 16.4%
135 67.2%
33 16.4%
201 100.0%
City Count %
33 14.9%
153 69.2%
35 15.8%
221 100.0%
Total Count %
68 15.5%
300 68.2%
72 16.4%
440 100.0%
Pearson chi – square = 0.867, p value = 0.929
Bars as shown below demonstrated this table
Residence
cityvillagecamp
Cou
nt
200
100
0
female persian perce
less than 50
(50 - 79.9)
80 & more
Figure 16. Residence & Persian percent prediction for female equal or more
than 21
-80-
3.3.11. Smoking & Persian percent prediction for female categorized
To test the relation between both variables Pearson chi – square was
computed, the results were shown in the tables below
Table (35) Smoking& Persian percent prediction for female less than 21 categorized
Bars as shown below demonstrated this table
Smoking
NoYes
Cou
nt
400
300
200
100
0
female persian perce
less than 50
(50 - 79.9)
80 & more
Figure 17. Smoking & Persian percent prediction for female less than 21
Smoking
Persian percent prediction for female less than 21 categorized Total
Less than 50 (Dangerous)
(50-79.9) (Caution)
80 and more (Normal)
Yes Count
% 0 0
3 33.3%
6 66.7%
9 100.0%
No Count %
2 0.5%
78 18.3%
346 81.2%
426 100.0%
Total Count %
2 0.5%
81 18.6%
352 80.9%
435 100.0%
Pearson chi-square = 1.341, p value = 0.511
-81-
Table (36) Smoking & Persian percent prediction for female equal or more than 21 categorized
Smoking
Persian percent prediction for female equal or more than 21 categorized Total Less than 50
(Dangerous) (50-79 .9) (Caution)
80 and more (Normal)
Yes Count
% 2
22.2% 6
66.7% 1
11.1% 9
100.0%
No Count %
66 15.5%
289 67.8%
71 16.7%
426 100.0%
Total Count %
68 15.6%
295 67.8%
72 16.6%
435 100.0%
Pearson chi – square = 0.421, p value = 0.810
Bars as shown below demonstrated this table
smoking
NoYes
Cou
nt
400
300
200
100
0
female persian perce
less than 50
(50 - 79.9)
80 & more
Figure 18. Smoking & Persian percent prediction for female equal or more
than 21
-82-
3.3.11. Asthma & Persian percent prediction for female categorized
To test the relation between both variables Pearson chi–square was
computed, the results were shown in the tables below
Table (37) Asthma & Persian percent prediction for female less than 21 categorized
Asthma
Persian Percent Prediction For Female Less than 21 Categorized Total
Less than 50 (Dangerous)
(50-79.9) (Caution)
80 and more (Normal)
Yes
Count %
0 0
7 63.6%
4 36.4%
11 100.0%
No Count %
2 0.5%
74 17.3%
352 82.2%
428 100.0%
Total Count %
2 0.5%
81 18.5%
356 81.1%
439 100.0%
Pearson chi–square = 15.320, p value = 0 .000
Bars as shown below demonstrated this table
Asthma
NoYes
Cou
nt
400
300
200
100
0
female persian perce
less than 50
(50 - 79.9)
80 & more
Figure 19. Asthma & Persian percent prediction for female less than 21
-83-
Table (38) Asthma & Persian percent prediction for female equal or more than 21 categorized
Asthma
Persian percent prediction for female equal or more than 21 categorized Total
Less than 50 (Dangerous)
(50 - 79.9) (Caution)
80 and more (Normal)
Yes Count %
7 63.6%
3 27.3%
1 9.1%
11 100.0%
No Count %
61 14.3%
297 69.4%
70 16.4%
428 100.0%
Total Count %
68 15.5%
300 68.3%
71 16.2%
439 100.0%
Pearson chi–square = 20.019, p value = 0.000
Bars as shown below demonstrated this table
Asthma
NoYes
Cou
nt
400
300
200
100
0
female persian perce
less than 50
( 50 - 79.9 )
80 & more
Figure 20. Asthma & Persian percent prediction for female equal or more
than 21
CHAPTER FOUR
DISCUSSIONS
-85-
Discussion
Palestine, as a country in transition shifting from traditional to a modern
society, has several unique features; the population is young with 46%
being aged < 15 years (Census result summery 2001), an increase in the
fertility rate, socioeconomic changes, and rural – urban migration. other
special important changes imposed on Palestinian society is the different
political, social economical, and environmental changes associated with
current AL Aqsa Intifada, people have been exposed to different kinds of
war gasses, tire burning fumes , building destruction ,and so on. The aim
of this study is to assess the prevalence of asthma and allergy among An
Najah University students and their possible risk factors, and in addition to
test the value of using PEF in our target population.
4.1. Social profile
The researcher studied the social profile of the study sample through
answers for related questions Q1-Q2 in the questionnaire (appendix 1) to
have and idea about the social pattern of An Najah University students,
which might be helpful in this study.
4.1.1. Socio demographic profile
In our study sample, we have a fair mix of males and females, most of the
students were 20 years old or less , just 2.5% were older than 24. These
results reflect the profile of under graduate students at An Najah
University who are usually 18–20 years old. The percentages of the
students in the sample from each college were representing the percentage
of number of students in each college to the total students at the university.
this table also shows that nearly half of the target population practice sport
-86-
while 42.8% didn’t, and this indicate poor physical activity among this
young aged students, (See table 5).
The majority of the students in the study sample had normal BMI (72.3%),
13.2 % were over weight, and only 2.2 % were obese, this result shows
that students at An Najah University in general don’t have weight problem,
although there is convincing evidence that BMI has increased the last 10-
30 years in developed countries (Turn bull et al 2004).
More than 90% of our samples were single & unemployed; this is an
expected pattern for undergraduate students in Palestine and most of
Arabic countries.
Regarding smoking, 17.6% of students in the target population were
smokers, and 55.4% of the students in the study sample were exposed to
environmental tobacco smoke in their houses, (See table 7).Effort need to
be done by the university & health authorities to educate students about
smoking risk.
When the target population were distributed according to their residence,
the lowest percent of the student in the study sample were from refugee
camps (3.8%), 46.1% of the target population were living in dormitories,
which can be explained by political circumstances after AL Aqsa Intifada
with closure & check points that makes transportation between Palestinian
cities very difficult, (See table 8).
In regards to houses conditions, the results show that 60.2 % of the student
in the study sample lived in houses < 20 years of ages, similarly most of
the houses of students in the study sample were laid out in quiet places, the
highest percentage of the student were living in stone houses, while the
-87-
lowest percent (3.1%) were living in asbestos building. Although the
percent of asbestos building is low, it indicates an important need for
raising awareness among students about asbestos & its hazardous effects
on the lungs.
Regarding houses of study population, 41.8% of the students use gas for
heating, 20.8% use coal, and 11.9% use kerosene. These results reflect the
pattern of available sources for heating in Palestine.
The highest percent of the students in the study sample did not have any
kind of animals in their houses. While 12.8 % had pigeons, 11.3% had
cats, and 9% had chicken. These results indicate that acquiring pets is not
very popular in Palestine, (See table 8).
Most of the target populations were using pillows made from cotton
(38.2%), just 4.8% were using pillows made from feathers, and 24.3%
were using pillows made from wool. Health education should be done for
those who have asthma about minimizing dust by encasement mattress,
box spring ad pillow by proof covers.
The lowest percentage (5.6%) of the target population had small size
family (3 and less), while the highest percentage (69.4%) had large size
family (7 and more); these results indicate a high fertility rate in Palestine.
The highest percent of the target population had 4 rooms in their houses,
the lowest percent (4.8%) had 2 and less rooms .this reflects that majority
of students at the university come from middle class, (see table 8).
About the planting around the target population houses, 42.4 % of the
students in the study sample mentioned that fruitful trees were planted
-88-
around their houses, while 14.6% had wooded trees, these results reflect
Palestinian tradition of planting trees around their houses.
4.2. Triggers that worsen or cause symptoms for population sample
The triggers that have large effect on health of population sample for
allergic rhinitis were respiratory infections, tire burning and war gases,
house dust, strong odors, auto exhaust, smoke and weather changes
Bindsley – Jensen C. "ABC of allergies": food allergy. BR Med J 1998;
316: 1299 -1301.
Bjorksten et al: prevalence of childhood asthma, rhinitis and eczema in
Scandinavia and Eastern Europe, Eur Respir J 2004; 24: 734-739,
P mid: 9727797.
Bourjaily, Philip "asthma on the rise in the US" environmental news network. sept 20, 2000: 1, 2.
Brand PLP, De GooijerA, Postma DS. Changes in peak expiratory flow in healthy subjects and in patients with obstructive lung disease. Eur Respir J 1997; 10: Suppl.24, 69s–71s.
Braun – Fahrlander C, Gassner M, Grize L, et al. "Swiss study on childhood allergy and respiratory symptoms"; Air pollution (SCARPOL) team. No further increase in asthma, hay fever and atopic sensitization in adolescents living in Switzerland. Eur Respir J 2004; 23:407 -13.
-111-
Braun – Fahrlander C, Gassner M, Grize L, et al. No further increase in
asthma, hay fever and atopic sensitization in adolescents living in Switzerland. Eur respir J 2004; 23: 407-413.
Burr ML, Limb ES, Andrae S, Barry DM, Nagel F. Childhood asthma in
four countries: a comparative survey. Int J Epidemiol 1994; 23:
341–347.
Bush BK, Portnoy JM. The role and abatement of fungal allergens in
allergic disease. J allergy Clin immunol 2001; 107: s 430-440.
Castro – Rodriguez JA, Holberg CJ, Morgan WJ, et al: Increase in
incidence of asthma like symptoms in girls who become over weight or obese during the school years. AMJ Respir Crit Care
Med 2001; 163: 1344 9.
CDC. fast stats A-Z, advanced data from vital and health statistics, no
.346, table 13. august 26, 2004, web: http://www.cdc.gov\nchs
\fastats\allergies.htm
CDC. national center for health statistics. Vital and health statistics
series, 1996: Vol. 13, no. 134.
Census results – Summery (Population, Housing, Buildings and
Establishments) www.PCBS.org.
Centers for Disease Control. Forecasted state – specific estimates of self
Chan–Yeung M. "Assessment of asthma in the work place". ACCP
Consensus statement. Chest 1995; 108: 1084-1117.
Chang C. hand book of nutrition and immunity. 2004; pps 153- 186.
-112-
Chen Y. Dales R, Tang M, et al. "Obesity may increase the incidence of
asthma in women but not in men": longitudinal observations from
the Canadian national population health surveys. AM J Epidemiol
2002; 155-191.
Cross, S. Buck, S. Hubbard, J: ABC of allergies, allergy in general
practice, BMJ 1998; 316: 1584- 1587.
Cross, s. Buck, s. Hubbard, d. ABC of Allergy, BMJ 1998; 316: 1075.
Cross D, Nelson HS. The role of the peak flow meter in the diagnosis
and management of asthma. J Allergy Clin Immunol 1991; 87:120-
128.
De marco R, Locatelli F, sunyer J, Burney P. "Differences in incidence
of reported asthma related to age in men and women": a
retrospective analysis of the data to the European Respiratory Health
survey . Am J Respir Crit Care Med 2000; 162: 68 -74.
Djukanovic R, Wilson JW, Britten KM, et al: Effect of an inhaled
corticosteroid on airway inflammation and symptoms in asthma. Am Rev Respir Dis 1992 Mar; 145 (3): 669 – 74.
Dr. J.K. Samaria. Asthma – Genetic component, department of chest
disease 2002.
Dr. Joseph F. Smith Medical library 2005, www.chclibrary.org.
Dr. Matt Halls Worth, National Asthma Campaign, 2005.
Dr. S.K. Agarwla. Gene and airways Remodling in asthma, department
of chest disease 2002.
Druce IIM. In: Middleton E, Reed CHE, Ellis EF, Adkinson NF, editors.
-113-
Allergy Principles and Practice USA: Mosby, 1998:1005-16.
Duran –Tauleria E, Rona RJ. Geographical and socioeconomic variation in the prevalence of asthma symptoms in English and Scottish children. Thorax 1999; 54: 476 -481.
Durham, S. ABC of allergies, seasonal allergy, BMJ 1998; 316: 607-610.
Dykewicz et al. "Diagnosis and management of rhinitis":complete guidelines of the Joint Task Force On Practice Parameters in Allergy, Asthma and Immunology. AA Allergy Asthma Immunol 1998 NOV; 81 (5 Pt 2): 478 -518.
EL- Sharif et al: Asthma prevalence in children living in villages, Cities and Refugee camps in Palestine ,Eur Respir J, 19: 1026- 1034; 2002.
Elevated risk of anaphylactoid reaction from radiographic contrast media is associated with both beta blocker exposure an cardiovascular disorders .Erratum in Arch Intern Med 1993 NOV 8; 153 (21): 2421.
Ezeamuzie et al. Asthma in the desert: spectrum of the sensitizing aeroallergens. Allergy 2000; 55: 157 – 162.
F.A. Sagher, M.A. Roushdy and A.M. Hweta . Peak expiratory flow rate nomogram in Libyan schoolchildren. Eastern Mediterranean Health Journal1999; 5: 560-564. -564
Falade et al: prevalence and severity of symptoms of Asthma, Allergic, Rhinoconjunctivitis, and atopic Eczema in (6-7) year old Nigerian primery school children "the international study of asthma and allergies in childhood", medical principles and practice 2004; 13: 20-25.
Ferrari M, Poli a, Olivieri m, et al."Seroprevalence of Chlamydia
-114-
pneumoniae antibodies in a young adult population sample living in Verona": European community respiratory health survey
(ECRHS). Infection 2000; 28: 38-41.
Foister et al: linkage between atopy and the IgE high – affinity
receptor gene at 11q13 in atopic dermatitis families. Hum Genet.
1998; 102: 236-239.
Formanek, R. Food allergies, when food becomes the enemy. DEC
2004.
Fulambarker et al. Reference Values for Pulmonary Function in Asian
Indians Living in the United States. Chest 2004; 126: 1225-1233.
Gazi et al: Frequency of allergic rhinitis in school –age children
[7-18 years ] in Tehran, Iranian Journal of allerg , Asthma and immunology, Vol. 2. No. 4:181-184, December 2003.
Gilardi S. Torricelli R. peters AG. Wuthrich B. pollinosis in canton
Ticino, A prospective study in locarno. [German]. Journal suisse de medicine /124 (42): 1841-7, Oct 1994.
Global Initiative for Asthma. Global strategy for asthma management
and prevention. Publication No. 95 3659. NHLBI/WHO Workshop
Report. Bethesda: National Institutes of Health, National Heart,
Lung, and Blood Institute, 1995.
Golden DB."Stinging insect vaccines": patient selection and
administration of Hymenoptera Venom immunotherapy. Immunol
Allergy Clin North AM 2000; 20: 553-70.
Golden, D. John's Hopkins university school of medicine, stinging insect
allergy, BMJ 2003; 327:1229.
-115-
Goldman, M, Rachmiel, M, Gendler, L, et al. "Decrease in asthma
mortality rate in Israel from 1991 – 1995": is it related to increased
use of inhaled corticosteroids? J Allergy Clin Immunol 2000; 105, 71-
74.
Golshan et al. spirometric reference values in a large Middle Eastern
population. Eur Respir J 2003; 22: 529-534.
Greaves M. chronic urticaria, St John's Institute of Dermatology, St
John's Hospital, United Medical and Dental School, London, United
Kingdom, Allergy Clin Immunol 2000; 105: 664-72.
Habbick et al: prevalence of asthma, rhinitis and eczema among
children in 2 condition cities "the international study of asthma and
allergies in childhood" (MAJ 1999;160: 1824-8).
Hakala et al. Effects of Weight Loss on Peak Flow Variability, Airways
Obstruction, and Lung Volumes in Obese Patients with Asthma.
Chest. 2000; 118:1315-1321.
Hanifin JM, Toft S. patient education in the long – term management
of atopic dermatitis. Dermatol Nurs.1999; 1: 4.
Hasan MM, Gofin R, Bar-Yishay E. Urbanization and the risk of
asthma among schoolchildren in the Palestinian Authority. J
Asthma 2000; 37: 353–360.
Hedman J, Kaprio J, Poussa T, et al. "prevalence of asthma, aspirin
intolerance, nasal polyposis and chronic obstructive pulmonary disease in a population - based study". Int Epidemiol 1999; 28:
717-22.
Hijazi N, Abalkhail B, Seaton A. Diet and childhood asthma in a society
-116-
in transition: a study in urban and rural Saudi Arabia. Thorax 2000; 55:775–779.
Hopkin JM. Mechanisms of enhanced prevalence of asthma and atopy
in developed countries. Curr Opin Immumol 1997; 9: 788 -792.
http://www.anaphlaxis.org.uk\whom.html
Huang Sl; dietary factors associated with physician – diagnosed
asthma and allergic rhinitis in teenagers, clin exp allergy 2001; 31:
256-6.
International Study of Asthma and Allergies in Childhood (ISAAC)
Steering Committee. "Worldwide variation in prevalence of
symptoms of asthma, allergic rhino conjunctivitis, and a topic eczema": ISSAC .Lancet 1998; 351: 122532.
ISSAC steering committee: word wide variation in prevalence of
symptoms of asthma, allergic rhinoconjunctivitis, and atopic eczema, "the international study of asthma and allergies in
Liou et al.Respiratory symptoms and pulmonary function among
wood dust – exposed joss stick workers. Int Arch Occu Environ
Health 1996; 68:154-160.
Litonjua AA, Carey VJ, Weiss ST, Gold DR. Race, socioeconomic
factors, and area of residence are associated with asthma prevalence. Pediatr Pulmonol 1999; 28: 394 – 401.
MacKay, I. and Durham, S. ABC of Allergies Perennial Rhinitis BMJ
1998; 316: 843.
Mannino et al. Surveillance for asthma – United States, 1960 -1995.
Mortal Rep CDC Surveill Summ. 1998; 47: 1-27.
Mayo clinic stuff, Double trouble: The link between allergies and
asthma, mayo foundation for medical education and research
(MFMER), September 20, 2004.
Middleton E Jr, et al. Allergy: principles and practice. 5th ed. st louis:
mosby, 1998; 1063 -72.
Mielck a, reitmeir p, Wjst M.Severity of childhood asthma by
socioeconomic status. Int J Epidemiol 1996; 25: 388-393.
Miller AL Thorn Research, the etiologies, path physiology and
alternative complementary treatment of asthma, Altern med Rev 2001; 6: 20- 47.
Miller MR, Dickinson SA, Hitchings DJ. The accuracy of portable peak
flow meters. Thorax 1992; 47: 904-9.
-120-
Mutius et al. "Relation of body mass index to asthma and atopy in children": the national health and nutrition Examination study III. Thorax 2001; 56: 835.
Mutiuse et al, "relation of indoor heating with asthma, allergic sensitization, and bronchial responsiveness": survey of children in south Bavaria BMJ 1996 ; 312: 1448 – 1450 June.
National asthma campaign (1997): The incidence of asthma in the UK and causal agents.
National asthma education and prevention program (national heart, Lang, blood institute) second expert panel on the management of asthma guidelines for the diagnosis and management of asthma update on selected topics 2002.
National asthma education and prevention program: expert panel report 2: Guidelines for the diagnosis and management of asthma NIH publication No. 97 - 4051. available at:
National center for health statistics. Asthma prevalence, health care use and mortality, 2000 – 2001. center for disease control and prevention . Reviewed June 2004.
Nayak, A: The asthma and allergic rhinitis link. allergy asthma proc 2003; 24: 595 – 602.
Newman – Taylor A. Environmental determinants of asthma. Lancet, 1995; 345: 296 -9.
Newson R, Shaheen S, Burney P. "Paracetamol sales and atopic disease in children and adults": an ecological analysis. Eur Respir J 2000; 16: 817 -823.
-121-
Nugent JS et al." Determination of the incidence of sensitization after
penicillin skin testing." A A of Allergy, Asthma, and Immunology 2003; 90 (4): 398 – 403.
Nunn AJ Gregg I. New regression equations for predicting peak
expiratory flow in adults. BMJ. 1989; 298- 1068.
Odd et al. "Association between breast feeding and asthma in 6 year
old children": finding of a prospective birth cohort study, BMJ 1999;
319: 815–9.
Om Kon, BS Sihra, Ch Compton , et al Randomized, Dose – Ranging,
Placebo – Controlled Study Of Chimeric antibody to CD4 (Keliximab) in Chronic Severe Asthma. Lancet .1998; 352: 1109–
1113.
Omenaas E, Jentoft HF, Vollmer WM, Buist AS, Gulsvik A. Absence of
relationship between tuberculin reactivity and atopy in BCG vaccinated young adults. Thorax 2000; 55: 454-458.
Partridge,M, and Alwan, A. Prevention of Asthma and approaches for
enhanced care in the Eastern Mediterranean Region 1997; 3: 133
-143.
Peterson B, Saxon A: Global increases in allergic respiratory disease:
"the possible role of diesel exhaust particles". Ann Allergy Asthma
Immunol 1996; 77 (4): 263-68.
Picard et al: Rate and place of death from asthma among different
ethnic groups in Israel, shaare zedek medical center, Jerusalem,
Israel, 2002.
Picard et al."Rate and Place Of Death from asthma Among Different
-122-
Ethnic Group in Israel": National Trends 1998 to 1997, Jerusalem,
Israel.
Piipari R, Jaakkola J, Jaakkola N, Jaakkola M. smoking and asthma in
adults. Eur Respir J 2004; 24: 734–739.
Pornoy et al. "Stinging insect hypersensitivity": a practice parameter. J
Allergy Clin Immunol 1999; 103 (5 pt 1): 963–80.
Quanjer et al. Changes in peak expiratory flow in healthy subjects and
in patients with obstructive lung disease. Eur Respir J 1997; 10:
Supp24, 69s–71s.
Quanjer et al. Peak expiratory flow: conclusions and recommendations
of a Working Party of the European Respiratory Society. Eur
Respir J 1997; 10: Suppl. 24, 2s–8s.
Riedler, J. Fahrland, C. et al. "Exposure to farming in early life and
development of asthma and allergy": across – sectional survey
lancet, 2001; 358:1129-33.
Robertson et al: Asthma and other atopic disease in Australian
children, "Australian arm of the international study of Asthma and
allergy in childhood", MJA 1998; 168: 434-438.
Rona RJ. Asthma and poverty. Thorax 2000; 55: 239–244. at:.
www.unsco.org/.
Rosenstreich et al. The role of cockroach allergy and exposure to
cockroach allergen in causing morbidity among inner – city children with asthma. N Engl J Med 1997; 336: 135663.
Rumchev, K: Indoor environmental risk factor, for respiratory
symptoms and asthma in young children, BMI 2004; 89: 423- 426.
-123-
Salzano et al. "Allergic rhinoconjunctivitis: diagnosis and clinical
)الدموع استخدام التكييف) 12 تقلبات الطقس ) 13 استخدام األدوية) 14 فواكه -منتجات األلبان(األطعمة ) 15
)المعلبات -بيض -مجففة أطراف (بعض أنواع األنسجة ) 16
-130-
-ساعة اليد -مالبس السباحة-القميص
قفازات مطاطيةالدورة الشهرية و الحمل) 17 أوقات الصباح) 18 لدخان المتصاعد من عوادم ) 19
السياراتصبغة الشعر) 20 حشرات ،عفن) 21
4) أقرا األعراض اآلتية ثم أضع إشارة (×) في العمود األكثر توافقا مع حالتي الصحية:
األعراض حاد جدا حاد متوسط خفيف غير موجودسيالن من األنف. 1 عطاس.2 احمرار، حكة في العين.3 حكة في األنف.4 حكة في الحلق.5 حكة في األذن.6 نزف من األنف.7 صعوبة في التذوق والشم .8 صداع.9 غزارة الدموع.10 بلغم -+/قحة . 11
ضيق في التنفس.12 ضيق في التنفس يتبع ممارسة الرياضة.13 تضخم في الحلق.14 اختناق.15 تنفس مصحوب بزفير.16 ماء تحت الجلد.17
اقل من مرتين -3اكثر من مرتين أسبوعيا -2يومي -1 :أنت تعاني الربو بشكل) أ
متقطع - 4 أسبوعيا
)نعم ، ال( توقظك أعراض الربو من نومك ليال؟ ) ب
-3) في األسبوع 3-2( - 2) ليليا( -1 :بنعم ، فان ذلك يحدثإذا كانت اإلجابة السابقة ) ج
)اكثر من خمس مرات في الشهر( -4) خمس مرات في الشهر(
أدون عدد المرات التي اضطرتني إلى دخول المستشفى بسبب أعراض الربو في األشهر االثنا ) د
________عشر الماضية
) أقراص ،حقن(في األشهر االثناعشر الماضية نزوعدد المرات التي تناولت فيها كورتي)هـ
اكثر ( - 4) سبع مرات في الشهر( -3) في الشهر 3-2( - 2) في األسبوع 2-3( -1
)من سبع مرات في الشهر
من أيام الدوام الجامعي أو أيام العمل التي خسرتها بسبب أعراض الربو في األشهر االثنا ) و
مرات في ال 6-3( - 3) مرتين في الشهر( -2) مرة في الشهر( -1 :الماضية عشر ا
)اكثر من ست مرات في الشهر( -4) شهر
-132-
حسب ما ينطبق على حالتي الصحية في الوقت )نعم ، ال ( أقرا المشاكل الصحية اآلتية ثم أجيب بـ ) 8
:الحالي
نعم ال المشاكل الصحية نعم ال المشاكل الصحيةقرحة في المعدة. 11 مشاكل في القلب. 1 مشاكل في الغدة الدرقية. 12 سكري. 2 مشاكل في الجلد. 13 فقدان الوزن. 3 نوم متقطع. 14 نوم عميق. 4 ذبحة صدرية. 15 ارتفاع الكلسترول في الدم. 5 حصوة في الكلية. 16 زمن في القصبات التهاب م. 6
الهوائيةإسهال مزمن. 17 آالم في البطن مزمنة . 7 صداع نصفي. 18 زوائد لحمية في األنف. 8 فقر دم. 19 توتر نفسي. 9 ماء زرقاء في . 20
glaucomaالعين
لين عظام. 10
9) أضع دائرة حول المشاكل الصحية التي قد واجهتني في الزمن الماضي: