73
Statistics South Africa Prevalence of disability in South Africa CENSUS 2001

Statistics South Africa
Prevalence of disabilityin South Africa
CENSUS 2001

Statistics South AfricaPrivate Bag X44
Pretoria 0001South Africa
User information service: (012) 310 8600Fax: (012) 310 8500
Main switchboard: (012) 310 8911Fax: (012) 321 7381
Website: www.statssa.gov.zaEmail: [email protected]
170 Andries StreetPretoria 0002
Pali LehohlaStatistician-General
Statistics South Africa2005Report No. 03-02-44 (2001)
Prevalence of disabilityin South Africa
CENSUS 2001

Published by Statistics South Africa, Private Bag X44, Pretoria 0001
© Statistics South Africa, 2005
Users may apply or process this data, provided Statistics South Africa (Stats SA) is acknowledged as the original source of the data; that it is specified that the application and/or analysis is the result of the user's independent processing of the data; and that neither the basic data nor any reprocessed version or application thereof may be sold or offered for sale in any form whatsoever without prior permission from Stats SA.
Stats SA Library Cataloguing-in-Publication (CIP) DataPrevalence of disability in South Africa Census 2001 / Statistics South Africa. Pretoria: Statistics South Africa, 200572p. [Report No. 03-02-44]ISBN 0-621-35178-41. Population – Statistics 2. Disabled3. Household4. Economic development – South Africa5. Economic growth – South Africa6. Reconstruction and Development Programme (RDP)7. Socio Economic Development 8. Growth, Employment and Redistribution (GEAR)I. Statistics South Africa
(LCSH 16)
A complete set of Stats SA publications is available at Stats SA Library and the following libraries:National Library of South Africa, Pretoria Division National Library of South Africa, Cape Town DivisionLibrary of Parliament, Cape TownBloemfontein Public LibraryNatal Society Library, Pietermaritzburg Johannesburg Public LibraryEastern Cape Library Services, King William's TownCentral Regional Library, PolokwaneCentral Reference Library, NelspruitCentral Reference Collection, KimberleyCentral Reference Library, Mmabatho
This report is available on the Stats SA website: www.statssa.gov.za
Copies are available from: Printing and Distribution, Statistics South AfricaTel: (012) 310 8044
(012) 310 8161Fax: (012) 321 7381E-mail: [email protected]
List of tables ivList of figures vList of abbreviations vExecutive summary 1
Chapter 1: BackgroundIntroduction 5Prevalence of disability 6Information needs for policy formulation 6Objectives of the report 7Scope and limitations of the report 8Outline of the report 9
Chapter 2: Prevalence of disability: Levels and patternsIntroduction 11Levels and differentials 11Types of disability 13Summary 15
Chapter 3: Demographic and socio-economic profiles of disabled personsIntroduction 17Demographic profiles of disabled and non-disabled persons 17Socio-economic profiles of disabled and non-disabled persons 20Summary 22
Chapter 4: Access to basic servicesIntroduction 25Housing conditions 25Housing tenure status 27Access to piped water 29Access to electricity for lighting 30Access to schooling 31Summary 33
Chapter 5: ConclusionIntroduction 35Findings 35Implications 36
References 39
AppendicesAppendix 1: Number of disabled persons by age group, sex, population group, 41
level of education, employment status and provinceAppendix 2: Number of disabled persons by age group and type of disability,
South Africa 51Appendix 3: Number of disabled persons by population group, age group, and
type of disability 52Appendix 4: Number of households by gender of head of household, type of
housing unit, access to piped water and energy source for lighting 56
Contents
iii

Table 2.1: Number of disabled persons by sex and population group 12Table 2.2: Number of disabled persons by province and sex 12Table 2.3: Number of disabled persons by sex and age group 13Table 2.4: Percentage of people in each education category who were disabled 13Table 2.5: Percentage of disabled persons by type of disability 14Table 2.6: Proportion of disabled persons affected by specific disabilities 15Table 3.1: Percentage distribution of disabled and non-disabled persons by age
group 18Table 3.2: Percentage of disabled persons aged 20 years and above who had
no schooling by sex and population group 20Table 3.3: Percentage of disabled and non-disabled population that was employed
in each age group 21Table 3.4: Percentage of disabled and non-disabled persons aged 15-65 years
who were employed by province and sex 22Table 4.1: Percentage distribution of households by type of living quarters 26Table 4.2: Percentage distribution of households headed by disabled and non-
disabled persons by housing tenure status 27Table 4.3: Percentage distribution of households headed by disabled persons by
housing tenure status and province 28Table 4.4: Percentage distribution of households headed by non-disabled persons
by housing tenure status and province 29Table 4.5: Percentage of households which had access to piped water by province 30Table 4.6: Percentage of households which used electricity for lighting by province 30Table 4.7: Percentage of persons aged 5-24 years who were attending school 32
List of tables
iv
Figure 2.1: Percentage of disabled persons by type of disability 14Figure 2.2: Percentage of disabled persons affected by specific disabilities
by population group 15Figure 3.1: Percentage distribution of disabled and non-disabled persons by
age group 18Figure 3.2: Percentage distribution of disabled persons in each population group
by age group 19Figure 3.3: Sex ratios (males : 100 females) of disabled and non-disabled
persons by age group 19Figure 3.4: Percentage distribution of disabled persons by highest level of
education 20Figure 4.1: Percentage distribution of households by type of dwelling 26Figure 4.2: Percentage distribution of households headed by disabled and
non-disabled persons by housing tenure status 27Figure 4.3: Percentage distribution of households headed by disabled persons
by housing tenure status and province 28Figure 4.4: Percentage distribution of households headed by non-disabled
persons by housing tenure status and province 29Figure 4.5: Percentage of households which used electricity for lighting 31Figure 4.6: Percentage of disabled and non-disabled persons aged 5-24 years
who were attending school 32
CSS Central Statistical ServiceGEAR Growth, Employment and RedistributionINDS Integrated National Disability StrategyRDP Reconstruction and Development ProgrammeUN United NationsUNDP United Nations Development Programme
List of abbreviations
List of figures
v
Executive summary
Census 2001 was the second census to be carried out in a democratic South Africa to provide demographic and socio-economic data required to inform policy decision-making as well as ascertain the achievements made in the provision of basic services to the people. Data on disability were collected as part of this important endeavour. This report highlights the key findings on disability emanating from the analysis of these data.
Since 1994 the government has formulated various policies to address the inequities which were embedded in the policies pursued by the apartheid regime. The policies have focused on empowering previously disadvantaged groups including women, children and disabled persons. These policies are contained in various policy documents such as the Reconstruction and Development Programme (RDP), Growth, Employment and Redistribution (GEAR) and the Integrated National Disability Strategy (INDS). The need for relevant data and information on prevalence and experience of disability has increasingly grown as a result of the need to monitor and evaluate the impact of these policies.
The data collected in Census 2001 indicates that there were 2 255 982 people with various forms of disability. This number constituted 5% of the total population enumerated in this census. Of this number, 1 854 376 were African, 168 678 coloured, 41 235 Indian/Asian and 191 693 white. The number of females affected was 1 173 939, compared to 1 082 043 males.
The provincial prevalence levels show that the most affected province was Free State with a prevalence of 6,8% and the least affected Gauteng (3,8%). The prevalence increased by age from 2% in the age group 0-9 years to 27% in the age group 80 years and above. Those who had post-secondary education had the lowest prevalence (3%) compared to those who had no schooling (10,5%), primary level (5,2%) and secondary level of education (3,9%).
The prevalence of sight disability was the highest (32%) followed by physical disability (30%), hearing (20%), emotional disability (16%), intellectual disability (12%) and communication disability (7%).
A comparison of the demographic and socio-economic characteristics of disabled and non-disabled persons shows that disabled persons were on average older. About 30% of disabled people had no education while only 13% of the non-disabled population fell in this category. However, the most affected population group in this regard were Africans.
1

The findings with regard to access to basic services (housing, water and electricity for lighting) indicate that 53% of households headed by disabled persons lived in houses or brick structures – nearly the same as the percentage of households headed by non-disabled persons (56%). Asignificant proportion (37%) of households headed by disabled persons lived in traditional dwellings or huts and informal dwellings/ shacks. About 78% of households headed by disabled persons had access to piped water compared to 85% of those headed by non-disabled persons. As far as electricity for lighting is concerned 62% of households headed by disabled persons used this service.
The above findings provide useful information on the prevalence of disability in the country. Apparently, disabled persons are disadvantaged as far as access to educational and employment opportunities is concerned. The profiles by type of disability underscore the need to have preventive and rehabilitation programmes that target the most affected groups. These trends in the findings support other sources of data on the prevalence of and the experience of disability, such as the 1998 Baseline survey on disability (Schneider et al. 1999).
2

[Scroll down]
Chapter 1: Background

1.1 Introduction
Census 2001 was the second census to be carried out in the country since 1994 as part of government's commitment to ascertain the impact that various social and economic programmes have had on the lives of the population. It was carried out in October 2001 on a defacto basis (according to where people were on the night of the 9/10 October). Apart from collecting data on the population size, composition and distribution, this census solicited data on pertinent social and economic variables. Data on disability was included in the package.
The advent of democracy in 1994 was marked by conscious attempts to redress the socially engineered inequalities of the apartheid era. One of the paramount objectives of the democratic government has been the enshrinement of fundamental human rights of all South African citizens. Various policies and programmes aimed at empowering previously disadvantaged groups, including women, children and disabled persons, have been put in place as part of the overall socio-economic development strategy as reflected in the Reconstruction and Development Programme (RDP) and the Growth, Employment and Redistribution (GEAR) strategies of the government.
A number of major population issues have been raised as areas of concern. These population issues have been identified as limiting the attainment of the above development objectives. They also constitute obstacles to improving the quality of life of the disadvantaged groups. One such disadvantaged group is that of disabled persons. However, the progress that has been made to date has been uneven. One of the reasons for this is the limited, or at worst irrelevant range and availability of statistics and other information for input into social policy decisions regarding disabled persons. Another reason is the fact that disability issues have always been viewed within a health and welfare framework. This has led to the failure to integrate disability into mainstream government statistical processes as highlighted in the Integrated National Disability Strategy (INDS) 1997. This strategy paper presents a blueprint for government national departments to integrate the needs of the disabled into their policies, procedures, practices and programmes.
The INDS emphasises the attainment of a good and equitable quality of life for disabled persons in the country. Its main objectives reflect two main pillars. One pillar is the systematic integration of disabled persons into all policies, plans, programmes and strategies aimed at enhancing the quality of life of all disabled persons at all levels, within all sectors and institutions of government. The other is a coordinated, multi-sectoral, interdisciplinary and
5
integrated approach in designing and implementing programmes and interventions that affect major national population concerns. These two pillars need to be reliable and informed by up-to-date information on the status and prevalence of disability in the country.
In the wake of South Africa's democracy and as the need arose to understand the prevalence of disability in the country, some useful statistics from the United Nations Development Programme (UNDP) and the Central Statistical Service (CSS) provided some insights into the problem.While the UNDP estimated that in 1990, 5,2% of the world's population was experiencing moderate to severe disability, for South Africa the figure stood at approximately 5% in 1995.
Although the INDS paper has brought with it an increased awareness of the need to monitor the situation of persons with disabilities, little is known about the nature, determinants and prevalence of disability in the country. The data collected in the 1996 census indicated that 6,7% of the population was disabled. In the 1998 baseline national survey on disability the data provided an age-weighted count of 5,9% of the population as being disabled. The data collected in Census 2001 provided another opportunity to ascertain the number of disabled persons, their demographic and socio-economic characteristics and their access to basic services.
According to the United Nations (2002), more than half a billion people worldwide are disabled as a result of mental, physical or sensory impairment. Approximately 80% of these disabled persons live in developing countries. Disabled persons more often than not suffer from discrimination because of prejudice or ignorance, and may also lack access to essential services. The 'silent crisis', as the United Nations refers to it, affects not only disabled persons themselves and their households, but also the economic and social development of entire societies where a significant reservoir of human potential often goes untapped.
As is the case in many sub-Saharan African countries, South Africa is beginning to recognise the rehabilitation needs and civil rights of persons with disabilities, the impact of impairment, activity limitations and participation restrictions as well as the resulting disadvantage they experience on national indicators of health, education and economic prosperity. Information needs range from basic counts of persons with disabilities in the population to information on more complex issues such as the difference in the quality of life between persons with and without disabilities.
Debates among key stakeholders on issues of disability have increasingly noted the lack of sufficient and accurate data on disability. The unreliability of statistics is due to a number of factors. These include different definitions of disability, different survey methodologies used to collect information, negative traditional attitudes towards people with disabilities, a poor service infrastructure for persons with disabilities in underdeveloped areas, and violence levels (in particular areas and at particular times) – all these have impeded the collection of data, thereby affecting the overall picture.
In recent decades, the collection of data and the production of statistical information on topics relevant to disability have proliferated. Although, in many instances, the information produced fails to meet the needs of policy-makers due to the absence of common terminology or standard
1.2 Prevalence of disability
1.3 Information needs for policy formulation
6

procedures and guidelines, more often than not the most basic question commonly asked is: How many persons with disabilities are there in the population? Once this basic question is answered, a host of additional questions arise:
• What types of disabilities do persons in the population have and what is the prevalence of each type?
• How does prevalence of disability vary by age, gender and geographic area?
• How many persons with disabilities are without access to the special appliances or aids that they need?
• What percentage of school-going-age children with disabilities are in school?
• What percentage of adults with disabilities is economically active? How does this compare with the percentage for non-disabled adults or the general population?
• How many people with disabilities receive social services and how many require full-time care from a family member or some other person?
• Can persons with disabilities use public transport available to the general public? If not, what are the reasons that they cannot?
• What are the major barriers in the social and physical environment that create exclusion for persons with disabilities?
These questions highlight the increasing need for statistics on disability to support effective policy formulation, programming and implementation. This report utilises the information collected in Census 2001 to provide answers to some of these questions.
There is still a dearth of information on the nature, prevalence and more importantly the profile of persons with disabilities in the country. The lack of reliable information impacts negatively on the planning for the provision of services to disabled persons in the country as well as the creation of an enabling environment for the equalisation of opportunities.
1.4 Objectives of the report
7

The report focuses on the number of persons who were affected by type of disability, age, sex, province and population group. It also provides insights into the socio-economic profile of disabled persons with respect to their level of education, labour force participation and access to basic amenities and services. It is hoped that the findings emanating from the above analyses will provide input into the achievement of the objectives of the INDS paper.
This report is limited by a number of factors. Claims have often been made to the effect that the inclusion of a question on disability in a census questionnaire is not effective due, in part, to the negative connotations and stigma attached to disability. Such a topic is best dealt with by professional interviewers in the less rushed context of a survey.
Firstly, census data do not, therefore, provide the government with an accurate assessment of the prevalence of disability, making targeted intervention virtually impossible. Notwithstanding this assertion, this report attempts to close this statistical information gap.
Secondly, the definition of disability varies. No international consensus has been reached on the definition of disability. One of the reasons for the failure to integrate disability into mainstream government statistical processes is the fact that statistics on the prevalence of disability tend to be unreliable. People who have an interest in issues pertaining to disability have for some time now struggled with the issue of defining disability. Policy-makers and service providers are usually quick to point out not only the advantages, but in fact the necessity, of categorising disabled persons into clearly defined groups for the purposes of service delivery, education, social security and employment equity.
In the case of South Africa, the question posed in Census 2001 on disability differed considerably from the question posed in Census 1996. The categories were not identical, and moreover the Census 2001 question had the added dimension of “full participation in life activities”, which expands the concept of 'disabled' from a narrow focus on impairment to a broader focus on human functioning in a social context.
In 1996, the question on disability was posed thus:
Does the person have a serious sight, hearing, physical or mental disability? If yes, circle all applicable disabilities for the person: Sight 1; Hearing/Speech 2; Physical disability 3; Mental disability 4.
In comparison, the disability question posed in 2001 read thus:
Does the person have any serious disability that prevents his/her full participation in life activities? None 0; Sight 1; Hearing 2; Communication 3; Physical 4; Intellectual 5; Emotional 6.
The discrepancy in the way the questions were posed to respondents in the two censuses makes it difficult to have comparable figures.
The prevalence of disability in the country needs to be reviewed within the context of the fact that in a number of cases, it is suspected that disability as a condition was not noted during the count for a variety of reasons. These reasons could include a misunderstanding by respondents (or even enumerators) on what disability means in terms of the various types. This issue remains a complex one and is compounded by a number of factors some of which are not as yet clearly determined.
1.5 Scope and limitations of the report
8
1.6 Outline of the report
This report has five chapters.
Chapter one provides background information on the importance of having accurate and relevant data on disability.
Chapter two presents a broad overview of the prevalence of disability in terms of the number of persons affected as well as the types of disabilities.
Chapter three presents the demographic and socio-economic characteristics of disabled persons. To this end, it examines if and to what extent demographic characteristics of persons with disabilities differ from those without.
Chapter four focuses on the access that disabled persons have to basic services.
Chapter five highlights the key findings and points to pertinent policy implications.
9
Chapter 2: Prevalence of disability: Levels and patterns

2.1 Introduction
2.2 Levels and differentials
This chapter focuses on the prevalence of disability in terms of persons affected and types of disabilities. Household members were asked whether or not they had any serious disability that prevented them from engaging in “full participation in life activities”. The types of disabilities covered were sight, hearing, communication, physical, intellectual and emotional. The question did not include a list of examples of what life activities include or do not include, although this was in the enumerator's training manual.
The data referred to in all tables in this report can be found in the appendices at the end.
Note: It is also important to note that all PES-adjusted numbers are rounded to whole numbers. The totals displayed may therefore differ slightly from the sum of the separate numbers.
During Census 2001, a total of 2 255 982 persons reported that they had some kind of disability that prevented them from full participation in life activities. This number constituted 5% of the total population (44 819 778) enumerated in the census.
The African population reported the highest number of disabled people (1 854 376 or 5,2% out of a total of 35 416 166), followed by white (191 693 or 4,5%), coloured (168 678 or 4,2%) and Indian (41 235 or 3,7%) people as shown in Table 2.1. These percentage differences are probably due to a variety of socio-economic and demographic factors, as well as unique social cultural perceptions and inhibitions with regard to reporting on disability.
It is important to recognize that even within the disabled community, there are sectors that experience discrimination and exclusion more acutely than others. Women with disabilities bear the brunt of discrimination and exclusion more acutely than men and tend to have a higher rate
2.2.1 Prevalence at national level
2.2.2 Prevalence by population group
2.2.3 Prevalence by gender
11

of disability than men, due primarily to women's higher average longevity. The information collected in the 2001 census followed this trend, with 1 173 939 females affected compared to 1 082 043 males. The percentage of females affected was slightly higher than for males in the African and white population groups and slightly lower in the coloured and Indian/Asian population groups, as shown in Table 2.1.
Table 2.1: Number of disabled persons by gender and population group
2.2.4 Prevalence by province
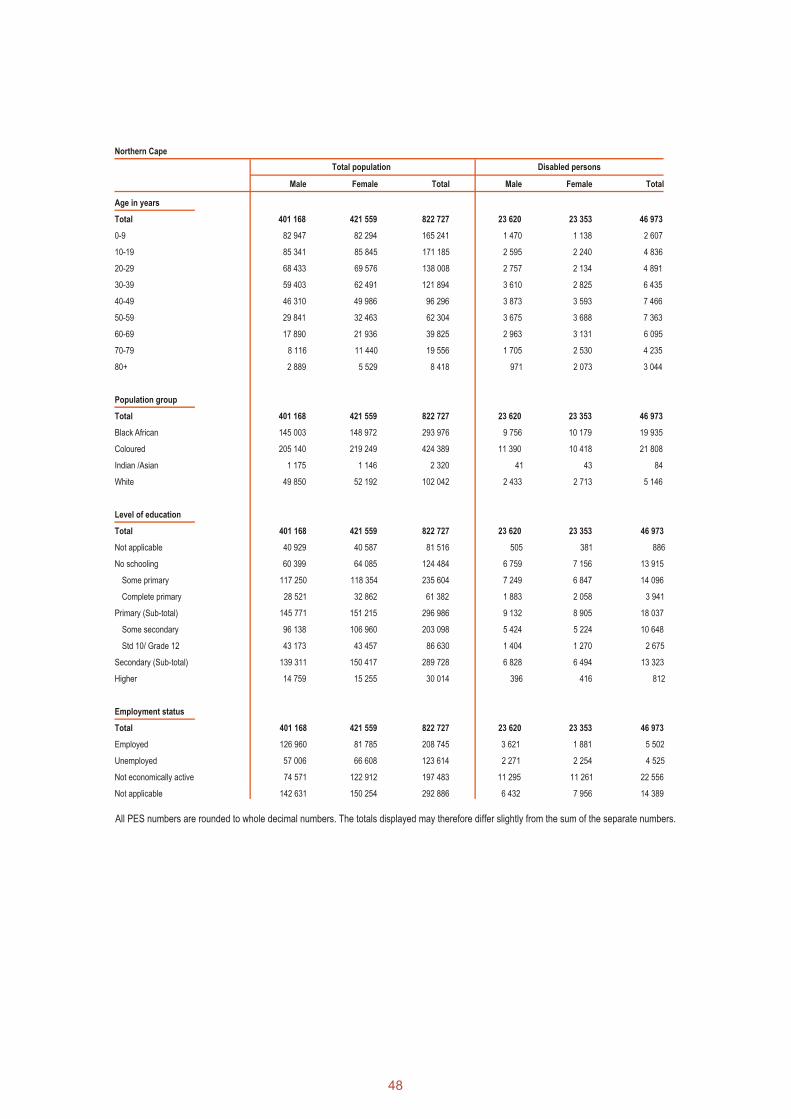
Table 2.2 gives the number of disabled persons by province. It shows that KwaZulu-Natal had the highest number (470 588) while Northern Cape had the lowest number (46 973). In terms of prevalence, Free State had the highest percentage (6,8%). The provinces with the lowest prevalence of disability were Western Cape at 4,1% and Gauteng at 3,8%.
Table 2.2: Number of disabled persons by province and sex
2.2.5 Prevalence by age
The age profile of the disabled population shown in Table 2.3 indicates that 2% of persons aged 0-9 years were reported as disabled. This percentage increased steadily among those aged less than 40 years and increased rapidly thereafter. There were no significant differences between females and males. However, there were variations and similarities in the prevalence of disability among different age groups.
12
%NPopulationgroup
AfricanColouredIndian/AsianWhiteTotal
Male
879 68088 58321 55092 230
1 082 043
Female
974 69680 09519 68599 463
1 173 939
Total
1 854 376168 67841 235
191 6932 255 982
Male
5,24,64,04,45,1
Female
5,33,93,54,55,0
Total
5,24,23,74,55,0
Male Total Male Female TotalFemale
%N
Province
Western CapeEastern CapeNorthern CapeFree StateKwaZulu-NatalNorth WestGautengMpumalangaLimpopoSouth Africa
96 549173 229
23 62087 758
219 685105 169164 588
87 319124 128
1 082 043
90 301 199 037
23 35397 619
250 903106 054167 023
94 874144 774
1 173 939
186 850372 266
46 973185 377470 588211 223331 611182 193268 902
2 255 982
4,45,85,96,85,05,83,75,85,25,1
3,95,85,56,95,05,73,85,85,05,0
4,15,85,76,85,05,83,85,85,15,0

Age group(years)
N %
0-910-1920-2930-3940-4950-5960-6970-7980+South Africa
Male
101 838156 980149 422165 153165 871142 602102 81562 39634 966
1 082 043
Female
88 822148 755134 806145 787168 727155 928138 168111 57881 368
1 173 939
Male
2,23,23,75,47,5
10,813,716,925,65,05
Female
1,92,93,24,36,7
10,312,517,727,95,0
Total
2,13,03,54,97,1
10,513,017,427,25,0
Total
190 660305 735284 228310 940334 598298 530240 983173 974116 334
2 255 982
Table 2.3: Number of disabled persons by sex and age group
2.2.6 Prevalence by level of education
The percentage of disabled persons was highest among those who had no education (10,5%) and lowest among those with higher levels of education, as shown in Table 2.4. This could be a reflection of the fact that disabled persons were often excluded from educational opportunities, as the environment in regular schools does not facilitate integration. Another possible explanation is that low levels of education are generally associated with prevalence of poverty, which in turn renders people more vulnerable to become impaired because of factors such as lack of access to healthcare and rehabilitation. Hence the higher prevalence of disabilities in the group with no education could be as a result of both lack of access to educational opportunities and poverty.
Table 2.4: Percentage of people in each education category who were disabled
Level of education Male Female Total
None 10,7 10,4 10,5Primary 5,3 5,2 5,2Secondary 4,1 3,8 3,9Higher 3,1 2,9 3,0Other 1,7 1,5 1,6
2.3 Types of disability
This section presents the profile of disabled persons by specific disabilities (including those with multiple disabilities). Each type of disability has a unique impact on an individual's ability to perform certain activities. Hence it is of paramount importance to ascertain the prevalence of the various disabilities at national level and by population group, gender and age.
2.3.1 National picture
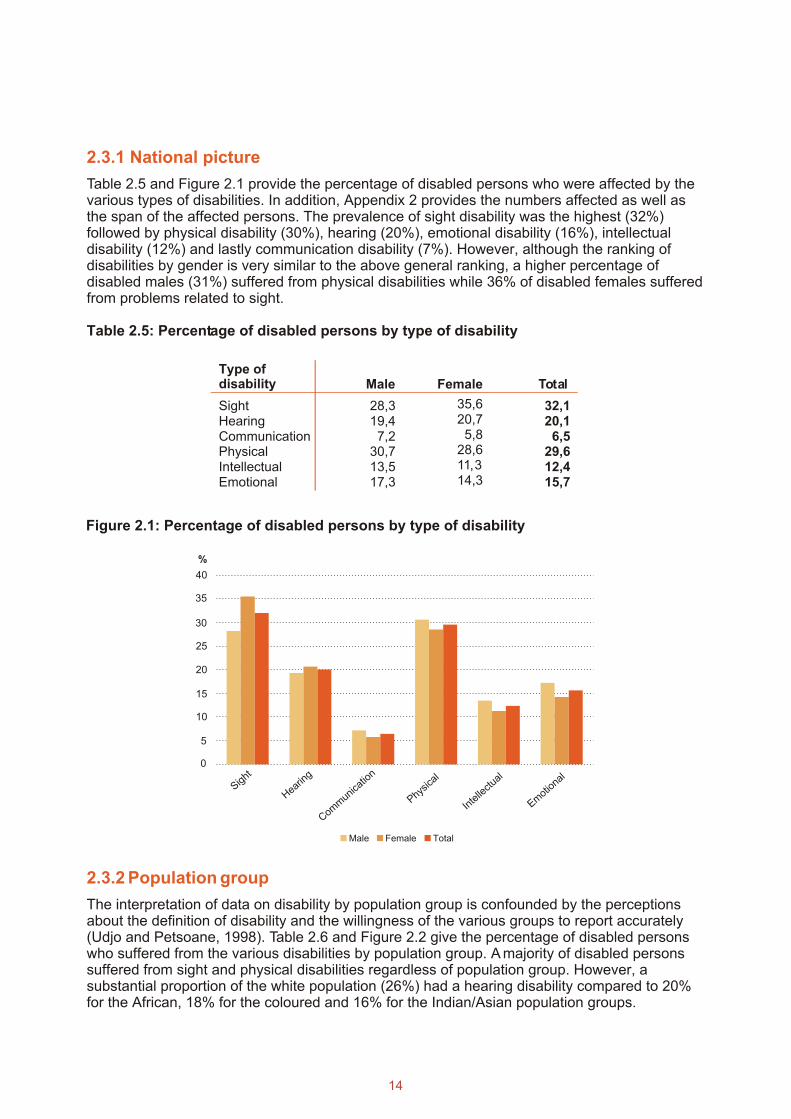
Table 2.5 and Figure 2.1 provide the percentage of disabled persons who were affected by the various types of disabilities. In addition, Appendix 2 provides the numbers affected as well as the span of the affected persons. The prevalence of sight disability was the highest (32%) followed by physical disability (30%), hearing (20%), emotional disability (16%), intellectual disability (12%) and lastly communication disability (7%). However, although the ranking of disabilities by gender is very similar to the above general ranking, a higher percentage of disabled males (31%) suffered from physical disabilities while 36% of disabled females suffered from problems related to sight.
Table 2.5: Percentage of disabled persons by type of disability
Type of disability Male Total
Sight 28,3 32,1Hearing 19,4 20,1Communication 7,2 6,5Physical 30,7 29,6Intellectual 13,5 12,4Emotional 17,3
Female
35,620,75,8
28,611,314,3 15,7
Figure 2.1: Percentage of disabled persons by type of disability
0
5
10
15
20
25
30
35
40
Male Female Total
Sight
Hea
ring
Com
mun
icat
ion
Physica
l
Inte
llect
ual
Emot
iona
l
%
2.3.2 Population group
The interpretation of data on disability by population group is confounded by the perceptions about the definition of disability and the willingness of the various groups to report accurately (Udjo and Petsoane, 1998). Table 2.6 and Figure 2.2 give the percentage of disabled persons who suffered from the various disabilities by population group. A majority of disabled persons suffered from sight and physical disabilities regardless of population group. However, a substantial proportion of the white population (26%) had a hearing disability compared to 20% for the African, 18% for the coloured and 16% for the Indian/Asian population groups.
14

Table 2.6: Percentage of disabled persons affected by specific disabilities by population group
Figure 2.2: Percentage of disabled persons affected by specific disabilities by population group
0
5
10
15
20
25
30
35
40
Black African Coloured Indian/Asian White
Sight
Hea
ring
Com
mun
icat
ion
Physica
l
Inte
llect
ual
Emot
iona
l
%
Type ofdisability African
Indian/Asian White
Sight 33,8 27,4 23,6Hearing 19,7 16,2 26,1Communication 6,0 7,6 8,7Physical 28,0 36,1 37,0Intellectual 11,5 13,9 17,6Emotional 15,7
Coloured
24,218,28,4
37,915,3
18,2 15,4 14,1
2.4 Summary
The results presented in this chapter show that 5% of the population enumerated in Census 2001 were disabled. Africans had the highest prevalence (5,2%) while Indians/Asians had the lowest (3,7%). Free State had the highest prevalence (6,8%) and Gauteng the lowest (3,8%). The prevalence by age indicates an upward trend from the youngest to the oldest age groups. Most of the disabled persons suffered from sight and physical disabilities. However, caution should be applied in interpreting these results, as these two types of disabilities are the most visible and easily identifiable among the different types reported, and so might have higher prevalence rates for this reason.
15
Chapter 3: Demographic and socio-economic
profiles of disabled persons
Chapter 3: Demographic and socio-economic
profiles of disabled persons

3.1 Introduction
3.2 Demographic profiles of disabled and non-disabled persons
In spite of the fact that attention has been appropriately drawn to the need to put into place structures, policies and strategies that promote the social inclusion of disabled persons, minimal success has been achieved. The INDS takes note of the fact that the majority of persons with disabilities in South Africa have been excluded from the mainstream of society and have thus been prevented from accessing fundamental social, political and economic rights.
The exclusion experienced by disabled persons and their families is the result of a range of diverse demographic, economic and social factors. The key forms of exclusion responsible for their disadvantage are poverty, social isolation and the fact that a high number of them are unemployed.
This chapter briefly outlines some of the key differences between disabled and non-disabled persons. Although these differences do not adequately present the extent of exclusion, they do provide some sense of the unique characteristics of disabled persons, which explain their disadvantaged position in society.
The age distributions of disabled and non-disabled persons are shown in Table 3.1 and Figure 3.1. There are striking differences at the younger ages (below 30 years) where 63% of non-disabled persons belong in this age range compared to 35% of disabled persons. This in itself implies that a higher proportion of disabled persons are older. Of the non-disabled population, only 12% were 50 years or older, while 37% of the disabled were in this age category.
3.2.1 Age distribution
17
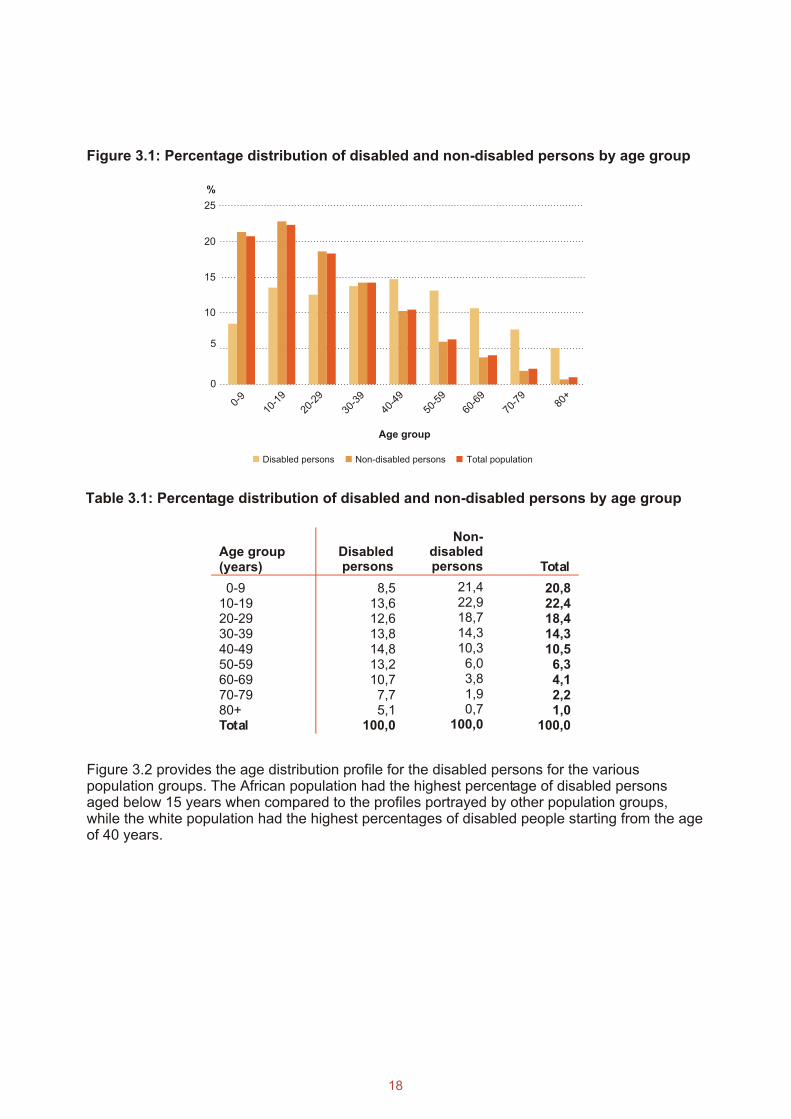
Figure 3.1: Percentage distribution of disabled and non-disabled persons by age group
Disabled persons Non-disabled persons Total population
0
5
10
20
25
15
0-9
10-1
9
30-3
9
40-4
9
50-5
9
60-6
9
70-7
980
+
20-2
9
%
Age group
Table 3.1: Percentage distribution of disabled and non-disabled persons by age group
Age group (years)
8,513,612,613,814,813,210,77,75,1
100,0
Disabled persons
0-910-1920-2930-3940-4950-5960-6970-7980+Total
21,422,918,714,310,36,03,81,90,7
100,0
Total
20,822,418,414,310,56,34,12,21,0
100,0
Non-disabledpersons
Figure 3.2 provides the age distribution profile for the disabled persons for the various population groups. The African population had the highest percentage of disabled persons aged below 15 years when compared to the profiles portrayed by other population groups, while the white population had the highest percentages of disabled people starting from the age of 40 years.
18
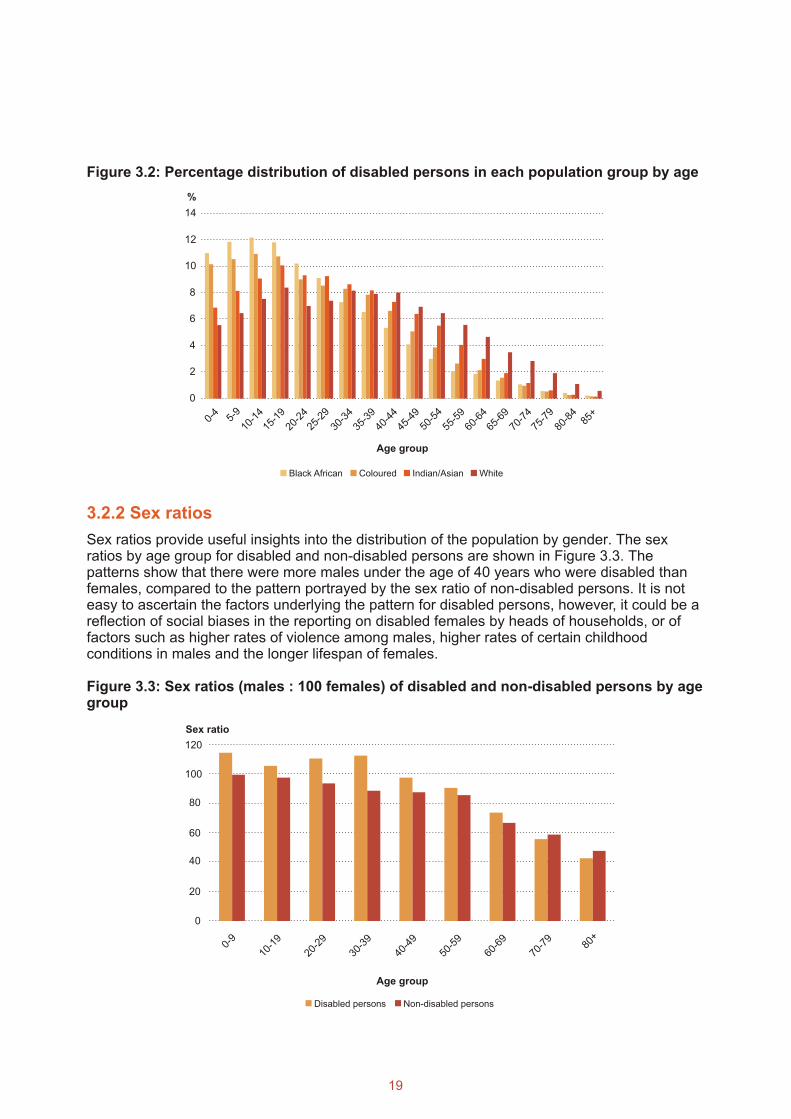
3.2.2 Sex ratios
Sex ratios provide useful insights into the distribution of the population by gender. The sex ratios by age group for disabled and non-disabled persons are shown in Figure 3.3. The patterns show that there were more males under the age of 40 years who were disabled than females, compared to the pattern portrayed by the sex ratio of non-disabled persons. It is not easy to ascertain the factors underlying the pattern for disabled persons, however, it could be a reflection of social biases in the reporting on disabled females by heads of households, or of factors such as higher rates of violence among males, higher rates of certain childhood conditions in males and the longer lifespan of females.
Figure 3.3: Sex ratios (males : 100 females) of disabled and non-disabled persons by age group
0
20
40
60
80
100
120
0-9
10-1
9
20-2
9
30-3
9
40-4
9
50-5
9
60-6
9
70-7
980
+
Age group
Disabled persons Non-disabled persons
Sex ratio
Figure 3.2: Percentage distribution of disabled persons in each population group by age
0
2
4
6
8
10
12
14
Age group
Black African Coloured Indian/Asian White
0-4
5-9
10-1
4
15-1
9
20-2
4
25-2
9
30-3
4
35-3
9
40-4
4
45-4
9
50-5
4
55-5
9
60-6
4
65-6
9
70-7
4
75-7
9
80-8
485
+
%
19
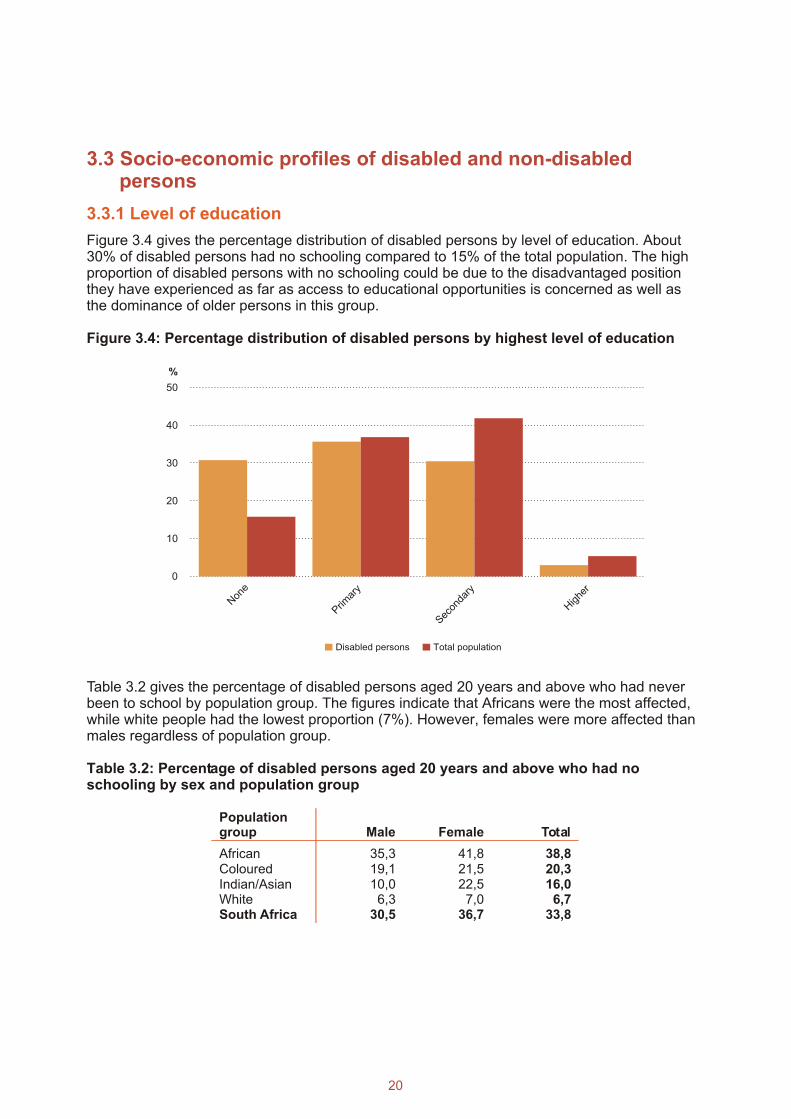
Table 3.2 gives the percentage of disabled persons aged 20 years and above who had never been to school by population group. The figures indicate that Africans were the most affected, while white people had the lowest proportion (7%). However, females were more affected than males regardless of population group.
Table 3.2: Percentage of disabled persons aged 20 years and above who had no schooling by sex and population group
3.3 Socio-economic profiles of disabled and non-disabled persons
3.3.1 Level of education
Figure 3.4 gives the percentage distribution of disabled persons by level of education. About 30% of disabled persons had no schooling compared to 15% of the total population. The high proportion of disabled persons with no schooling could be due to the disadvantaged position they have experienced as far as access to educational opportunities is concerned as well as the dominance of older persons in this group.
Figure 3.4: Percentage distribution of disabled persons by highest level of education
Populationgroup Male Female Total
African 35,3 41,8 38,8Coloured 19,1 21,5 20,3Indian/Asian 10,0 22,5 16,0White 6,3 7,0 6,7South Africa 30,5 36,7 33,8
0
10
20
30
40
50
%
Disabled persons Total population
Non
e
Prim
ary
Sec
onda
ry
Highe
r
20
3.3.2 Employment status
All persons aged 10 years and above were asked whether they had done any work for pay (incash or in kind), profit or family gain for one hour or more in the seven days prior to 10 October 2001. The information availed by the respondents in this regard facilitated the categorisation of the respondents into employed and unemployed persons. This section focuses on persons aged 15 to 65 years.
Table 3.3 gives the percentage of disabled and non-disabled persons who were employed in 2001. The figures show that only about 19% of disabled persons were employed compared to 35% of non-disabled persons. Persons aged between 35 and 44 years for both groups reported the highest percentage of the employed. The disadvantaged position of disabled persons could be due to diverse socio-economic and social cultural factors, particularly their low levels of education, discrimination in the labour market and negative attitudes of those they live amongst. These low levels of employment for the disabled population underscore their continued marginalisation and lack of independence within society.
Table 3.3: Percentage of disabled and non-disabled population that was employed in each age group
15-19
20-24
25-29
30-34
35-39
40-44
45-49
50-54
55-59
60-65
Total
2,5
12,5
21,0
25,2
25,9
25,7
24,8
21,2
16,6
8,7
18,6
3,9
22,0
39,6
49,0
52,2
53,5
51,7
46,8
37,9
19,3
34,6
3,9
21,7
38,9
47,9
50,8
51,7
49,5
44,3
35,5
18,0
33,7
Age group
(years)
Disabled persons Total
Non-disabledpersons
21

Table 3.4 shows the profile at provincial level. It shows that the percentage of disabled persons who were employed was relatively low in all provinces compared to that of non-disabled persons.
Table 3.4: Percentage of disabled and non-disabled persons aged 15-65 years who were employed by province and sex
Disabled person Non-disabled persons Total
Province Male Female Male Female Male Female
Western Cape 28,4 22,7 57,2 42,4 55,8 41,6
Eastern Cape 9,6 8,0 25,3 18,0 24,1 17,4
Northern Cape 21,1 12,2 51,1 31,2 49,1 30,1
Free State 28,7 18,5 42,9 26,9 41,8 26,3
KwaZulu-Natal 17,6 12,9 35,1 23,1 34,1 22,6
North West 22,9 11,6 43,0 22,5 41,7 21,9
Gauteng 30,9 24,1 53,2 37,9 52,3 37,4
Mpumalanga 29,3 16,5 44,5 24,0 43,4 23,5
Limpopo 17,9 12,8 30,2 17,7 29,5 17,5
South Africa 22,0 15,2 42,5 27,0 41,3 26,8
Not only are disabled persons less likely to be employed than non-disabled persons, but within the disabled population women are consistently less likely to be employed. This is possibly a reflection of the double disadvantage which faces disabled women – being disabled and female.
The findings documented in this chapter underscore striking demographic and socio-economic differences between disabled persons and non-disabled persons. Disabled persons were generally older, had a higher percentage of persons with no education and a lower percentage of employed persons than those who were not disabled. Furthermore, disabled women experience the disadvantage of being disabled as well as being female, which results in their lower rates of employment.
3.4 Summary
22

[Scroll down]
Chapter 4: Access to basic services
4.1 Introduction
4.2 Housing conditions
The provision of basic services to the public, particularly disadvantaged groups, has been at the cornerstone of the government's policy as one of the means of improving the standard of living of the people (Policy Co-ordination and Advisory Services, The Presidency, October, 2003) in order to address the appalling conditions inherited from the apartheid regime. The data collected in Census 2001 provided a snapshot of the level of achievement of this policy objective.
The results presented in this chapter are mainly based on 11 205 705 households which exclude households which were enumerated in collective quarters. A total of 894 299 households (455 040 headed by males and 439 259 headed by females) out of 11 205 705 were headed by disabled persons, representing about 8% of all the households.
The main objective of this chapter is to highlight how well households headed by disabled persons have fared in comparison with other households in terms of access to quality housing, potable water, electricity and education.
Heads of households were asked to provide information on the following key indicators:
• Type of dwelling or housing unit; and• Type of tenure.
About 53% of the households headed by disabled persons lived in permanent houses (house or brick structure) compared to 56% of households headed by non-disabled persons as shown in Table 4.1. However, a significant proportion of households headed by disabled persons (22%) lived in traditional types of dwellings/ huts or structures made of traditional materials.
25
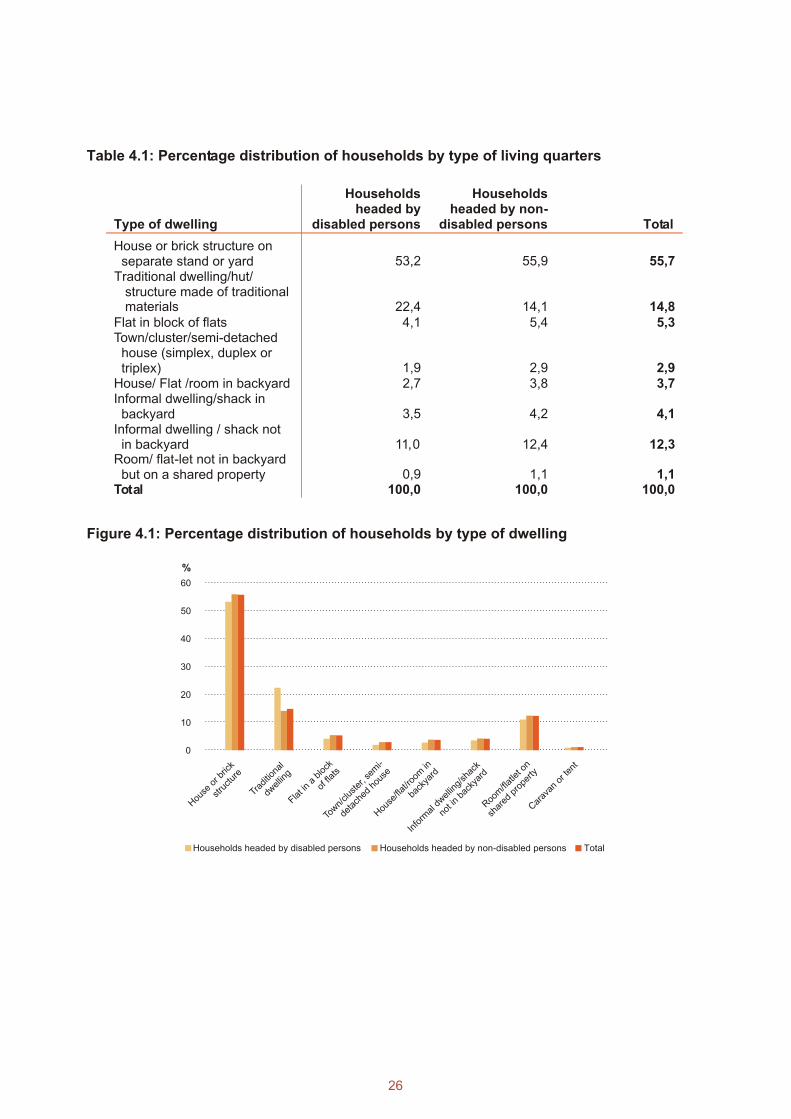
Table 4.1: Percentage distribution of households by type of living quarters
Type of dwelling
Householdsheaded by
disabled persons
Householdsheaded by non-
disabled persons Total
House or brick structure on separate stand or yard 53,2 55,9 55,7
Traditional dwelling/hut/ structure made of traditional materials 22,4 14,1 14,8
Flat in block of flats 4,1 5,4 5,3Town/cluster/semi-detached
house (simplex, duplex or triplex) 1,9 2,9 2,9
House/ Flat /room in backyard 2,7 3,8 3,7Informal dwelling/shack in
backyard 3,5 4,2 4,1Informal dwelling / shack not
in backyard 11,0 12,4 12,3Room/ flat-let not in backyard
but on a shared property 0,9 1,1 1,1Total 100,0 100,0 100,0
Figure 4.1: Percentage distribution of households by type of dwelling
20
30
40
50
60
0
10
TotalHouseholds headed by non-disabled persons
Info
rmal
dwel
ling/
shac
k
not
in b
acky
ard
Hou
se o
r brick
stru
ctur
e
Trad
ition
al
dwel
ling
Flat i
n a
bloc
k
offla
ts
Roo
m/fl
atle
t on
shar
ed p
rope
rty
Car
avan
or te
nt
Town/
clus
ter,
sem
i-
deta
ched
hou
se
Hou
se/fl
at/ro
om in
back
yard
%
Households headed by disabled persons
26

4.3 Housing tenure status
The situation as far as tenure status is concerned was favourable for households headed by disabled persons. About 48% of disabled heads of households owned the houses they lived in, compared to 41% of households headed by non-disabled people.
Another 28% of households headed by disabled people lived in rent-free houses followed by nearly 14% which resided in rented houses, as shown in Table 4.2 and Figure 4.2.
Table 4.2: Percentage distribution of households headed by disabled and non-disabled persons by housing tenure status
Tenure status
Householdsheaded by
disabled persons
Householdsheaded by non-
disabled persons Total
Owned and fully paid off
Owned but not yet paid off
RentedOccupied rent-free
48,3
9,913,628,3
40,7
15,519,224,7
41,3
15,018,725,0
Figure 4.2: Percentage distribution of households headed by disabled and non-disabled persons by housing tenure status
%
0
10
20
30
40
50
Owne
dan
d
fully
paid
for
Owne
dbu
t not
yet p
aid
off
Ren
ted
Occ
upied
rent
-free
TotalHouseholds headed by non-disabled persons Households headed by disabled persons
27

Figure 4.3: Percentage distribution of households headed by disabled persons by housing tenure status and province
Tables 4.3 and 4.4 give the provincial profiles for households headed by disabled and non-disabled persons respectively. The figures portray a similar pattern nationally and provincially except in Gauteng and Western Cape where a significant proportion (25%) of households headed by disabled persons lived in rented houses. A higher proportion of disabled heads of households in Eastern Cape (34%), Limpopo (36%) and KwaZulu-Natal (30%) lived in rent-free houses when compared to those in similar tenure status nationally (28%). These could be houses built by households from their own resources.
Table 4.3: Percentage distribution of households headed by disabled persons by housing tenure status and province
Province RentedOccupiedrent-free Total
Western Cape 39,2 17,7 25,1 17,9 100,0Eastern Cape 50,1 7,6 8,1 34,2 100,0Northern Cape 53,3 12,0 13,6 21,1 100,0Free State 49,5 10,7 14,7 25,0 100,0KwaZulu-Natal 46,7 9,0 14,1 30,2 100,0North West 59,2 5,7 8,6 26,4 100,0Gauteng 35,4 17,4 25,1 22,0 100,0Mpumalanga 51,9 7,0 12,5 28,6 100,0Limpopo 56,4 4,6 3,4 35,6 100,0South Africa 48,3 9,9 13,6 28,3 100,0
Owned but not yet
paid off
Ownedand fullypaid off
0
50
60
70
40
Nor
ther
n Cap
e
Eas
tern
Cap
e
South
Afric
a
Wes
tern
Cap
e
Free
State
KwaZ
ulu-
Nat
al
Nor
th W
est
Gau
teng
Mpu
malan
ga
Lim
popo
Owned and fully paid off Owned but not yet paid off Rented Occupied rent-free
10
20
30
%
28

Table 4.4: Percentage distribution of households headed by non-disabled persons by housing tenure status and province
Province
Ownedand fullypaid off Rented
Occupiedrent-free Total
Western Cape 32,7 24,6 24.2 18,5 100,0Eastern Cape 47,0 10,7 12,4 30,0 100,0Northern Cape 42,6 13,9 17,8 25,6 100,0Free State 42,6 13,5 17,0 26,8 100,0KwaZulu-Natal 42,6 13,8 18,8 24,8 100,0North West 50,7 9,0 16,2 24,1 100,0Gauteng 27,3 23,8 29,1 19,8 100,0Mpumalanga 46,7 10,8 16,0 26,5 100,0Limpopo 55,8 5,3 5,6 33,4 100,0South Africa 40,7 15,5 19,2 24,7 100,0
Owned but not yet
paid off
0
10
20
30
40
50
60
%
Nor
ther
n Cap
e
Eas
tern
Cap
e
South
Afric
a
Wes
tern
Cap
e
Free
State
KwaZ
ulu-
Nat
al
Nor
th W
est
Gau
teng
Mpu
malan
ga
Lim
popo
Owned and fully paid off Owned but not yet paid off Rented Occupied rent-free
Figure 4.4: Percentage distribution of households headed by non-disabled persons by housing tenure status and province
4.4 Access to piped water
The percentage of households headed by disabled persons, in each province, that had access to piped water, is presented in Table 4.5. The table shows that about 78% of the households headed by disabled persons had access to piped water compared to 85% of those headed by non-disabled persons. The most disadvantaged households, with regard to access to piped water, were those found in Eastern Cape and KwaZulu-Natal.
29
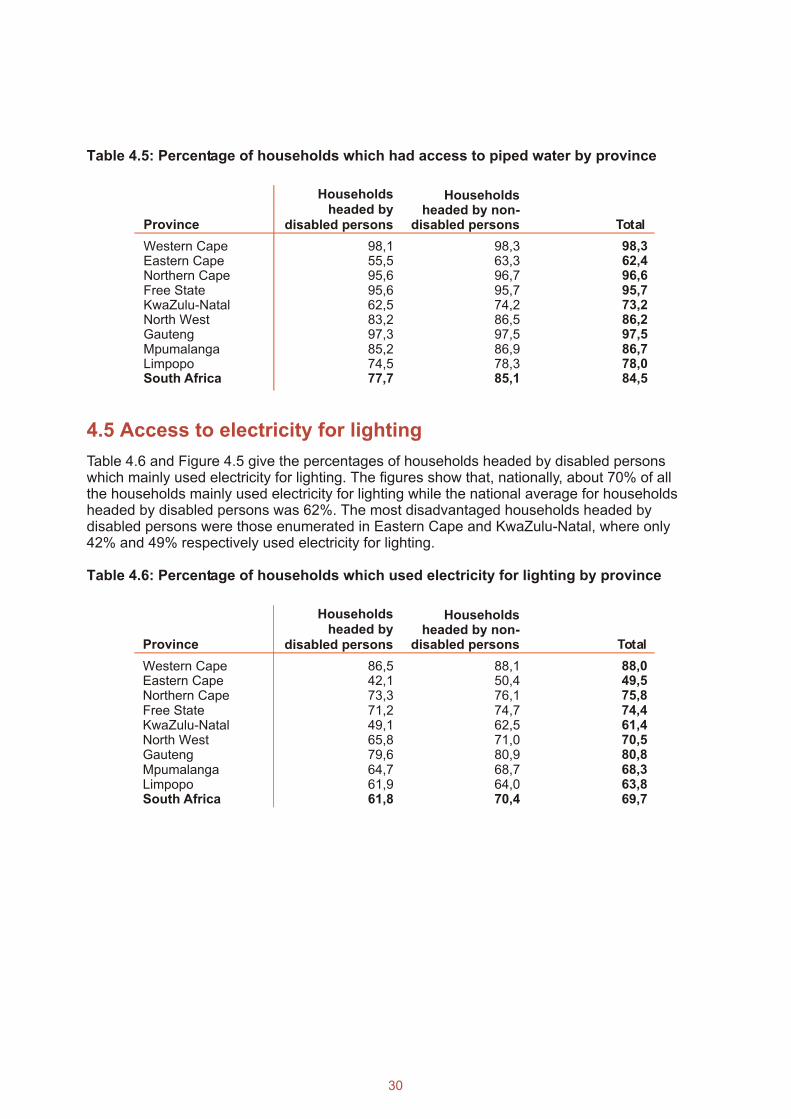
4.5 Access to electricity for lighting
Table 4.6 and Figure 4.5 give the percentages of households headed by disabled persons which mainly used electricity for lighting. The figures show that, nationally, about 70% of all the households mainly used electricity for lighting while the national average for households headed by disabled persons was 62%. The most disadvantaged households headed by disabled persons were those enumerated in Eastern Cape and KwaZulu-Natal, where only 42% and 49% respectively used electricity for lighting.
Table 4.6: Percentage of households which used electricity for lighting by province
Table 4.5: Percentage of households which had access to piped water by province
Province
Householdsheaded by
disabled persons Total
Western Cape 98,1 98,3 98,3Eastern Cape 55,5 63,3 62,4Northern Cape 95,6 96,7 96,6Free State 95,6 95,7 95,7KwaZulu-Natal 62,5 74,2 73,2North West 83,2 86,5 86,2Gauteng 97,3 97,5 97,5Mpumalanga 85,2 86,9 86,7Limpopo 74,5 78,3 78,0South Africa 77,7 85,1 84,5
Householdsheaded by non-
disabled persons
Western CapeEastern CapeNorthern CapeFree StateKwaZulu-NatalNorth WestGautengMpumalangaLimpopoSouth Africa
86,542,173,371,249,165,879,664,761,961,8
88,150,476,174,762,571,080,968,764,070,4
88,049,575,874,461,470,580,868,363,869,7
Province
Householdsheaded by
disabled persons
Householdsheaded by non-
disabled persons Total
30
0
20
40
60
80
100
%
North
ern
Cape
Easte
rn C
ape
South A
frica
Wes
tern
Cap
e
Free
State
KwaZulu
-Nat
al
North
Wes
t
Gaute
ng
Mpu
mala
nga
Limpo
po
TotalHouseholds headed by non-disabled persons Households headed by disabled persons
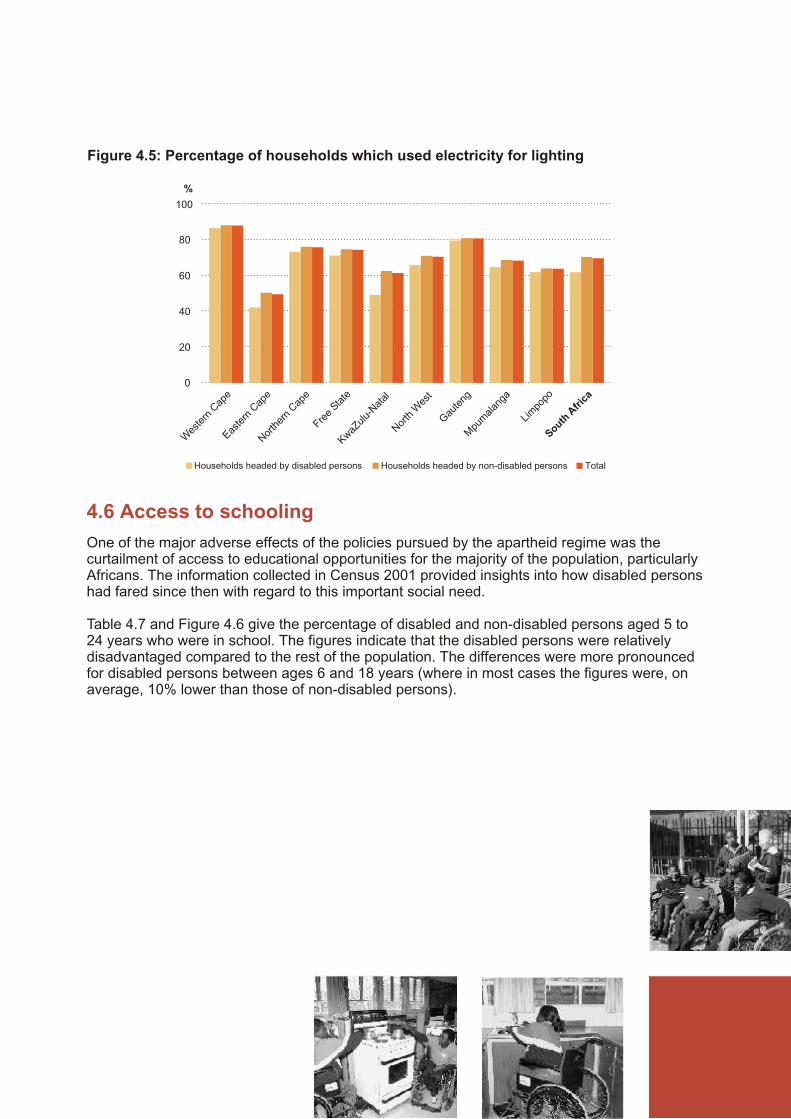
Figure 4.5: Percentage of households which used electricity for lighting
4.6 Access to schoolingOne of the major adverse effects of the policies pursued by the apartheid regime was the curtailment of access to educational opportunities for the majority of the population, particularly Africans. The information collected in Census 2001 provided insights into how disabled persons had fared since then with regard to this important social need.
Table 4.7 and Figure 4.6 give the percentage of disabled and non-disabled persons aged 5 to 24 years who were in school. The figures indicate that the disabled persons were relatively disadvantaged compared to the rest of the population. The differences were more pronounced for disabled persons between ages 6 and 18 years (where in most cases the figures were, on average, 10% lower than those of non-disabled persons).

Age (years)Disabledpersons
Non-disabledpersons Total
5 45,7 45,66 70,6 70,37 88,7 88,48 93,7 93,49 94,9 96,610 94,6 94,411 95,0 94,812 96,0 95,713 95,4 95,114 94,3 94,015 91,6 91,316 87,8 87,417 81,8 81,518 71,0 70,719 58,1 57,920 46,4 46,221 35,8 35,722 25,6 25,523 18,9 18,824
38,960,576,982,684,885,285,986,185,884,581,577,872,361,351,441,732,623,417,713,8 14,1 14,0
Table 4.7: Percentage of persons aged 5-24 years who were attending school
Figure 4.6: Percentage of disabled and non-diabled persons aged 5-24 years who were attending school
32
0
20
40
60
80
100
5 6 7 8 9 10 11 12 13 14 15 16 17 18 19 20 21 22 23 24
Disabled persons Non-disabled persons Total population
%

4.7 Summary
This chapter has highlighted the living conditions of households headed by disabled persons. Although 53% of these households resided in permanent houses (house or brick structure), about 37% lived in traditional dwellings/ huts and informal dwellings/ shacks. About 48% of the households owned their houses while 14% lived in rented houses. A majority of the households had access to piped water.
Nationally, about 62% of households headed by disabled persons used electricity for lighting compared to 70% of households headed by non-disabled persons. While the above figures do not differ much from those portrayed for households headed by non-disabled persons, caution should be applied as it could be that households headed by disabled persons, with additional disabled household members, may not have the same experiences as those also headed by disabled persons but with no additional disabled persons. Further analysis of the similarities and differences between these two types of households with disabled members could possibly provide some explanation for the results presented in this chapter.
33
Chapter 5: Conclusion

5.1 Introduction
5.2 Findings
The main objective of this report was to ascertain the number of disabled persons, the type of disabilities they suffered from, their demographic and socio-economic profiles and their access to basic services. The report has highlighted the major policies the government has formulated to improve the lives of disabled persons and other disadvantaged population groups. This chapter highlights the key findings and issues that need to be addressed to further improve the welfare of disabled persons.
A total of 2 255 982 persons were reported to be disabled in Census 2001. This number should be taken as the lower bound due to the way the question was posed to respondents. Apparently disabled persons who were able to carry out normal activities regardless of their disability might have been excluded.
The above figure constituted 5% of the total population enumerated in the census. The prevalence differed by population group, age and province. Africans had the highest disability prevalence (5,3%) while the Indians/Asians had the lowest (3,5%). Also, the prevalence increased by age. A majority of the disabled persons suffered from physical and sight disabilities. However these should be interpreted with caution because of the issue of the high visibility and easy identification of these impairments compared to other disabilities.
The comparison between disabled and non-disabled persons with regard to age, education attainment and employment indicates that disabled persons were generally older, a significant percentage (30%) had no schooling and about 18% were employed, compared to 35% for the rest of the population.
Although 53% of the households headed by disabled persons lived in houses, about 37% lived in traditional dwellings/ huts and informal dwellings/ shacks. A majority of the households had access to piped water. About 62% of the households headed by disabled person used electricity for lighting compared to 70% of households headed by non-disabled persons. The low learner to teacher ratio of disabled persons (as shown by the low school attendance rates which are lower than non-disabled learners) should not be equated with the notion that disabled people are receiving adequate or quality education.
35
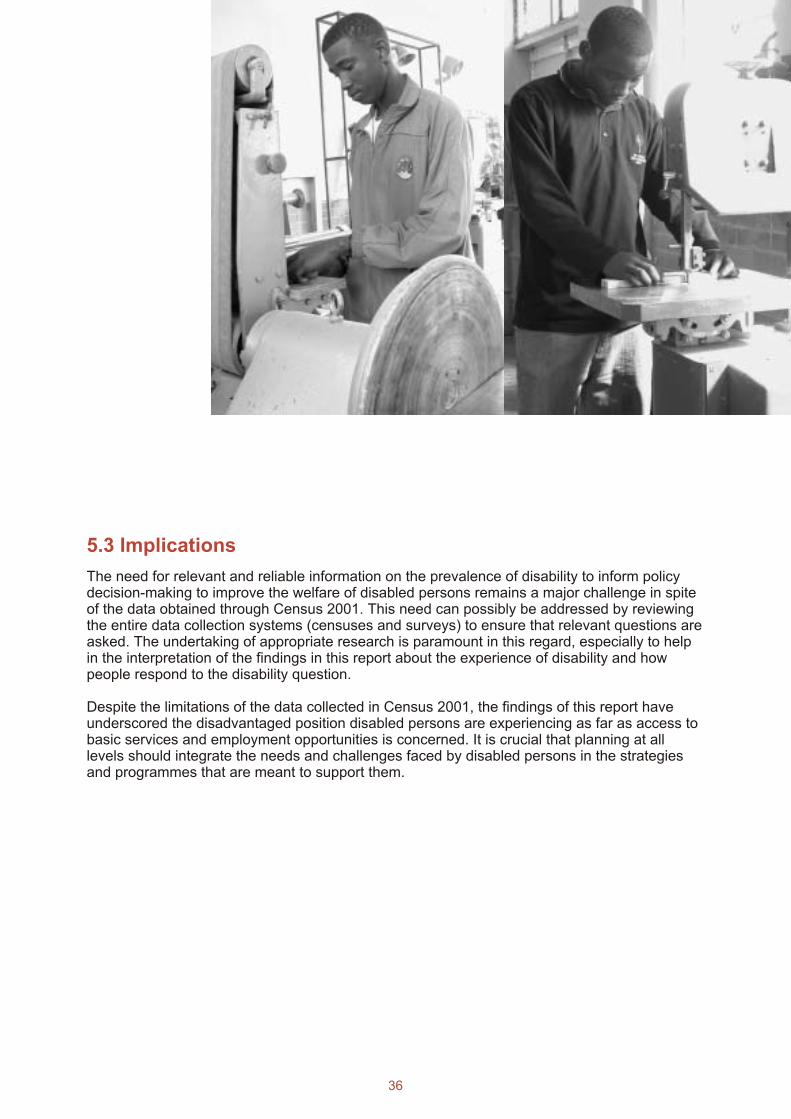
5.3 Implications
The need for relevant and reliable information on the prevalence of disability to inform policy decision-making to improve the welfare of disabled persons remains a major challenge in spite of the data obtained through Census 2001. This need can possibly be addressed by reviewing the entire data collection systems (censuses and surveys) to ensure that relevant questions are asked. The undertaking of appropriate research is paramount in this regard, especially to help in the interpretation of the findings in this report about the experience of disability and how people respond to the disability question.
Despite the limitations of the data collected in Census 2001, the findings of this report have underscored the disadvantaged position disabled persons are experiencing as far as access to basic services and employment opportunities is concerned. It is crucial that planning at all levels should integrate the needs and challenges faced by disabled persons in the strategies and programmes that are meant to support them.
36
[Scroll down]

References
Central Statistical Service (Statistics South Africa). 1995 October Household Survey, Pretoria, 1995.
Policy Co-ordination and Advisory Services, The Presidency. Towards a Ten Year Review: Synthesis Report on Implementation of Government Programmes, Government of South Africa, 2003.
Office of the Deputy President. White Paper on an Integrated National Disability Strategy,Government of South Africa, Pretoria, 1997.
Schneider, M. et al. We also count! The Extent of Moderate and Severe reported Disability and the Nature of the Disability Experience in South Africa, CASE Report prepared for the Department of Health, Pretoria, 1999.
Research Dynamics. Situational Analysis of Disability Integration in 18 National Government Departments, Pretoria, 2000.
Statistics South Africa, Census 2001: How the count was done, Pretoria, 2003.
Udjo, EO and Petsoane, L. Living in Free State: Selected findings of the 1995 October Household Survey, Central Statistical Service (Statistics South Africa), Pretoria, 1998.
United Nations. The UN and Persons with Disabilities, New York, 2003.
39
Appendices
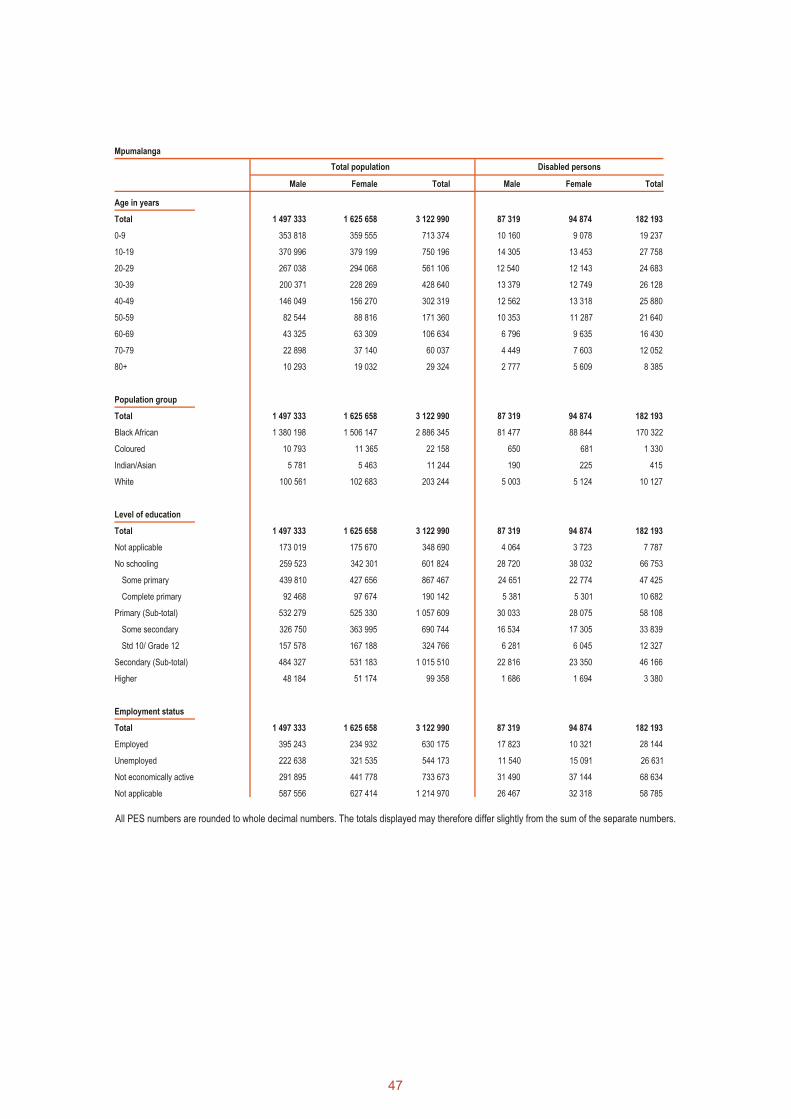
South Africa
Age in years
Male Female Total Male Female Total
Total 21 434 040 23 385 737 44 819 778 1 082 043 1 173 939 2 255 982
0-9 4 649 535 4 653 836 9 303 370 101 838 88 822 190 659
10-19 4 972 035 5 071 603 10 043 638 156 980 148 755 305 736
20-29 3 998 418 4 231 044 8 229 462 149 422 134 806 284 228
30-39 3 035 995 3 376 676 6 412 671 165 153 145 787 310 940
40-49 2 201 236 2 505 609 4 706 845 165 871 168 727 334 598
50-59 1 321 822 1 521 464 2 843 286 142 602 155 928 298 530
60-69 749 273 1 103 947 1 853 220 102 815 138 168 240 983
70-79 368 984 630 023 999 006 62 396 111 578 173 975
80+ 136 742 291 536 428 278 34 966 81 368 116 334
Population group
Total 21 434 040 23 385 737 44 819 778 1 082 043 1 173 939 2 255 982
Black African 16 887 830 18 528 336 35 416 166 879 680 974 696 1 854 376
Coloured 1 920 426 2 074 079 3 994 505 88 583 80 095 168 678
Indian/Asian 545 050 570 417 1 115 467 21 550 19 685 41 235
White 2 080 734 2 212 905 4 293 640 92 230 99 463 191 693
Employment status
Total 21 434 040 23 385 737 44 819 778 1 082 043 1 173 939 2 255 982
Employed 5 586 300 3 997 462 9 583 762 169 685 116 863 286 548
Unemployed 3 762 037 4 595 435 8 357 472 147 377 166 405 313 782
Not economically active 4 181 535 6 304 357 10 485 893 455 773 486 430 942 204
Not applicable 7 904 168 8 488 483 16 392 651 309 208 404 240 713 448
Level of education
Total 21 434 040 23 385 737 44 819 778 1 082 043 1 173 939 2 255 982
Not applicable 2 223 731 2 226 085 4 449 816 37 837 33 485 71 321
No schooling 2 757 391 3 632 264 6 389 654 294 161 378 128 672 288
Some primary 6 086 032 5 998 317 12 084 349 320 020 308 670 628 690
Complete primary 1 331 387 1 478 445 2 809 832 72 633 78 824 151 457
Primary (Sub-total) 7 417 419 7 476 762 14 894 182 392 652 387 494 780 146
Some secondary 5 269 484 6 006 602 11 276 086 241 107 259 222 500 329
Std 10/ Grade 12 2 716 725 2 904 859 5 621 584 83 704 82 851 166 555
Secondary (Sub-total) 7 986 210 8 911 460 16 897 670 324 811 342 073 666 884
Higher 1 049 290 1 139 166 2 188 456 32 582 32 759 65 342
Total population
All PES numbers are rounded to whole decimal numbers. The totals displayed may therefore differ slightly from the sum of the separate numbers.
Disabled persons
Appendix 1: Number of disabled persons by age group, sex, population group, level of education, employment status and province
41

Level of education
Total
Not applicable
No schooling
Some primary
Complete primary
Primary (Sub-total)
Some secondary
Std 10/ Grade 12
Secondary (Sub-total)
Higher
Eastern Cape
Total population
Age in years
Male Female Total Male Female Total
Total 2 975 512 3 461 251 6 436 763 173 229 199 037 372 266
0-9 745 295 736 329 1 481 625 13 024 11 398 24 422
10-19 844 503 855 373 1 699 876 23 304 22 593 45 896
20-29 448 010 517 469 965 479 20 368 18 228 38 596
30-39 303 315 409 104 712 419 23 943 20 554 44 496
40-49 251 808 347 131 598 939 27 371 29 056 56 427
50-59 166 448 220 882 387 330 24 498 28 305 52 802
60-69 125 599 209 360 334 959 20 977 30 367 51 345
70-79 66 561 114 888 181 448 12 935 23 224 36 159
80+ 23 973 50 715 74 687 6 809 15 312 22 122
Population group
Total 2 975 512 3 461 251 6 436 763 173 229 199 037 372 266
Black African 2 589 196 3 045 883 5 635 079 155 018 180 790 295 808
Coloured 229 889 248 917 478 807 11 069 10 467 21 536
Indian /Asian 9 315 9 057 18 372 308 280 589
White 147 112 157 394 304 506 6 833 7 500 14 333
2 975 512 3 461 251 6 436 763 173 229 199 037 372 266
331 137 326 987 658 124 4 173 3 654 7 827
441 288 601 401 1 042 689 55 709 71 478 127 187
1 097 957 1 067 880 2 165 837 59 944 57 529 117 473
187 077 238 685 425 763 12 030 15 112 27 141
1 285 034 1 306 565 2 591 599 71 974 72 640 144 614
610 187 826 352 1 436 539 31 484 39 368 70 852
222 176 277 751 499 927 7 237 8 012 15 249
832 363 1 104 103 1 936 466 38 721 47 380 86 101
85 691 122 194 207 885 2 651 3 885 6 535
Employment status
Total 2 975 512 3 461 251 6 436 763 173 229 199 037 372 266
Employment 399 206 355 131 754 338 11 679 10 236 21 915
Unemployed 544 466 627 412 1 171 878 23 515 23 148 46 662
Not economically active 710 638 1 060 839 1 771 476 86 839 93 924 180 763
Not applicable 1 321 202 1 417 870 2 739 072 51 195 71 730 122 925
Disabled persons
All PES numbers are rounded to whole decimal numbers. The totals displayed may therefore differ slightly from the sum of the separate numbers.
42

Level of education
Total
Not applicable
No schooling
Some primary
Complete primary
Primary (Sub-total)
Some secondary
Std 10/ Grade 12
Secondary (Sub-total)
Higher
Free State
Age in years
Male Female Total Male Female Total
Total 1 297 605 1 409 170 2 706 775 87 758 97 619 185 377
0-9 264 298 263 421 527 719 7 698 6 588 14 286
10-19 303 235 305 201 608 436 12 350 12 409 24 759
20-29 231 588 254 124 485 712 11 822 11 450 23 272
30-39 190 791 212 289 403 080 13 875 12 649 26 524
40-49 144 414 156 920 301 334 13 944 14 443 28 387
50-59 86 474 96 236 182 710 12 116 13 325 25 440
60-69 47 171 67 175 114 346 8 506 11 487 19 993
70-79 21 520 35 029 56 550 4 765 8 524 13 289
80+ 8 115 18 775 26 889 2 681 6 744 9 426
Population group
Total 1 297 605 1 409 170 2 706 775 87 758 97 619 185 377
Black African 1 140 329 1 240 743 2 381 073 78 932 88 297 167 229
Coloured 40 856 42 337 83 193 2 534 2 421 4 955
Indian /Asian 2 064 1 654 3 719 63 40 103
White 114 355 124 436 238 791 6 229 6 861 13 090
1 297 605 1 409 170 2 706 775 87 758 97 619 185 377
126 686 126 606 253 291 2 945 2 631 5 576
160 778 192 280 353 058 21 482 26 335 47 816
405 019 414 899 819 918 28 703 30 299 59 002
91 136 103 248 194 384 6 329 7 303 13 633
496 155 518 147 1 014 302 35 032 37 603 72 635
321 609 367 908 689 517 19 836 22 613 42 449
144 550 151 188 295 738 6 390 6 332 12 723
466 160 519 096 985 255 26 226 28 946 55 172
47 827 53 042 100 869 2 072 2 105 4 177
Employment status
Total 1 297 605 1 409 170 2 706 775 87 758 97 619 185 376
Employed 349 737 241 265 591 002 18 225 12 088 30 313
Unemployed 222 497 311 667 534 164 12 231 16 344 28 574
Not economically active 264 491 363 038 627 529 32 972 36 905 69 877
Not applicable 460 880 493 201 954 081 24 330 32 282 56 612
Total population Disabled persons
All PES numbers are rounded to whole decimal numbers. The totals displayed may therefore differ slightly from the sum of the separate numbers.
43

Level of education
Total
Not applicable
No schooling
Some primary
Complete primary
Primary (Sub-total)
Some secondary
Std 10/ Grade 12
Secondary (Sub-total)
Higher
Gauteng
Age in years
Male Female Total Male Female Total
Total 4 444 679 4 392 499 8 837 178 164 588 167 023 331 611
0-9 699 195 704 907 1 404 102 12 229 10 151 22 380
10-19 706 843 728 246 1 435 089 19 325 17 876 37 201
20-29 1 058 884 963 323 2 022 207 26 259 20 847 47 106
30-39 857 353 793 492 1 650 846 28 240 23 161 51 401
40-49 578 631 569 529 1 148 160 27 576 26 666 54 242
50-59 314 622 317 629 632 251 22 692 23 831 46 522
60-69 144 672 179 690 324 361 14 581 18 150 32 731
70-79 62 175 93 417 155 592 8 552 14 528 23 080
80+ 22 305 42 266 64 571 5 135 11 814 16 950
Population group
Total 4 444 679 4 392 499 8 837 178 164 588 167 023 331 611
Black African 3 319 698 3 203 094 6 522 792 122 598 122 117 244 714
Coloured 162 591 175 382 337 974 5 345 4 996 10 340
Indian /Asian 108 559 109 456 218 015 3 908 4 076 7 984
White 853 830 904 568 1 758 398 32 737 35 836 68 573
4 444 679 4 392 499 8 837 178 164 588 167 023 331 611
361 816 363 980 725 796 4 621 3 922 8 542
378 039 389 581 767 620 27 590 30 359 57 949
872 045 808 173 1 680 218 39 005 36 708 75 713
247 611 241 883 489 493 11 156 12 067 23 224
1 119 655 1 050 056 2 169 712 50 161 48 776 98 937
1 283 271 1 328 445 2 611 716 50 224 53 517 103 741
910 897 881 034 1 791 930 22 158 21 381 43 539
2 194 168 2 209 478 4 403 647 72 382 74 898 147 279
391 000 379 404 770 404 9 835 9 069 18 904
Employment status
Total 4 444 679 4 392 499 8 837 178 164 588 167 023 331 611
Employed 1 717 080 1 177 697 2 894 777 38 631 27 898 66 529
Unemployed 896 000 1 017 359 1 913 359 25 977 28 636 54 613
Not economically active 668 537 955 381 1 623 918 60 255 59 032 119 287
Not applicable 1 163 062 1 242 063 2 405 125 39 725 51 457 91 182
Total population Disabled persons
All PES numbers are rounded to whole decimal numbers. The totals displayed may therefore differ slightly from the sum of the separate numbers.
44

Level of education
Total
Not applicable
No schooling
Some primary
Complete primary
Primary (Sub-total)
Some secondary
Std 10/ Grade 12
Secondary (Sub-total)
Higher
KwaZulu-Natal
Age in years
Male Female Total Male Female Total
Total 4 409 091 5 016 925 9 426 017 219 685 250 903 470 588
0-9 1 063 830 1 065 832 2 129 661 25 866 23 202 49 068
10-19 1 120 730 1 147 087 2 267 817 36 505 35 230 71 735
20-29 802 990 893 056 1 696 046 32 408 30 860 63 268
30-39 544 516 674 385 1 218 901 33 022 31 699 64 721
40-49 392 791 494 539 887 330 31 343 34 573 65 915
50-59 254 091 319 714 573 804 27 194 32 399 59 593
60-69 138 852 231 488 370 340 18 111 28 120 46 231
70-79 67 885 136 395 204 280 10 325 22 143 32 468
80+ 23 407 54 430 77 837 4 912 12 677 17 589
Population group
Total 4 409 091 5 016 925 9 426 017 219 685 250 903 470 588
Black African 3 720 800 4 281 607 8 002 407 190 059 223 122 413 182
Coloured 67 149 74 738 141 887 2 721 2 500 5 221
Indian /Asian 385 803 412 472 798 275 15 956 14 103 30 059
White 235 339 248 108 483 448 10 948 11 178 22 126
4 409 091 5 016 925 9 426 017 219 685 250 903 470 588
505 646 507 003 1 012 650 10 018 8 964 18 983
631 855 907 420 1 539 275 64 899 89 843 154 742
1 281 520 1 344 258 2 625 777 63 788 68 016 131 804
259 056 295 971 555 072 13 233 14 319 27 552
1 540 576 1 640 228 3 180 804 77 022 82 335 159 356
1 046 383 1 196 879 2 243 262 46 066 48 016 94 082
518 470 575 126 1 093 596 16 240 16 331 32 571
1 564 853 1 772 006 3 336 859 62 306 64 346 126 653
166 161 190 269 356 430 5 439 5 415 10 855
Employment status
Total 4 409 091 5 016 925 9 426 017 219 685 250 903 470 588
Employed 900 189 702 081 1 602 270 27 238 21 302 48 540
Unemployed 833 612 1 002 640 1 836 253 34 210 38 390 72 600
Not economically active 909 674 1 407 084 2 316 757 93 433 105 875 199 308
Not applicable 1 765 617 1 905 120 3 670 737 64 803 85 336 150 139
Total population Disabled persons
All PES numbers are rounded to whole decimal numbers. The totals displayed may therefore differ slightly from the sum of the separate numbers.
45
Level of education
Total
Not applicable
No schooling
Some primary
Complete primary
Primary (Sub-total)
Some secondary
Std 10/ Grade 12
Secondary (Sub-total)
Higher
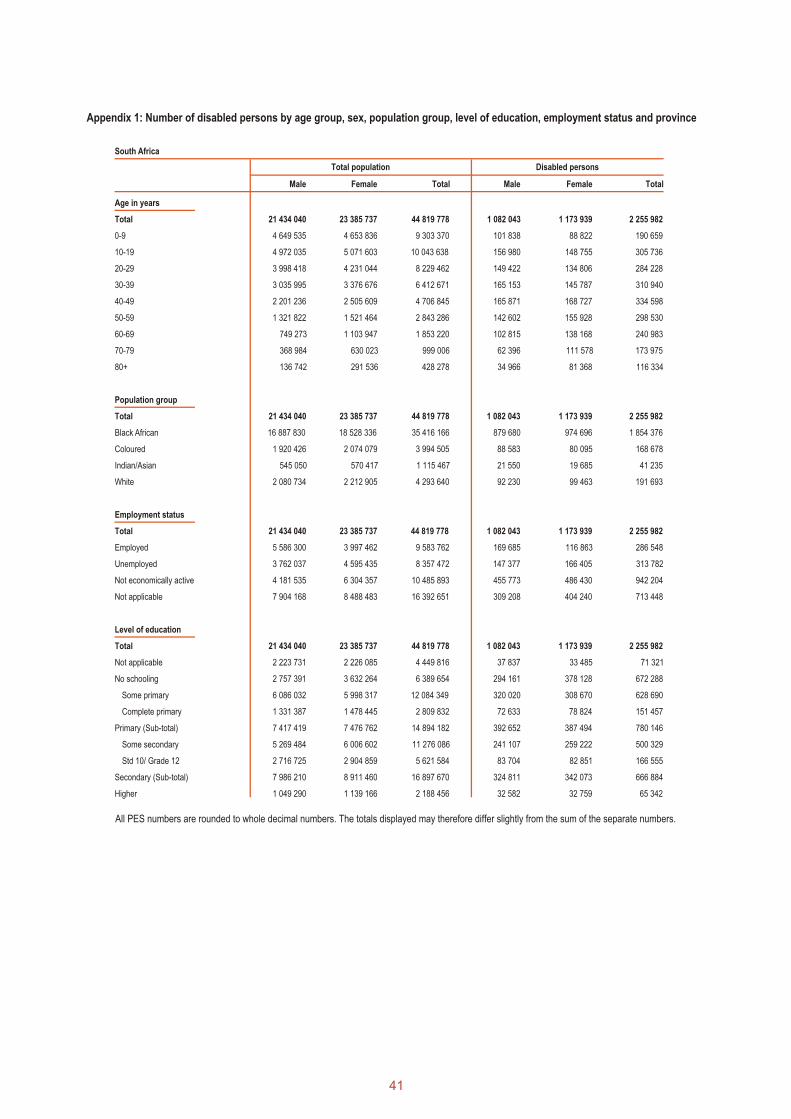
Limpopo
Age in years
Male Female Total Male Female Total
Total 2 394 785 2 878 857 5 273 642 124 128 144 774 268 902
0-9 658 414 664 088 1 322 502 16 339 14 613 30 952
10-19 719 533 730 269 1 449 802 24 704 23 381 48 085
20-29 372 617 471 738 844 355 16 966 17 338 34 304
30-39 231 694 340 157 571 851 16 312 16 514 32 825
40-49 167 506 247 921 415 426 15 516 18 009 33 525
50-59 109 663 151 677 261 340 12 919 15 297 28 216
60-69 71 857 133 384 205 241 9 724 14 988 24 712
70-79 43 280 90 351 133 631 6 972 13 482 20 453
80+ 20 221 49 271 69 492 4 678 11 152 15 830
Population group
Total 2 394 785 2 878 857 5 273 642 124 128 144 774 268 902
Black African 2 322 962 2 805 654 5 128 616 120 499 141 338 261 836
Coloured 4 785 5 378 10 163 305 317 622
Indian/Asian 4 749 3 838 8 587 124 80 204
White 62 289 63 987 126 276 3 200 3 040 6 239
2 394 785 2 878 857 5 273 642 124 128 144 774 268 902
299 651 302 870 602 521 5 921 5 472 11 393
376 897 673 278 1 050 176 40 641 64 983 105 624
800 319 787 065 1 587 384 37 623 32 663 70 256
155 475 174 215 329 690 7 716 7 744 15 460
955 794 961 280 1 917 074 45 339 40 377 85 716
513 183 633 587 1 146 770 22 814 24 203 47 017
171 000 212 993 383 992 6 450 6 655 13 104
684 183 846 579 1 530 762 29 264 30 858 60 121
78 259 94 849 173 109 2 963 3 085 6 049
Employment status
Total 2 394 785 2 878 857 5 273 642 124 128 144 774 268 902
Employed 375 885 287 961 663 847 14 400 11 286 25 686
Unemployed 350 918 536 952 887 870 14 371 19 555 33 926
Not economically active 549 318 823 524 1 372 841 51 880 57 446 109 326
Not applicable 1 118 664 1 230 420 2 349 083 43 477 56 487 99 964
Total population
All PES numbers are rounded to whole decimal numbers. The totals displayed may therefore differ slightly from the sum of the separate numbers.
Disabled persons
46
Level of education
Total
Not applicable
No schooling
Some primary
Complete primary
Primary (Sub-total)
Some secondary
Std 10/ Grade 12
Secondary (Sub-total)
Higher
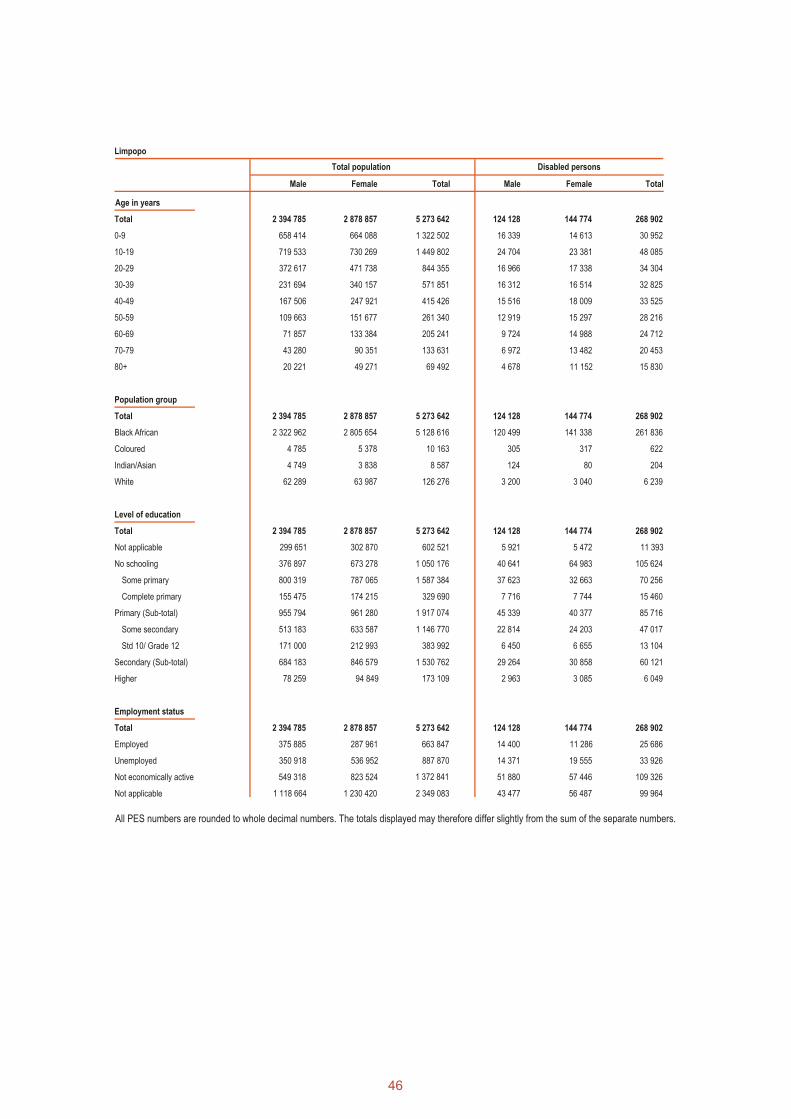
Male Female Total Male Female Total
Total 1 497 333 1 625 658 3 122 990 87 319 94 874 182 193
0-9 353 818 359 555 713 374 10 160 9 078 19 237
10-19 370 996 379 199 750 196 14 305 13 453 27 758
20-29 267 038 294 068 561 106 12 540 12 143 24 683
30-39 200 371 228 269 428 640 13 379 12 749 26 128
40-49 146 049 156 270 302 319 12 562 13 318 25 880
50-59 82 544 88 816 171 360 10 353 11 287 21 640
60-69 43 325 63 309 106 634 6 796 9 635 16 430
70-79 22 898 37 140 60 037 4 449 7 603 12 052
80+ 10 293 19 032 29 324 2 777 5 609 8 385
Population group
Total 1 497 333 1 625 658 3 122 990 87 319 94 874 182 193
Black African 1 380 198 1 506 147 2 886 345 81 477 88 844 170 322
Coloured 10 793 11 365 22 158 650 681 1 330
Indian/Asian 5 781 5 463 11 244 190 225 415
White 100 561 102 683 203 244 5 003 5 124 10 127
1 497 333 1 625 658 3 122 990 87 319 94 874 182 193
173 019 175 670 348 690 4 064 3 723 7 787
259 523 342 301 601 824 28 720 38 032 66 753
439 810 427 656 867 467 24 651 22 774 47 425
92 468 97 674 190 142 5 381 5 301 10 682
532 279 525 330 1 057 609 30 033 28 075 58 108
326 750 363 995 690 744 16 534 17 305 33 839
157 578 167 188 324 766 6 281 6 045 12 327
484 327 531 183 1 015 510 22 816 23 350 46 166
48 184 51 174 99 358 1 686 1 694 3 380
Employment status
Total 1 497 333 1 625 658 3 122 990 87 319 94 874 182 193
Employed 395 243 234 932 630 175 17 823 10 321 28 144
Unemployed 222 638 321 535 544 173 11 540 15 091 26 631
Not economically active 291 895 441 778 733 673 31 490 37 144 68 634
Not applicable 587 556 627 414 1 214 970 26 467 32 318 58 785
Total population
Mpumalanga
Age in years
All PES numbers are rounded to whole decimal numbers. The totals displayed may therefore differ slightly from the sum of the separate numbers.
Disabled persons
47
Northern Cape
Age in years
Male Female Total Male Female Total
Total 401 168 421 559 822 727 23 620 23 353 46 973
0-9 82 947 82 294 165 241 1 470 1 138 2 607
10-19 85 341 85 845 171 185 2 595 2 240 4 836
20-29 68 433 69 576 138 008 2 757 2 134 4 891
30-39 59 403 62 491 121 894 3 610 2 825 6 435
40-49 46 310 49 986 96 296 3 873 3 593 7 466
50-59 29 841 32 463 62 304 3 675 3 688 7 363
60-69 17 890 21 936 39 825 2 963 3 131 6 095
70-79 8 116 11 440 19 556 1 705 2 530 4 235
80+ 2 889 5 529 8 418 971 2 073 3 044
Population group
Total 401 168 421 559 822 727 23 620 23 353 46 973
Black African 145 003 148 972 293 976 9 756 10 179 19 935
Coloured 205 140 219 249 424 389 11 390 10 418 21 808
Indian /Asian 1 175 1 146 2 320 41 43 84
White 49 850 52 192 102 042 2 433 2 713 5 146
401 168 421 559 822 727 23 620 23 353 46 973
40 929 40 587 81 516 505 381 886
60 399 64 085 124 484 6 759 7 156 13 915
117 250 118 354 235 604 7 249 6 847 14 096
28 521 32 862 61 382 1 883 2 058 3 941
145 771 151 215 296 986 9 132 8 905 18 037
96 138 106 960 203 098 5 424 5 224 10 648
43 173 43 457 86 630 1 404 1 270 2 675
139 311 150 417 289 728 6 828 6 494 13 323
14 759 15 255 30 014 396 416 812
Employment status
Total 401 168 421 559 822 727 23 620 23 353 46 973
Employed 126 960 81 785 208 745 3 621 1 881 5 502
Unemployed 57 006 66 608 123 614 2 271 2 254 4 525
Not economically active 74 571 122 912 197 483 11 295 11 261 22 556
Not applicable 142 631 150 254 292 886 6 432 7 956 14 389
Total population Disabled persons
All PES numbers are rounded to whole decimal numbers. The totals displayed may therefore differ slightly from the sum of the separate numbers.
Level of education
Total
Not applicable
No schooling
Some primary
Complete primary
Primary (Sub-total)
Some secondary
Std 10/ Grade 12
Secondary (Sub-total)
Higher
48
North West
Age in years
Male Female Total Male Female Total
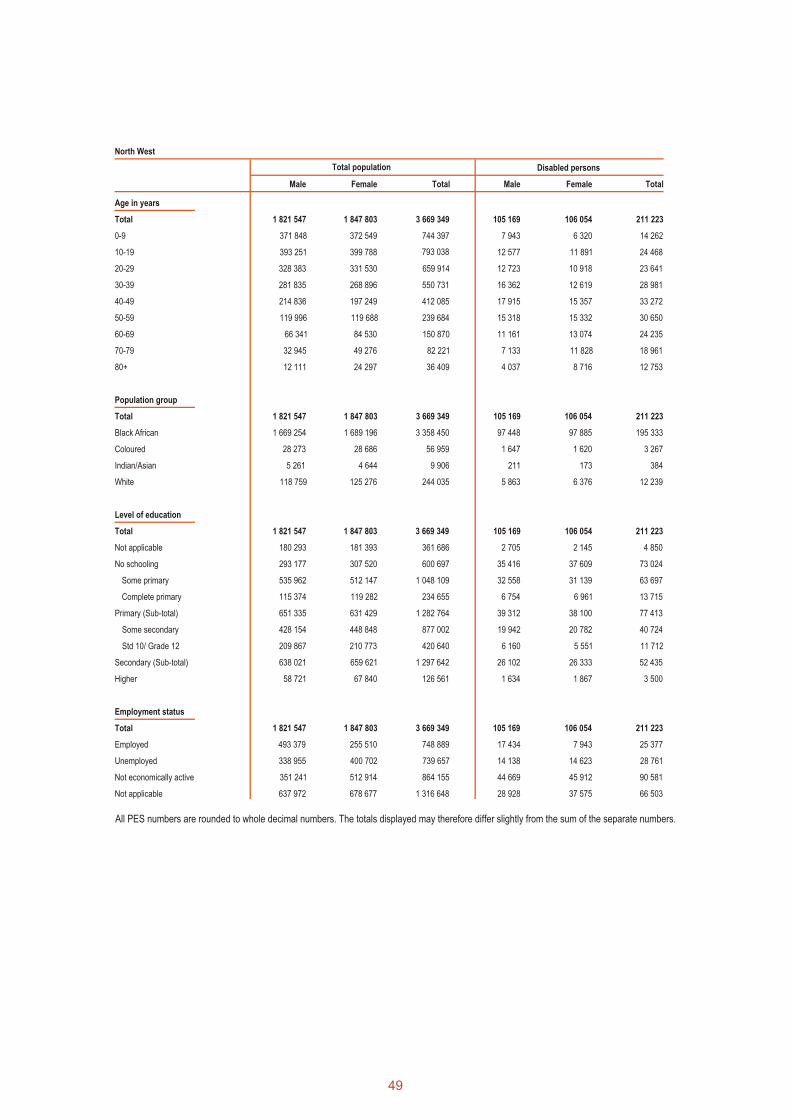
Total 1 821 547 1 847 803 3 669 349 105 169 106 054 211 223
0-9 371 848 372 549 744 397 7 943 6 320 14 262
10-19 393 251 399 788 793 038 12 577 11 891 24 468
20-29 328 383 331 530 659 914 12 723 10 918 23 641
30-39 281 835 268 896 550 731 16 362 12 619 28 981
40-49 214 836 197 249 412 085 17 915 15 357 33 272
50-59 119 996 119 688 239 684 15 318 15 332 30 650
60-69 66 341 84 530 150 870 11 161 13 074 24 235
70-79 32 945 49 276 82 221 7 133 11 828 18 961
80+ 12 111 24 297 36 409 4 037 8 716 12 753
Population group
Total 1 821 547 1 847 803 3 669 349 105 169 106 054 211 223
Black African 1 669 254 1 689 196 3 358 450 97 448 97 885 195 333
Coloured 28 273 28 686 56 959 1 647 1 620 3 267
Indian/Asian 5 261 4 644 9 906 211 173 384
White 118 759 125 276 244 035 5 863 6 376 12 239
1 821 547 1 847 803 3 669 349 105 169 106 054 211 223
180 293 181 393 361 686 2 705 2 145 4 850
293 177 307 520 600 697 35 416 37 609 73 024
535 962 512 147 1 048 109 32 558 31 139 63 697
115 374 119 282 234 655 6 754 6 961 13 715
651 335 631 429 1 282 764 39 312 38 100 77 413
428 154 448 848 877 002 19 942 20 782 40 724
209 867 210 773 420 640 6 160 5 551 11 712
638 021 659 621 1 297 642 26 102 26 333 52 435
58 721 67 840 126 561 1 634 1 867 3 500
Employment status
Total 1 821 547 1 847 803 3 669 349 105 169 106 054 211 223
Employed 493 379 255 510 748 889 17 434 7 943 25 377
Unemployed 338 955 400 702 739 657 14 138 14 623 28 761
Not economically active 351 241 512 914 864 155 44 669 45 912 90 581
Not applicable 637 972 678 677 1 316 648 28 928 37 575 66 503
Total population Disabled persons
All PES numbers are rounded to whole decimal numbers. The totals displayed may therefore differ slightly from the sum of the separate numbers.
Level of education
Total
Not applicable
No schooling
Some primary
Complete primary
Primary (Sub-total)
Some secondary
Std 10/ Grade 12
Secondary (Sub-total)
Higher
49

Western Cape
Age in years
Male Female Total Male Female Total
Total 2 192 321 2 332 014 4 524 335 96 549 90 301 186 850
0-9 409 889 404 860 814 749 7 111 6 334 13 445
10-19 427 604 440 594 868 198 11 315 9 683 20 997
20-29 420 476 436 159 856 635 13 579 10 888 24 466
30-39 366 718 387 593 754 311 16 412 13 018 29 430
40-49 258 892 286 064 544 956 15 773 13 711 29 484
50-59 158 144 174 360 332 504 13 838 12 464 26 302
60-69 93 567 113 076 206 643 9 996 9 216 19 212
70-79 43 603 62 087 105 690 5 561 7 717 13 278
80+ 13 429 27 221 40 650 2 964 7 271 10 235
Population group
Total 2 192 321 2 332 014 4 524 335 96 549 90 301 186 850
Black African 600 389 607 040 1 207 429 23 894 22 125 46 019
Coloured 1 170 950 1 268 026 2 438 976 52 922 46 676 99 598
Indian/Asian 22 343 22 687 45 030 748 664 1 412
White 398 639 434 262 832 901 18 984 20 836 39 820
2 192 321 2 332 014 4 524 335 96 549 90 301 186 850
204 553 200 989 405 542 2 884 2 593 5 477
155 436 154 397 309 833 12 944 12 334 25 278
536 151 517 885 1 054 036 26 498 22 725 49 223
154 669 174 626 329 295 8 150 7 959 16 108
690 820 692 511 1 383 331 34 648 30 684 65 331
643 810 733 628 1 377 438 28 783 28 194 56 977
339 015 385 350 724 364 11 384 11 274 22 657
982 825 1 118 978 2 101 802 40 166 39 468 79 634
158 688 165 139 323 827 5 907 5 223 11 129
Employment status
Total 2 192 321 2 332 014 4 524 335 96 549 90 301 186 850
Employed 828 621 661 100 1 489 722 20 633 13 908 34 542
Unemployed 295 944 310 561 606 505 9 124 8 364 17 488
Not economically active 361 171 616 889 978 060 42 941 38 931 81 872
Not applicable 706 584 743 464 1 450 048 23 851 29 097 52 948
Total population Disabled persons
All PES numbers are rounded to whole decimal numbers. The totals displayed may therefore differ slightly from the sum of the separate numbers.
Level of education
Total
Not applicable
No schooling
Some primary
Complete primary
Primary (Sub-total)
Some secondary
Std 10/ Grade 12
Secondary (Sub-total)
Higher
50

Age in years N %
Total 724 169 32,1 453 104 20,1 146 164 6,5 668 082 29,6 279 094 12,4 354 495 15,7
0 2 496 25,6 3 079 31,6 812 8,3 1 644 16,9 1 974 20,3 1 538 15,8
1-4 16 386 26,6 16 352 26,6 6 270 10,2 13 309 21,6 10 215 16,6 8 682 14,1
5-9 30 832 25,8 33 554 28,1 12 868 10,8 22 177 18,6 22 544 18,9 16 368 13,7
10-14 41 408 27,7 39 229 26,3 14 101 9,4 26 925 18,0 32 617 21,8 21 879 14,6
15-19 46 263 29,6 35 913 23,0 14 698 9,4 30 173 19,3 35 056 22,4 26 227 16,8
20-24 37 752 27,5 28 082 20,4 11 534 8,4 30 657 22,3 26 539 19,3 26 354 19,2
25-29 36 977 25,2 27 496 18,7 11 551 7,9 38 242 26,1 24 641 16,8 31 087 21,2
30-34 37 165 24,9 26 523 17,7 10 533 7,0 42 864 28,7 21 964 14,7 32 156 21,5
35-39 40 840 25,3 26 796 16,6 10 234 6,3 49 947 30,9 20 707 12,8 33 881 21,0
40-44 46 729 27,8 25 499 15,2 9 051 5,4 55 844 33,3 18 443 11,0 32 752 19,5
45-49 52 981 31,8 23 869 14,3 8 095 4,9 58 989 35,4 15 025 9,0 28 497 17,1
50-54 53 636 33,6 22 888 14,4 7 226 4,5 59 325 37,2 12 591 7,9 24 401 15,3
55-59 48 216 34,7 20 312 14,6 5 975 4,3 54 542 39,2 9 368 6,7 19 198 13,8
60-64 50 643 37,9 23 083 17,3 5 859 4,4 49 571 37,1 8 047 6,0 16 194 12,1
65-69 45 481 42,4 21 464 20,0 4 498 4,2 36 871 34,4 5 691 5,3 10 971 10,2
70-74 46 293 45,3 23 120 22,6 4 220 4,1 34 094 33,4 4 963 4,9 9 109 8,9
75-79 33 280 46,3 18 786 26,2 2 950 4,1 23 997 33,4 3 354 4,7 6 029 8,4
80-84 32 688 48,9 19 769 29,6 2 995 4,5 21 551 32,2 2 986 4,5 5 185 7,8
85+ 24 104 48,7 17 288 35,0 2 693 5,4 17 361 35,1 2 367 4,8 3 987 8,1
Males
Total 306 068 28,3 209 729 19,4 78 119 7,2 332 093 30,7 146 188 13,5 186 978 17,3
0 1 250 24,6 1 596 31,4 400 7,9 886 17,4 1 025 20,2 791 15,6
1-4 8 659 26,4 8 341 25,5 3 458 10,6 7 443 22,7 5 319 16,2 4 705 14,4
5-9 16 598 25,9 17 085 26,7 7 348 11,5 12 251 19,1 12 040 18,8 9 075 14,2
10-14 20 717 26,6 19 631 25,2 7 752 9,9 14 432 18,5 17 752 22,8 11 710 15,0
15-19 21 092 26,7 17 890 22,6 8 175 10,3 16 039 20,3 18 962 24,0 14 042 17,8
20-24 17 304 24,4 14 115 19,9 6 618 9,3 16 762 23,7 14 545 20,5 15 190 21,4
25-29 17 429 22,2 13 908 17,7 6 813 8,7 21 755 27,7 13 915 17,7 18 847 24,0
30-34 17 559 21,8 13 576 16,9 6 124 7,6 24 481 30,4 12 347 15,3 19 507 24,2
35-39 18 525 21,9 13 496 15,9 5 759 6,8 27 802 32,8 11 311 13,4 19 779 23,4
40-44 20 130 23,6 12 799 15,0 5 018 5,9 30 432 35,7 9 878 11,6 18 204 21,3
45-49 22 005 27,3 11 529 14,3 4 295 5,3 30 743 38,2 7 633 9,5 14 479 18,0
50-54 22 973 29,8 11 173 14,5 3 854 5,0 30 237 39,3 6 388 8,3 12 170 15,8
55-59 20 533 31,3 9 743 14,8 3 109 4,7 27 163 41,4 4 649 7,1 9 100 13,9
60-64 20 610 33,9 10 162 16,7 2 853 4,7 24 729 40,7 3 599 5,9 7 399 12,2
65-69 16 233 38,6 8 532 20,3 2 012 4,8 15 276 36,3 2 246 5,3 4 207 10,0
70-74 15 695 42,7 8 421 22,9 1 764 4,8 12 539 34,1 1 873 5,1 3 198 8,7
75-79 11 558 45,2 6 817 26,6 1 116 4,4 8 266 32,3 1 185 4,6 2 070 8,1
80-84 10 396 48,6 6 211 29,0 961 4,5 6 587 30,8 909 4,3 1 507 7,0
85+ 6 803 50,1 4 704 34,6 691 5,1 4 268 31,4 612 4,5 997 7,3
Total 418 102 35,6 243 376 20,7 68 046 5,8 335 990 28,6 132 906 11,3 167 518 14,3
0 1 246 26,8 1 484 31,9 413 8,9 758 16,3 950 20,4 747 16,1
1-4 7 728 26,8 8 010 27,8 2 813 9,8 5 866 20,3 4 895 17,0 3 977 13,8
5-9 14 234 25,7 16 469 29,8 5 520 10,0 9 926 17,9 10 504 19,0 7 293 13,2
10-14 20 691 29,0 19 598 27,4 6 349 8,9 12 492 17,5 14 865 20,8 10 169 14,2
15-19 25 171 32,6 18 023 23,3 6 523 8,4 14 134 18,3 16 094 20,8 12 185 15,8
20-24 20 448 30,7 13 967 21,0 4 916 7,4 13 895 20,9 11 994 18,0 11 163 16,8
25-29 19 549 28,7 13 589 19,9 4 728 6,9 16 487 24,2 10 726 15,7 12 240 17,9
30-34 19 605 28,4 12 947 18,8 4 410 6,4 18 383 26,6 9 617 13,9 12 649 18,3
35-39 22 315 29,1 13 300 17,3 4 475 5,8 22 145 28,9 9 396 12,2 14 102 18,4
40-44 26 599 32,2 12 700 15,4 4 033 4,9 25 412 30,8 8 564 10,4 14 547 17,6
45-49 30 976 35,9 12 340 14,3 3 800 4,4 28 246 32,8 7 392 8,6 14 018 16,3
50-54 30 663 37,2 11 715 14,2 3 372 4,1 29 088 35,3 6 203 7,5 12 231 14,8
55-59 27 683 37,7 10 569 14,4 2 866 3,9 27 378 37,3 4 720 6,4 10 098 13,8
60-64 30 033 41,2 12 922 17,7 3 007 4,1 24 842 34,1 4 447 6,1 8 796 12,1
65-69 29 248 44,8 12 932 19,8 2 486 3,8 21 595 33,1 3 445 5,3 6 764 10,4
70-74 30 598 46,8 14 699 22,5 2 455 3,8 21 555 33,0 3 090 4,7 5 911 9,0
75-79 21 721 47,0 11 970 25,9 1 834 4,0 15 731 34,0 2 169 4,7 3 959 8,6
80-84 22 292 49,0 13 558 29,8 2 035 4,5 14 964 32,9 2 077 4,6 3 678 8,1
85+ 17 301 48,2 12 585 35,1 2 002 5,6 13 093 36,5 1 756 4,9 2 990 8,3
Intellectual EmotionalSight Hearing Communication Physical
N %N % N % N %N %
Females
Appendix 2: Number of disabled persons by age group and type of disability, South Africa
All PES numbers are rounded to whole decimal numbers. The totals displayed may therefore differ slightly from the sum of the separate numbers Percentages take into account people with multiple disabilities.
51
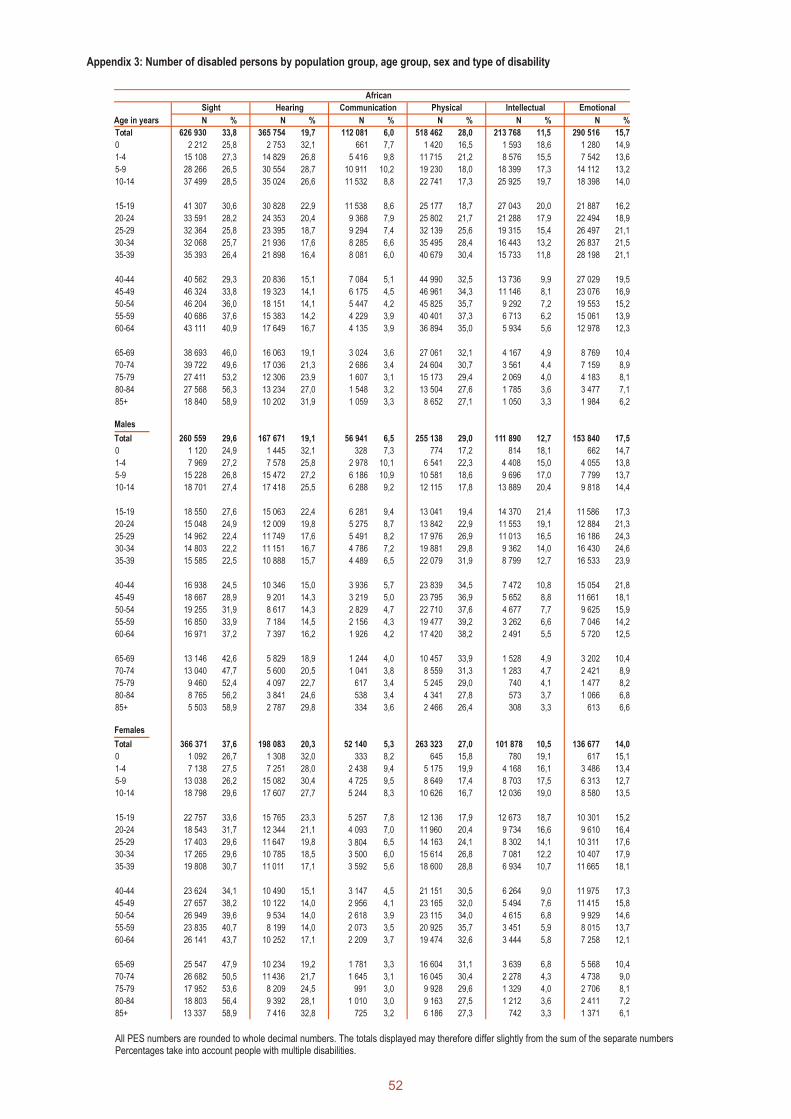
Age in years N % N % N % N % N % N %
Total 626 930 33,8 365 754 19,7 112 081 6,0 518 462 28,0 213 768 11,5 290 516 15,7
0 2 212 25,8 2 753 32,1 661 7,7 1 420 16,5 1 593 18,6 1 280 14,9
1-4 15 108 27,3 14 829 26,8 5 416 9,8 11 715 21,2 8 576 15,5 7 542 13,6
5-9 28 266 26,5 30 554 28,7 10 911 10,2 19 230 18,0 18 399 17,3 14 112 13,2
10-14 37 499 28,5 35 024 26,6 11 532 8,8 22 741 17,3 25 925 19,7 18 398 14,0
15-19 41 307 30,6 30 828 22,9 11 538 8,6 25 177 18,7 27 043 20,0 21 887 16,2
20-24 33 591 28,2 24 353 20,4 9 368 7,9 25 802 21,7 21 288 17,9 22 494 18,9
25-29 32 364 25,8 23 395 18,7 9 294 7,4 32 139 25,6 19 315 15,4 26 497 21,1
30-34 32 068 25,7 21 936 17,6 8 285 6,6 35 495 28,4 16 443 13,2 26 837 21,5
35-39 35 393 26,4 21 898 16,4 8 081 6,0 40 679 30,4 15 733 11,8 28 198 21,1
40-44 40 562 29,3 20 836 15,1 7 084 5,1 44 990 32,5 13 736 9,9 27 029 19,5
45-49 46 324 33,8 19 323 14,1 6 175 4,5 46 961 34,3 11 146 8,1 23 076 16,9
50-54 46 204 36,0 18 151 14,1 5 447 4,2 45 825 35,7 9 292 7,2 19 553 15,2
55-59 40 686 37,6 15 383 14,2 4 229 3,9 40 401 37,3 6 713 6,2 15 061 13,9
60-64 43 111 40,9 17 649 16,7 4 135 3,9 36 894 35,0 5 934 5,6 12 978 12,3
65-69 38 693 46,0 16 063 19,1 3 024 3,6 27 061 32,1 4 167 4,9 8 769 10,4
70-74 39 722 49,6 17 036 21,3 2 686 3,4 24 604 30,7 3 561 4,4 7 159 8,9
75-79 27 411 53,2 12 306 23,9 1 607 3,1 15 173 29,4 2 069 4,0 4 183 8,1
80-84 27 568 56,3 13 234 27,0 1 548 3,2 13 504 27,6 1 785 3,6 3 477 7,1
85+ 18 840 58,9 10 202 31,9 1 059 3,3 8 652 27,1 1 050 3,3 1 984 6,2
260 559 29,6 167 671 19,1 56 941 6,5 255 138 29,0 111 890 12,7 153 840 17,5
0 1 120 24,9 1 445 32,1 328 7,3 774 17,2 814 18,1 662 14,7
1-4 7 969 27,2 7 578 25,8 2 978 10,1 6 541 22,3 4 408 15,0 4 055 13,8
5-9 15 228 26,8 15 472 27,2 6 186 10,9 10 581 18,6 9 696 17,0 7 799 13,7
10-14 18 701 27,4 17 418 25,5 6 288 9,2 12 115 17,8 13 889 20,4 9 818 14,4
15-19 18 550 27,6 15 063 22,4 6 281 9,4 13 041 19,4 14 370 21,4 11 586 17,3
20-24 15 048 24,9 12 009 19,8 5 275 8,7 13 842 22,9 11 553 19,1 12 884 21,3
25-29 14 962 22,4 11 749 17,6 5 491 8,2 17 976 26,9 11 013 16,5 16 186 24,3
30-34 14 803 22,2 11 151 16,7 4 786 7,2 19 881 29,8 9 362 14,0 16 430 24,6
35-39 15 585 22,5 10 888 15,7 4 489 6,5 22 079 31,9 8 799 12,7 16 533 23,9
40-44 16 938 24,5 10 346 15,0 3 936 5,7 23 839 34,5 7 472 10,8 15 054 21,8
45-49 18 667 28,9 9 201 14,3 3 219 5,0 23 795 36,9 5 652 8,8 11 661 18,1
50-54 19 255 31,9 8 617 14,3 2 829 4,7 22 710 37,6 4 677 7,7 9 625 15,9
55-59 16 850 33,9 7 184 14,5 2 156 4,3 19 477 39,2 3 262 6,6 7 046 14,2
60-64 16 971 37,2 7 397 16,2 1 926 4,2 17 420 38,2 2 491 5,5 5 720 12,5
65-69 13 146 42,6 5 829 18,9 1 244 4,0 10 457 33,9 1 528 4,9 3 202 10,4
70-74 13 040 47,7 5 600 20,5 1 041 3,8 8 559 31,3 1 283 4,7 2 421 8,9
75-79 9 460 52,4 4 097 22,7 617 3,4 5 245 29,0 740 4,1 1 477 8,2
80-84 8 765 56,2 3 841 24,6 538 3,4 4 341 27,8 573 3,7 1 066 6,8
85+ 5 503 58,9 2 787 29,8 334 3,6 2 466 26,4 308 3,3 613 6,6
366 371 37,6 198 083 20,3 52 140 5,3 263 323 27,0 101 878 10,5 136 677 14,0
0 1 092 26,7 1 308 32,0 333 8,2 645 15,8 780 19,1 617 15,1
1-4 7 138 27,5 7 251 28,0 2 438 9,4 5 175 19,9 4 168 16,1 3 486 13,4
5-9 13 038 26,2 15 082 30,4 4 725 9,5 8 649 17,4 8 703 17,5 6 313 12,7
10-14 18 798 29,6 17 607 27,7 5 244 8,3 10 626 16,7 12 036 19,0 8 580 13,5
15-19 22 757 33,6 15 765 23,3 5 257 7,8 12 136 17,9 12 673 18,7 10 301 15,2
20-24 18 543 31,7 12 344 21,1 4 093 7,0 11 960 20,4 9 734 16,6 9 610 16,4
25-29 17 403 29,6 11 647 19,8 3 804 6,5 14 163 24,1 8 302 14,1 10 311 17,6
30-34 17 265 29,6 10 785 18,5 3 500 6,0 15 614 26,8 7 081 12,2 10 407 17,9
35-39 19 808 30,7 11 011 17,1 3 592 5,6 18 600 28,8 6 934 10,7 11 665 18,1
40-44 23 624 34,1 10 490 15,1 3 147 4,5 21 151 30,5 6 264 9,0 11 975 17,3
45-49 27 657 38,2 10 122 14,0 2 956 4,1 23 165 32,0 5 494 7,6 11 415 15,8
50-54 26 949 39,6 9 534 14,0 2 618 3,9 23 115 34,0 4 615 6,8 9 929 14,6
55-59 23 835 40,7 8 199 14,0 2 073 3,5 20 925 35,7 3 451 5,9 8 015 13,7
60-64 26 141 43,7 10 252 17,1 2 209 3,7 19 474 32,6 3 444 5,8 7 258 12,1
65-69 25 547 47,9 10 234 19,2 1 781 3,3 16 604 31,1 3 639 6,8 5 568 10,4
70-74 26 682 50,5 11 436 21,7 1 645 3,1 16 045 30,4 2 278 4,3 4 738 9,0
75-79 17 952 53,6 8 209 24,5 991 3,0 9 928 29,6 1 329 4,0 2 706 8,1
80-84 18 803 56,4 9 392 28,1 1 010 3,0 9 163 27,5 1 212 3,6 2 411 7,2
85+ 13 337 58,9 7 416 32,8 725 3,2 6 186 27,3 742 3,3 1 371 6,1
Sight Hearing Communication Physical Intellectual Emotional
African
Males
Total
Total
Females
Appendix 3: Number of disabled persons by population group, age group, sex and type of disability
All PES numbers are rounded to whole decimal numbers. The totals displayed may therefore differ slightly from the sum of the separate numbers Percentages take into account people with multiple disabilities.
52
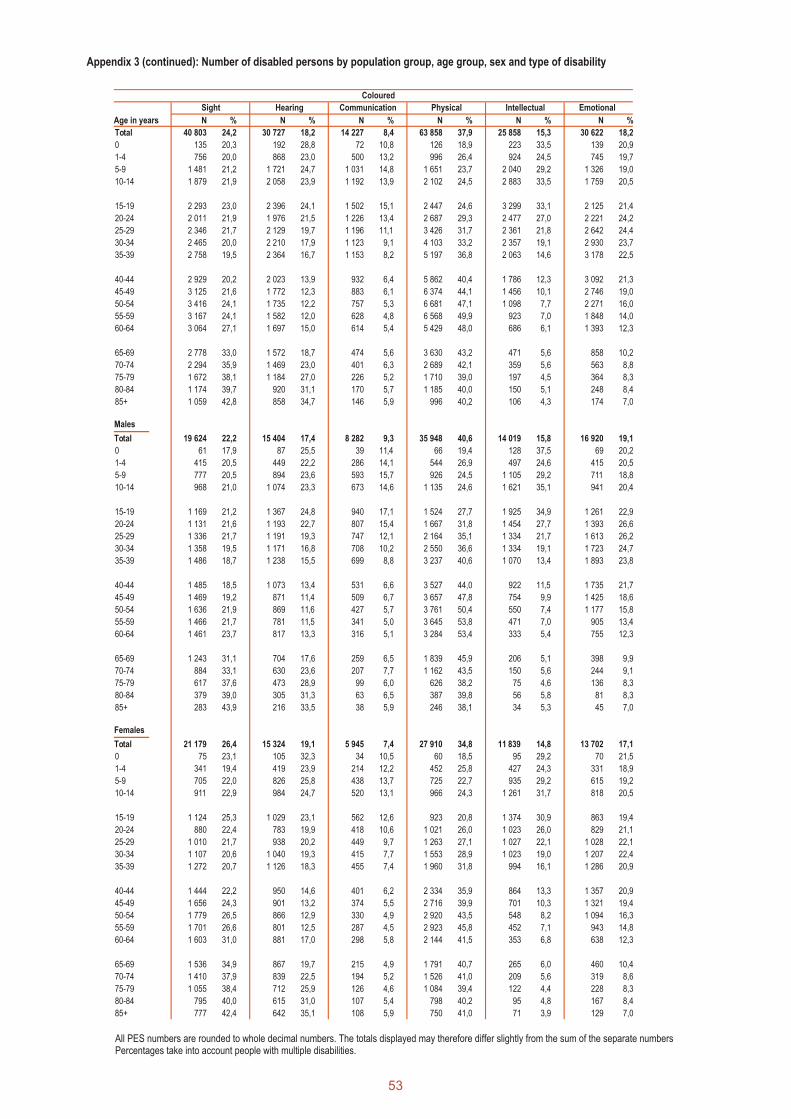
N % N % N % N % N % N %
Total 40 803 24,2 30 727 18,2 14 227 8,4 63 858 37,9 25 858 15,3 30 622 18,2
0 135 20,3 192 28,8 72 10,8 126 18,9 223 33,5 139 20,9
1-4 756 20,0 868 23,0 500 13,2 996 26,4 924 24,5 745 19,7
5-9 1 481 21,2 1 721 24,7 1 031 14,8 1 651 23,7 2 040 29,2 1 326 19,0
10-14 1 879 21,9 2 058 23,9 1 192 13,9 2 102 24,5 2 883 33,5 1 759 20,5
15-19 2 293 23,0 2 396 24,1 1 502 15,1 2 447 24,6 3 299 33,1 2 125 21,4
20-24 2 011 21,9 1 976 21,5 1 226 13,4 2 687 29,3 2 477 27,0 2 221 24,2
25-29 2 346 21,7 2 129 19,7 1 196 11,1 3 426 31,7 2 361 21,8 2 642 24,4
30-34 2 465 20,0 2 210 17,9 1 123 9,1 4 103 33,2 2 357 19,1 2 930 23,7
35-39 2 758 19,5 2 364 16,7 1 153 8,2 5 197 36,8 2 063 14,6 3 178 22,5
40-44 2 929 20,2 2 023 13,9 932 6,4 5 862 40,4 1 786 12,3 3 092 21,3
45-49 3 125 21,6 1 772 12,3 883 6,1 6 374 44,1 1 456 10,1 2 746 19,0
50-54 3 416 24,1 1 735 12,2 757 5,3 6 681 47,1 1 098 7,7 2 271 16,0
55-59 3 167 24,1 1 582 12,0 628 4,8 6 568 49,9 923 7,0 1 848 14,0
60-64 3 064 27,1 1 697 15,0 614 5,4 5 429 48,0 686 6,1 1 393 12,3
65-69 2 778 33,0 1 572 18,7 474 5,6 3 630 43,2 471 5,6 858 10,2
70-74 2 294 35,9 1 469 23,0 401 6,3 2 689 42,1 359 5,6 563 8,8
75-79 1 672 38,1 1 184 27,0 226 5,2 1 710 39,0 197 4,5 364 8,3
80-84 1 174 39,7 920 31,1 170 5,7 1 185 40,0 150 5,1 248 8,4
85+ 1 059 42,8 858 34,7 146 5,9 996 40,2 106 4,3 174 7,0
19 624 22,2 15 404 17,4 8 282 9,3 35 948 40,6 14 019 15,8 16 920 19,1
0 61 17,9 87 25,5 39 11,4 66 19,4 128 37,5 69 20,2
1-4 415 20,5 449 22,2 286 14,1 544 26,9 497 24,6 415 20,5
5-9 777 20,5 894 23,6 593 15,7 926 24,5 1 105 29,2 711 18,8
10-14 968 21,0 1 074 23,3 673 14,6 1 135 24,6 1 621 35,1 941 20,4
15-19 1 169 21,2 1 367 24,8 940 17,1 1 524 27,7 1 925 34,9 1 261 22,9
20-24 1 131 21,6 1 193 22,7 807 15,4 1 667 31,8 1 454 27,7 1 393 26,6
25-29 1 336 21,7 1 191 19,3 747 12,1 2 164 35,1 1 334 21,7 1 613 26,2
30-34 1 358 19,5 1 171 16,8 708 10,2 2 550 36,6 1 334 19,1 1 723 24,7
35-39 1 486 18,7 1 238 15,5 699 8,8 3 237 40,6 1 070 13,4 1 893 23,8
40-44 1 485 18,5 1 073 13,4 531 6,6 3 527 44,0 922 11,5 1 735 21,7
45-49 1 469 19,2 871 11,4 509 6,7 3 657 47,8 754 9,9 1 425 18,6
50-54 1 636 21,9 869 11,6 427 5,7 3 761 50,4 550 7,4 1 177 15,8
55-59 1 466 21,7 781 11,5 341 5,0 3 645 53,8 471 7,0 905 13,4
60-64 1 461 23,7 817 13,3 316 5,1 3 284 53,4 333 5,4 755 12,3
65-69 1 243 31,1 704 17,6 259 6,5 1 839 45,9 206 5,1 398 9,9
70-74 884 33,1 630 23,6 207 7,7 1 162 43,5 150 5,6 244 9,1
75-79 617 37,6 473 28,9 99 6,0 626 38,2 75 4,6 136 8,3
80-84 379 39,0 305 31,3 63 6,5 387 39,8 56 5,8 81 8,3
85+ 283 43,9 216 33,5 38 5,9 246 38,1 34 5,3 45 7,0
21 179 26,4 15 324 19,1 5 945 7,4 27 910 34,8 11 839 14,8 13 702 17,1
0 75 23,1 105 32,3 34 10,5 60 18,5 95 29,2 70 21,5
1-4 341 19,4 419 23,9 214 12,2 452 25,8 427 24,3 331 18,9
5-9 705 22,0 826 25,8 438 13,7 725 22,7 935 29,2 615 19,2
10-14 911 22,9 984 24,7 520 13,1 966 24,3 1 261 31,7 818 20,5
15-19 1 124 25,3 1 029 23,1 562 12,6 923 20,8 1 374 30,9 863 19,4
20-24 880 22,4 783 19,9 418 10,6 1 021 26,0 1 023 26,0 829 21,1
25-29 1 010 21,7 938 20,2 449 9,7 1 263 27,1 1 027 22,1 1 028 22,1
30-34 1 107 20,6 1 040 19,3 415 7,7 1 553 28,9 1 023 19,0 1 207 22,4
35-39 1 272 20,7 1 126 18,3 455 7,4 1 960 31,8 994 16,1 1 286 20,9
40-44 1 444 22,2 950 14,6 401 6,2 2 334 35,9 864 13,3 1 357 20,9
45-49 1 656 24,3 901 13,2 374 5,5 2 716 39,9 701 10,3 1 321 19,4
50-54 1 779 26,5 866 12,9 330 4,9 2 920 43,5 548 8,2 1 094 16,3
55-59 1 701 26,6 801 12,5 287 4,5 2 923 45,8 452 7,1 943 14,8
60-64 1 603 31,0 881 17,0 298 5,8 2 144 41,5 353 6,8 638 12,3
65-69 1 536 34,9 867 19,7 215 4,9 1 791 40,7 265 6,0 460 10,4
70-74 1 410 37,9 839 22,5 194 5,2 1 526 41,0 209 5,6 319 8,6
75-79 1 055 38,4 712 25,9 126 4,6 1 084 39,4 122 4,4 228 8,3
80-84 795 40,0 615 31,0 107 5,4 798 40,2 95 4,8 167 8,4
85+ 777 42,4 642 35,1 108 5,9 750 41,0 71 3,9 129 7,0
EmotionalHearing Communication Physical Intellectual
Coloured
Sight
Males
Total
Total
Females
Age in years
All PES numbers are rounded to whole decimal numbers. The totals displayed may therefore differ slightly from the sum of the separate numbers Percentages take into account people with multiple disabilities.
Appendix 3 (continued): Number of disabled persons by population group, age group, sex and type of disability
53

N % N % N % N % N % N %
Total 11 284 27,4 6 670 16,2 3 124 7,6 14 878 36,1 5 716 13,9 6 368 15,4
0 21 21,4 21 21,4 9 9,2 19 19,4 31 31,6 22 22,4
1-4 89 16,5 122 22,6 63 11,6 140 25,9 142 26,2 90 16,6
5-9 230 19,4 245 20,7 176 14,8 264 22,3 353 29,8 209 17,6
10-14 449 25,4 343 19,4 183 10,4 330 18,7 524 29,7 284 16,1
15-19 581 27,4 443 20,9 255 12,0 384 18,1 556 26,2 378 17,8
20-24 698 33,1 341 16,2 227 10,8 445 21,1 453 21,5 369 17,5
25-29 633 25,6 418 16,9 219 8,9 641 26,0 521 21,1 468 18,9
30-34 655 26,0 370 14,7 216 8,6 688 27,3 498 19,8 522 20,7
35-39 657 22,8 448 15,6 240 8,3 927 32,2 488 16,9 574 19,9
40-44 752 23,8 382 12,1 189 6,0 1 140 36,0 447 14,1 636 20,1
45-49 894 25,4 408 11,6 207 5,9 1 367 38,8 436 12,4 646 18,3
50-54 1 131 27,8 451 11,1 219 5,4 1 742 42,8 379 9,3 658 16,2
55-59 1 220 27,8 525 12,0 275 6,3 2 050 46,7 306 7,0 609 13,9
60-64 1 143 30,9 558 15,1 235 6,4 1 655 44,8 245 6,6 423 11,5
65-69 759 31,4 457 18,9 137 5,7 1 087 44,9 138 5,7 199 8,2
70-74 608 33,1 428 23,3 120 6,5 843 45,9 89 4,9 135 7,4
75-79 385 30,4 337 26,6 61 4,8 585 46,2 61 4,8 85 6,7
80-84 243 32,3 227 30,2 52 6,9 350 46,5 32 4,3 36 4,8
85+ 136 31,9 145 34,0 41 9,6 222 52,0 16 3,7 24 5,6
5 315 24,7 3 147 14,6 1 759 8,2 8 226 38,2 3 094 14,4 3 564 16,5
0 8 16,3 10 20,4 5 10,2 10 20,4 22 44,9 14 28,6
1-4 47 15,5 60 19,7 36 11,8 83 27,3 81 26,6 61 20,1
5-9 114 17,3 142 21,5 116 17,6 147 22,3 187 28,4 120 18,2
10-14 229 23,3 182 18,5 118 12,0 204 20,7 303 30,8 168 17,1
15-19 265 23,2 211 18,5 166 14,6 237 20,8 331 29,0 236 20,7
20-24 355 30,1 174 14,7 140 11,9 258 21,8 254 21,5 213 18,0
25-29 327 23,8 213 15,5 130 9,5 408 29,7 295 21,5 268 19,5
30-34 324 23,2 190 13,6 116 8,3 436 31,2 254 18,2 298 21,3
35-39 342 21,2 220 13,6 138 8,6 576 35,7 241 14,9 356 22,1
40-44 360 20,1 172 9,6 100 5,6 734 41,0 251 14,0 370 20,6
45-49 455 23,2 208 10,6 109 5,6 836 42,7 230 11,7 358 18,3
50-54 537 24,9 213 9,9 133 6,2 984 45,7 205 9,5 366 17,0
55-59 561 25,5 236 10,7 149 6,8 1 084 49,3 156 7,1 302 13,7
60-64 543 27,8 243 12,4 116 5,9 980 50,1 129 6,6 221 11,3
65-69 340 30,6 188 16,9 65 5,9 513 46,2 64 5,8 99 8,9
70-74 241 31,4 191 24,9 65 8,5 358 46,7 37 4,8 56 7,3
75-79 143 28,1 138 27,2 26 5,1 220 43,3 32 6,3 38 7,5
80-84 86 32,2 98 36,7 18 6,7 98 36,7 12 4,5 15 5,6
85+ 39 28,9 58 43,0 12 8,9 61 45,2 8 5,9 6 4,4
5 969 30,3 3 524 17,9 1 364 6,9 6 652 33,8 2 622 13,3 2 804 14,2
0 13 26,5 12 24,5 3 6,1 9 18,4 9 18,4 8 16,3
1-4 42 17,8 63 26,7 27 11,4 57 24,2 61 25,8 29 12,3
5-9 116 22,0 103 19,5 60 11,4 117 22,2 166 31,5 89 16,9
10-14 220 28,1 161 20,6 65 8,3 126 16,1 221 28,3 116 14,8
15-19 316 32,2 232 23,6 90 9,2 147 15,0 225 22,9 142 14,5
20-24 344 37,0 167 18,0 87 9,4 187 20,1 199 21,4 156 16,8
25-29 305 27,8 205 18,7 88 8,0 233 21,2 226 20,6 200 18,2
30-34 331 29,5 180 16,0 100 8,9 252 22,5 245 21,8 224 20,0
35-39 315 24,9 228 18,0 103 8,1 351 27,7 247 19,5 218 17,2
40-44 392 28,6 210 15,3 89 6,5 405 29,5 195 14,2 266 19,4
45-49 439 28,1 200 12,8 98 6,3 531 34,0 206 13,2 288 18,4
50-54 594 31,0 238 12,4 86 4,5 758 39,5 174 9,1 293 15,3
55-59 659 30,1 289 13,2 125 5,7 966 44,1 150 6,8 307 14,0
60-64 600 34,5 315 18,1 120 6,9 675 38,8 115 6,6 203 11,7
65-69 419 32,0 269 20,6 71 5,4 573 43,8 74 5,7 101 7,7
70-74 367 34,4 237 22,2 54 5,1 485 45,4 52 4,9 80 7,5
75-79 242 31,9 199 26,2 35 4,6 366 48,2 29 3,8 47 6,2
80-84 156 32,2 129 26,6 33 6,8 252 52,0 21 4,3 21 4,3
85+ 98 33,6 88 30,1 29 9,9 161 55,1 8 2,7 18 6,2
Sight Hearing Communication Physical Intellectual Emotional
Indian/Asian
Males
Total
Total
Females
Age in years
Appendix 3 (continued): Number of disabled persons by population group, age group, sex and type of disability
All PES numbers are rounded to whole decimal numbers. The totals displayed may therefore differ slightly from the sum of the separate numbers Percentages take into account people with multiple disabilities.
54

N % N % N % N % N % N %
Total 45 152 23,6 49 952 26,1 16 733 8,7 70 885 37,0 33 751 17,6 26 989 14,1
0 128 33,5 113 29,6 70 18,3 79 20,7 127 33,2 97 25,4
1-4 433 21,8 532 26,8 291 14,7 457 23,0 573 28,9 306 15,4
5-9 854 18,5 1 034 22,4 750 16,2 1 032 22,3 1 752 37,9 721 15,6
10-14 1 581 21,3 1 804 24,3 1 194 16,1 1 752 23,6 3 285 44,3 1 438 19,4
15-19 2 082 22,3 2 246 24,1 1 402 15,0 2 164 23,2 4 158 44,5 1 837 19,7
20-24 1 452 20,6 1 413 20,0 713 10,1 1 723 24,4 2 322 32,9 1 269 18,0
25-29 1 634 20,2 1 554 19,2 842 10,4 2 037 25,2 2 445 30,3 1 481 18,3
30-34 1 976 20,3 2 006 20,6 909 9,3 2 578 26,4 2 665 27,3 1 868 19,2
35-39 2 032 19,2 2 086 19,8 760 7,2 3 144 29,8 2 423 23,0 1 930 18,3
40-44 2 486 21,0 2 258 19,1 846 7,2 3 853 32,6 2 474 20,9 1 994 16,9
45-49 2 639 22,1 2 366 19,8 830 6,9 4 288 35,9 1 987 16,6 2 029 17,0
50-54 2 886 22,4 2 551 19,8 803 6,2 5 077 39,4 1 823 14,2 1 918 14,9
55-59 3 144 23,7 2 821 21,3 844 6,4 5 522 41,7 1 427 10,8 1 680 12,7
60-64 3 324 25,2 3 180 24,1 874 6,6 5 594 42,3 1 182 8,9 1 400 10,6
65-69 3 251 26,5 3 372 27,5 862 7,0 5 094 41,5 915 7,5 1 144 9,3
70-74 3 668 26,6 4 188 30,3 1 013 7,3 5 959 43,1 954 6,9 1 251 9,1
75-79 3 812 26,1 4 959 34,0 1 056 7,2 6 529 44,8 1 026 7,0 1 397 9,6
80-84 3 703 26,1 5 388 38,0 1 226 8,6 6 512 45,9 1 019 7,2 1 423 10,0
85+ 4 068 27,9 6 083 41,7 1 447 9,9 7 491 51,3 1 195 8,2 1 805 12,4
20 569 22,3 23 507 25,5 8 136 8,8 32 780 35,5 17 184 18,6 12 655 13,7
0 62 32,6 54 28,4 27 14,2 36 18,9 61 32,1 45 23,7
1-4 227 21,0 255 23,6 157 14,5 276 25,6 333 30,8 174 16,1
5-9 479 17,9 576 21,5 453 16,9 597 22,3 1 052 39,2 446 16,6
10-14 819 19,5 957 22,8 673 16,1 979 23,4 1 939 46,3 783 18,7
15-19 1 108 21,1 1 249 23,7 789 15,0 1 237 23,5 2 336 44,4 958 18,2
20-24 770 19,9 739 19,1 396 10,2 996 25,7 1 284 33,1 701 18,1
25-29 804 18,7 755 17,5 444 10,3 1 208 28,1 1 273 29,6 780 18,1
30-34 1 074 19,7 1 064 19,5 514 9,4 1 614 29,6 1 397 25,7 1 056 19,4
35-39 1 112 19,2 1 150 19,9 434 7,5 1 910 33,0 1 202 20,8 997 17,2
40-44 1 347 20,7 1 207 18,6 451 6,9 2 332 35,9 1 233 19,0 1 045 16,1
45-49 1 414 22,1 1 250 19,5 458 7,2 2 455 38,3 996 15,6 1 035 16,2
50-54 1 545 22,1 1 473 21,0 465 6,6 2 782 39,7 956 13,6 1 003 14,3
55-59 1 656 23,6 1 542 22,0 463 6,6 2 958 42,2 759 10,8 846 12,1
60-64 1 635 23,3 1 705 24,3 495 7,0 3 045 43,4 647 9,2 703 10,0
65-69 1 504 24,8 1 811 29,9 444 7,3 2 467 40,7 449 7,4 509 8,4
70-74 1 529 25,3 2 000 33,2 452 7,5 2 460 40,8 402 6,7 477 7,9
75-79 1 339 24,9 2 109 39,2 374 7,0 2 176 40,4 337 6,3 420 7,8
80-84 1 165 25,7 1 967 43,4 342 7,5 1 761 38,8 269 5,9 344 7,6
85+ 978 28,2 1 643 47,4 307 8,9 1 494 43,1 261 7,5 333 9,6
24 583 24,7 26 445 26,6 8 597 8,6 38 104 38,3 16 567 16,7 14 335 14,4
0 66 34,2 59 30,6 43 22,3 43 22,3 66 34,2 52 26,9
1-4 206 22,8 277 30,7 134 14,9 182 20,2 240 26,6 131 14,5
5-9 375 19,3 458 23,6 297 15,3 435 22,4 700 36,1 276 14,2
10-14 762 23,7 847 26,3 521 16,2 774 24,0 1 347 41,8 656 20,4
15-19 974 23,9 996 24,5 614 15,1 927 22,8 1 823 44,8 879 21,6
20-24 681 21,4 674 21,2 317 10,0 727 22,9 1 038 32,7 569 17,9
25-29 830 22,0 799 21,1 398 10,5 828 21,9 1 171 31,0 701 18,5
30-34 902 21,0 941 21,9 395 9,2 964 22,4 1 268 29,5 812 18,9
35-39 920 19,3 936 19,6 326 6,8 1 235 25,9 1 221 25,6 933 19,6
40-44 1 139 21,4 1 050 19,7 395 7,4 1 521 28,6 1 241 23,3 949 17,8
45-49 1 225 22,1 1 117 20,2 372 6,7 1 833 33,1 991 17,9 994 17,9
50-54 1 340 22,8 1 078 18,4 338 5,8 2 296 39,1 867 14,8 916 15,6
55-59 1 488 23,9 1 280 20,5 381 6,1 2 564 41,1 668 10,7 834 13,4
60-64 1 689 27,3 1 474 23,8 379 6,1 2 549 41,2 535 8,6 697 11,3
65-69 1 747 28,2 1 561 25,2 419 6,8 2 627 42,4 466 7,5 635 10,2
70-74 2 139 27,5 2 188 28,1 562 7,2 3 499 45,0 552 7,1 773 9,9
75-79 2 472 26,8 2 850 31,0 682 7,4 4 353 47,3 689 7,5 977 10,6
80-84 2 538 26,3 3 421 35,4 884 9,2 4 751 49,2 750 7,8 1 079 11,2
85+ 3 090 27,8 4 440 39,9 1 140 10,2 5 997 53,9 935 8,4 1 472 13,2
Sight Hearing Communication Physical Intellectual Emotional
White
Males
Total
Total
Females
Age in years
All PES numbers are rounded to whole decimal numbers. The totals displayed may therefore differ slightly from the sum of the separate numbers Percentages take into account people with multiple disabilities.
Appendix 3 (continued): Number of disabled persons by population group, age group, sex and type of disability
55

South Africa
Type of housing unit
Male Female Total Male Female Total Male Female Total
House or brick structure on a separate stand or yard 3 719 703 2 518 760 6 238 462 3 471 250 2 291 499 5 762 749 248 453 227 261 475 713
Traditional dwelling/hut/structure made of traditional materials 741 294 913 493 1 654 787 650 804 803 980 1 454 785 90 490 109 512 200 002
Flat in block of flats 322 337 266 771 589 108 304 461 247 820 552 281 17 876 18 951 36 827
Town/cluster/semi-detached house (simplex, duplex, triplex) 191 110 128 758 319 868 181 624 121 073 302 697 9 486 7 685 17 171
House/flat/room in back yard 229 512 182 862 412 374 217 609 170 732 388 341 11 903 12 130 24 033
Informal dwelling/shack in backyard 285 305 174 221 459 526 268 441 160 230 428 671 16 864 13 991 30 855
Informal dwelling/shack NOT in backyard 845 921 530 785 1 376 706 791 844 486 073 1 277 918 54 076 44 712 98 788
Room/flatlet not in backyard but on a shared property 72 159 48 450 120 609 67 766 44 358 112 124 4 393 4 091 8 484
Caravan or tent 20 297 10 313 30 610 18 962 9 532 28 494 1 335 781 2 116
Private ship/boat 2 291 1 365 3 656 2 126 1 219 3 344 164 146 310
Total 6 429 929 4 775 776 11 205 705 5 974 888 4 336 517 10 311 404 455 040 439 259 894 299
Tenure status
Owned and fully paid off 2 421 310 2 203 991 4 625 301 2 211 535 1 981 995 4 193 530 209 775 221 995 431 771
Owned but not yet paid off 1 153 038 532 535 1 685 572 1 101 792 495 637 1 597 429 51 246 36 897 88 143
Rented 1 302 695 795 100 2 097 795 1 237 131 739 023 1 976 154 65 564 56 077 121 641
Occupied rent-free 1 552 886 1 244 151 2 797 037 1 424 429 1 119 862 2 544 291 128 456 124 290 252 746
Total 6 429 929 4 775 776 11 205 705 5 974 888 4 336 517 10 311 404 455 041 439 259 894 301
Piped water
Piped water inside dwelling 2 359 245 1 258 358 3 617 603 2 247 548 1 180 785 3 428 333 111 697 77 573 189 270
Piped water inside yard 1 864 222 1 389 640 3 253 861 1 732 213 1 258 981 2 991 194 132 008 130 659 262 667
Piped water on community stand: distance less than 200m
from dwelling 665 083 537 193 1 202 276 609 533 481 867 1 091 401 55 550 55 326 110 876
Piped water on community stand: distance greater than 200m
from dwelling 745 099 647 529 1 392 628 680 038 580 152 1 260 190 65 061 67 377 132 438
No access to piped water 796 281 943 056 1 739 337 705 556 834 731 1 540 287 90 725 108 325 199 050
Total 6 429 929 4 775 776 11 205 705 5 974 888 4 336 517 10 311 404 455 041 439 259 894 301
Energy source for lighting
Electricity 4 626 444 3 188 827 7 815 270 4 341 693 2 920 710 7 262 403 284 750 268 117 552 867
Gas 15 447 11 617 27 065 14 395 10 597 24 992 1 052 1 021 2 073
Paraffin 402 311 357 506 759 817 364 181 320 749 684 930 38 130 36 757 74 887
Candles 1 352 542 1 192 990 2 545 532 1 224 290 1 062 208 2 286 498 128 252 130 782 259 034
Solar 14 684 9 491 24 175 13 594 8 618 22 213 1 089 873 1 962
Other 18 501 15 345 33 845 16 734 13 635 30 368 1 767 1 710 3 477
Total 6 429 929 4 775 776 11 205 705 5 974 888 4 336 517 10 311 404 455 041 439 259 894 301
Total households Non-disabled heads of households Disabled heads of households
All PES numbers are rounded to whole decimal numbers. The totals displayed may therefore differ slightly from the sum of the separate numbers.
Appendix 4: Number of households by gender of head of household, type of housing unit, access to piped water and energy source for lighting (excluding households in collective living quarters)
56
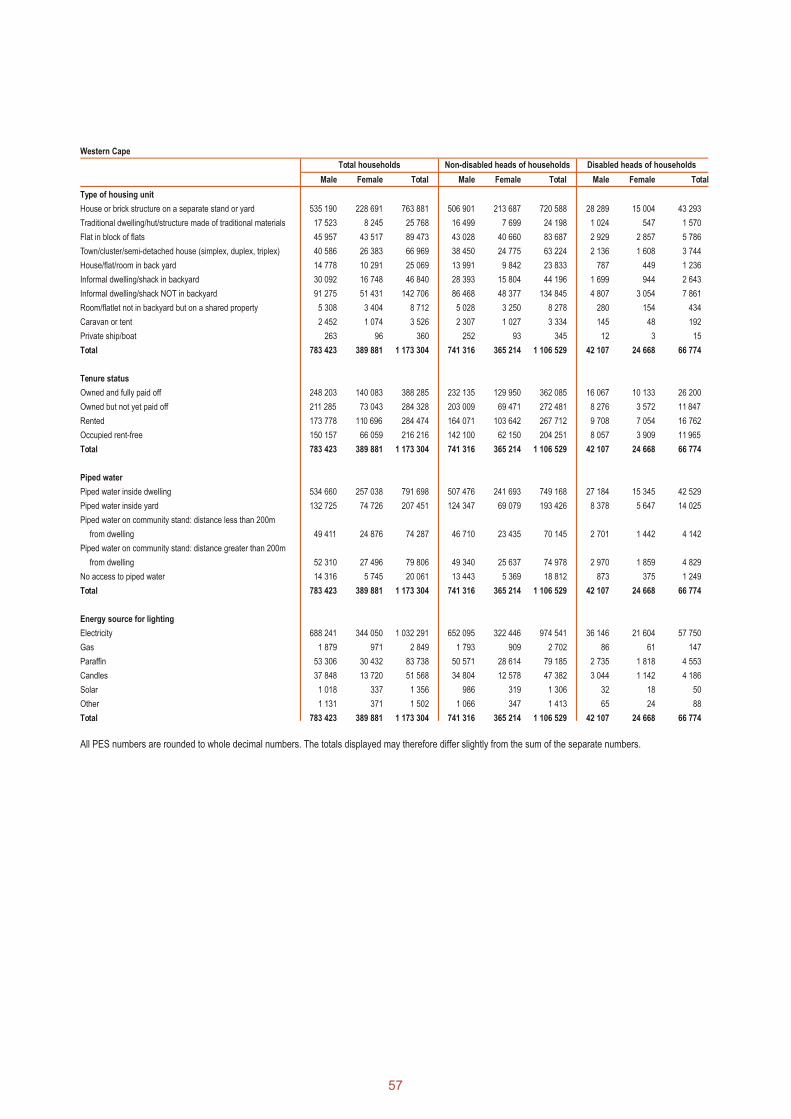
Western Cape
Type of housing unit
Male Female Total Male Female Total Male Female Total
House or brick structure on a separate stand or yard 535 190 228 691 763 881 506 901 213 687 720 588 28 289 15 004 43 293
Traditional dwelling/hut/structure made of traditional materials 17 523 8 245 25 768 16 499 7 699 24 198 1 024 547 1 570
Flat in block of flats 45 957 43 517 89 473 43 028 40 660 83 687 2 929 2 857 5 786
Town/cluster/semi-detached house (simplex, duplex, triplex) 40 586 26 383 66 969 38 450 24 775 63 224 2 136 1 608 3 744
House/flat/room in back yard 14 778 10 291 25 069 13 991 9 842 23 833 787 449 1 236
Informal dwelling/shack in backyard 30 092 16 748 46 840 28 393 15 804 44 196 1 699 944 2 643
Informal dwelling/shack NOT in backyard 91 275 51 431 142 706 86 468 48 377 134 845 4 807 3 054 7 861
Room/flatlet not in backyard but on a shared property 5 308 3 404 8 712 5 028 3 250 8 278 280 154 434
Caravan or tent 2 452 1 074 3 526 2 307 1 027 3 334 145 48 192
Private ship/boat 263 96 360 252 93 345 12 3 15
Total 783 423 389 881 1 173 304 741 316 365 214 1 106 529 42 107 24 668 66 774
Tenure status
Owned and fully paid off 248 203 140 083 388 285 232 135 129 950 362 085 16 067 10 133 26 200
Owned but not yet paid off 211 285 73 043 284 328 203 009 69 471 272 481 8 276 3 572 11 847
Rented 173 778 110 696 284 474 164 071 103 642 267 712 9 708 7 054 16 762
Occupied rent-free 150 157 66 059 216 216 142 100 62 150 204 251 8 057 3 909 11 965
Total 783 423 389 881 1 173 304 741 316 365 214 1 106 529 42 107 24 668 66 774
Piped water
Piped water inside dwelling 534 660 257 038 791 698 507 476 241 693 749 168 27 184 15 345 42 529
Piped water inside yard 132 725 74 726 207 451 124 347 69 079 193 426 8 378 5 647 14 025
Piped water on community stand: distance less than 200m
from dwelling 49 411 24 876 74 287 46 710 23 435 70 145 2 701 1 442 4 142
Piped water on community stand: distance greater than 200m
from dwelling 52 310 27 496 79 806 49 340 25 637 74 978 2 970 1 859 4 829
No access to piped water 14 316 5 745 20 061 13 443 5 369 18 812 873 375 1 249
Total 783 423 389 881 1 173 304 741 316 365 214 1 106 529 42 107 24 668 66 774
Energy source for lighting
Electricity 688 241 344 050 1 032 291 652 095 322 446 974 541 36 146 21 604 57 750
Gas 1 879 971 2 849 1 793 909 2 702 86 61 147
Paraffin 53 306 30 432 83 738 50 571 28 614 79 185 2 735 1 818 4 553
Candles 37 848 13 720 51 568 34 804 12 578 47 382 3 044 1 142 4 186
Solar 1 018 337 1 356 986 319 1 306 32 18 50
Other 1 131 371 1 502 1 066 347 1 413 65 24 88
Total 783 423 389 881 1 173 304 741 316 365 214 1 106 529 42 107 24 668 66 774
Total households Non-disabled heads of households Disabled heads of households
All PES numbers are rounded to whole decimal numbers. The totals displayed may therefore differ slightly from the sum of the separate numbers.
57
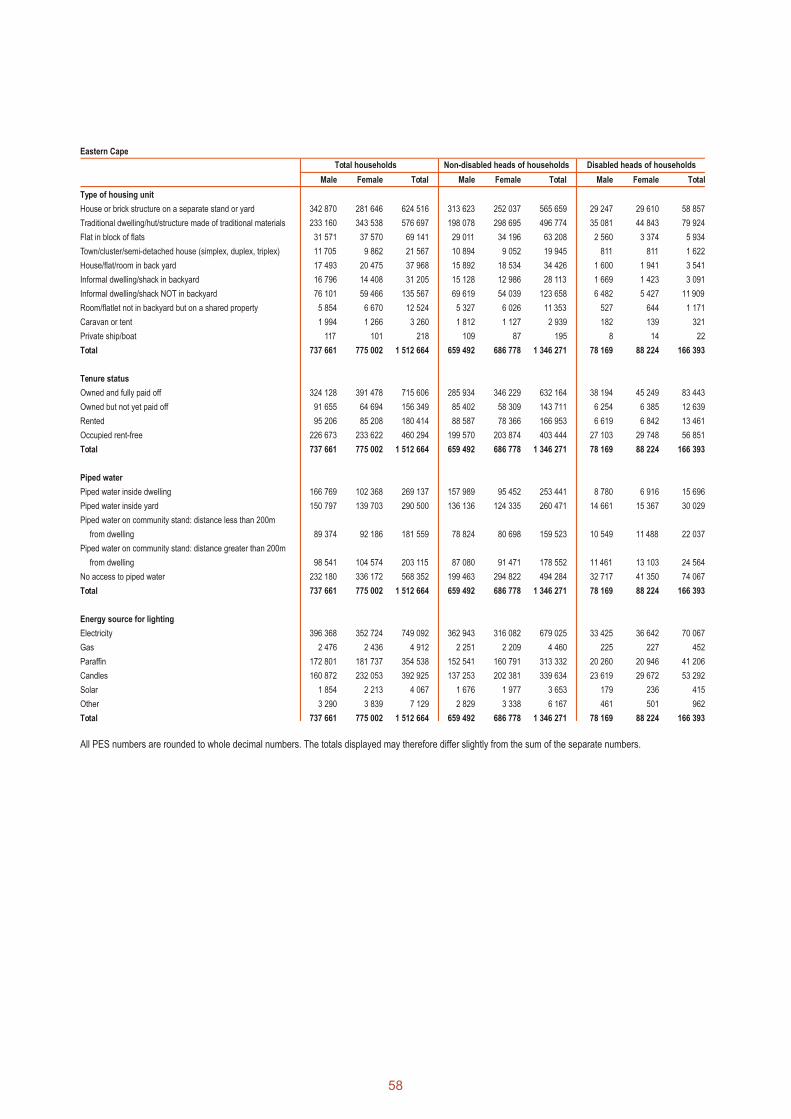
Eastern Cape
Type of housing unit
Male Female Total Male Female Total Male Female Total
House or brick structure on a separate stand or yard 342 870 281 646 624 516 313 623 252 037 565 659 29 247 29 610 58 857
Traditional dwelling/hut/structure made of traditional materials 233 160 343 538 576 697 198 078 298 695 496 774 35 081 44 843 79 924
Flat in block of flats 31 571 37 570 69 141 29 011 34 196 63 208 2 560 3 374 5 934
Town/cluster/semi-detached house (simplex, duplex, triplex) 11 705 9 862 21 567 10 894 9 052 19 945 811 811 1 622
House/flat/room in back yard 17 493 20 475 37 968 15 892 18 534 34 426 1 600 1 941 3 541
Informal dwelling/shack in backyard 16 796 14 408 31 205 15 128 12 986 28 113 1 669 1 423 3 091
Informal dwelling/shack NOT in backyard 76 101 59 466 135 567 69 619 54 039 123 658 6 482 5 427 11 909
Room/flatlet not in backyard but on a shared property 5 854 6 670 12 524 5 327 6 026 11 353 527 644 1 171
Caravan or tent 1 994 1 266 3 260 1 812 1 127 2 939 182 139 321
Private ship/boat 117 101 218 109 87 195 8 14 22
Total 737 661 775 002 1 512 664 659 492 686 778 1 346 271 78 169 88 224 166 393
Tenure status
Owned and fully paid off 324 128 391 478 715 606 285 934 346 229 632 164 38 194 45 249 83 443
Owned but not yet paid off 91 655 64 694 156 349 85 402 58 309 143 711 6 254 6 385 12 639
Rented 95 206 85 208 180 414 88 587 78 366 166 953 6 619 6 842 13 461
Occupied rent-free 226 673 233 622 460 294 199 570 203 874 403 444 27 103 29 748 56 851
Total 737 661 775 002 1 512 664 659 492 686 778 1 346 271 78 169 88 224 166 393
Piped water
Piped water inside dwelling 166 769 102 368 269 137 157 989 95 452 253 441 8 780 6 916 15 696
Piped water inside yard 150 797 139 703 290 500 136 136 124 335 260 471 14 661 15 367 30 029
Piped water on community stand: distance less than 200m
from dwelling 89 374 92 186 181 559 78 824 80 698 159 523 10 549 11 488 22 037
Piped water on community stand: distance greater than 200m
from dwelling 98 541 104 574 203 115 87 080 91 471 178 552 11 461 13 103 24 564
No access to piped water 232 180 336 172 568 352 199 463 294 822 494 284 32 717 41 350 74 067
Total 737 661 775 002 1 512 664 659 492 686 778 1 346 271 78 169 88 224 166 393
Energy source for lighting
Electricity 396 368 352 724 749 092 362 943 316 082 679 025 33 425 36 642 70 067
Gas 2 476 2 436 4 912 2 251 2 209 4 460 225 227 452
Paraffin 172 801 181 737 354 538 152 541 160 791 313 332 20 260 20 946 41 206
Candles 160 872 232 053 392 925 137 253 202 381 339 634 23 619 29 672 53 292
Solar 1 854 2 213 4 067 1 676 1 977 3 653 179 236 415
Other 3 290 3 839 7 129 2 829 3 338 6 167 461 501 962
Total 737 661 775 002 1 512 664 659 492 686 778 1 346 271 78 169 88 224 166 393
Total households Non-disabled heads of households Disabled heads of households
All PES numbers are rounded to whole decimal numbers. The totals displayed may therefore differ slightly from the sum of the separate numbers.
58
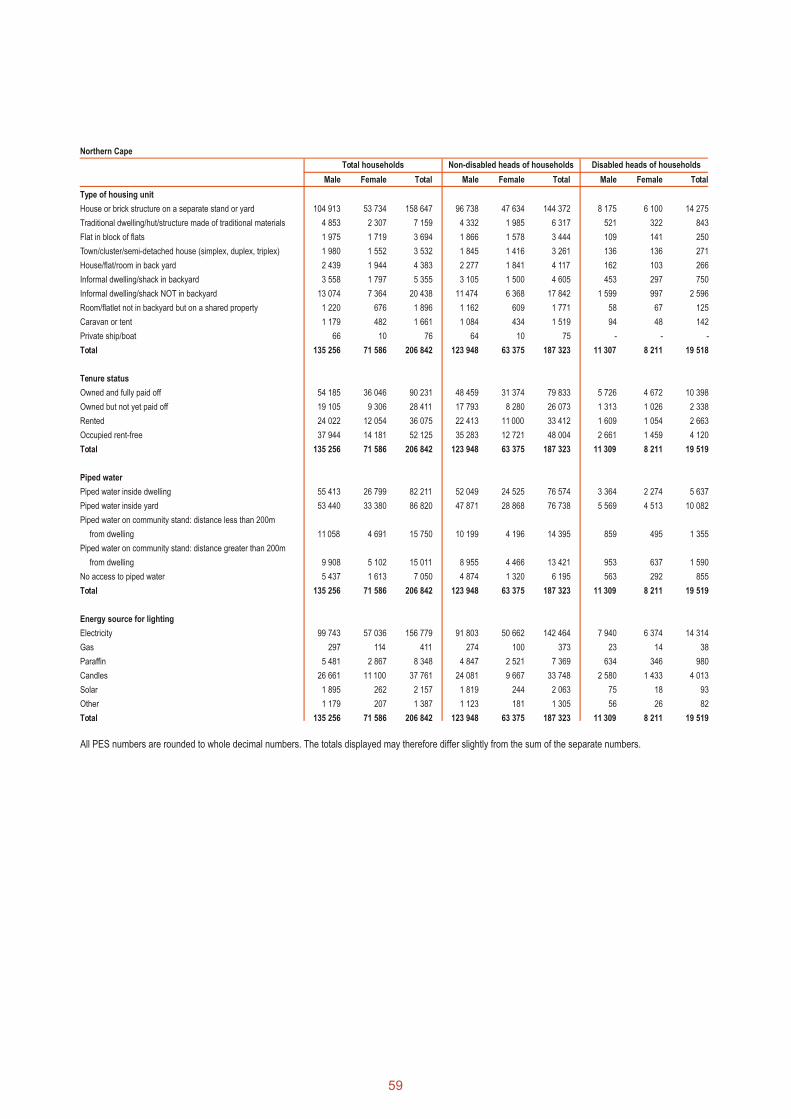
Northern Cape
Type of housing unit
Male Female Total Male Female Total Male Female Total
House or brick structure on a separate stand or yard 104 913 53 734 158 647 96 738 47 634 144 372 8 175 6 100 14 275
Traditional dwelling/hut/structure made of traditional materials 4 853 2 307 7 159 4 332 1 985 6 317 521 322 843
Flat in block of flats 1 975 1 719 3 694 1 866 1 578 3 444 109 141 250
Town/cluster/semi-detached house (simplex, duplex, triplex) 1 980 1 552 3 532 1 845 1 416 3 261 136 136 271
House/flat/room in back yard 2 439 1 944 4 383 2 277 1 841 4 117 162 103 266
Informal dwelling/shack in backyard 3 558 1 797 5 355 3 105 1 500 4 605 453 297 750
Informal dwelling/shack NOT in backyard 13 074 7 364 20 438 11 474 6 368 17 842 1 599 997 2 596
Room/flatlet not in backyard but on a shared property 1 220 676 1 896 1 162 609 1 771 58 67 125
Caravan or tent 1 179 482 1 661 1 084 434 1 519 94 48 142
Private ship/boat 66 10 76 64 10 75 - - -
Total 135 256 71 586 206 842 123 948 63 375 187 323 11 307 8 211 19 518
Tenure status
Owned and fully paid off 54 185 36 046 90 231 48 459 31 374 79 833 5 726 4 672 10 398
Owned but not yet paid off 19 105 9 306 28 411 17 793 8 280 26 073 1 313 1 026 2 338
Rented 24 022 12 054 36 075 22 413 11 000 33 412 1 609 1 054 2 663
Occupied rent-free 37 944 14 181 52 125 35 283 12 721 48 004 2 661 1 459 4 120
Total 135 256 71 586 206 842 123 948 63 375 187 323 11 309 8 211 19 519
Piped water
Piped water inside dwelling 55 413 26 799 82 211 52 049 24 525 76 574 3 364 2 274 5 637
Piped water inside yard 53 440 33 380 86 820 47 871 28 868 76 738 5 569 4 513 10 082
Piped water on community stand: distance less than 200m
from dwelling 11 058 4 691 15 750 10 199 4 196 14 395 859 495 1 355
Piped water on community stand: distance greater than 200m
from dwelling 9 908 5 102 15 011 8 955 4 466 13 421 953 637 1 590
No access to piped water 5 437 1 613 7 050 4 874 1 320 6 195 563 292 855
Total 135 256 71 586 206 842 123 948 63 375 187 323 11 309 8 211 19 519
Energy source for lighting
Electricity 99 743 57 036 156 779 91 803 50 662 142 464 7 940 6 374 14 314
Gas 297 114 411 274 100 373 23 14 38
Paraffin 5 481 2 867 8 348 4 847 2 521 7 369 634 346 980
Candles 26 661 11 100 37 761 24 081 9 667 33 748 2 580 1 433 4 013
Solar 1 895 262 2 157 1 819 244 2 063 75 18 93
Other 1 179 207 1 387 1 123 181 1 305 56 26 82
Total 135 256 71 586 206 842 123 948 63 375 187 323 11 309 8 211 19 519
Total households Non-disabled heads of households Disabled heads of households
All PES numbers are rounded to whole decimal numbers. The totals displayed may therefore differ slightly from the sum of the separate numbers.
59
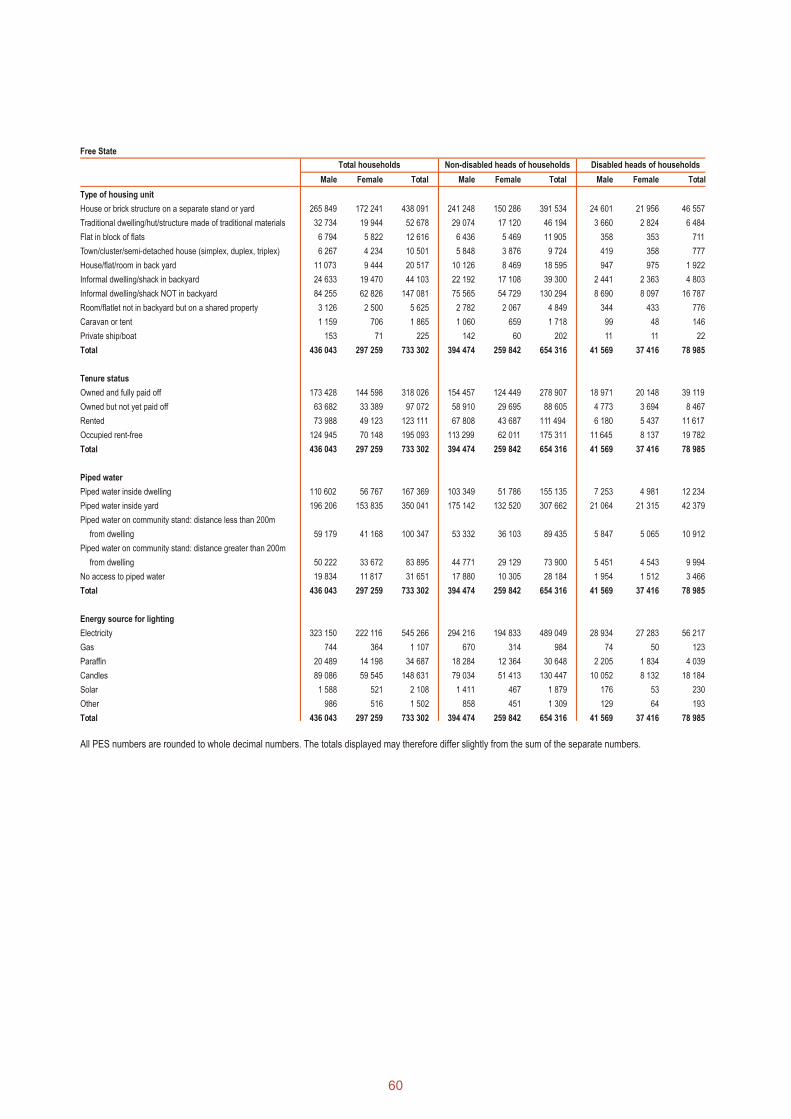
Free State
Type of housing unit
Male Female Total Male Female Total Male Female Total
House or brick structure on a separate stand or yard 265 849 172 241 438 091 241 248 150 286 391 534 24 601 21 956 46 557
Traditional dwelling/hut/structure made of traditional materials 32 734 19 944 52 678 29 074 17 120 46 194 3 660 2 824 6 484
Flat in block of flats 6 794 5 822 12 616 6 436 5 469 11 905 358 353 711
Town/cluster/semi-detached house (simplex, duplex, triplex) 6 267 4 234 10 501 5 848 3 876 9 724 419 358 777
House/flat/room in back yard 11 073 9 444 20 517 10 126 8 469 18 595 947 975 1 922
Informal dwelling/shack in backyard 24 633 19 470 44 103 22 192 17 108 39 300 2 441 2 363 4 803
Informal dwelling/shack NOT in backyard 84 255 62 826 147 081 75 565 54 729 130 294 8 690 8 097 16 787
Room/flatlet not in backyard but on a shared property 3 126 2 500 5 625 2 782 2 067 4 849 344 433 776
Caravan or tent 1 159 706 1 865 1 060 659 1 718 99 48 146
Private ship/boat 153 71 225 142 60 202 11 11 22
Total 436 043 297 259 733 302 394 474 259 842 654 316 41 569 37 416 78 985
Tenure status
Owned and fully paid off 173 428 144 598 318 026 154 457 124 449 278 907 18 971 20 148 39 119
Owned but not yet paid off 63 682 33 389 97 072 58 910 29 695 88 605 4 773 3 694 8 467
Rented 73 988 49 123 123 111 67 808 43 687 111 494 6 180 5 437 11 617
Occupied rent-free 124 945 70 148 195 093 113 299 62 011 175 311 11 645 8 137 19 782
Total 436 043 297 259 733 302 394 474 259 842 654 316 41 569 37 416 78 985
Piped water
Piped water inside dwelling 110 602 56 767 167 369 103 349 51 786 155 135 7 253 4 981 12 234
Piped water inside yard 196 206 153 835 350 041 175 142 132 520 307 662 21 064 21 315 42 379
Piped water on community stand: distance less than 200m
from dwelling 59 179 41 168 100 347 53 332 36 103 89 435 5 847 5 065 10 912
Piped water on community stand: distance greater than 200m
from dwelling 50 222 33 672 83 895 44 771 29 129 73 900 5 451 4 543 9 994
No access to piped water 19 834 11 817 31 651 17 880 10 305 28 184 1 954 1 512 3 466
Total 436 043 297 259 733 302 394 474 259 842 654 316 41 569 37 416 78 985
Energy source for lighting
Electricity 323 150 222 116 545 266 294 216 194 833 489 049 28 934 27 283 56 217
Gas 744 364 1 107 670 314 984 74 50 123
Paraffin 20 489 14 198 34 687 18 284 12 364 30 648 2 205 1 834 4 039
Candles 89 086 59 545 148 631 79 034 51 413 130 447 10 052 8 132 18 184
Solar 1 588 521 2 108 1 411 467 1 879 176 53 230
Other 986 516 1 502 858 451 1 309 129 64 193
Total 436 043 297 259 733 302 394 474 259 842 654 316 41 569 37 416 78 985
Total households Non-disabled heads of households Disabled heads of households
All PES numbers are rounded to whole decimal numbers. The totals displayed may therefore differ slightly from the sum of the separate numbers.
60
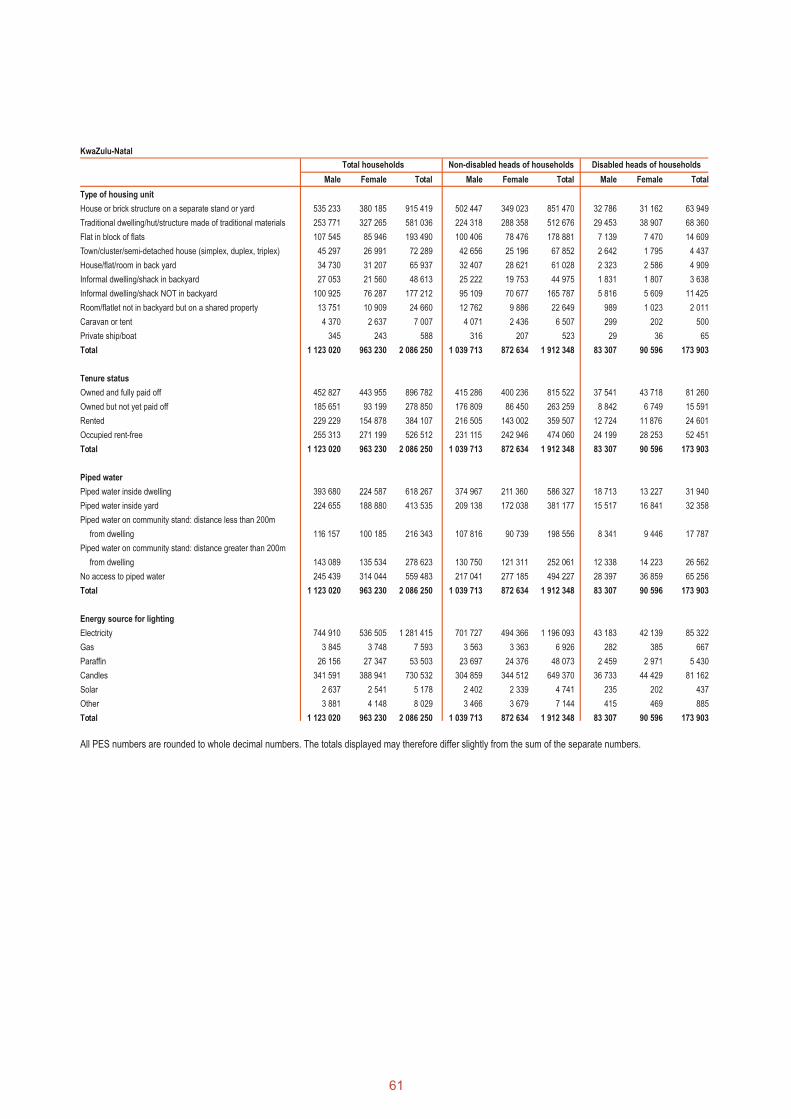
KwaZulu-Natal
Type of housing unit
Male Female Total Male Female Total Male Female Total
House or brick structure on a separate stand or yard 535 233 380 185 915 419 502 447 349 023 851 470 32 786 31 162 63 949
Traditional dwelling/hut/structure made of traditional materials 253 771 327 265 581 036 224 318 288 358 512 676 29 453 38 907 68 360
Flat in block of flats 107 545 85 946 193 490 100 406 78 476 178 881 7 139 7 470 14 609
Town/cluster/semi-detached house (simplex, duplex, triplex) 45 297 26 991 72 289 42 656 25 196 67 852 2 642 1 795 4 437
House/flat/room in back yard 34 730 31 207 65 937 32 407 28 621 61 028 2 323 2 586 4 909
Informal dwelling/shack in backyard 27 053 21 560 48 613 25 222 19 753 44 975 1 831 1 807 3 638
Informal dwelling/shack NOT in backyard 100 925 76 287 177 212 95 109 70 677 165 787 5 816 5 609 11 425
Room/flatlet not in backyard but on a shared property 13 751 10 909 24 660 12 762 9 886 22 649 989 1 023 2 011
Caravan or tent 4 370 2 637 7 007 4 071 2 436 6 507 299 202 500
Private ship/boat 345 243 588 316 207 523 29 36 65
Total 1 123 020 963 230 2 086 250 1 039 713 872 634 1 912 348 83 307 90 596 173 903
Tenure status
Owned and fully paid off 452 827 443 955 896 782 415 286 400 236 815 522 37 541 43 718 81 260
Owned but not yet paid off 185 651 93 199 278 850 176 809 86 450 263 259 8 842 6 749 15 591
Rented 229 229 154 878 384 107 216 505 143 002 359 507 12 724 11 876 24 601
Occupied rent-free 255 313 271 199 526 512 231 115 242 946 474 060 24 199 28 253 52 451
Total 1 123 020 963 230 2 086 250 1 039 713 872 634 1 912 348 83 307 90 596 173 903
Piped water
Piped water inside dwelling 393 680 224 587 618 267 374 967 211 360 586 327 18 713 13 227 31 940
Piped water inside yard 224 655 188 880 413 535 209 138 172 038 381 177 15 517 16 841 32 358
Piped water on community stand: distance less than 200m
from dwelling 116 157 100 185 216 343 107 816 90 739 198 556 8 341 9 446 17 787
Piped water on community stand: distance greater than 200m
from dwelling 143 089 135 534 278 623 130 750 121 311 252 061 12 338 14 223 26 562
No access to piped water 245 439 314 044 559 483 217 041 277 185 494 227 28 397 36 859 65 256
Total 1 123 020 963 230 2 086 250 1 039 713 872 634 1 912 348 83 307 90 596 173 903
Energy source for lighting
Electricity 744 910 536 505 1 281 415 701 727 494 366 1 196 093 43 183 42 139 85 322
Gas 3 845 3 748 7 593 3 563 3 363 6 926 282 385 667
Paraffin 26 156 27 347 53 503 23 697 24 376 48 073 2 459 2 971 5 430
Candles 341 591 388 941 730 532 304 859 344 512 649 370 36 733 44 429 81 162
Solar 2 637 2 541 5 178 2 402 2 339 4 741 235 202 437
Other 3 881 4 148 8 029 3 466 3 679 7 144 415 469 885
Total 1 123 020 963 230 2 086 250 1 039 713 872 634 1 912 348 83 307 90 596 173 903
Total households Non-disabled heads of households Disabled heads of households
All PES numbers are rounded to whole decimal numbers. The totals displayed may therefore differ slightly from the sum of the separate numbers.
61

North West
Type of housing unit
Male Female Total Male Female Total Male Female Total
House or brick structure on a separate stand or yard 361 457 259 906 621 363 330 006 229 333 559 339 31 451 30 573 62 024
Traditional dwelling/hut/structure made of traditional materials 28 126 21 295 49 422 24 278 17 882 42 160 3 848 3 414 7 262
Flat in block of flats 5 628 4 542 10 170 5 358 4 178 9 537 270 364 633
Town/cluster/semi-detached house (simplex, duplex, triplex) 3 667 2 453 6 120 3 389 2 183 5 572 278 271 548
House/flat/room in back yard 14 332 11 312 25 644 13 447 10 487 23 934 885 825 1 710
Informal dwelling/shack in backyard 32 619 19 316 51 935 30 427 17 519 47 946 2 192 1 797 3 989
Informal dwelling/shack NOT in backyard 95 279 60 222 155 501 88 172 54 367 142 539 7 107 5 855 12 962
Room/flatlet not in backyard but on a shared property 4 343 2 363 6 705 4 089 2 172 6 261 254 191 444
Caravan or tent 1 222 516 1 738 1 146 457 1 603 76 59 135
Private ship/boat 264 141 405 237 124 361 27 17 44
Total 546 937 382 067 929 004 500 550 338 701 839 251 46 387 43 365 89 753
Tenure status
Owned and fully paid off 259 375 219 086 478 460 233 045 192 249 425 295 26 329 26 836 53 166
Owned but not yet paid off 53 597 27 431 81 028 50 623 25 267 75 890 2 974 2 164 5 138
Rented 96 132 47 755 143 887 91 795 44 354 136 149 4 337 3 402 7 738
Occupied rent-free 137 833 87 795 225 628 125 086 76 832 201 917 12 747 10 963 23 711
Total 546 937 382 067 929 004 500 550 338 701 839 251 46 387 43 365 89 753
Piped water
Piped water inside dwelling 111 152 58 513 169 665 105 814 54 757 160 571 5 338 3 756 9 094
Piped water inside yard 189 211 130 937 320 149 175 470 117 834 293 304 13 741 13 103 26 845
Piped water on community stand: distance less than 200m
from dwelling 86 464 67 301 153 765 77 026 57 980 135 005 9 438 9 322 18 760
Piped water on community stand: distance greater than 200m
from dwelling 86 863 69 982 156 846 76 826 60 045 136 871 10 037 9 938 19 975
No access to piped water 73 247 55 333 128 580 65 414 48 086 113 500 7 833 7 247 15 080
Total 546 937 382 067 929 004 500 550 338 701 839 251 46 387 43 365 89 753
Energy source for lighting
Electricity 378 090 276 828 654 918 348 858 247 006 595 864 29 232 29 822 59 054
Gas 591 301 892 559 278 837 33 23 55
Paraffin 17 510 10 510 28 020 15 452 9 113 24 565 2 058 1 396 3 455
Candles 148 570 93 213 241 783 133 703 81 252 214 955 14 868 11 960 26 828
Solar 827 485 1 312 767 425 1 192 60 60 120
Other 1 349 730 2 079 1 213 626 1 839 136 104 241
Total 546 937 382 067 929 004 500 550 338 701 839 251 46 387 43 365 89 753
Total households Non-disabled heads of households Disabled heads of households
All PES numbers are rounded to whole decimal numbers. The totals displayed may therefore differ slightly from the sum of the separate numbers.
62
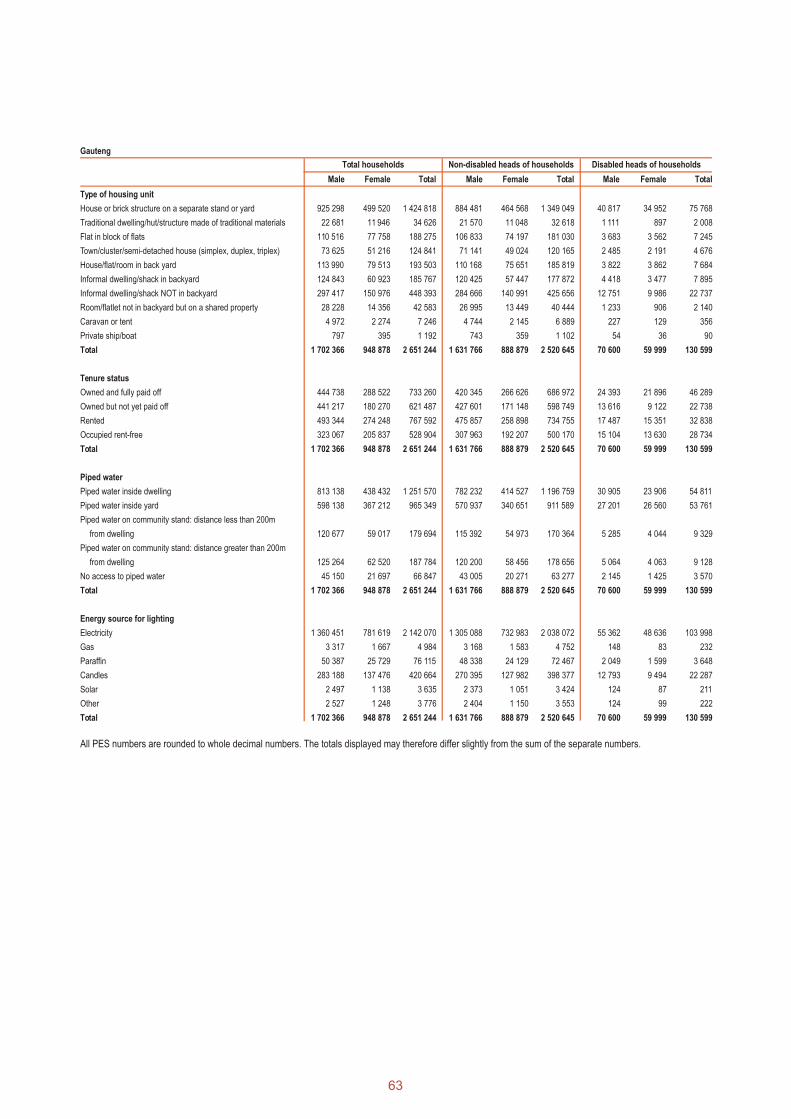
Gauteng
Type of housing unit
Male Female Total Male Female Total Male Female Total
House or brick structure on a separate stand or yard 925 298 499 520 1 424 818 884 481 464 568 1 349 049 40 817 34 952 75 768
Traditional dwelling/hut/structure made of traditional materials 22 681 11 946 34 626 21 570 11 048 32 618 1 111 897 2 008
Flat in block of flats 110 516 77 758 188 275 106 833 74 197 181 030 3 683 3 562 7 245
Town/cluster/semi-detached house (simplex, duplex, triplex) 73 625 51 216 124 841 71 141 49 024 120 165 2 485 2 191 4 676
House/flat/room in back yard 113 990 79 513 193 503 110 168 75 651 185 819 3 822 3 862 7 684
Informal dwelling/shack in backyard 124 843 60 923 185 767 120 425 57 447 177 872 4 418 3 477 7 895
Informal dwelling/shack NOT in backyard 297 417 150 976 448 393 284 666 140 991 425 656 12 751 9 986 22 737
Room/flatlet not in backyard but on a shared property 28 228 14 356 42 583 26 995 13 449 40 444 1 233 906 2 140
Caravan or tent 4 972 2 274 7 246 4 744 2 145 6 889 227 129 356
Private ship/boat 797 395 1 192 743 359 1 102 54 36 90
Total 1 702 366 948 878 2 651 244 1 631 766 888 879 2 520 645 70 600 59 999 130 599
Tenure status
Owned and fully paid off 444 738 288 522 733 260 420 345 266 626 686 972 24 393 21 896 46 289
Owned but not yet paid off 441 217 180 270 621 487 427 601 171 148 598 749 13 616 9 122 22 738
Rented 493 344 274 248 767 592 475 857 258 898 734 755 17 487 15 351 32 838
Occupied rent-free 323 067 205 837 528 904 307 963 192 207 500 170 15 104 13 630 28 734
Total 1 702 366 948 878 2 651 244 1 631 766 888 879 2 520 645 70 600 59 999 130 599
Piped water
Piped water inside dwelling 813 138 438 432 1 251 570 782 232 414 527 1 196 759 30 905 23 906 54 811
Piped water inside yard 598 138 367 212 965 349 570 937 340 651 911 589 27 201 26 560 53 761
Piped water on community stand: distance less than 200m
from dwelling 120 677 59 017 179 694 115 392 54 973 170 364 5 285 4 044 9 329
Piped water on community stand: distance greater than 200m
from dwelling 125 264 62 520 187 784 120 200 58 456 178 656 5 064 4 063 9 128
No access to piped water 45 150 21 697 66 847 43 005 20 271 63 277 2 145 1 425 3 570
Total 1 702 366 948 878 2 651 244 1 631 766 888 879 2 520 645 70 600 59 999 130 599
Energy source for lighting
Electricity 1 360 451 781 619 2 142 070 1 305 088 732 983 2 038 072 55 362 48 636 103 998
Gas 3 317 1 667 4 984 3 168 1 583 4 752 148 83 232
Paraffin 50 387 25 729 76 115 48 338 24 129 72 467 2 049 1 599 3 648
Candles 283 188 137 476 420 664 270 395 127 982 398 377 12 793 9 494 22 287
Solar 2 497 1 138 3 635 2 373 1 051 3 424 124 87 211
Other 2 527 1 248 3 776 2 404 1 150 3 553 124 99 222
Total 1 702 366 948 878 2 651 244 1 631 766 888 879 2 520 645 70 600 59 999 130 599
Total households Non-disabled heads of households Disabled heads of households
All PES numbers are rounded to whole decimal numbers. The totals displayed may therefore differ slightly from the sum of the separate numbers.
63

Limpopo
Type of housing unit
Male Female Total Male Female Total Male Female Total
House or brick structure on a separate stand or yard 374 198 443 925 818 123 343 201 407 081 750 283 30 997 36 843 67 840
Traditional dwelling/hut/structure made of traditional materials 95 968 136 534 232 502 86 038 124 167 210 205 9 931 12 366 22 297
Flat in block of flats 4 458 4 577 9 036 4 131 4 156 8 288 327 421 748
Town/cluster/semi-detached house (simplex, duplex, triplex) 3 944 3 448 7 393 3 708 3 210 6 918 236 238 474
House/flat/room in back yard 10 814 11 385 22 199 10 101 10 587 20 688 713 798 1 511
Informal dwelling/shack in backyard 11 264 9 941 21 205 10 405 9 135 19 540 859 807 1 665
Informal dwelling/shack NOT in backyard 31 756 25 174 56 930 29 745 23 456 53 200 2 012 1 719 3 730
Room/flatlet not in backyard but on a shared property 4 880 4 824 9 703 4 581 4 462 9 043 298 362 660
Caravan or tent 1 658 808 2 466 1 533 742 2 276 124 66 190
Private ship/boat 193 215 409 175 199 374 18 17 35
Total 539 133 640 832 1 179 965 493 618 587 196 1 080 814 45 515 53 636 99 151
Tenure status
Owned and fully paid off 283 526 375 080 658 607 258 376 344 282 602 658 25 151 30 798 55 949
Owned but not yet paid off 33 335 28 130 61 465 31 062 25 847 56 910 2 273 2 283 4 556
Rented 40 129 23 201 63 330 38 258 21 742 60 000 1 871 1 460 3 330
Occupied rent-free 182 142 214 421 396 563 165 922 195 324 361 246 16 220 19 096 35 316
Total 539 133 640 832 1 179 965 493 618 587 196 1 080 814 45 515 53 636 99 151
Piped water
Piped water inside dwelling 66 715 44 230 110 945 63 223 41 499 104 722 3 492 2 731 6 223
Piped water inside yard 164 530 177 911 342 440 152 163 164 233 316 396 12 367 13 678 26 045
Piped water on community stand: distance less than 200m
from dwelling 80 264 106 956 187 220 72 614 97 423 170 037 7 650 9 533 17 182
Piped water on community stand: distance greater than 200m
from dwelling 119 406 160 116 279 523 108 489 146 614 255 103 10 917 13 502 24 420
No access to piped water 108 218 151 619 259 837 97 130 137 427 234 556 11 088 14 193 25 281
Total 539 133 640 832 1 179 965 493 618 587 196 1 080 814 45 515 53 636 99 151
Energy source for lighting
Electricity 346 825 405 865 752 691 318 881 372 420 691 301 27 944 33 445 61 389
Gas 1 063 1 009 2 072 1 000 957 1 957 63 53 116
Paraffin 37 832 52 588 90 420 34 035 48 065 82 100 3 797 4 523 8 320
Candles 149 212 176 622 325 834 135 879 161 418 297 297 13 333 15 204 28 537
Solar 1 593 1 576 3 169 1 454 1 427 2 882 139 148 288
Other 2 607 3 171 5 778 2 369 2 908 5 277 238 263 501
Total 539 133 640 832 1 179 965 493 618 587 196 1 080 814 45 515 53 636 99 151
Total households Disabled heads of householdsNon-disabled heads of households
All PES numbers are rounded to whole decimal numbers. The totals displayed may therefore differ slightly from the sum of the separate numbers.
64


