Word Count: 6,646 + 7 Figures = 8,396 words 39 40 41 42
Submitted for presentation at the Transportation Research Board Annual Meeting and publication in the 43 Transportation Research Record 44
45 46 47 48
49
TRB 2014 Annual Meeting Paper revised from original submittal.
Brisson, Gebhart, Womeldorff, and Sall
1
ABSTRACT 1 2 Several land use and transportation plans propose changes that would affect the “Core” of San Francisco. The Core 3 encompasses the greater Downtown area, including the South of Market (SoMa) neighborhood. SoMa is currently 4 comprised of a predominantly one-way street grid with long blocks of multi-lane arterial streets designed to carry 5 traffic from Downtown to the city’s major regional freeway access points. With at least 48,000 housing units and 6 122,000 more jobs expected in this area, San Francisco has developed plans to aggressively reduce number of 7 general purpose travel lanes on many streets to improve livability and better balance travel options amongst modes. 8 This paper presents analysis and findings of an effort to use quantitative analysis to identify the cumulative 9 transportation performance effects of these proposed changes. The paper presents a combination of activity-based 10 travel demand model, traffic microsimulation, and off-model analysis to describe one of the key problems identified 11 – that plans for the Core could lead to a “carmaggedon” scenario (i.e perpetual gridlock) where the forecast level of 12 auto demand “breaks” the Core network—a particular problem because of the negative impact perpetual gridlock 13 would have for transit operating at-grade. A range of strategies to reduce auto demand are evaluated for their 14 effectiveness, finding that demand management and mobility improvement strategies are essential. The paper closes 15 with two key discussion areas: 1) opportunities and challenges to making transit, walking, and cycling function 16 effectively in extremely congested conditions; 2) a need for the city evolve from the typical forecasting/analysis 17 approaches to long-range transportation planning to solve tomorrow’s transport challenges. 18
19
TRB 2014 Annual Meeting Paper revised from original submittal.
Brisson, Gebhart, Womeldorff, and Sall
2
INTRODUCTION 1 To see an example of how traffic congestion impacts other modes of transportation today, you only need to 2 stand for a moment on a street in Downtown, San Francisco during rush hour. You will likely see private autos 3 illegally trespassing in unprotected bus lanes. You will see 50+ passengers on a bus waiting for a single motorist to 4 make a right turn through a pedestrian-filled intersection. You will see frustrated motorists block intersections 5 because they have already waited too long to cross. You will see cyclists risking their lives navigating the slim and 6 unpredictable gaps between vehicles. This problem—of congestion, and its negative travel time, reliability, and 7 safety impacts to all modes of transportation—has been of particular interest to San Francisco given plans underway 8 to rapidly intensify land uses while reducing the number of general purpose travel lanes on many streets to increase 9 livability. Given this context, the City has struggled with questions such as: how much can auto congestion’s 10 impacts on other modes be mitigated by simple low-cost solutions or are major capital investments needed? Can we, 11 and/or should we strive to mitigate congestion? What level of intervention is needed to maintain a safe, habitable 12 urban environment while providing sufficient mobility to maintain the City’s economic competitiveness? This paper 13 explores these challenging questions and analyzes potential solutions. 14
15 BACKGROUND 16
San Francisco is a city recognized for its leadership in planning for transit-oriented growth. The City’s 17 Charter even has a Transit First policy that states that, "decisions regarding the use of limited public street and 18 sidewalk space shall encourage the use of public rights of way by pedestrians, bicyclists, and public transit."(1) The 19 City’s currently adopted or underway land use plans call for a significant increase of 48,000 housing units and 20 122,000 jobs within the city’s Core (2). The city has made planning for this growth a policy priority. In addition, the 21 Bay Area region (population of approximately 7 million) looks to San Francisco, as well as the other core cities of 22 the region (Oakland and San Jose) as the most important locations to focus most growth due to the existing 23 infrastructure and density within these locations. In fact, in the recently adopted Plan Bay Area long-range land use 24 and transportation plan., San Francisco is expected to take on approximately 92,000 housing units and 190,000 jobs 25 to help achieve the region’s greenhouse gas reduction goals (3). Citywide, this expected growth represents 26 approximately a 25% increase in housing and a 34% increase in jobs, relative to today’s levels citywide. 27 Within this context, San Francisco has placed emphasis on planning for growth within the “Core” of the 28 city, generally those areas adjacent to the Downtown/Civic Center job centers. Combined, approximately 60% of 29 growth in housing units and 85% growth in jobs has been planned to be accommodated in the Core, with a lot of it 30 focused in the neighborhoods directly south of Downtown: the South of Market (SoMa) and Mission Bay 31 neighborhoods (4). SoMa is known for its multi-lane one-way arterial streets that provide access between 32 Downtown and the regional freeway network. As a 33 result of the needs of existing SoMa residents, as well 34 as in response to growth planned, there have been 35 significant efforts to develop and implement plans to 36 increase the neighborhood’s livability by re-purposing 37 right-of-way of general purpose lanes to provide safer, 38 more attractive non-motorized facilities and faster, 39 more reliable transit. Mission Bay, just south of SoMa 40 is a redevelopment area with a research and heath-care 41 oriented master plan in the process of building out, and 42 separated from SoMa by a channel to the Bay, with 43 only two streets connecting north-south to SoMa (see 44 Figure 1). 45
The San Francisco County Transportation 46 Authority (Transportation Authority) undertook a 47 focused study of the Core to inform the 2013 update to 48 the San Francisco Transportation Plan (SFTP), San 49 Francisco’s long-range, countywide transportation plan 50 that prioritizes transportation investments and 51 recommends policies to support the city’s 52 transportation goals. The purpose of this analysis, 53 known as the Core Network Circulation Study (Study) 54 was to analyze the cumulative impact of growth and 55
FIGURE 1 Core Study Area
TRB 2014 Annual Meeting Paper revised from original submittal.
Brisson, Gebhart, Womeldorff, and Sall
3
changes to the transportation network; identify transportation performance problems; and propose recommendations. 1 The analysis revealed three key problems: 1) the forecast increase in auto trip-making caused by the 2 intensifying land use would result in more auto demand than could be served, in particular given concurrent projects 3 to promote livability through reducing private vehicle capacity—in other words, if the demand for vehicle travel 4 forecast were realized, a perpetual gridlock or “carmageddon” scenario was expected given current plans; 2) even if 5 auto demand was to be substantially reduced, significant transit performance challenges remained; and 3) the overall 6 increase in trips of all modes would exacerbate multi-modal conflicts endangering the safety of pedestrian and 7 cyclists. The purpose of this paper is to describe the methodology, findings, policy implications, limitations, and 8 conclusions related to the first problem (the problem of “carmaggedon”). 9 10 METHODOLOGY/ANALYSIS APPROACH 11
The Study’s approach to identifying problems relied on an evaluation framework that included metrics 12 related to performance of each mode of transportation, including transit, walking, cycling, and private vehicle travel. 13 The analysis proceeded in three phases: first, a baseline travel market analysis was conducted to understand who is 14 traveling in the Core, in particular which high auto trip markets affected the Core; next, transportation performance 15 was assessed and problems identified, including the problem that is the focus of this paper, forecast perpetual 16 gridlock congestion during peak hours; finally, effectiveness of strategies to respond to problem areas were 17 identified and evaluated. 18
Two main scenarios were considered to inform the analysis: a “Base” year, representing current conditions, 19 and a “Planned Future” horizon, that included all land use and transportation network changes planned for in the 20 2035-2040 timeframe. The study team chose the PM peak hour as representative of a typical daily “worst case” 21 scenario. 22 A variety of analysis tools were used including: 23
The Authority’s activity-based travel demand model, the San Francisco Chained Activity Modeling 24 Process (SF-CHAMP) (5). SF-CHAMP incorporates a state-of-the-art approach to forecasting travel 25 demand, sensitive to a broad array of conditions that influence travelers’ choices. It incorporates the 26 most recent 2010 Census household travel data, along with calibration to observed data including 27 traffic volumes and transit ridership. 28
Micro-simulation traffic analysis software, SimTraffic, which was used to determine how the level of 29 auto trip-making demand forecast in SF-CHAMP would affect on-the-ground performance during PM 30 peak hour conditions. As compared to SF-CHAMP, SimTraffic better accounts for delays under 31 congested conditions and represents more detailed network characteristics such as traffic signal 32 phasing, coordination, turn lanes, and the effects of queuing between intersections. 33
Off-model techniques customized to understand the effectiveness of strategies that are not currently 34 represented in SF-CHAMP or SimTraffic. These methodologies are summarized in the following 35 section alongside descriptions of the strategies considered. More detailed documentation is available as 36 a technical appendix (6). 37
38 FINDINGS 39 This section presents findings from each of the three phases of the analysis: travel markets, transportation 40 performance problems, and effectiveness of strategies. 41 42 1. Travel Markets 43
The Travel Market analysis investigates the 44 purpose and characteristics of travel in the Core during 45 PM peak hours including: travel mode, common origins 46 and destinations, and breakdown between trips passing 47 through versus originating or destined to the Core. This 48 was a focus, as understanding the major and changing 49 travel markets would inform which strategies would most 50 effectively respond to problems identified. 51
Figure 2 summarizes overall trip-making levels 52 in Downtown and SoMa/Mission Bay today and in the 53 Planned Future using SF-CHAMP model output for each 54 scenario. SoMa/Mission Bay is responsible for most of 55 the growth in trip-making—about twice as many in the 56
FIGURE 2 Trips to/from/within Downtown and
SoMa/Mission Bay: Base vs. Planned Future, pm peak
Source: SF-CHAMP 4.3, Focused Growth
TRB 2014 Annual Meeting Paper revised from original submittal.
Brisson, Gebhart, Womeldorff, and Sall
4
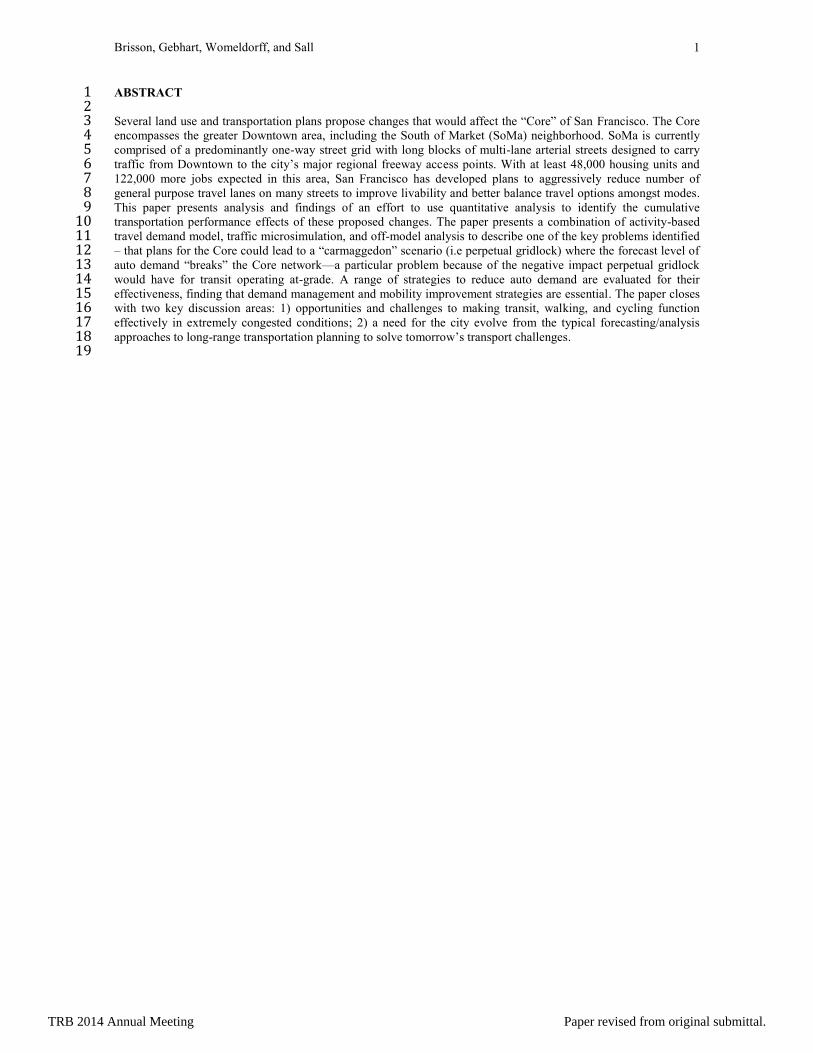
Planned Future than today. However, Downtown still attracts the most total trips. As shown in Figure 3, nearly all 1 the new auto trips to or from the Core in the future are generated by SoMa/Mission Bay. 2
Figures 2 and 3 show travel occurring to, from, or within the Core, but many other trips pass through the 3 Core without starting or ending there. Figure 4 includes this larger universe of trips and breaks down trips between 4 those that start or end somewhere else within San Francisco (i.e. local), versus those that are regional and have their 5 other end in another Bay Area county. Viewing trip ends and through trips together indicates that over half of the 6 vehicles traveling on the SoMa street network are not going to a destination in SoMa; and, of the trips which pass 7 through, half are local to San Francisco and half have regional destinations. Figure 4 also shows that the share of 8 trips destined to or from this part of the City is increasing, while the share of trips passing through this area is 9 decreasing, potentially indicating that as this part of the city densifies, the local streets are used by more core-related 10 traffic, crowding out vehicles destined to other parts of the City. 11
12 13
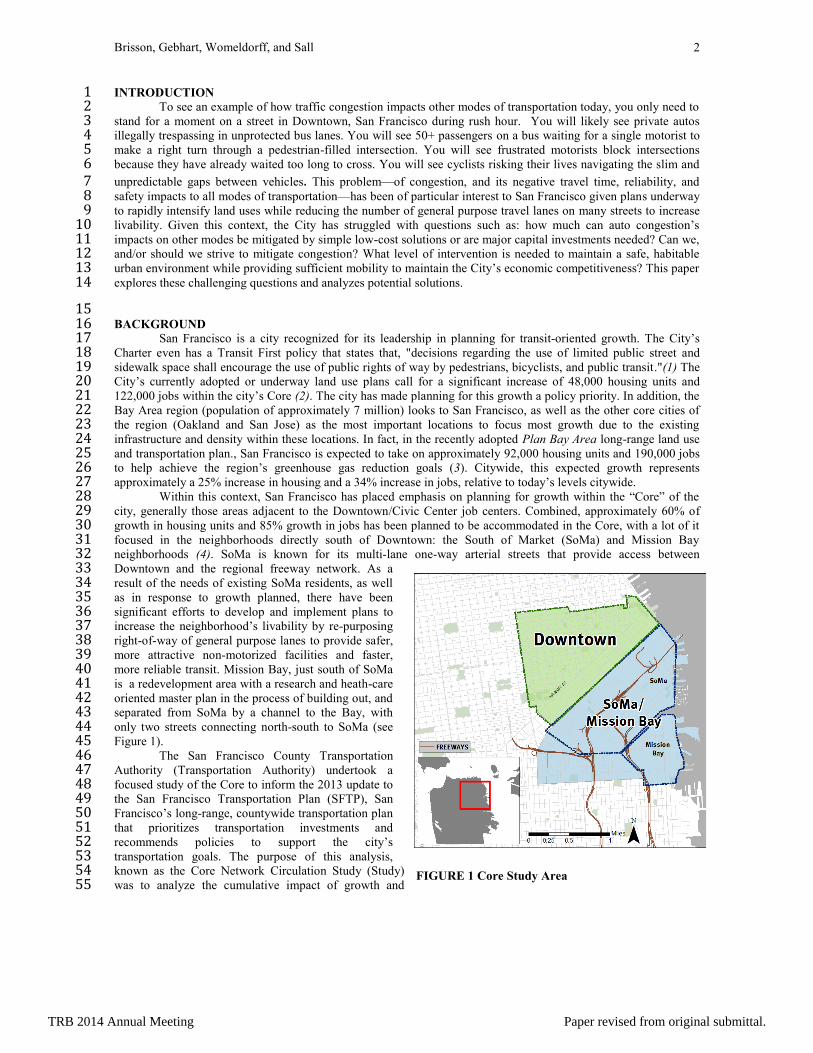
14 The Study team executed additional analysis focused on short auto trips, due to their greater potential to shift to 15 walk and bicycle trips. Figure 5 shows “sub-areas” that were the focus of the analysis, as well as the number of short 16 auto trips under 2 miles and under 0.5 miles in the Planned Future and the change relative to today. 17
In the aggregate, PM peak auto trips less than two miles more than double (233% increase) from today to 18 19
20 21 22 23 24 25 26 27 28 29 30 31 32 33 34
FIGURE 5 Short Auto Trip Analysis: Study Area, and Change in Auto Trips Under Two Miles, 2011 vs. 2035
Baseline
Source: SF-CHAMP 4.3, Focused Growth
FIGURE 3 Change in Trips to/from/within Downtown
and SoMa/Mission Bay: 2010-2035, pm peak
Source: SF-CHAMP 4.3, Focused Growth
FIGURE 4 SoMa Auto Trips, Pass-Through
vs. Trip Ends, Regional vs. Local, pm peak
Source: SF-CHAMP 4.3, Focused Growth
TRB 2014 Annual Meeting Paper revised from original submittal.
Brisson, Gebhart, Womeldorff, and Sall
5
the Planned Future. The auto mode share of trips less than two miles actually decreases (20% to 17%), yet the share 1 of auto traffic in SoMa/Mission Bay that is completing a trip less than two miles increases (18% to 20%). In the 2 context of an overall increase in trip-making, this means a lower percentage of people are choosing to drive for short 3 trips, yet, more vehicles on the network are completing short trips due to changes in land use and density. Many of 4 these short auto trips are likely a result of trip-chaining, which the Study team considered as it developed the 5 strategy response (described in Part 3 of this section). The implication is that transportation demand management 6 (TDM) strategies should be pursued to discourage people from arriving via automobile in the first place, allowing 7 these short auto trips to more easily be shifted to walking and bicycling trips. By encouraging transit, shuttle use, 8 ridesharing, parking policy, and other TDM measures people will be less likely to drive to these districts in the first 9 place, and thus decreasing the possibility of short auto trips. Shifting to walking and cycling is a particular 10 opportunity not only for short vehicle trips but also for short transit trips, which would free up room on overcrowded 11 buses and trains for longer transit commutes. 12 13 14 2. Transportation Performance: Congestion Reduction to Avoid Gridlock 15 The study team analyzed the auto and transit 16 performance impacts of the forecast increase in net 17 auto travel in the Planned Future. The Study team 18 prepared a SimTraffic microsimulation analysis, 19 assuming the transportation network proposals (i.e. 20 reduction in general purpose travel lanes) were in 21 place, for a subset of SoMa that experiences some of 22 the greatest levels of congestion today. The purpose of 23 this analysis was to determine how much auto demand 24 reduction would be necessary to prevent vehicle 25 queues from spilling into upstream intersections and 26 maintain a saturated, but flowing network. Results 27 determined that an approximate 26% reduction of auto 28 volumes during the PM peak period relative to Planned 29 Future SF-CHAMP forecasted levels of demand was 30 needed to reach an operational point at which traffic 31 could flow (see Figure 6). In other words, the Core San 32 Francisco road network can only accommodate about half 33 of the forecasted auto demand increase before creating a 34 perpetual gridlock condition. 35 36 3. Congestion Reduction Strategy Effectiveness 37 The final aspect of the analysis was to assess the effectiveness of a range of strategies in contributing to 38 achieving the 26% reduction in PM peak VMT needed. Informed by the trip analysis findings, a set of potential 39 strategies were identified for analysis. 40
Generally, strategies were identified in line with those that responded to a larger needs analysis conducted 41 for the SFTP. In particular, there was a focus on newer and innovative demand management strategies that have 42
FIGURE 6 PM Peak Vehicle Miles Traveled on
SoMa Streets: Comparison of Scenarios Source:
SF-CHAMP 4.3, Focused Growth
FIGURE 7 Relative Effectiveness of Strategies to Reduce PM Peak SoMa VMT
Source: SFCTA, 2013.
TRB 2014 Annual Meeting Paper revised from original submittal.
Brisson, Gebhart, Womeldorff, and Sall
6
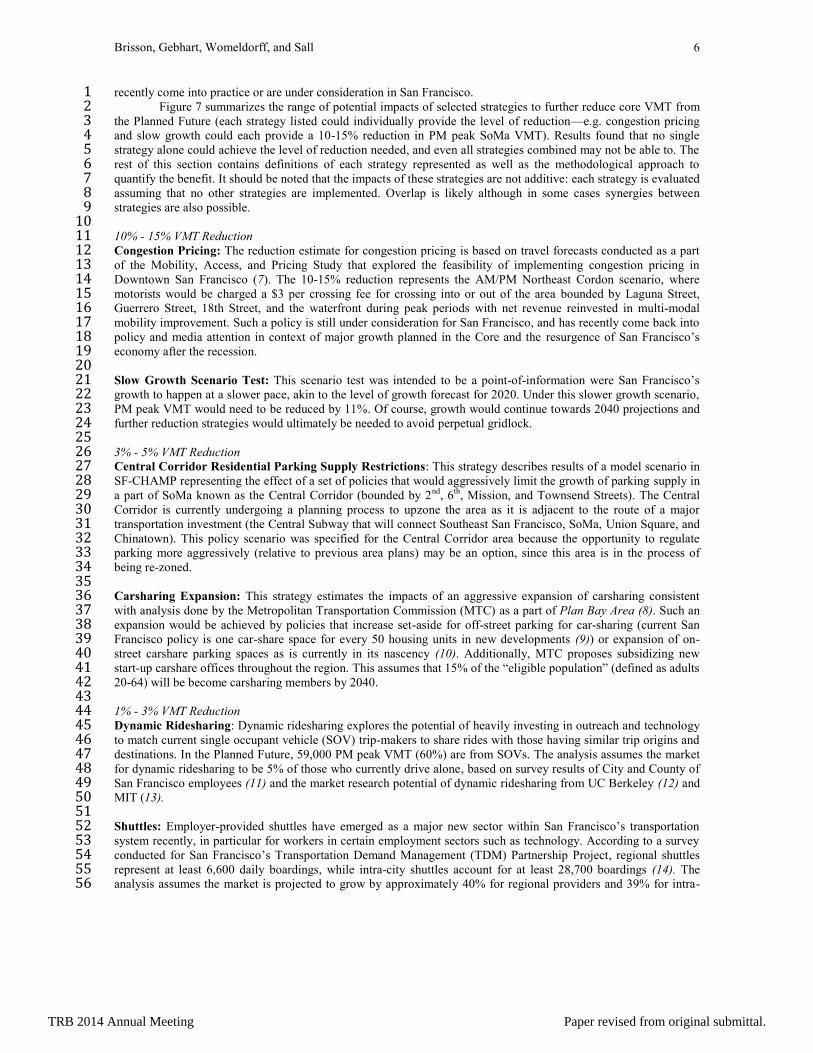
recently come into practice or are under consideration in San Francisco. 1 Figure 7 summarizes the range of potential impacts of selected strategies to further reduce core VMT from 2
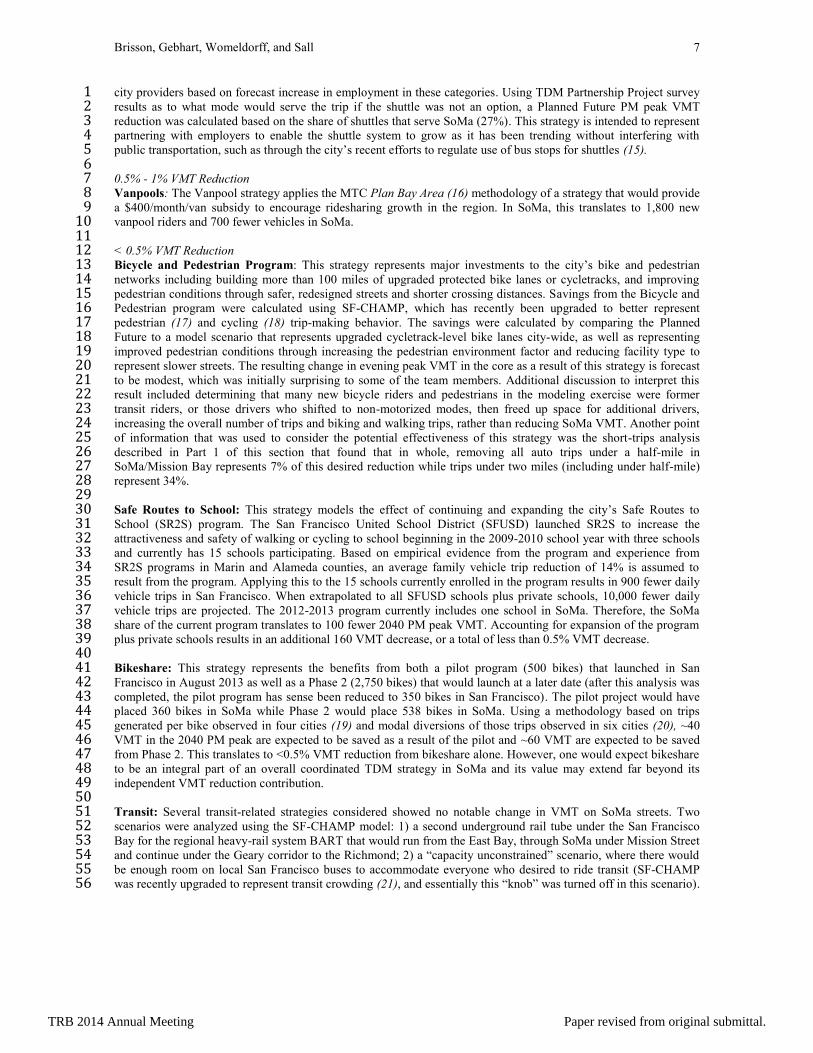
the Planned Future (each strategy listed could individually provide the level of reduction—e.g. congestion pricing 3 and slow growth could each provide a 10-15% reduction in PM peak SoMa VMT). Results found that no single 4 strategy alone could achieve the level of reduction needed, and even all strategies combined may not be able to. The 5 rest of this section contains definitions of each strategy represented as well as the methodological approach to 6 quantify the benefit. It should be noted that the impacts of these strategies are not additive: each strategy is evaluated 7 assuming that no other strategies are implemented. Overlap is likely although in some cases synergies between 8 strategies are also possible. 9 10 10% - 15% VMT Reduction 11 Congestion Pricing: The reduction estimate for congestion pricing is based on travel forecasts conducted as a part 12 of the Mobility, Access, and Pricing Study that explored the feasibility of implementing congestion pricing in 13 Downtown San Francisco (7). The 10-15% reduction represents the AM/PM Northeast Cordon scenario, where 14 motorists would be charged a $3 per crossing fee for crossing into or out of the area bounded by Laguna Street, 15 Guerrero Street, 18th Street, and the waterfront during peak periods with net revenue reinvested in multi-modal 16 mobility improvement. Such a policy is still under consideration for San Francisco, and has recently come back into 17 policy and media attention in context of major growth planned in the Core and the resurgence of San Francisco’s 18 economy after the recession. 19 20 Slow Growth Scenario Test: This scenario test was intended to be a point-of-information were San Francisco’s 21 growth to happen at a slower pace, akin to the level of growth forecast for 2020. Under this slower growth scenario, 22 PM peak VMT would need to be reduced by 11%. Of course, growth would continue towards 2040 projections and 23 further reduction strategies would ultimately be needed to avoid perpetual gridlock. 24 25 3% - 5% VMT Reduction 26 Central Corridor Residential Parking Supply Restrictions: This strategy describes results of a model scenario in 27 SF-CHAMP representing the effect of a set of policies that would aggressively limit the growth of parking supply in 28 a part of SoMa known as the Central Corridor (bounded by 2
nd, 6
th, Mission, and Townsend Streets). The Central 29
Corridor is currently undergoing a planning process to upzone the area as it is adjacent to the route of a major 30 transportation investment (the Central Subway that will connect Southeast San Francisco, SoMa, Union Square, and 31 Chinatown). This policy scenario was specified for the Central Corridor area because the opportunity to regulate 32 parking more aggressively (relative to previous area plans) may be an option, since this area is in the process of 33 being re-zoned. 34 35 Carsharing Expansion: This strategy estimates the impacts of an aggressive expansion of carsharing consistent 36 with analysis done by the Metropolitan Transportation Commission (MTC) as a part of Plan Bay Area (8). Such an 37 expansion would be achieved by policies that increase set-aside for off-street parking for car-sharing (current San 38 Francisco policy is one car-share space for every 50 housing units in new developments (9)) or expansion of on-39 street carshare parking spaces as is currently in its nascency (10). Additionally, MTC proposes subsidizing new 40 start-up carshare offices throughout the region. This assumes that 15% of the “eligible population” (defined as adults 41 20-64) will be become carsharing members by 2040. 42 43 1% - 3% VMT Reduction 44 Dynamic Ridesharing: Dynamic ridesharing explores the potential of heavily investing in outreach and technology 45 to match current single occupant vehicle (SOV) trip-makers to share rides with those having similar trip origins and 46 destinations. In the Planned Future, 59,000 PM peak VMT (60%) are from SOVs. The analysis assumes the market 47 for dynamic ridesharing to be 5% of those who currently drive alone, based on survey results of City and County of 48 San Francisco employees (11) and the market research potential of dynamic ridesharing from UC Berkeley (12) and 49 MIT (13). 50 51 Shuttles: Employer-provided shuttles have emerged as a major new sector within San Francisco’s transportation 52 system recently, in particular for workers in certain employment sectors such as technology. According to a survey 53 conducted for San Francisco’s Transportation Demand Management (TDM) Partnership Project, regional shuttles 54 represent at least 6,600 daily boardings, while intra-city shuttles account for at least 28,700 boardings (14). The 55 analysis assumes the market is projected to grow by approximately 40% for regional providers and 39% for intra-56
TRB 2014 Annual Meeting Paper revised from original submittal.
Brisson, Gebhart, Womeldorff, and Sall
7
city providers based on forecast increase in employment in these categories. Using TDM Partnership Project survey 1 results as to what mode would serve the trip if the shuttle was not an option, a Planned Future PM peak VMT 2 reduction was calculated based on the share of shuttles that serve SoMa (27%). This strategy is intended to represent 3 partnering with employers to enable the shuttle system to grow as it has been trending without interfering with 4 public transportation, such as through the city’s recent efforts to regulate use of bus stops for shuttles (15). 5 6 0.5% - 1% VMT Reduction 7 Vanpools: The Vanpool strategy applies the MTC Plan Bay Area (16) methodology of a strategy that would provide 8 a $400/month/van subsidy to encourage ridesharing growth in the region. In SoMa, this translates to 1,800 new 9 vanpool riders and 700 fewer vehicles in SoMa. 10 11 < 0.5% VMT Reduction 12 Bicycle and Pedestrian Program: This strategy represents major investments to the city’s bike and pedestrian 13 networks including building more than 100 miles of upgraded protected bike lanes or cycletracks, and improving 14 pedestrian conditions through safer, redesigned streets and shorter crossing distances. Savings from the Bicycle and 15 Pedestrian program were calculated using SF-CHAMP, which has recently been upgraded to better represent 16 pedestrian (17) and cycling (18) trip-making behavior. The savings were calculated by comparing the Planned 17 Future to a model scenario that represents upgraded cycletrack-level bike lanes city-wide, as well as representing 18 improved pedestrian conditions through increasing the pedestrian environment factor and reducing facility type to 19 represent slower streets. The resulting change in evening peak VMT in the core as a result of this strategy is forecast 20 to be modest, which was initially surprising to some of the team members. Additional discussion to interpret this 21 result included determining that many new bicycle riders and pedestrians in the modeling exercise were former 22 transit riders, or those drivers who shifted to non-motorized modes, then freed up space for additional drivers, 23 increasing the overall number of trips and biking and walking trips, rather than reducing SoMa VMT. Another point 24 of information that was used to consider the potential effectiveness of this strategy was the short-trips analysis 25 described in Part 1 of this section that found that in whole, removing all auto trips under a half-mile in 26 SoMa/Mission Bay represents 7% of this desired reduction while trips under two miles (including under half-mile) 27 represent 34%. 28 29 Safe Routes to School: This strategy models the effect of continuing and expanding the city’s Safe Routes to 30 School (SR2S) program. The San Francisco United School District (SFUSD) launched SR2S to increase the 31 attractiveness and safety of walking or cycling to school beginning in the 2009-2010 school year with three schools 32 and currently has 15 schools participating. Based on empirical evidence from the program and experience from 33 SR2S programs in Marin and Alameda counties, an average family vehicle trip reduction of 14% is assumed to 34 result from the program. Applying this to the 15 schools currently enrolled in the program results in 900 fewer daily 35 vehicle trips in San Francisco. When extrapolated to all SFUSD schools plus private schools, 10,000 fewer daily 36 vehicle trips are projected. The 2012-2013 program currently includes one school in SoMa. Therefore, the SoMa 37 share of the current program translates to 100 fewer 2040 PM peak VMT. Accounting for expansion of the program 38 plus private schools results in an additional 160 VMT decrease, or a total of less than 0.5% VMT decrease. 39 40 Bikeshare: This strategy represents the benefits from both a pilot program (500 bikes) that launched in San 41 Francisco in August 2013 as well as a Phase 2 (2,750 bikes) that would launch at a later date (after this analysis was 42 completed, the pilot program has sense been reduced to 350 bikes in San Francisco). The pilot project would have 43 placed 360 bikes in SoMa while Phase 2 would place 538 bikes in SoMa. Using a methodology based on trips 44 generated per bike observed in four cities (19) and modal diversions of those trips observed in six cities (20), ~40 45 VMT in the 2040 PM peak are expected to be saved as a result of the pilot and ~60 VMT are expected to be saved 46 from Phase 2. This translates to <0.5% VMT reduction from bikeshare alone. However, one would expect bikeshare 47 to be an integral part of an overall coordinated TDM strategy in SoMa and its value may extend far beyond its 48 independent VMT reduction contribution. 49 50 Transit: Several transit-related strategies considered showed no notable change in VMT on SoMa streets. Two 51 scenarios were analyzed using the SF-CHAMP model: 1) a second underground rail tube under the San Francisco 52 Bay for the regional heavy-rail system BART that would run from the East Bay, through SoMa under Mission Street 53 and continue under the Geary corridor to the Richmond; 2) a “capacity unconstrained” scenario, where there would 54 be enough room on local San Francisco buses to accommodate everyone who desired to ride transit (SF-CHAMP 55 was recently upgraded to represent transit crowding (21), and essentially this “knob” was turned off in this scenario). 56
TRB 2014 Annual Meeting Paper revised from original submittal.
Brisson, Gebhart, Womeldorff, and Sall
8
In both scenarios, change in PM peak period VMT on SoMa streets was flat. This is not to say that improved transit 1 is not imperative to the functioning of the Core, but rather than on its own, will not result in a notable reduction in 2 SoMa VMT. This finding highlights likely latent demand for driving in this part of the city. Road space given up by 3 those who shift to improved transit service will be replaced by new drivers “filling in” newly available capacity. 4 5 Potentially Effective Strategies Not Analyzed 6 “Fix the Grid”: This strategy represents an idea to “fix the grid” by reconnecting streets that do not currently 7 connect well. SoMa/Mission Bay is ground zero for several street grids that interface in awkward ways where they 8 meet including between Downtown and SoMa, between Downtown and Market/Octavia, between SoMa and 9 Mission Bay, and between Mission Bay and Potrero Hill/the Mission District. Several opportunities to make these 10 upgrades have been identified. Although analysis was not undertaken, the team expects such a strategy could 11 contribute modest positive benefits towards SoMa congestion reduction by removing bottlenecks in the network. 12 13 Auto Trip Cap: Recently, San Francisco planners have discussed the idea of a private vehicle “trip cap” as a 14 potential next-generation TDM strategy. The idea of such a strategy would be to set an allowance for a maximum 15 number of auto trips that allow the network to continue to function, while charging a fee to trip generators who 16 exceed their trip allowance, similar to a cap-and-trade scheme. While this strategy was not analyzed and would 17 require more detailed specification, it may represent a similar magnitude of potential trip shifts as parking supply 18 restrictions or congestion pricing strategies. 19 20 Convert Freeway Lanes and Ramps from General Purpose to Transit/Carpool Because SoMa is home to a 21 series of on- and off-ramps to three major highways of I-80, US 101, and I-280, traffic associated with motorists 22 trying to access those ramps is a notable contributor to PM peak congestion on SoMa streets as shown in Figure 4. A 23 strategy that would close or re-purpose some ramps or travel lanes for use only by transit- or carpool-only may both 24 increase the competitiveness of non-SOV modes, and improve the throughput of those facilities that may be 25 degraded by closely spaced interchanges (0.5-0.7 miles apart through SoMa). Several potential options to 26 operationalize this strategy were developed, but the team did not believe the VMT reduction benefits could 27 appropriately be analyzed within the resources and analysis tools available for the current Study (future work is 28 expected to analyze this strategy in a broader planning context). 29 30 DISCUSSION OF RESULTS AND POLICY IMPLICATIONS 31 The team struggled with how to interpret the result that the level of reduction in demand for auto travel 32 would be challenging to achieve, concluding that in areas of above a certain threshold of high land use intensity, 33 demand for auto travel at levels higher than available supply will always be present and can only be managed 34 through strong demand management strategies that increase price or restrict vehicle access. In order to maintain 35 mobility and economic vitality concurrently, demand management strategies must be paired with improvements in 36 safety, capacity, and performance of other modes of transportation. Given that reality, there are two challenges and 37 policy implications to discuss: 1) what the city can do to ensure effectiveness of other modes in a congested future; 38 2) how to evolve from typical forecasting/analysis approaches to long-range transportation planning while still 39 having a rational basis for proposing transportation interventions. 40 41 Increasing the effectiveness of non-auto modes of transport in a congested future. 42
In the San Francisco policy context of a city that has made Transit First an official policy, pure auto 43 congestion is not considered a problem in and of itself if it does not interfere with the ability to accommodate 44 mobility for other modes of transportation, as well as if it allows for the city to maintain its economic 45 competitiveness. But, on-the-ground conditions today are such that during peak commute periods auto congestion 46 does interfere with other modes. While some of this interference can be addressed by strategies not yet in place such 47 as greater protection for transit and cycling facilities, the team concluded that in a destination like the Core, that is 48 highly attractive due to the concentration of residential, employment, and visitor uses, increasing intensification 49 would require a transition to more active management of transportation conditions such as deploying resources in 50 real-time based on on-the ground conditions and active enforcement of “don’t block the box” (i.e. 51 enforcement/ticketing of cars that remain in an intersection on a red light). Such an approach is already utilized 52 effectively in special cases such as during major sports or cultural events. For example, a recent confluence of major 53 events resulted in one million people converging on San Francisco (the so-called “event-maggedon” of America’s 54 Cup/Fleet Week, the Castro Street Fair, the Italian Heritage Parade, Giants and 49ers games, the Hardly Strictly 55 Bluegrass Festival and the Double Ten Parade) on the weekend of October 6, 2012 (22). 56
TRB 2014 Annual Meeting Paper revised from original submittal.
Brisson, Gebhart, Womeldorff, and Sall
9
However, the team also posited maintaining transit speed and reliability would be increasingly challenging 1 to do so at-grade as congestion and overall trip-making grows. While upgrading streets to provide protected transit 2 facilities is important, challenges such as the need to accommodate access to curb space for goods movement 3 loading and disabled persons and the need to allow private vehicles, pedestrians and cyclists to cross transit lanes, all 4 create negative speed and reliability impacts. As a result, transit may only be truly effective as grade-separated after 5 a certain intensity of trip-making. San Francisco already has underground transit including the regional BART heavy 6 rail system and portions of the Muni Metro system that serves some parts of the city. In addition, the newly planned 7 Central Subway under SoMa, Union Square, and Chinatown, and eventually the planned extension of the Caltrain 8 regional commuter system to Downtown as a part of the California High-Speed Rail project will also contribute to 9 addressing this need. Yet, other parts of San Francisco do not currently have fast or reliable access to any below 10 grade opportunity and some below grade facilities are not providing the level of speed or reliability needed to attract 11 or maintain riders. Of course, this problem is particularly challenging to address given the lack of funding for major 12 capital investments relative to past decades. How to respond to these needs are one focus of the SFTP. 13
14 Evolving from typical forecasting/analysis approaches to long-range transportation planning 15
Historical and to some extent state of the practice approaches to travel forecasting and transportation 16 project evaluation have led to problem-solution framing where an input of more people and more jobs indicate an 17 output of demand for auto trip-making that can only be solved by adding roadway capacity. San Francisco has for 18 some time used a more nuanced approach guided by the city’s Transit First policy and prioritized improvements to 19 transit, walking, cycling, and reduction in auto lanes. San Francisco’s travel demand model, SF-CHAMP, has been 20 created and upgraded to be sensitive to a broader array of multi-modal interventions. But, the finding about the 21 excess of vehicle demand relative to supply indicates a condition that is not physically possible. While there is 22 widespread recognition that the “solutions” of past--increasing vehicle capacity—are wrong, the now well-23 recognized candidate solutions related to demand management and multi-modal improvements, are not found to do 24 enough to address the problem when applying empirical evidence about their effectiveness from other cities to San 25 Francisco conditions (of course more stringent representation of strategies could be quantifiably demonstrated to be 26 more effective such as a much higher congestion toll or extreme restriction of parking supply, but were not elected 27 to be studied here). 28
As the team concluded this particular effort, there was a recognition that the analytic work needed to plan 29 to meet transportation needs in San Francisco’s core must evolve to utilize different problem-solution framings. 30 Recent ideas about how else to frame long range planning analysis are to focus on quantifying the expected increase 31 in trip-making from new growth, then planning to accommodate those trips based on policy-driven modal split, and 32 planning for the characteristics (performance, safety, capacity) of transit, cycling, and walking networks that are 33 known to be important factors in travel behavior decision-making in favor of those modes. Approaches such as these 34 are sure to be tested in emerging transport planning work in San Francisco. 35 36 LIMITATIONS 37
There are several limitations to the paper’s technical analysis (all of which support the second discussion 38 point regarding evolving from typical forecasting/analysis approaches): 39
The paper suggests a particular level of auto traffic reduction needed to avoid perpetual gridlock. This 40 level is based on a methodology of inputting auto traffic demand forecast by a travel demand model into 41 microsimulation software. What is implied by the microsimluation finding is that the travel demand 42 model is forecasting more demand than can be accommodated. Ultimately, the 26% VMT reduction 43 should be interpreted to reflect that there would be that much demand for peak hour auto travel even in 44 congested conditions, but in reality some of those trips would change their time of day, route, mode, or 45 not make the trip at all. Given that SF-CHAMP also represents transit crowding, the level of transit 46 demand would likely also not be able to be accommodated with the existing transit supply. 47
The strategies specified could have been specified to be a stronger representation: for example, a 48 congestion pricing policy with a higher priced toll would be expected to increase the VMT reduction of 49 that strategy; similarly a higher number of bikes in a bikeshare program could also be more effective. 50 However, the study aimed to represent strategies based on the current or proposed definitions. 51
The strategies do not take into account unprecedented cultural shifts. For example, younger generations 52 are not driving as much as past generations, and bicycling has become rapidly more popular. These 53 trends may indicate a greater impact of some strategies than what is quantified here. 54
The relative effectiveness of strategies analyzed via the model versus via off-model may not be 55 perfectly comparable and may overestimate the benefit of off-model strategies. Modeled strategies 56
TRB 2014 Annual Meeting Paper revised from original submittal.
Brisson, Gebhart, Womeldorff, and Sall
10
show the induced demand of new vehicle trips “filling in” freed up capacity, while off-model strategies 1 do not. 2
3 CONCLUSIONS 4
This paper finds that in areas of high land use intensity, demand for auto travel at levels higher than 5 available supply will always be present and can only be managed through strong demand management strategies that 6 increase price or restrict vehicle access. In order to maintain mobility, such strategies must be paired with 7 improvements in safety, capacity, and performance of other modes of transportation. In the near-term, San Francisco 8 can reduce traffic congestion’s impacts on other modes of transport through more regular active management of the 9 transport network and continuing to re-purpose auto lanes for walking, cycling, and transit space. In the longer term, 10 the city will continue to strategically consider additional below-grade/subway additions and upgrades to the local 11 and regional transit network. Finally, future long-range transport analysis should explore new analytical frameworks 12 for long-range transport planning that may be more apt to solve tomorrow’s transport challenges. 13
14 AKNOWLEDGEMENTS 15 The authors would like to acknowledge others who have contributed to or provided guidance on this work: 16
Tilly Chang, Rachel Hiatt, Lisa Zorn, Dan Tischler, Josh Karlin-Resnick, Melanie Curry: San 17 Francisco County Transportation Authority 18
Zabe Bent, John Urgo, Becca Homa: former San Francisco County Transportation Authority 19 Michael Eiseman: Nelson\Nygaard Consulting Associates 20 Julie Kirschbaum, Timothy Papandreou, Peter Albert, Britt Tanner, Andrew Lee, Mari Hunter, 21
Teresa Tapia, John Katz, Jonathan Rewers, Ricardo Olea, Erin Miller, Matt Brill, San Francisco 22 Municipal Transportation Agency 23
Amnon Ben-Pazi, Greg Riessen, Sarah Dennis-Phillips, Josh Switzky, Viktoriya Wise, Jon Swae, 24 San Francisco Planning Department 25
The TRB Transportation in Major U.S. Cities Committee who provided very helpful peer review 26 and critique of the first draft of the paper. 27
This work was funded with Prop K sales tax and Congestion Management Agency Surface Transportation 28 Program Planning funds. 29
30
1. State Laws, Local Codes, & Transit First Policy (City Charter). San Francisco City Charter, Section 8A.115.
2. San Francisco Planning Department as quoted in San Francisco’s Transportation Investment and Growth
Strategy, July 2013.
4 San Francisco’s Transportation Investment and Growth Strategy. Op cit. Includes growth in pipeline, additional
capacity zoned for, and projects under development for the Downtown-Van Ness-Geary, Eastern Neighborhoods,
Market & Octavia, Mission Bay, Port of San Francisco, and Transbay Terminal/Transit Center Priority Development
Areas.
5. Outwater, M. and B. Charlton. The San Francisco model in practice: Validation, testing, and application, in
“Innovations in Travel Demand Modeling: Summary of a Conference”, Vol. 2, Transportation Research Board,
Washington, DC, 2006.
6. San Francisco County Transportaiton Authority. August 2013. Off-Model Transportation Demand Management
Representation and Quantification Methodology for San Francisco Transportation Plan White Paper.