The author has granted a nonexclusive license allowing Library and Archives Canada to reproduce, publish, archive, preserve, conserve, communicate to the public by telecommunication or on the Internet, loan, distrbute and sell theses worldwide, for commercial or noncommercial purposes, in microform, paper, electronic and/or any other formats.
AVIS:
L'auteur a accorde une licence non exclusive permettant a la Bibliotheque et Archives Canada de reproduire, publier, archiver, sauvegarder, conserver, transmettre au public par telecommunication ou par I'lnternet, preter, distribuer et vendre des theses partout dans le monde, a des fins commerciales ou autres, sur support microforme, papier, electronique et/ou autres formats.
The author retains copyright ownership and moral rights in this thesis. Neither the thesis nor substantial extracts from it may be printed or otherwise reproduced without the author's permission.
L'auteur conserve la propriete du droit d'auteur et des droits moraux qui protege cette these. Ni la these ni des extraits substantiels de celle-ci ne doivent etre imprimes ou autrement reproduits sans son autorisation.
In compliance with the Canadian Privacy Act some supporting forms may have been removed from this thesis.
While these forms may be included in the document page count, their removal does not represent any loss of content from the thesis.
Conformement a la loi canadienne sur la protection de la vie privee, quelques formulaires secondaires ont ete enleves de cette these.
Bien que ces formulaires aient inclus dans la pagination, il n'y aura aucun contenu manquant.
Canada
ABSTRACT
One of the most important deterioration mechanisms in wastewater infrastructure is
microbial influenced concrete deterioration (MICD). MICD is a process in which
microbial organisms accelerate the concrete deterioration by producing sulphuric acid on
the surface of concrete. Sulphur oxidizing bacteria (SOB) are aerobic bacteria that
convert the sulphur compounds into sulphuric acid on the concrete surface which results
in biogenic sulphuric acid deterioration.
This study was proposed to investigate the use of E.coli DH5a bacterial bio film as an
environmentally friendly alternative to inhibit MICD. MICD was simulated with
sulphuric acid solution as well as biogenic acidification using two species of SOB. E.coli
biofilm with high amount of extracellular polymeric substance coverage was successfully
grown on the mortar surface. All evidence from calcium leach-out concentration,
scanning electron microscopy (SEM) and X-ray diffraction (XRD) analyses suggests that
the presence of biofilm prevented or controlled the chemically and biologically induced
mortar deterioration. SEM and XRD analysis of mortar specimens under biogenic
acidification showed the presence of gypsum crystals on the control mortar without
biofilm, which is one of the indicators of concrete deterioration due to sulphate attack;
however, there was no sign of gypsum crystals on the biofilm-covered mortar surface.
The confocal laser scanning microscopy and volatile suspended solid analyses indicated
that the biofilm sustained and was growing during both acidification processes.
Comparing the mechanism of chemical sulphuric acid deterioration with the biogenic
sulphuric acid deterioration illustrated that the chemical acidification changes the
i
structure of the mortar by dissolution of C-S-H; however, biogenic acidification causes
cracking, spalling, loss of coherence and expansion due to gypsum formation. It was also
revealed that the biogenic acidification at an elevated temperature (i.e., 37±1° C) leads to
a more severe deterioration comparing with the room temperature biogenic acidification.
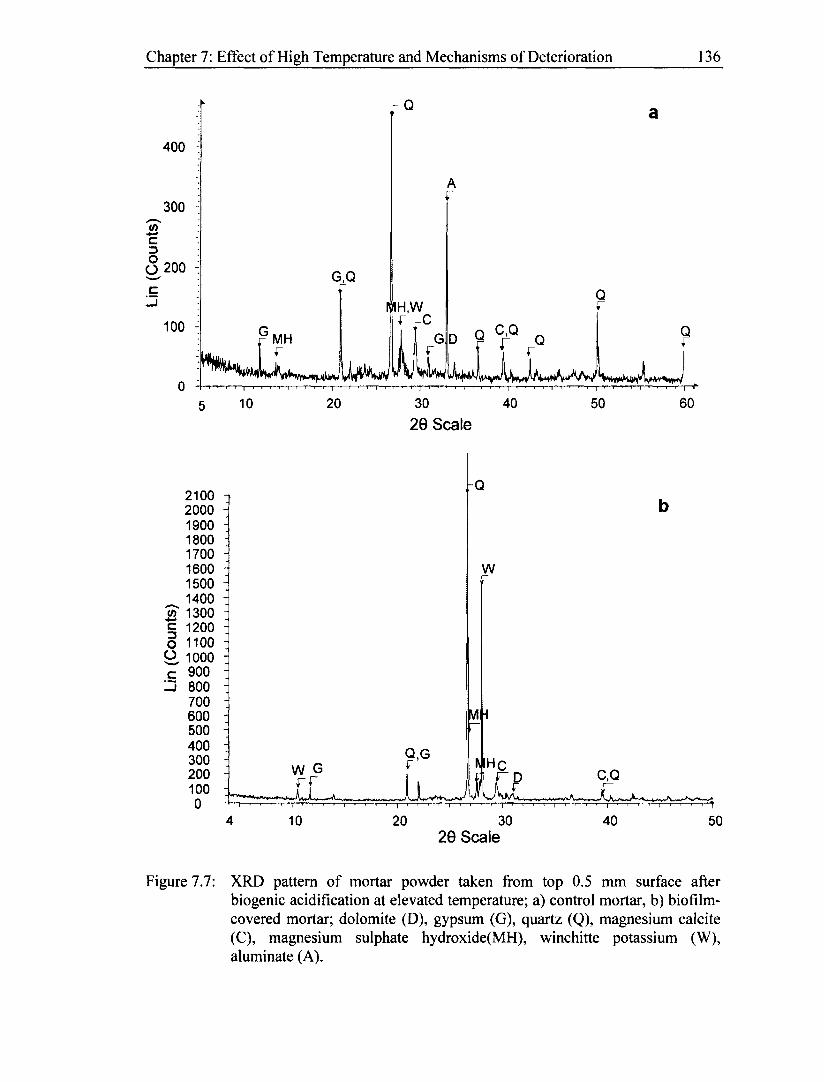
As shown by the XRD analysis, the biogenic acidification at elevated temperatures
resulted in the formation of gypsum in the biofilm-covered mortar which was not a case
for the room temperature experiment.
ii
ACKNOWLEDGEMENTS
I would like to sincerely thank both my supervisors Dr. Banu Ormeci and Dr. O. Burkan
Isgor for their continuous support, thoughtful advice and warm encouragement
throughout my doctoral study. They inspired me in every step of my work from the very
early stages to the end and enhanced my knowledge as a researcher. I am so honoured
for having the experience of working with them which trained me for my future career
and life. I have been extremely lucky to have these two persons as my supervisors and
mentors in my life.
I would like to express my appreciation to Dr. Jim Beaudoin (Researcher Emeritus at
NRC and Adjunct Professor at the University of Ottawa) who provided me with his
expertise in very specialized areas of work. I am also very thankful for the technical help
provided by Mr. Gordon Chan during my experimental studies at NRC. Special thanks
must be extended to Ms. Rahil Khoshnazar for her assistance in the XRD investigation.
I would like to express my gratitude to the staff of Civil and Environmental Engineering
laboratory at Carleton University with special thanks to Mr. Stanley Conley and Dr.
Marie Jose Tudoret-Chow for their assistance throughout these years. I gratefully
acknowledge the assistance of Dr. Jianqun Wang, the technical director of SEM
laboratory at Carleton University, in preparing the SEM images. I should also
acknowledge the assistance of Mr. Raed Hanania at the Image Acquisition Core Facility
of University of Ottawa for his assistance in taking the CLSM images. I would also like
to thank my fellow graduate student, Burak Gunay, for his help in preparing some graphs
for this thesis.
iii
I am grateful to Dr Sankara Papavinasam for his collaboration in the biosensor study and
the technical help of staffs, Dr. Reeta Sooknah and Mr. Alex Doiron during my
experimental studies at CANMET/MTL. Special thanks go to Dr. Thomas K. Wood from
Texas A&M University for providing the antibiotic resistance strain of E.coli DH5a.
Words cannot express how I am indebted to my family. I feel a deep sense of gratitude
for my family, specially my father and mother who formed part of my vision and have
been unconditionally supporting me from the beginning of my life. Without doubt, none
of my success would have been possible without their dedication and support. I also
would like to thank all my friends in Ottawa for the enjoyable moments they provided for
me during the writing of this thesis.
1 would like to give my special appreciation to my husband, Pouria Ghods, whose love
and support enabled me to complete this work. He unwaveringly encouraged me to
pursue my academic studies in the doctoral level. Without his understanding and help, it
would have been impossible for me to finish this work.
I would like to acknowledge the financial supports provided in the forms of Natural
Sciences and Engineering Research Council of Canada (NSERC) Scholarship, Ontario
Graduate Scholarships (OGS), and Carleton University's financial assistance, including
several scholarships, fellowship, and teaching assistantship.
iv
TABLE OF CONTENTS
ABSTRACT I
ACKNOWLEDGEMENTS Ill
TABLE OF CONTENTS V
LIST OF FIGURES X
LIST OF TABLES XIX
GLOSSARY XXI
CHAPTER 1. INTRODUCTION AND OBJECTIVES 1
1.1 Introduction 1
1.2 Problem Definition 3
1.3 Objectives and Scope 5
1.4 Research Method 7
1.5 Thesis Organization 8
CHAPTER 2. LITERATURE REVIEW 10
2.1 Introduction 10
2.2 Microbiologically Influenced Corrosion of Metals 11 2.2.1 Mechanism of corrosion in metals.. 12 2.2.2 Biofilm 14 2.2.3 Corrosion control by biofilm formation 15
3.3 Phase 1: Biofilm Formation on Mortar Specimens 45 3.3.1 Bacterial strain and growth medium 45
3.3.2 Biofilm formation 46
3.4 Phase 2: Chemical Sulphuric Acid Deterioration 49
3.4.1 Chemical acidification on mortar disk 49 3.4.2 Chemical acidification on mortar cubes 50
3.5 Phase 3: Biogenic Sulphuric Acid Deterioration 50 3.5.1 Bacterial strains and their growth media 50 3.5.2 Selection of modified broth used for the growth of SOB strains 51 3.5.3 Biogenic acidification on mortar disks 52 3.5.4 Biogenic acidification on small mortar cubes 53
3.6 Phase 4: High Temperature Biogenic Sulphuric Acid Deterioration 53
3.7 Calcium and Sulphate Analysis 53
3.8 Adenosine Triphosphate Measurement 54
3.9 Membrane Filtration 55
3.10 Volatile Suspended Solids 56
3.11 Scanning Electron Microscopy and Energy-Dispersive X-ray Spectroscopy 56
3.11.1 Sample preparation 57 3.11.2 Equipment 58
3.12 Confocal Laser Scanning Microscopy 58
3.13 Fluorescence In Situ Hybridization (FISH) 59
VI
3.13.1 Fixation of bacterial cells 59
3.13.2 Whole-cell hybridization 60
3.13.3 Microscopy and image analysis 61
3.14 X-ray Diffraction 61 3.14.1 Background of technique 61
3.14.2 Sample preparation 62
CHAPTER 4. BIOFILM FORMATION ON MORTAR SURFACE 63
4.1 Introduction 63
4.2 Monitoring Bacterial Growth 64
4.3 Monitoring Biofilm Formation 65
4.4 SEM/EDS 67
4.5 Fluorescence In Situ Hybridization 70
4.6 Confocal Scanning Laser Microscopy 72
4.7 Concluding Remarks 77
CHAPTER 5. CHEMICAL SULPHURIC ACID DETERIORATION 79
CHAPTER 7. EFFECT OF HIGH TEMPERATURE AND MECHANISMS OF DETERIORATION 128
7.1 Introduction 128
7.2 Effect of Temperature 128 7.2.1 Chemical analysis 129 7.2.2 Crystal formation 134
7.2.3 Visual inspection 138
7.3 Mechanisms of Deterioration: Chemical vs. Biogenic Acidification 140
7.4 Concluding Remarks 144
CHAPTER 8. BIOFILM PERFORMANCE EVALUATION USING AN ENZYME ELECTRODE 146
8.1 Introduction 146
8.2 Materials and Methods 148 8.2.1 Microorganisms 148 8.2.2 Biofilm growth 148 8.2.3 Production and purification of sulphide oxidase enzyme 149 8.2.4 Enzyme electrode preparation 150 8.2.5 Electrochemical measurements 150
8.3 Results and Discussion 152
8.3.1 Electrochemical measurements 152
viii
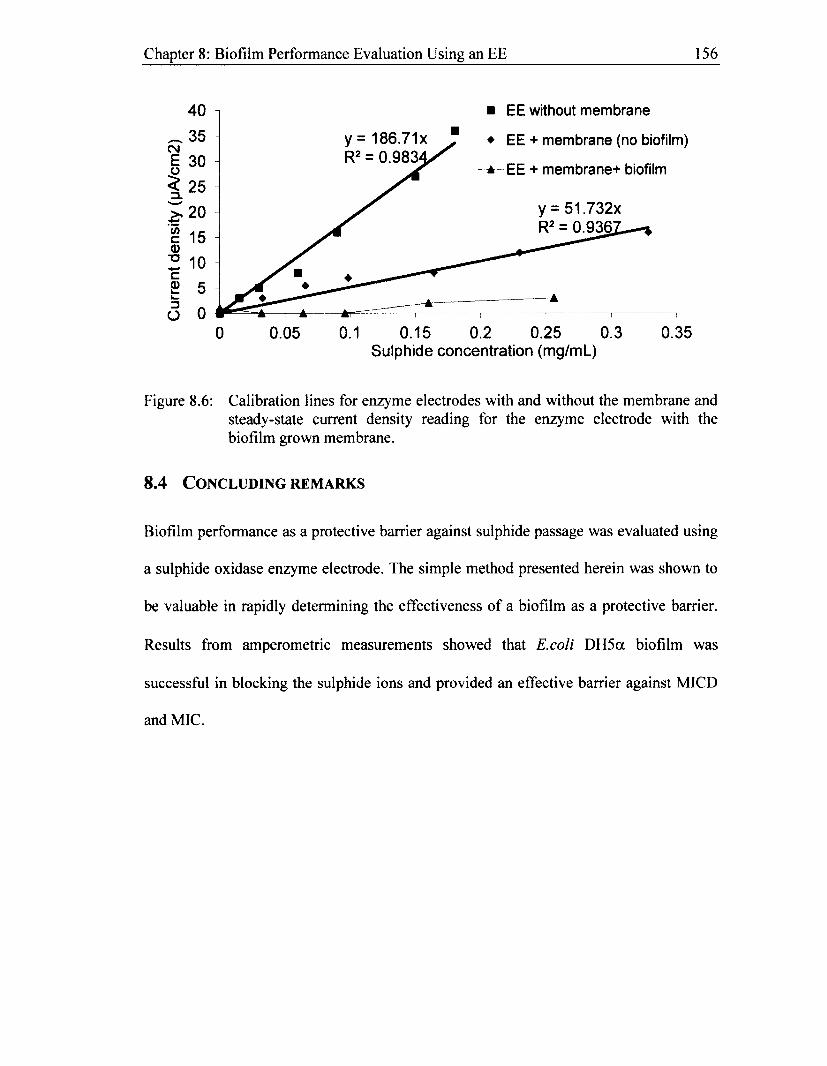
8.4 Concluding remarks 156
CHAPTER 9. CONLUSIONS AND FUTURE WORK 157
9.1 Conclusions 157
9.2 Recommendations for Future Work 160
REFERENCES 164
APPENDIX A: SUPPLEMENTARY XRD ANALYSIS 175
APPENDIX B: SUPPLEMENTARY CLSM IMAGES 178
APPENDIX C: TABULAR DATA USED FOR DRAWING GRAPHS 184
ix
LIST OF FIGURES
Figure 2.1: Representative proposed mechanisms of corrosion inhibition employing
beneficial bacterial biofilms. a) Aerobic respiration of biofilms decreases
oxygen concentration on metal surface, b) Antimicrobials generated in situ
by biofilms (such as Bacillus brevis) eliminate corrosion-causing bacteria
(e.g., SRB). c) Biofilm-secreted protective layers of corrosion inhibitors
decrease contact of corrosive agents with metal surface (taken from Zuo,
2007) 17
Figure 2.2: Schematic representation of microbial induced concrete deterioration 21
Figure 2.3: MICD simulation chamber by Sand et al. (1987) (taken from Sand et al.,
1987) 25
Figure 2.4: Experimental setup for MICD simulation by Hormann et al. (1997) (taken
from Hormann et al., 1997) 27
Figure 2.5: Lab-scale simulation system for MICD by Mori et al. (1992) (taken from
Mori et al., 1992) 27
Figure 3.1: Schematic and image of the reactor used for biofilm growth on mortar disks.
47
Figure 3.2: Schematic of biofilm growth setup 47
Figure 3.3: Schematics of atomic planes in a crystalline structure and representation of
Bragg's law 62
Figure 4.1: The optical density of bacteria grown in biofilm reactor as measured by
absorbance reading at 600 nm at room and elevated temperature 65
Figure 4.2: Biomass concentration on the mortar surfaceas measured by the coliform
forming unit at different time of biofilm growth; biomass concentration after
8 days was 18><105 CFU 66
Figure 4.3: ATP of biomass on mortar surface at differnt days of biofilm growth as
measured by ATP analysis 66
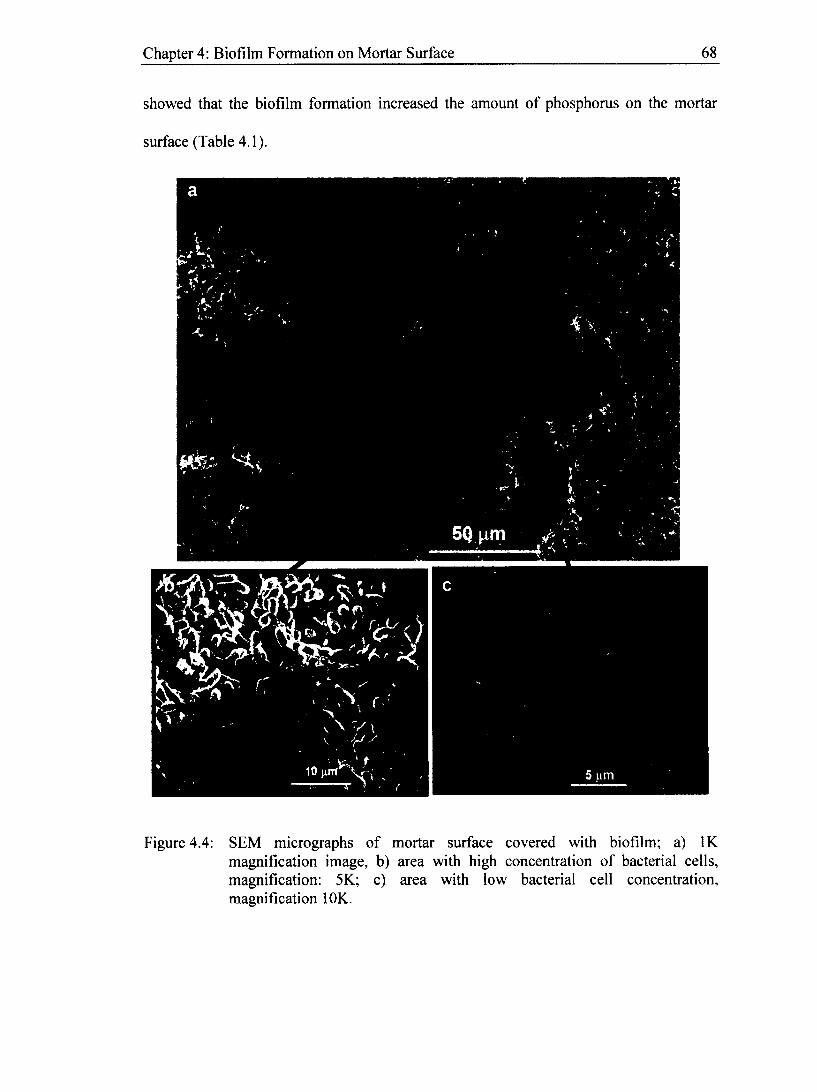
Figure4.4: SEM micrographs of mortar surface covered with biofilm; a) IK
magnification image, b) area with high concentration of bacterial cells,
x
magnification: 5K; c) area with low bacterial cell concentration,
magnification 10K 68
Figure 4.5: EDS analysis of biofilm-covered mortar on area with no bacterial cell; a)
SEM micrograph showing the area used for EDS analysis, b) the
corresponding EDS spectrum of the area with no bacterial concentration.. 69
Figure 4.6: Images of pure E.coli DH5a; a) differential interference contrast (DIC)
image showing all the present bacteria, b) florescent image showing the
hybridized E.coli bacteria 71
Figure 4.7: FISH Images for identification of E.coli in biofilm attached on the mortar
surface; (a) Total bacteria present stained with DAPI (blue), (b) Same
viewing of the sample hybridized with probe EC-1531 (green) to identify
E.coli 72
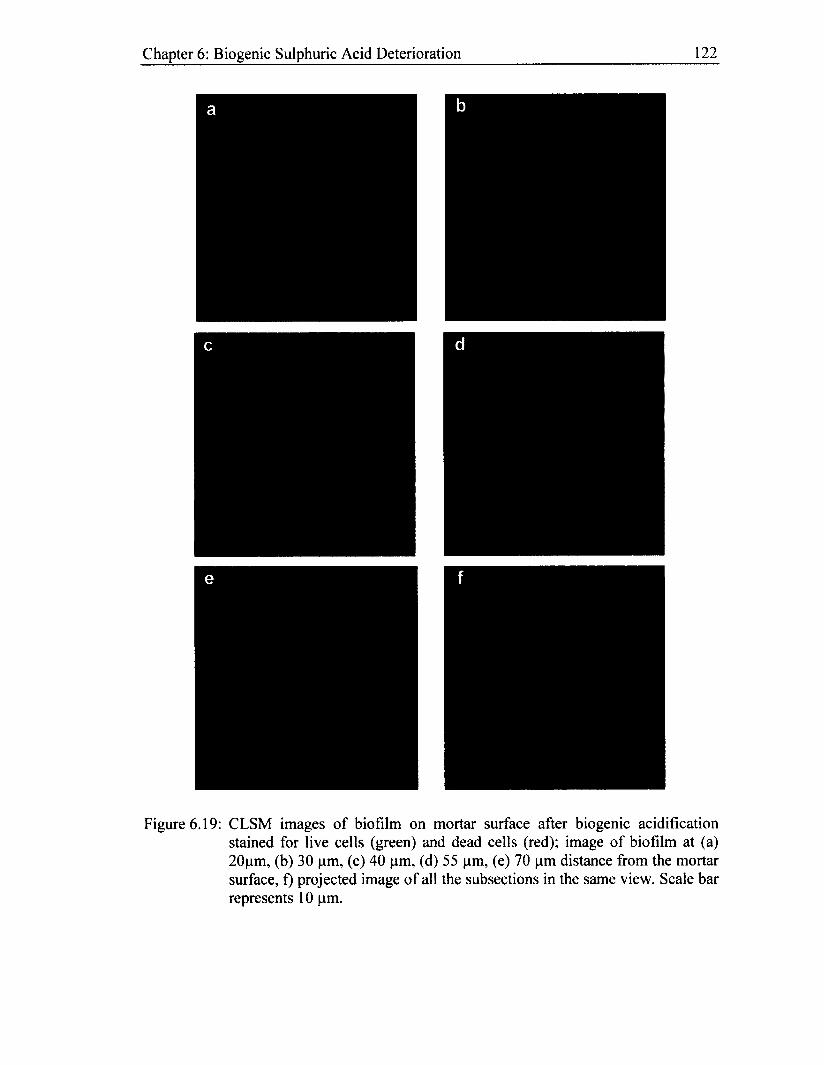
Figure 4.8: Confocal laser scanning microscope images of 8 days grown biofilm of
E.coli DH5a on mortar surface stained for live and dead cells; a) section of
biofilm at 20 (am distance from the mortar surface, b) projected image of all
the subsections in the same position. Scale bar represents 10 (jm. The green
areas are live cells and red areas are dead cells 74
Figure 4.9: Confocal laser scanning microscope images of 8 days grown biofilm on
mortar surface stained for live cells (green), dead cells (red) and
polysaccharide (cyan); image of biofilm at (a) 10 (im, (b) 20 |im, (c) 30 |j.m,
(d) 40 (j.m distance from the mortar surface, e) projected image of all the
subsections in the same view. Scale bar represents 10 |nm 75
Figure 4.10: Live and dead cell distribution profiles of 8 day grown E.coli biofilm
developed on mortar surface. Measurements are the average of two
representative positions in the biofilm 76
Figure 4.11: EPS and void distribution profiles of 8 day grown E.coli biofilm developed
on mortar surface. Measurements are the average of two representative
positions with the same biofilm thickness 77
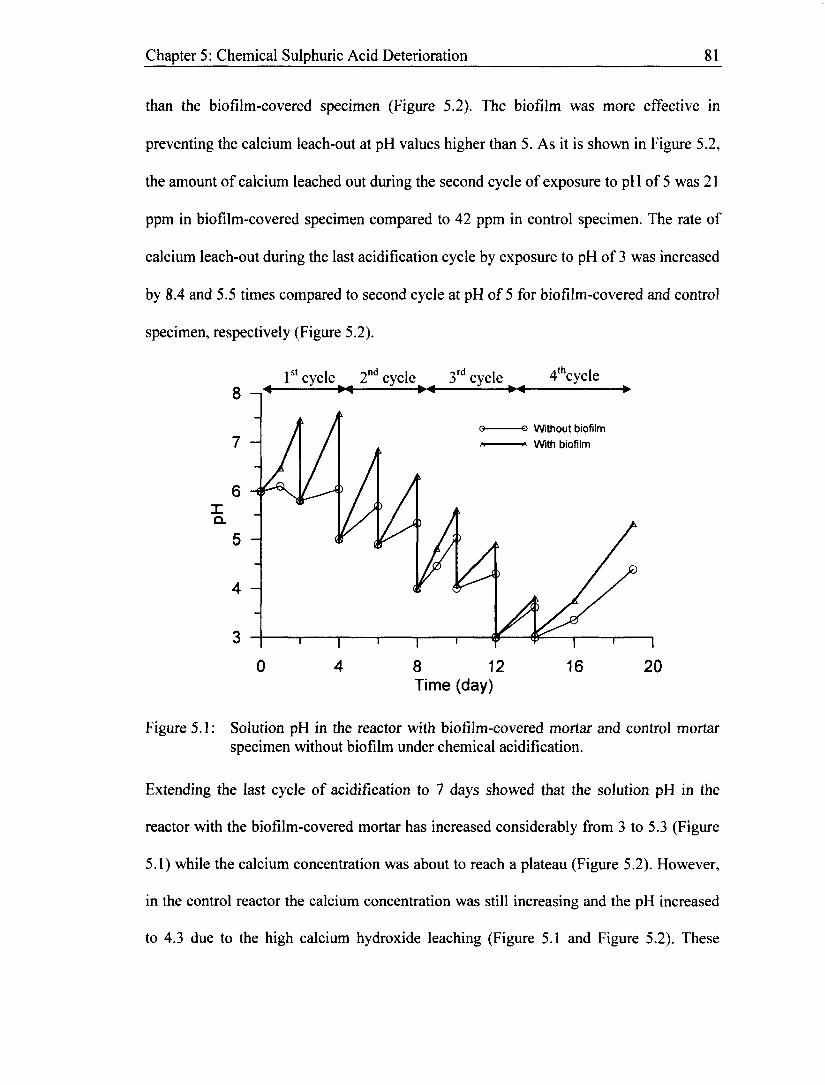
Figure 5.1: Solution pH in the reactor with biofilm-covered mortar and control mortar
specimen without biofilm under chemical acidification 81
Figure 5.2: Accumulative calcium concentration in the reactor with biofilm-covered
mortar and reactor with control mortar specimen without biofilm under
chemical acidification 82
xi
Figure 5.3: Accumulative calcium concentration of the replica experiment in the reactor with biofilm-eovered mortar and reactor with control mortar specimen without biofilm 82
Figure 5.4: a) SEM micrograph with lOOOx magnification of biofilm-eovered mortar before acidification; b & c) SEM micrograph of biofilm-eovered mortar specimen after exposure to pH of 5; b) lOOOx magnification showing biofilm with less bacterial concentration, c) 5000 x magnification showing high concentration of bacteria in biofilm 84
Figure 5.5: SEM image of mortar surface without biofilm after exposing to pH 5 shows formation of cracks on the surface; lOOOx magnification 85
Figure 5.6: SEM image of biofilm-eovered mortar surface after the last cycle of acidification; a) 1000 x magnification of the mortar surface; b) 5000 x magnification of the bacterial cell in biofilm 86
Figure 5.7: SEM image of control mortar surface without biofilm after exposure to pH value of 3 87
Figure 5.8: CLSM images of biofilm on mortar surface after chemical acidification stained with calcoflour for polysaccharide (cyan); image of biofilm at (a) 10 p.m, (b) 20 |im, (c) 31 |u.m, (d) 45 jam, (e) 59 |im distance from the mortar surface, f) projected image of all the subsections in the same view. Scale bar
represents 10 (am 90
Figure 5.9: CLSM images of biofilm on mortar surface after chemical acidification stained for live cells (green) and dead cells (red); image of biofilm at (a) 10 |im, (b) 20 |im, (c) 30 (am, (d) 40 (im, (e) 50 |j.m distance from the mortar surface, f) projected image of all the subsections in the same view. Scale bar represents 10 jim 91
Figure 5.10: Spatial distribution of bacterial viability within the E.coli biofilm attached to mortar surface after chemical acidification; a) first field of view, b) second field of view 92
Figure 5.11: Comparison of spatial distribution of EPS coverage within the E.coli biofilm before and after chemical acidification 93
Figure 5.12: Volatile suspended solids measurement of biomass attached to mortar specimens (the values are the average of two VSS measurement on the surface of two mortar cubes) 94
xii
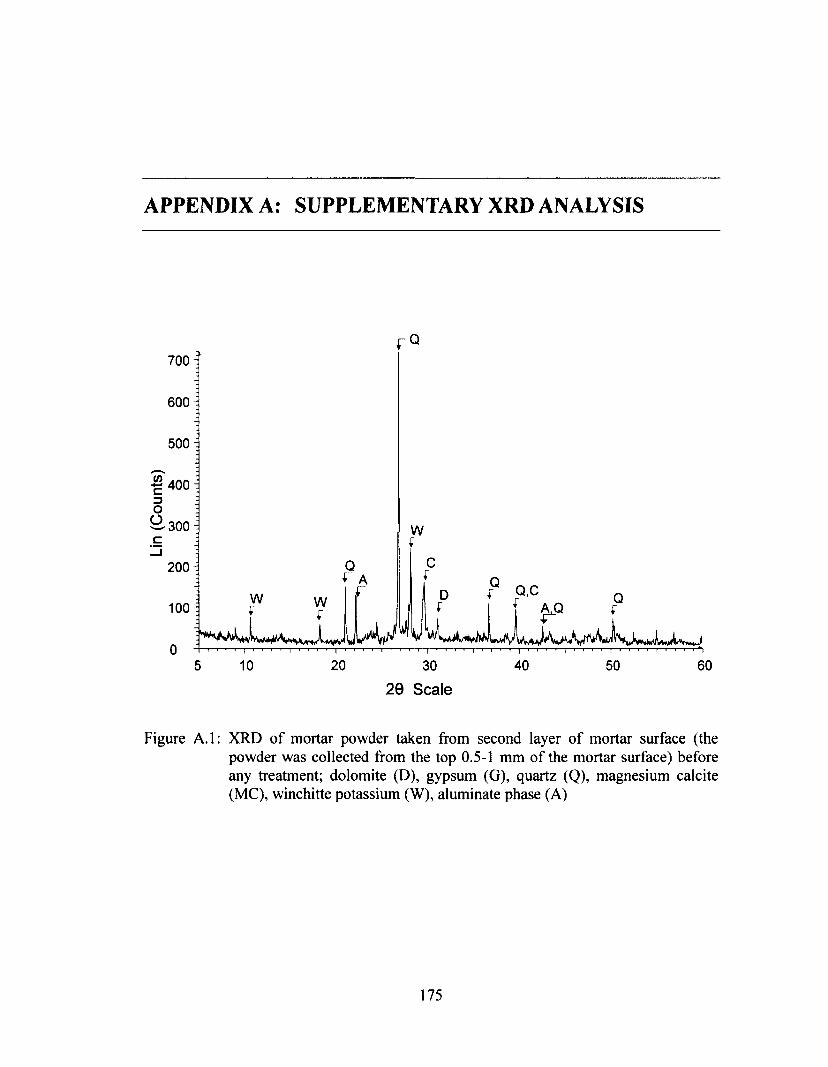
Figure 5.13: XRD of mortar powder taken from top 0.5 mm surface of mortar surface before any treatment; dolomite (D), gypsum (G), quartz (Q), magnesium calcite (C), winchitte potassium (W) 95
Figure 5.14: XRD of mortar powder taken from top 0.5 mm surface of mortar without
biofilm after chemical acidification; dolomite (D), gypsum (G), quartz (Q),
Figure 6.1: The pH decrease in different modified broths due to the growth of T.thiooxidans and T.neapolitanus 101
Figure 6.2: The sulphate generation in different modified broths due to the growth of T.thiooxidans and T.neapolitanus; data points are the average of three readings with the standard deviation of less than 250 mg/L 101
Figure 6.3: pH in the reactor with biofilm-covered mortar and control mortar specimen without biofilm under biogenic acidification 103
Figure 6,4: Sulphate concentration in the reactor with biofilm-covered mortar and reactor with control mortar specimen without biofilm 104
Figure 6.5: Accumulative calcium concentration in the reactor with biofilm-covered mortar and reactor with control mortar specimen without biofilm under biogenic acidification 105
Figure 6.6: pH in the reactor with biofilm-covered mortar and control mortar specimen without biofilm under biogenic acidification for the duplicate set of experiment 107
Figure 6.7: Sulphate concentration in the reactor with biofilm-covered mortar and reactor with control mortar specimen without biofilm for duplicate experiment 107
Figure 6.8: Accumulative calcium concentration in the reactor with biofilm-covered mortar and reactor with control mortar specimen without biofilm under biogenic acidification 108
xiii
Figure 6.9: XRD pattern of sand sample used for constructing the mortar specimens;
flava, and Paenibacillus polymyxa (PP) as the beneficial bacterial biofilm that help
mitigate corrosion. Bacillus subtilis has been shown to inhibit the corrosion of metal by
secreting polyglutamate and polyaspartate (antimicrobial compounds), while P.flava
inhibits corrosion by forming phosphate (Sheng et al., 2007). Biofilm of aerobic bacteria
such as PF inhibits corrosion by reducing the oxygen concentration and biofilm of PP
inhibits corrosion by secreting an antimicrobial compound against SRB and hindering the
anaerobic growth of SRB at the metal surface (Akid et al., 2008).
Chapter 2: Literature Review 17
a Bu* liquid
Aerobe rwpirafoa
ANOOE
|) Antimicrobial-producing baciena
Antdrt icrobtei
-CATHODE ' -SO,1 + BeV»S-SRB O \ i \ -r Q Q M U M . . \ o T V x
SRB Klllng SRB altvJatm cathode depolarization
C Cathodic aganis (03, H* ate) Film of corrosion
intiibilors »«cr«ted t>y projective b Wilms
\/^P •**$*> * V^-'CATHOOE
ANOOE
Figure 2.1: Representative proposed mechanisms of corrosion inhibition employing beneficial bacterial biofilms. a) Aerobic respiration of biofilms decreases oxygen concentration on metal surface, b) Antimicrobials generated in situ by biofilms (such as Bacillus brevis) eliminate corrosion-causing bacteria (e.g., SRB). c) Biofilm-secreted protective layers of corrosion inhibitors decrease contact of corrosive agents with metal surface (taken from Zuo, 2007).
Because of the disadvantages of traditional corrosion inhibitors (i.e., being hazardous and
subject to degradation and dilution by the bulk fluid), biofilms can play an important role
Chapter 2: Literature Review 18
for secreting the corrosion inhibitors, as they can be generated adjacent to the surfaces
under corrosion and within the biofilm. Ornek et al. (2002 a, b) investigated the
corrosion inhibition of aluminium and brass using the biofilm of genetically engineered
Bacillus subtilis that produces polyaspartate or Bacillus licheniformis that produces y-
polyglutamate. y-Polyglutamate and polyaspartate are naturally produced corrosion
inhibitors which have an aluminum-chelating carboxylic group. Ornek et al. (2002 a)
observed a 90 % reduction in the MIC inhibition of aluminium by B. licheniformis
compared to the non-engineered biofilm (i.e., biofilms that do not secrete corrosion
inhibitors) and a significant corrosion reduction by B.subtilis. In another attempt,
Jayaraman et al. (1999 a) constructed the genetically engineered B.subtilis secreting
antimicrobial peptide of indolicidin, bactenecin and probactenecin to inhibit the growth
and proliferation of SRB. B. subtilis expressing bactenecin in biofilms inhibited the SRB-
induced corrosion of stainless steel 6 to 12-fold in continuous reactors as observed by EIS
spectra and by the reduction in hydrogen sulphide and iron sulphide in batch
fermentations with mild steel. Zuo and Wood (2004) used the gramicidin-S producing
Bacillus brevis to reduce the corrosion of mild steel due to the presence of iron-oxidizing
and sulphate reducing bacteria. Gramicidin-S is an antimicrobial peptide, effective in
killing a range of bacteria and fungi. They observed about a 20-fold reduction in
corrosion by the protective and antimicrobial secreting biofilm of B. brevis.
Jayaraman et al. (1997 a, b, 1998) used the biofilm forming aerobic bacteria of P.fragi
and facultative anaerobic E.coli DH5a to reduce corrosion by removing the oxygen from
the corrosion site in carbon steel SAE 1018. By measuring mass loss, they observed a 2-
10 fold reduction in corrosion in the presence of these bacterial biofilms compared to
Chapter 2: Literature Review 19
sterile conditions (biofilm free). Using confocal laser scanning microscopy and by
staining the bacteria with Live/Dead Baclight stain, they showed that increasing the
cellular content and the thickness of the biofilm led to further corrosion reduction. By
killing the bacteria using antibiotics, they concluded that the dead bacterial biofilm is not
effective in reducing the corrosion because of the lack of bacterial assimilation.
Jayaraman et al. (1997 b) extended their study to further investigate if oxygen depletion
is the only reason for the corrosion inhibition by the E.coli and P.fragi biofilm. They
were able to reduce the corrosion of steel in the presence of the aerobically grown biofilm
of E.coli and P. fragi in a continuous reactor by 4- to 20-fold in an LB medium.
However, as the corrosion rate in the presence of anaerobically grown biofilm of E.coli
was always lower than the sterile anaerobic control, they could not completely attribute
the corrosion reduction to oxygen depletion alone. It is likely that some other activities
might be involved rather than oxygen depletion alone in the corrosion inhibition by E.coli
biofilm (Zuo, 2007). Akid et al. (2008) produced a ready-made biofilm of the
Pseudomonas fragi and Paenibacillus polymyxa bacteria encapsulated in a sol-gel coating
and inoculated the gel close to the metal substrate. The electrochemical measurement of
the polarization resistance, the impedance spectroscopy and the electrochemical noise
studies carried out by Akid et al. (2008) demonstrated at least a 10-fold inhibition in
metal corrosion coated with bacteria infused sol-gel coating compared to sol-gel coating
KH2P04, 3 g/L K2HP04, 5 mg/L of FeS04 and 10 g/L Na2S203.5 H20, 1.25 g/L LB
In order to identify which modified broth is better in terms of promoting SOB growth and
accelerating acidification, a 5% v/v solution of pure T.thiooxidans and T.neapolitanus in
the exponential growth phase was injected into 200 mL of each modified broth in
separate containers. The mixtures of SOB bacteria were grown for 12 days under static
condition at room temperature. The activity of the bacteria were analysed by measuring
the pH and sulphate concentration in each broth during 12 days of growth. SOB
quantitatively oxidize sulphur into sulphates and reduce the pH of the solution, hence
measuring the sulphate concentration and pH are direct indications of SOB growth
(Waksman and Joffe, 1921; Kuenen, et al., 1992). Both broths were investigated and
results are shown in Chapter 6. Based on these results, MB2 was used in the rest of the
experiments.
3.5.3 Biogenic acidification on mortar disks
To biologically acidify the mortar disks, the same reactor as shown in Figure 3.2 was
used for biogenic acidification. A mortar disk was placed on the bottom of the reactor and
the reactor was filled with 200 mL of a modified broth (MB2) which has a neutral pH and
promotes the growth of both SOB. The medium was inoculated with 5% v/v solution of
T.thiooxidans and 5% v/v solution of T.neapolitanus at their exponential growth phase.
The reactor was placed on a rotary shaker (60-rpm) at room temperature for two weeks to
promote bacterial growth and acidification. After two weeks, the reactor was emptied
and then filled with fresh MB2 solution and new 5% v/v solution of each T.thiooxidans
and T.neapolitanus bacteria for another 2 weeks. Hence the whole process of biogenic
Chapter 3: Materials and Methods 53
acidification was performed in two 14-day cycles of SOB growth (i.e., T.thiooxidans and
T.neapolitanus growth) on mortar specimens. During this experiment, the pH, calcium
and sulphate concentration of solution inside the reactor were measured.
3.5.4 Biogenic acidification on small mortar cubes
The mortar cubes were placed in a flask filled with 200 mL of MB2 and 5% v/v solution
of T.thiooxidans and T.neapolitanus at their exponential growth phase. The same
procedures of acidification, as described in section 3.5.3, were also applied to the mortar
cubes inside the flask. The mortar cubes were used for FISH, EDS, SEM, CLSM, and
VSS measurements.
3.6 PHASE 4: HIGH TEMPERATURE BIOGENIC SULPHURIC ACID
DETERIORATION
The same procedures as described for biogenic sulphuric acid deterioration in sections
3.5 were performed in the fourth phase of the study but at an elevated temperature of
37±1° C). The experimental setup was kept inside an environmental incubator to keep the
temperature at 37±1° C during the experiments.
3.7 CALCIUM AND SULPHATE ANALYSIS
A calcium ion selective electrode (ISE) with a reference electrode incorporated in the
body of the electrode (PY-I07IS Combination Electrode, Sartorius Mechatronics)
connected to a VWR ISE reader (SP90M5, VWR Symphony) was used for calcium
concentration measurement. The calcium ISE was calibrated once before each
measurement. It was immersed in the solution containing the calcium ions for about 3-5
Chapter 3: Materials and Methods 54
minutes for measurement. The pH was measured using a Thermo Scientific Orion 5 Star
pH meter.
For sulphate concentration measurement, HACH spectrophotometric method (Method
No. 8051, concentration range of 2-70 mg/L, DR2800 Spectrophotometer, HACH) which
was adopted from Standard Methods for the Examination of Water and Wastewater
(APHA et al., 2005) was used. The samples were diluted 100 times to be in the range of
the acceptable concentration for the measurement.
3.8 ADENOSINE TRIPHOSPHATE MEASUREMENT
To measure the concentration of biofilm forming on mortar cubes, the adenosine
triphosphate (ATP) content of attached biofilm was measured on days 3, 5 and 8 of
growth. ATP which is present in the body of viable bacterial cells and is used for
transmitting energy is a direct indicator of total living biomass. Mortar cubes were first
dipped into sterile DI water to remove the loose bacterial biofilm and the LB solution.
Then, the biofilm was extracted by immersing the cube in 5 mL of ATP reagent and
vigorously vortexing for one minute. The solution with extracted biofilm was then used
for total ATP analysis using an ATP luminometer (Kikkoman Lumitester C-110,
LuminUltra) and an ATP kit (# DSA-25, LuminUltra) specific for biofilm analysis. ATP
was analysed for two mortar cubes in triplicate readings and the averages were employed.
The principle of ATP measurement is based on the reaction of luciferase enzyme with
luciferin attached to ATP which produces light. The emitted light intensity is measured
by luminometer as relative light unit (RLU). Following completion of the ATP
Chapter 3: Materials and Methods 55
measurement, RLU values were converted to ATP concentrations by using a 1 (ng/mL)
ATP standard solution and the following equation:
ATP reading of sample in relative light unit, RLUUCI is the total ATP reading of 1
3.9 MEMBRANE FILTRATION
The membrane filtration technique for measurement of total coliform was performed as a
different method of monitoring biomass accumulation on the mortar surfaces. To extract
the biomass from the mortar surface, one mortar cube from the Erlenmeyer flask was
immersed in 5 mL of autoclaved DI water and the solution was vortexed for 1 minute.
The supernatant solution containing bacterial biofilm was used for the membrane
filtration. The membrane filtration was performed by several dilution of supernatant
using the dilution factor in the range of 10 to 10 . The membrane filtration procedure
was adopted from APHA et al. (2005) in which 25 mL of the diluted solution was filtered
through a 0.45 (im membrane filter (0.45 (am, Membrane Filter, Milipore Corporation)
under vacuum. The filter was then placed on m-Endo agar (DIFCO™, Fisher Scientific)
and incubated for 22-hours at 35° C. The number of colonies formed was counted with a
colony counter (# 3326 Darkfield colony counter, Reichert). Three replicates were used
for membrane filtration for each dilution.
ATp fPgATIV RLUtATP „ 50000 (pg ATP)
V cm2 / RLUUC| A (cm2)
where tATP is the total ATP of sample with the unit of
(ng/mL) standard solution in RLU, and A is the surface area of mortar cube in (cm2).
Chapter 3: Materials and Methods 56
3.10 VOLATILE SUSPENDED SOLIDS
Volatile suspended solids were analysed to evaluate the presence and growth of biofilm
and its condition after each acidification process. VSS is the measure of volatile organic
matters suspended in the solution and can be used to estimate the amount of biomass
present. To perform VSS analysis, the cubic mortar specimens were placed in 10 mL of
sterile DI water inside a centrifuge tube. Then the tube was vortexed for one minute to
detach the biofilm bacteria from mortar surface to the solution. The 10 mL solution was
analysed for VSS measurement using the procedure described in APHA et al. (2005). The
10 mL solution containing the biofilm cells was passed through the filter (Glass
Microfibere Filters, 70 mm, Whatman) and the filter was first dried at 105° C then ignited
at 550° C. The volatile solids concentration was calculated as follows:
mg volatile solids B - C (3-2)
cm2 A
where, B is the mg weight of dish with filter after drying at 105° C, C is the mg weight of
dish with filter after ignition at 550° C and A is the surface area of mortar cube in cm .
For each VSS measurement, 2 cubic samples were used and the average was reported.
3.11 SCANNING ELECTRON MICROSCOPY AND ENERGY-DISPERSIVE X-RAY
SPECTROSCOPY
SEM was used to study the biofilm growth as well as the mortar surface characteristics
for crystal formation, roughness and cracking. EDS was used for the elemental analysis
and chemical characterization of samples. SEM scans the sample surface in sequential
rectangular strips by a high-energy beam of electrons. The interaction of the electron
beam with the atoms that make up the sample emits secondary and backscattered
Chapter 3: Materials and Methods 57
electrons as well as X-ray signals. These electrons which contain information about the
surface topography, composition and other properties such as electrical conductivity of
the sample are collected and converted to the image of the surface. Elemental analysis is
also possible through energy dispersive spectroscopy that enables a qualitative estimate
of the proportion of each atom in the mixture.
3.11.1 Sample preparation
Mortar cubes with attached surface biofilm were removed from Erlenmeyer flasks and
dipped in autoclaved DI water to remove bulk supernatant cells and loose biofilm. During
SEM, the specimen is under a high vacuum pressure; hence the biological specimens
such as biofilms should be first fixed to preserve their structure and then dried (Little and
Lee, 2007; Videla, 1996). The mortar cubes were immersed in 2.5% glutaraldehyde in
0.1 M potassium phosphate buffer for two and half hours to fix the biofilm cells. The
fixation was followed by ethanol dehydration through subsequent ten minutes
immersions in each 35%, 50%, 70%, and 100% ethanol solution. The samples were air-
dried over night in a desiccator. When possible, the air-dried samples were then sputter
coated with conductive gold-palladium coating with a low vacuum sputter coater. Due to
the porosity of the mortar samples, the complete drying of samples could not always be
achieved; hence some samples could not be coated. Therefore, a lower vacuum pressure
was used for uncoated samples and the high resolution imaging (i.e., magnification more
than lOOOOx) was not possible.
Chapter 3: Materials and Methods 58
3.11.2 Equipment
Scanning electron microscopy (Vega-II XMU VPSEM, Tescan) capable of using variable
pressure and wet operation was used for SEM imaging in this study. The images were
collected at a scanning speed of 148 [is/pixel and a working distance of 6-8 mm.The
SEM was operated at acceleration voltage of 20 kV using either secondary detector or
backscatter electron detector depending on the required image quality. For uncoated
samples, the low vacuum with backscatter electron detector was used. The SEM was
connected to an Energy-dispersive X-ray spectrometer (INCAX-act, Oxford) which was
used for elemental mapping of the surface. The EDS spectra were acquired using the
acceleration voltage of 20 kV and X-ray acquisition rate of 3000 counts/s. An acquisition
time of 60 s was selected for EDS analysis.
3.12 CONFOCAL LASER SCANNING MICROSCOPY
Confocal laser scanning microscope was employed to examine the properties of biofilm
formed on mortar cubes at different stages of treatment (i.e., after biofilm formation, after
chemical or biogenic acidification). The biofilm components were analysed for the
relative proportion of live cells, dead cells, extracellular polymeric substance (EPS) and
void spaces.
Mortar cubes with attached surface biofilm were removed from Erlenmeyer flasks and
dipped in autoclaved DI water to rinse off the loose cells and biopolymers. The bacterial
cells on the mortar cubes were first stained for 30 min in 400 jo.1 of staining solution using
the Live/Dead biofilm viability kit (FilmTracer™ LIVE/DEAD Biofilm Viability kit,
Molecular Probes, Invitrogen). The Live/Dead staining solution contains 10.02 |iM
Chapter 3: Materials and Methods 59
SYTO 9 green-fluorescent stain to stain the live cells and 60 |j.M propidium iodide (PI)
red-fluorescent stain to stain the dead cells based on membrane integrity of the cells. The
specimens were then exposed for another 30 minutes to 400 |aL of calcoflour white stain
(composition: 0.5 g/L calcofluor white M2R, and 0.25 g/L evans blue, Sigma Aldrich) to
stain the polysaccharides, which are the main component of extracellular polymers. The
stained coupons were immersed in sterile DI water to visualize under confocal laser
scanning microscope (LSM 510/AxioImager.Ml, Zeiss) equipped with an Argon laser
(458, 488, 514 nm), and a 63x water-immersion objective (Plan-Apochromat 1.0 VIS-
IR). The specimens were excited at 488 nm with LP and BP filter sets for Live and Dead
stains, respectively; and at 458 nm with BP filter set for calcoflour stain. The images of
biofilm were taken over the complete biofilm thickness by focusing on different depths
within the biofilm with the focus distance of 0.5-2.0 |im from each other. The biofilm
thickness was found by focusing on the top and bottom of the biofilm at five different
locations and reported as the average of five readings.
3.13 FLUORESCENCE IN SITU HYBRIDIZATION (FISH)
Fluorescence in situ hybridization was performed on the biofilm that was grown on the
mortar cubes. FISH was used to confirm that the protective biofilm was formed by E. coli
and not by competing bacteria, and to evaluate the interaction of E.coli with SOB after
biogenic acidification.
3.13.1 Fixation of bacterial cells
Mortar cubes with attached surface biofilm were removed from Erlenmeyer flasks and
immersed in 5 mL of lx phosphate buffer solution (PBS) (130 mM NaCl, 7 mM
Chapter 3: Materials and Methods 60
Na2HP04, 3 mM NaHhPO^FhO) in a centrifuge tube. The tube was vortexed for 1 minute
to extract the bacterial cells from the mortar sample. For cell fixation, 5 ml sample of
bacterial cells was mixed with 15 mL of 4 % paraformaldehyde solution. After 4 hours
fixation at 4° C, cells were washed three times with lx PBS by sequential centrifugation
for 10 minutes at 10,000 rpm and resuspension (Amann, 1995). The fixed cells stored in
equal volume of 70% ethanol at -20° C for later analysis.
3.13.2 Whole-cell hybridization
In situ hybridization was adopted from Amann (1995) and Zarda et al. (1997) with some
modifications to enhance the probability of the hybridization. 8|iL of the fixed cell was
immobilized on each well of a gelatin-coated glass slide with six glass surface wells
where the hybridization process was performed. The 23S rRNA- oligonucleotide probes
used in this study was EC 1531 (5'-CACCGTAGTGCCTCGTCATCA-3') specific for
E.coli supplied from Sigma-Aldrich, Ltd. The probe was stained with fluorescein
isothiocyanate (FITC). Immobilized cells were hybridized on the slides by adding 8 (al of
hybridization solution (0.9 M NaCl, 20 mM Tris-HCl, 10% formamide, 0.01 % sodium
dodecyl sulphate(SDS)) and 1 |uL of each 100 ng/L oligo probe and 200 ng/(j.L DAPI
stain and keeping in a moist chamber for 3 hours at 43° C. Cells were counterstained with
DAPI in order to visualize other bacteria such as SOB. Then, the slides were rinsed and
washed by immersing in prewarmed (43° C) wash buffer solution (0.215 M NaCl, 20
mM Tris-HCl, 0.01 % SDS, 5 mM EDTA) for 20 min. The washed slides were rinsed in
DI water and air dried for imaging. 1 |iL of antifade reagent (Fluorgaurd Antifade,
Sigma-Aldrich, Ltd.) was added in each well.
Chapter 3: Materials and Methods 61
3.13.3 Microscopy and image analysis
An epifluorescence inverted microscope (Eclipse Ti-E with TI-FL Epi-fl illuminator,
Nikon) was used to visualize the FISH slides. To minimize the damage to the cells when
placed on the stage of the inverted microscope, a 24 mm x 40 mm cover slip (circles no.
1, 0-13—0-17 cm thick, Fisher Scientific Co.) was placed on the slides. The microscope
was equipped with single band filter block for DAPI and GFP-B filter for visualizing
FITC. A lOOx H/1.4 plan Apo VC oil immersion objective was used for phase contrast
microscopy as well as florescence microscopy. Image analysis was done with NIS
Elements imaging software version 3.20.
3.14 X-RAY DIFFRACTION
3.14.1 Background of technique
X-ray diffraction is one of the established techniques to study the compositional changes
in concrete and cementitous material. It is widely used in the study of concrete
deterioration to identify different deterioration mechanisms (Ramachandran and
Beaudoin, 2001). The technique is used to determine the type and abundance of
crystalline phases of materials. In this technique, the scattered intensity and angle of the
diffracted X-ray beam is measured as it encounters a plane of atoms in a material. In a
crystalline material, the atoms are arranged in a regular pattern with a distance called the
d-spacing or basal spacing (Figure 3.3). As the X-ray beam hits the atoms, it will be
diffracted with the same frequency as the incoming beam if they are in phase. This
occurs according to Bragg's law:
Chapter 3: Materials and Methods 62
n X = 2 d sin0 (3-3)
where X is the wavelength of the X-ray (-0.15 nm for the Cu source), d is the distance
between the atomic planes, 0 is the angle of incidence and n is an integer.
Figure 3.3: Schematics of atomic planes in a crystalline structure and representation of Bragg's law.
In order to identify an unknown crystal, the diffraction pattern of the substance with the
list of d-spacing are compared with the standard line patterns available for various
compounds. The standard XRD patterns of different crystals are released by the
International Center for Diffraction Data (ICDD).
3.14.2 Sample preparation
In this study, XRD was employed to quantitatively assess the formation of ettringite, and
gypsum crystals as these crystals are the expansive sulphate crystals that are formed
during the biodeterioration of concrete (Monteny et al., 2000, 2001).
Using a profile grinder (Metabo Ge700, ACE Tool), the acidified area of the mortar disks
with the diameter of 6 cm were grinded at 0.5-mm thick layers in two layers. The
collected powder was used for XRD analysis. The X-ray diffraction measurements were
performed using a Scintag XDS 2000 diffractometer and CuKa radiation. Spectra were
obtained in the range of 4< 20< 65°usnga step size of 0.0J at 5 sec. intervals.
CHAPTER 4. BIOFILM FORMATION ON MORTAR
SURFACE
4.1 INTRODUCTION
In this chapter, the results of the Phase one of this study including the monitoring of
E.coli growth and biofilm formation, and the evaluation of the E.coli biofilm
characteristics grown on the mortar specimens are presented. The characteristics of the
biofilm formed on the mortar surface were studied using several microscopic techniques
such as SEM and CLSM. FISH was used to confirm that the biofilm on the mortar
specimens was an E. coli biofilm after it was exposed to a mixed culture of SOB bacteria.
Biofilm formation on the mortar surface was a challenge due to the high surface pH of
mortars, typically greater than 13. The calcium hydroxide (CaOH) leach-out from the
mortar specimens leading to an increase in the pH of the bulk solution was another
obstacle for the bacterial growth in suspension. To overcome the difficulties of biofilm
formation on a high pH surface, the specimens were first immersed in DI water with
regular water replenishment for at least one week to promote leaching of excess CaOH
from the surface of the mortar before the mortar specimens are exposed to biofilm-
producing bacteria. In a concrete structure exposed to wastewater, this process is
accomplished by the release of carbon dioxide and a slight carbonation of the concrete
63
Chapter 4: Biofilm Formation on Mortar Surface 64
surface. In order to have a more resistant biofilm toward agitation and shear stresses; the
biofilm growth was performed under flowing conditions by media recirculation.
Biofilm growth on metal surfaces to inhibit metal corrosion has been studied in numerous
literatures. This is the first study of its kind to grow E.coli DH5a biofilm on a cement
mortar surface and to propose it as an inhibition method for MICD. It is also the first lab-
scale study to grow the biofilm on a mortar surface using a unique setup that permitted
the biofilm growth under continuous flow condition adjacent to the mortar surface.
4.2 MONITORING BACTERIAL GROWTH
To monitor the suspended growth of E.coli, the optical density of the bacteria or turbidity
of the LB broth inside the biofilm reactor was measured over the phase of biofilm
formation. The optical density of the bacteria grown for 8 days in the biofilm reactor at
room temperature (25±1° C) and elevated temperature of 37±1° C is shown in Figure 4.1.
The optical density was measured at the wavelength of 600 nm which is a commonly
used wavelength for indirect measurement of suspended E.coli cell concentration (Lin,
1995; Sezonov, 2007). As it is depicted in Figure 4.1, the growth rate of E.coli was
higher at elevated temperature and after 8 days of growth, the optical density reached
1.74 for the elevated temperature compared to 1.24 for room temperature experiment.
This is expected since the optimal temperature for E.coli growth is 37° C. According to
this figure, the optical density of bacteria slightly decreased on the second day which was
due to the initiation of media circulation and mixing of 150 mL of fresh LB broth from
the mixing reservoir into the biofilm reactor. This figure also shows that during the 8
days of biofilm formation the bacterial growth in suspension started with the exponential
Chapter 4: Biofilm Formation on Mortar Surface 65
growth phase and ended with the stationary growth phase, while the dead phase did not
occur (Figure 4.1). The dead phase starts when all the nutrients are exhausted, hence the
absence of this phase indicated that proper growth and feeding conditions were selected
for the bacterial growth.
At room temp.
E
fl </) co c z. a) CO ^ d)
o c (0
Q.-Q
O o (/> A (0
s
1.6
1.2
0.8 -
0.4
O At 37± 1°C
Time (day)
Figure 4.1: The optical density of bacteria grown in biofilm reactor as measured by absorbance reading at 600 nm at room and elevated temperature.
4.3 MONITORING BIOFILM FORMATION
The concentration of biomass on mortar cubes for biofilm grown at room temperature
was monitored during the 8 days of biofilm formation using membrane filtration and
ATP measurement. The results of biomass concentration on mortar specimens using
membrane filtration and ATP assay are shown in Figure 4.2 and Figure 4.3, respectively.
Both tests showed the progressive growth of biofilm on the mortar surfaces during the 8
days of biofilm growth (Figure 4.2 and Figure 4.3). According to Figure 4.2 and Figure
4.3, there was a low biomass concentration of 3 x 10⁴ CFU/cm or 1.5*103 pg ATP/cm2
Chapter 4: Biofilm Formation on Mortar Surface 66
on the mortar surface at the third day of growth. After 8 days of growth, the biomass
concentration increased to 18* 105 CFU/cm2 of mortar surface area equivalent to 43x 103
pg ATP/cm2 of biomass formed on the surface of mortar specimens. The large error bar
on Day 8 is likely caused by the differences in mortar specimens and vortex extraction
used to detach the bacteria from the surface of the mortar samples prior to enumeration.
o 6 0 0 o § 500
ox 2 400
§ §300 8g « q200 co E o (U
100
Day 3 Day 5 Day 8
Figure 4.2: Biomass concentration on the mortar surfaceas measured by the coliform forming unit at different time of biofilm growth; biomass concentration after 8 days was 18*105 CFU.
C\J E o
CD Q.
tn T3 c (0 </> 3 o _C h-
50
40
30 -j
20
10
Day 3 Day 5 Day 8
Figure 4.3: ATP of biomass on mortar surface at differnt days of biofilm growth as measured by ATP analysis.
Chapter 4: Biofilm Formation on Mortar Surface 67
4.4 SEM/EDS
The SEM micrographs of the mortar cubes were taken after 8 days of the biofilm growth.
In Figure 4.4, the SEM micrographs of mortar surface after 8 days of biofilm growth are
shown at different magnification. Figure 4.4a shows that the biofilm is fairly well
distributed over the mortar surface only after 8 days. The images of Figure 4.4b and c
with the higher magnification of 5K and 10K, respectively, show that the biofilm did not
have a uniform thickness over the entire surface. A high concentration of bacterial cells
was observed at some areas (Figure 4.4a, and b) and at some other locations, only a few
bacterial cells were attached (Figure 4.4a and c). Figure 4.5b which is the EDS analysis
of the 20x20 |im mortar surface area with no bacterial cell coverage (the area is shown in
Figure 4.5a) confirmed the presence of phosphorus as the main components of EPS and
bacterial cells (Todar, 2008). This might be due to the presence of EPS or bacterial cells
inside the mortar pores or due to a thin EPS layer that was present before and washed off
during the rinsing of the samples.
The elemental composition of E.coli consists of 50% carbon (C), 20% oxygen (O), 14%
nitrogen (N), 8 % hydrogen (H), 3% phosphorus (P) and traces of sulphur, potassium,
magnesium, calcium and iron (Todar, 2008). The abundant concentrations of C, and O
and Ca already present on the mortar surface made it difficult to distinguish their origin
and because there was no sign of the presence of N or H the only element indicating the
presence of E.coli biofilm was phosphorus. Table 4.1 shows the results of EDS analysis
on 250x250 |im area of a control mortar specimen without biofilm and a mortar specimen
covered with biofilm. Comparing the EDS results before and after biofilm formation
Chapter 4: Biofilm Formation on Mortar Surface 68
showed that the biofilm formation increased the amount of phosphorus on the mortar
surface (Table 4.1).
Figure 4.4: SEM micrographs of mortar surface covered with biofilm; a) IK magnification image, b) area with high concentration of bacterial cells, magnification: 5K; c) area with low bacterial cell concentration, magnification 10K.
Chapter 4: Biofilm Formation on Mortar Surface 69
a
20^im
l
Ca 0
4 keV
Figure 4.5:
Table 4.1:
Element Before biofilm formation
After 8 days of biofilm growth
P 0 2.41
C 29.76 38.86
O 51.46 41.65 Na 0.39 0
Mg 0.14 0 A1 0.75 0.56
Si 3.03 3.48 Ca 13.8 10.91 Fe 0.16 0
EDS analysis of biofilm-covered mortar on area with no bacterial cell; a) SEM micrograph showing the area used for EDS analysis, b) the corresponding EDS spectrum of the area with no bacterial concentration.
Percentage atomic fraction of elements on the mortar surface before and after biofilm formation, area of analysis was 250*250 (am.
Chapter 4: Biofilm Formation on Mortar Surface 70
4.5 FLUORESCENCE IN SITU HYBRIDIZATION
The presence of E.coli bacteria in the attached biofilm and its purity was verified using a
FISH probe designed to hybridize E.coli bacteria. The specificity of the probe was
confirmed with the pure overnight grown culture of E.coli DH5a (Figure 4.6).
Comparison of Figure 4.6a and b shows that all of the E.coli bacteria were hybridized
hence the selected hybridization technique and FISH probe was appropriate for imaging
the E.coli DH5a. Five additional images taken at other locations (not shown in this
thesis) that are similar to images in Figure 4.6 also suggested the suitability of the FISH
probe for E.coli bacteria.
Figure 4.7 is the image of attached bacteria extracted from the mortar surface after
biofilm formation stained with DAPI to visualize total bacteria (Figure 4.7a) and
hybridized with EC-1531 probe (Figure 4.7b) to distinguish the E.coli bacteria. By
comparing Figure 4.7a with Figure 4.7b, it was concluded that biofilm was composed of
E.coli bacteria since the DAPI stained cells with blue color were aligned with the
hybridized bacterial cells with green color. The purity of E.coli biofilm was also
confirmed by analysis of five other FISH images taken at other locations but not shown
in this thesis for brevity.
Chapter 4: Biofilm Formation on Mortar Surface 71
a
A
Figure 4.6: Images of pure E.coli DH5a; a) differential interference contrast (DIC) image showing all the present bacteria, b) florescent image showing the hybridized E.coli bacteria.
Chapter 4: Biofilm Formation on Mortar Surface
a
72
Figure 4.7: FISH Images for identification of E.coli in biofilm attached on the mortar surface; (a) Total bacteria present stained with DAPI (blue), (b) Same viewing of the sample hybridized with probe EC-1531 (green) to identify E.coli.
4.6 CONFOCAL SCANNING LASER MICROSCOPY
CLSM images of the attached biofilm layer were taken in 0.5-1 |im thick sections over
the entire thickness of biofilm for the analysis of percentage of live, and dead cell
coverage as well as percentage of voids and EPS coverage. The 0.5-1 (am subsections of
each view were projected on top of each other to prepare a new image that was used for
analysing the total proportion of live and dead cells and EPS. NIS Elements image
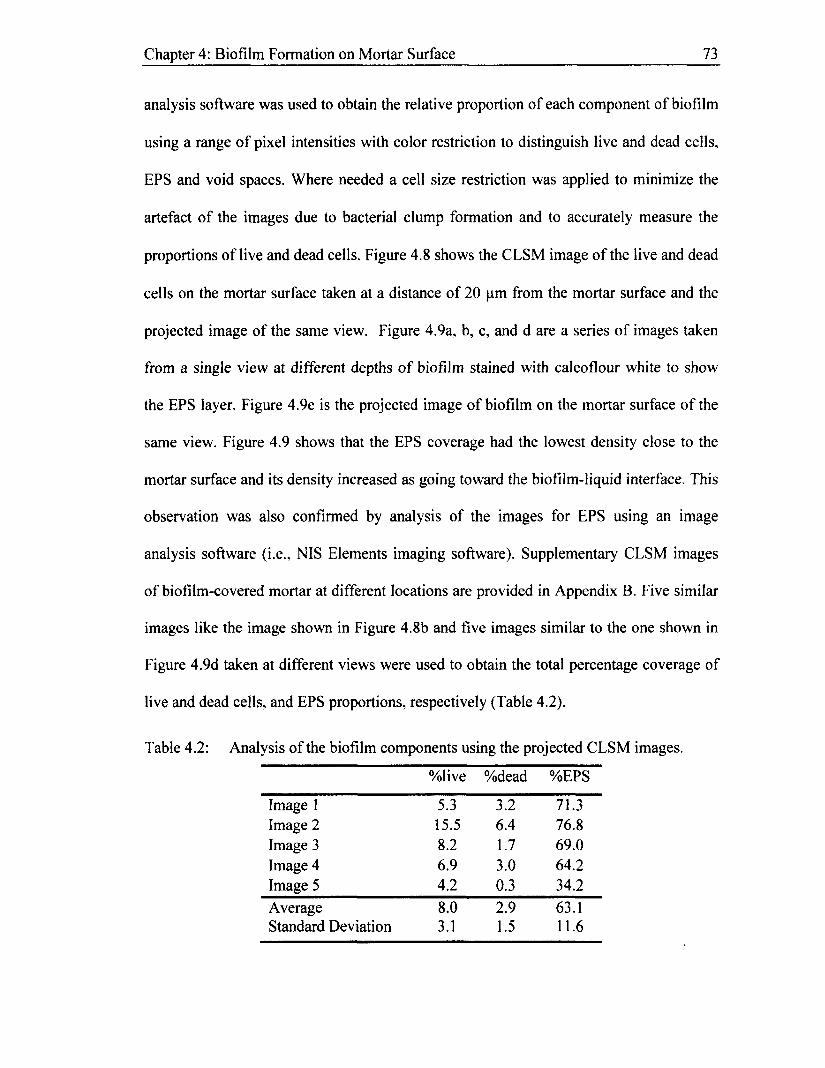
Chapter 4: Biofilm Formation on Mortar Surface 73
analysis software was used to obtain the relative proportion of each component of biofilm
using a range of pixel intensities with color restriction to distinguish live and dead cells,
EPS and void spaces. Where needed a cell size restriction was applied to minimize the
artefact of the images due to bacterial clump formation and to accurately measure the
proportions of live and dead cells. Figure 4.8 shows the CLSM image of the live and dead
cells on the mortar surface taken at a distance of 20 |im from the mortar surface and the
projected image of the same view. Figure 4.9a, b, c, and d are a series of images taken
from a single view at different depths of biofilm stained with calcoflour white to show
the EPS layer. Figure 4.9e is the projected image of biofilm on the mortar surface of the
same view. Figure 4.9 shows that the EPS coverage had the lowest density close to the
mortar surface and its density increased as going toward the biofilm-liquid interface. This
observation was also confirmed by analysis of the images for EPS using an image
analysis software (i.e., NIS Elements imaging software). Supplementary CLSM images
of biofilm-covered mortar at different locations are provided in Appendix B. Five similar
images like the image shown in Figure 4.8b and five images similar to the one shown in
Figure 4.9d taken at different views were used to obtain the total percentage coverage of
live and dead cells, and EPS proportions, respectively (Table 4.2).
Table 4.2: Analysis of the biofilm components using the projected CLSM images.
Average 8.0 2.9 63.1 Standard Deviation 3.1 1.5 11.6
Chapter 4: Biofilm Formation on Mortar Surface 74
As reported in Table 4.2, total percentage of live cells was always higher than total
percentage of dead cells and on average, the total live cells was 2.7 times higher than
total dead cells. Extra polymeric substances mostly covered more than 50% of the surface
area resulting in average EPS coverage of 63.1%.
The biofilm thickness was obtained by focusing on the top and bottom of the stained
biofilm and the distance between the two focused points was considered as the thickness.
The E.coli biofilm grown for 8 days had a varying thickness in a range of 20 to 40 |im.
The average thickness of the biofilm as measured from 8 different views in 4 different
mortar cubes was 29.7 jam.
Figure 4.8: Confocal laser scanning microscope images of 8 days grown biofilm of E.coli DH5a on mortar surface stained for live and dead cells; a) section of biofilm at 20 p.m distance from the mortar surface, b) projected image of all the subsections in the same position. Scale bar represents 10 |im. The green areas are live cells and red areas are dead cells.
Chapter 4: Biofilm Formation on Mortar Surface 75
10 (1111
Figure 4.9: Confocal laser scanning microscope images of 8 days grown biofilm on mortar surface stained for live cells (green), dead cells (red) and polysaccharide (cyan); image of biofilm at (a) 10 (im, (b) 20 |nm, (c) 30 |im, (d) 40 f^m distance from the mortar surface, e) projected image of all the subsections in the same view. Scale bar represents 10 p.
Chapter 4: Biofilm Formation on Mortar Surface 76
The depth profile of biofilm layer was obtained by analysing the images of 0.5-1 (im
thick sections over the entire biofilm thickness (Figure 4.10 and Figure 4.11). Depth
profile analysis of all biofilm images are not shown for reasons of brevity; analysis of all
depths at two representative positions with the same biofilm thickness is averaged in
Figure 4.10 and Figure 4.11. For all the images, the ratio of cellular (live and dead cells)
to non-cellular matter (polysaccharide and water channels) varied with depth. The
bacterial population near the mortar surface was the lowest. The population increased to
the highest concentration at 3/4 of the biofilm thickness, then decreased to a sparse
distribution of cells near the biofilm-liquid interface (Figure 4.10). This biofilm structure
is in agreement with Jayaraman et al. (1998) who observed a similar bacterial distribution
for E.coli and Pseudomonas fragi biofilm developed on steel coupons. In all the biofilm
images, the concentration of the live cells was 2-3 times higher than the concentration of
dead cells (Figure 4.10).
1 Live
0 10 20 30 Distance from mortar surface (urn)
Figure 4.10: Live and dead cell distribution profiles of 8 day grown E.coli biofilm developed on mortar surface. Measurements are the average of two representative positions in the biofilm.
Chapter 4: Biofilm Formation on Mortar Surface 77
The EPS was less detected near the biofilm-mortar interface and increased over the
biofilm thickness to reach the highest percentage coverage of 65% at the biofilm-liquid
interface (Figure 4.11).
• EPS
20
-i 1 1 1 r
10 20 Distance from mortar surface (^m)
30
Figure 4.11: EPS and void distribution profiles of 8 day grown E.coli biofilm developed on mortar surface. Measurements are the average of two representative positions with the same biofilm thickness.
The biofilm was also covered with a thin layer of slime composed of loose live and dead
cells which could not be retained on top of the mortar specimens during the staining
procedure. EPS accounted for approximately 10-78 % of the E.coli biofilm over the entire
depth of biofilm whereas the bacterial cells were detected at 0.2-2.5% coverage (Figure
4.10 and Figure 4.11).
4.7 CONCLUDING REMARKS
Biofilm was successfully grown on the mortar specimens. CLSM image analysis of the
biofilm and quantification of the relative proportions of live cells, dead cells, EPS and
void space revealed that the biofilm was not uniformly covering the surface after 8 days
Chapter 4: Biofilm Formation on Mortar Surface 78
of growth. It would be necessary to grow biofilm for a longer time to generate a biofilm
layer with higher number of cell coverage and EPS formation. However, the presence of
a fairly high quantity of EPS indicated the formation of a stable and good resistant
biofilm with fewer tendencies for cell detachment (Jayaraman et al., 1998).
The SEM micrographs of the mortar surface also confirmed the presence of a non
uniform biofilm; however, the presence of a thin layer of materials with the presence of
phosphorus was detected at the void spaces. FISH images of the biofilm also confirmed
that the biofilm was composed of E. coli bacteria and not taken over by another bacteria
present in the environment.
CHAPTER 5. CHEMICAL SULPHURIC ACID
DETERIORATION
5.1 INTRODUCTION
In this chapter, the results of chemically induced deterioration as simulated by exposure
to the sulphuric acid solution are presented. The severity of the mortar deterioration was
evaluated by measuring the concentration of calcium leach-out, microscopic analysis
such as SEM and EDS, crystal analysis using XRD. After the acidification, the biofilm
condition in terms of its spatial distribution and structure was evaluated on the biofilm-
covered specimens by CLSM. VSS measurement was employed to compare the
concentration of biomass before and after acidification.
5.2 CHEMICAL ANALYSIS
Mortar disks were chemically acidified in the reactor shown in Figure 3.1 by incremental
exposure to acidic solution of LB broth at pH of 6, 5, 4, and 3. The incremental
acidification was applied in order not to introduce a sudden shock to the biofilm bacteria.
The solution pH and calcium concentration were measured during the acidification
process to compare the severity of deterioration in the control mortar specimens (i.e.,
mortar specimen without biofilm) and in the biofilm-covered mortar specimens; these
79
Chapter 5: Chemical Sulphuric Acid Deterioration 80
measurements were also used to evaluate the effectiveness of biofilm as an alternative
method for the inhibition of deterioration of mortar in an acidic environment. Figure 5.1
shows the results of pH measurement in two separate reactors containing mortar
specimens without biofilm and biofilm-covered mortar specimens. As shown in Figure
5.1 , after each acidification cycle the pH of the broth increased for both control and
biofilm-covered mortars; however, the increase in pH was considerably higher in the
biofilm-covered mortar than that of the control sample. For example, in the second cycle
with the desired pH reduction of 5, the solution pH after two days of exposure in the
container with biofilm-covered mortar increased to 6.8 while the pH of the broth in the
control sample container increased to 5.8. If the increase in the pH for the control sample
can be attributed to the minor leaching of Ca(OH)2 from the mortar as will be discussed
later and shown in Figure 5.2, it can be hypothesized that the E.coli bacteria resisted the
acidification most likely by increasing the buffering capacity of the solution. This
hypothesis is supported by other researchers who reported that bacteria grown in acidic
environment have a tendency to keep their internal pH at a more alkaline pH than that of
the environment by controlling the movements of cations through their membrane and
increasing the extracellular buffering capacity (Slonczewski, 2009; Booth, 1999). It
should also be noted that higher pH increase due to the bacterial assimilation may have
lessened the influence of pH reduction on deterioration of biofilm-covered mortar
specimens since the biofilm-covered specimens were exposed to the lower pH for a
shorter period of time. Figure 5.2 shows that the incremental acidification increased the
calcium leach-out in both the control specimens without biofilm and the biofilm-covered
specimens. However, higher calcium leach-out was observed in the control specimen
Chapter 5: Chemical Sulphuric Acid Deterioration 81
than the biofilm-covered specimen (Figure 5.2). The biofilm was more effective in
preventing the calcium leach-out at pH values higher than 5. As it is shown in Figure 5.2,
the amount of calcium leached out during the second cycle of exposure to pH of 5 was 21
ppm in biofilm-covered specimen compared to 42 ppm in control specimen. The rate of
calcium leach-out during the last acidification cycle by exposure to pH of 3 was increased
by 8.4 and 5.5 times compared to second cycle at pH of 5 for biofilm-covered and control
specimen, respectively (Figure 5.2).
1st cycle 2nd cycle 3rd cycle 4thcycle i H 1—^ 1 M 8
Figure 5.2: Accumulative calcium concentration in the reactor with biofilm-covered mortar and reactor with control mortar specimen without biofilm under chemical acidification.
Figure 5.3: Accumulative calcium concentration of the replica experiment in the reactor with biofilm-covered mortar and reactor with control mortar specimen without biofilm.
Chapter 5: Chemical Sulphuric Acid Deterioration 83
A replica experiment was performed to confirm the results presented in Figure 5.2. The
same trend for the calcium concentration was observed in the replica reactors as shown in
Figure 5.3.
5.3 SEM/EDS
The SEM micrographs of the control mortar specimen and biofilm-covered mortar was
collected after each acidification cycle. Figure 5.4 shows the SEM images of biofilm-
covered mortar after the second cycle of acidification by exposure to pH of 5. Comparing
Figure 5.4a which is the image of biofilm-covered mortar before acidification with Figure
5.4b which is the image of biofilm-covered mortar after the second cycle of acidification
indicates that reducing the pH of the solution from the initial pH of 7 to 5 decreased the
concentration of the bacteria in the biofilm-covered specimen (Figure 5.4a). However, the
biofilm was still thick and dense in some areas with good coverage of bacteria (Figure
5.4c) and was thinner and less dense in other places where fewer bacteria were visible
(Figure 5.4b). The SEM micrograph of control mortar sample without biofilm after
exposure to pH of 5 is shown in Figure 5.5. This image shows the formation of some
micro cracks and deterioration initiation after the exposure to pH of 5 (Figure 5.5).
Comparing Figure 5.4 with Figure 5.5, a smoother surface was observed in the control
mortar than the biofilm-covered mortar. This may be due to the formation of a layer of
silica gel on top of the mortar surface so the surface seems to be smoother especially at
the beginning of the acidification.
Chapter 5: Chemical Sulphuric Acid Deterioration 84
a
Figure 5.4: a) SEM micrograph with lOOOx magnification of biofilm-covered mortar before acidification; b & c) SEM micrograph of biofilm-covered mortar specimen after exposure to pH of 5; b) lOOOx magnification showing biofilm with less bacterial concentration, c) 5000 x magnification showing high concentration of bacteria in biofilm.
Chapter 5: Chemical Sulphuric Acid Deterioration 85
Figure 5.5: SEM image of mortar surface without biofilm after exposing to pH 5 shows formation of cracks on the surface; 1 OOOx magnification.
Even after exposure to pH of 4 and 3 during the 2 week acidification period, the biofilm
layer covering the mortar surface expanded which indicated that the bacteria could
survive and continue to grow in this low pH environment (Figure 5.6a). The increase in
the concentration of bacteria is likely due to the availability of enough nutrients for
bacterial growth and their adoption to the low pH environment. According to Kubota et
al. (2008), the higher EPS secretion increases the resistance of biofilm to the acidic
environment; hence it is reasonable that they resist the high acidic environment by
increasing the rate of EPS production. The higher buffering capacity of mortar surface
due to the presence of calcium hydroxide also provided a good substrate for the biofilm
growth during the acidification process resulting in more bacteria growth on the mortar
surface. Focusing on the biofilm layer at higher magnification in Figure 5.6b showed
some damages to the structure and morphology of the cells which was suspected to be
due to the low pH environment. If the environmental conditions are altered beyond the
Chapter 5: Chemical Sulphuric Acid Deterioration 86
normal limits, the cell membranes are often found to undergo gross structural changes.
Exposure of the sample of mortar without biofilm to pH of 3 showed the presence of an
amorphous layer covering the whole surface (Figure 5.7). The amorphous gelatinous
layer is most likely hydrous silica gel resulting from the dissolution of C-S-H and is the
consequence of sulphate attack as explained in the following paragraph.
• • •
Figure 5.6: SEM image of biofilm-covered mortar surface after the last cycle of acidification; a) 1000 x magnification of the mortar surface; b) 5000 x magnification of the bacterial cell in biofilm.
Chapter 5: Chemical Sulphuric Acid Deterioration 87
Figure 5.7: SEM image of control mortar surface without biofilm after exposure to pH value of 3.
The increase in the atomic fraction of Si and Al on the mortar surface without biofilm
after chemical acidification is an indicator of concrete deterioration. The increase in Si is
an indication of formation of silica gel which is a consequence of decomposition of C-S-
H (Monteny et al., 2000; Skalny et al., 2001). Skalny et al. (2001) explains that under
acidic conditions, the calcium sulfoaluminate hydrate phases (i.e., AFm and AFt) present
in the hydrated paste lose their stability and convert to gypsum and aluminum; hence the
increase in the atomic percentage of Al represents decomposition of the sulfoaluminate
hydrate phases and initiation of sulphate attack. The EDS analysis results of 200 nm><200
Hm area of mortar specimens before and after acidification are provided in Table 5.1.
Similar results were also obtained when different 200 |imx200 fim areas on mortar
specimens were analyzed. Comparing the EDS analysis of a mortar surface without
biofilm showed that the two elements of Al and Si increased from 0.75 and 3.03 %
atomic fraction to 2.34 and 6.02 %, respectively (Table 5.1). Despite the increase of Al
and Si on control specimen, the biofilm-covered mortar did not show any increase in the
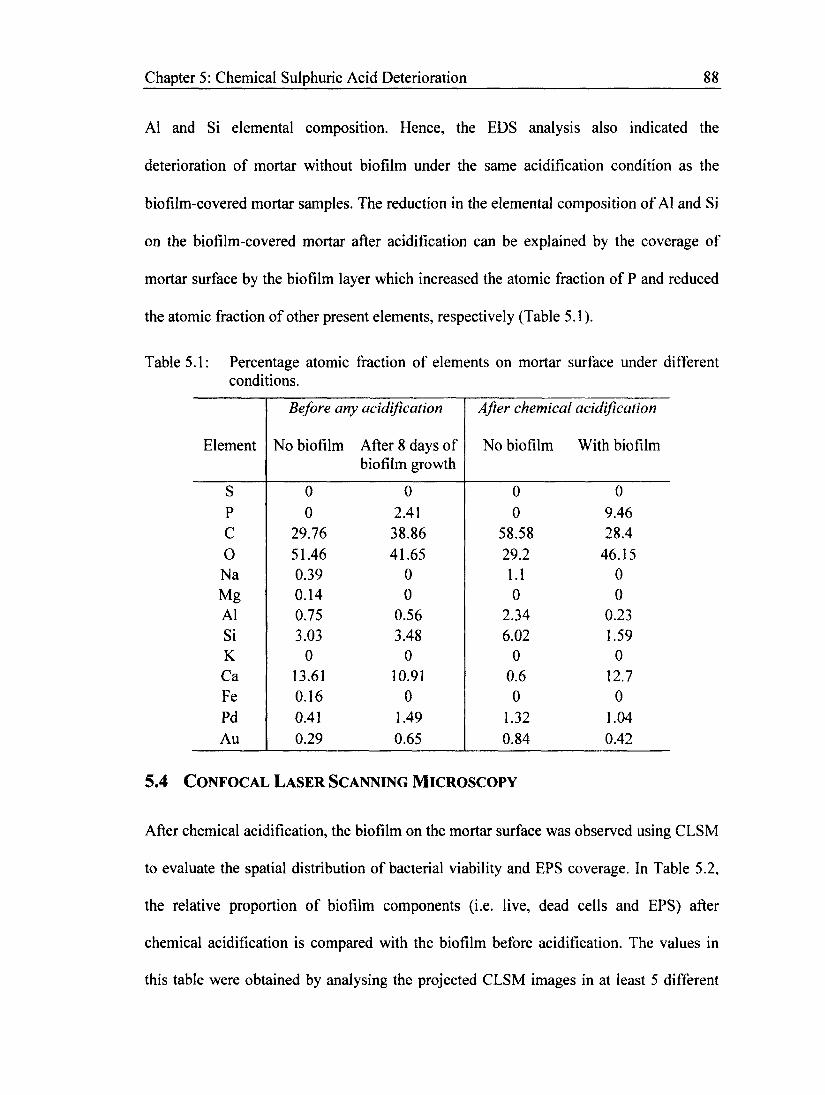
Chapter 5: Chemical Sulphuric Acid Deterioration 88
A1 and Si elemental composition. Hence, the EDS analysis also indicated the
deterioration of mortar without biofilm under the same acidification condition as the
biofilm-covered mortar samples. The reduction in the elemental composition of A1 and Si
on the biofilm-covered mortar after acidification can be explained by the coverage of
mortar surface by the biofilm layer which increased the atomic fraction of P and reduced
the atomic fraction of other present elements, respectively (Table 5.1).
Table 5.1: Percentage atomic fraction of elements on mortar surface under different conditions.
Element
Before any acidification
No biofilm After 8 days of biofilm growth
After chemical acidification
No biofilm With biofilm
S 0 0 0 0
P 0 2.41 0 9.46
C 29.76 38.86 58.58 28.4
0 51.46 41.65 29.2 46.15
Na 0.39 0 1.1 0
Mg 0.14 0 0 0 A1 0.75 0.56 2.34 0.23
Si 3.03 3.48 6.02 1.59 K 0 0 0 0 Ca 13.61 10.91 0.6 12.7 Fe 0.16 0 0 0
Pd 0.41 1.49 1.32 1.04
Au 0.29 0.65 0.84 0.42
5.4 CONFOCAL LASER SCANNING MICROSCOPY
After chemical acidification, the biofilm on the mortar surface was observed using CLSM
to evaluate the spatial distribution of bacterial viability and EPS coverage. In Table 5.2,
the relative proportion of biofilm components (i.e. live, dead cells and EPS) after
chemical acidification is compared with the biofilm before acidification. The values in
this table were obtained by analysing the projected CLSM images in at least 5 different
Chapter 5: Chemical Sulphuric Acid Deterioration 89
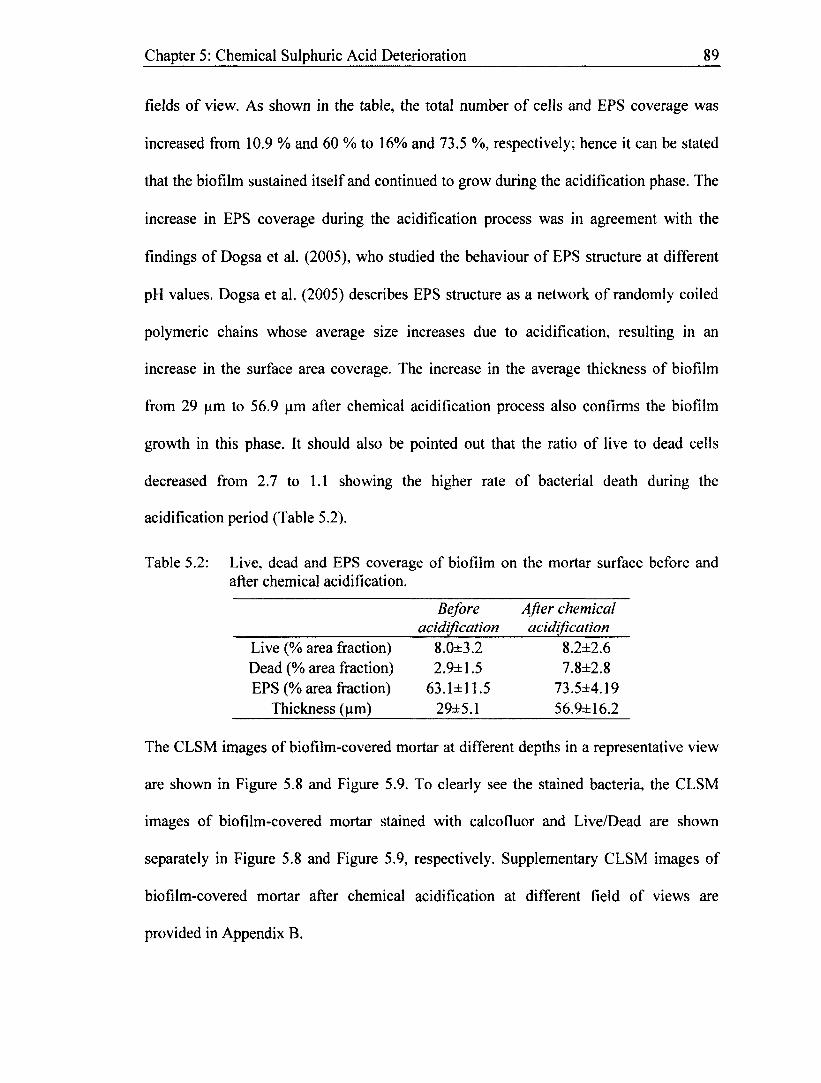
fields of view. As shown in the table, the total number of cells and EPS coverage was
increased from 10.9 % and 60 % to 16% and 73.5 %, respectively; hence it can be stated
that the biofilm sustained itself and continued to grow during the acidification phase. The
increase in EPS coverage during the acidification process was in agreement with the
findings of Dogsa et al. (2005), who studied the behaviour of EPS structure at different
pH values. Dogsa et al. (2005) describes EPS structure as a network of randomly coiled
polymeric chains whose average size increases due to acidification, resulting in an
increase in the surface area coverage. The increase in the average thickness of biofilm
from 29 ^m to 56.9 ^im after chemical acidification process also confirms the biofilm
growth in this phase. It should also be pointed out that the ratio of live to dead cells
decreased from 2.7 to 1.1 showing the higher rate of bacterial death during the
acidification period (Table 5.2).
Table 5.2: Live, dead and EPS coverage of biofilm on the mortar surface before and after chemical acidification.
Before After chemical acidification acidification
Live (% area fraction) 8.0±3.2 8.2±2.6
Dead (% area fraction) 2.9±1.5 7.8±2.8
EPS (% area fraction) 63.1±11.5 73.5±4.19
Thickness (jim) 29±5.1 56.9±16.2
The CLSM images of biofilm-covered mortar at different depths in a representative view
are shown in Figure 5.8 and Figure 5.9. To clearly see the stained bacteria, the CLSM
images of biofilm-covered mortar stained with calcofluor and Live/Dead are shown
separately in Figure 5.8 and Figure 5.9, respectively. Supplementary CLSM images of
biofilm-covered mortar after chemical acidification at different field of views are
provided in Appendix B.
Chapter 5: Chemical Sulphuric Acid Deterioration
b a
90
c
e
d
f
Figure 5.8: CLSM images of biofilm on mortar surface after chemical acidification stained with calcoflour for polysaccharide (cyan); image of biofilm at (a) 10 (am, (b) 20 urn, (c) 31 ^m, (d) 45 nm, (e) 59 ^m distance from the mortar surface, f) projected image of all the subsections in the same view. Scale bar represents 10 |im.
Chapter 5: Chemical Sulphuric Acid Deterioration
a
91
c
e
d
f
Figure 5.9: CLSM images of biofilm on mortar surface after chemical acidification stained for live cells (green) and dead cells (red); image of biofilm at (a) 10 (im, (b) 20 ^m, (c) 30 (im, (d) 40 jam, (e) 50 |im distance from the mortar surface, f) projected image of all the subsections in the same view. Scale bar represents 10 (im.
Chapter 5: Chemical Sulphuric Acid Deterioration 92
8 -i
20 40 Distance from mortar surface (jim)
60
o Dead
T
5 10 15 20 Distance from mortar surface (urn)
25
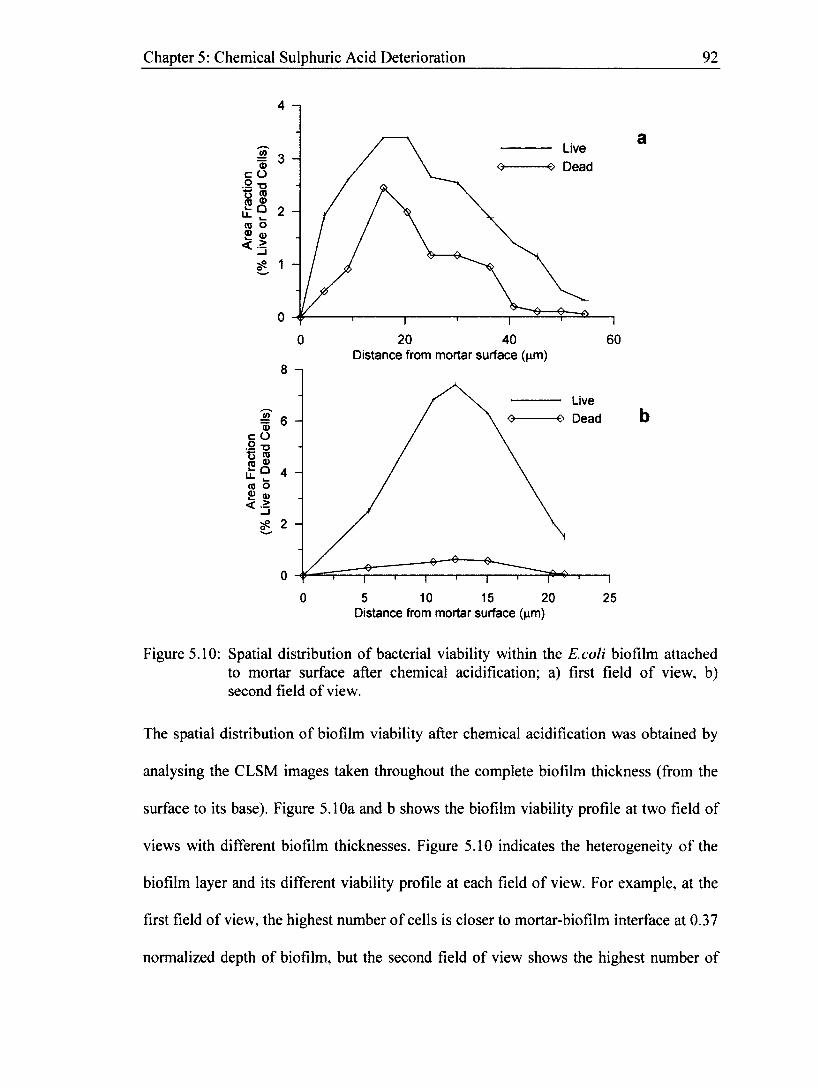
Figure 5.10: Spatial distribution of bacterial viability within the E.coli biofilm attached to mortar surface after chemical acidification; a) first field of view, b) second field of view.
The spatial distribution of biofilm viability after chemical acidification was obtained by
analysing the CLSM images taken throughout the complete biofilm thickness (from the
surface to its base). Figure 5.10a and b shows the biofilm viability profile at two field of
views with different biofilm thicknesses. Figure 5.10 indicates the heterogeneity of the
biofilm layer and its different viability profile at each field of view. For example, at the
first field of view, the highest number of cells is closer to mortar-biofilm interface at 0.37
normalized depth of biofilm, but the second field of view shows the highest number of
Chapter 5: Chemical Sulphuric Acid Deterioration 93
cells being closer to biofilm-liquid interface at 0.6 normalized depth (normalized depth is
defined as the respected depth divided by the biofilm thickness).
Figure 5.11 shows the spatial distribution of EPS coverage in the biofilm layer before and
after acidification process. This graph shows that after the acidification, the structure of
the biofilm was changed with more EPS coverage in the middle of biofilm than the
biofilm-liquid interface. It is suspected to be due to the low pH condition during the
acidification process which increased the rate of biofilm detachment at the biofilm-liquid
interface resulting in the decrease in EPS coverage at the biofilm-liquid interface (Figure
5.11). As illustrated in Figure 5.11, after acidification, the percentage of EPS coverage
was reduced in different depths whitin the biofilm. For example at 20 |am the percentage
EPS coverage was reduced from 44 % before the acidification to 24-26% coverage after
the acidification (Figure 5.11); however, due to the biofilm growth during the
acidification and the increase in thickness of biofilm, the overall EPS coverage was
increased as reported in Table 5.2.
60 -| o
•- -• Before acidification -i After acidification-1* view -€> After acidification-2nd view
0 20 40 60 80 Distance from mortar surface (nm)
Figure 5.11: Comparison of spatial distribution of EPS coverage within the E.coli biofilm before and after chemical acidification.
Chapter 5: Chemical Sulphuric Acid Deterioration 94
5.5 VOLATILE SUSPENDED SOLIDS
Volatile suspended solids of biomass attached on mortar specimens before and after
chemical acidification were measured to quantify the changes in bacteria densities. As
illustrated in Figure 5.12, VSS concentration on the biofilm-covered mortar samples
increased from 16 mg/cm before the acidification to 80 mg/cm after the chemical
acidification. The VSS measurements support the CLSM analyses that show an increase
in biomass accumulation and confirm the growth of the biofilm layer during the
acidification process.
CM E o CT> E OT CO >
90
80
70
60
50
40
30
20
10
0 After biofilm
formation After chemical acidification
Figure 5.12: Volatile suspended solids measurement of biomass attached to mortar specimens (the values are the average of two VSS measurement on the surface of two mortar cubes).
5.6 X-RAY DIFFRACTION
The main purpose of XRD analysis was to identify the presence of gypsum and ettrengite
crystals known to be the indicators of sulphuric acid attack in concrete. The use of XRD
to quantify the concentration of compounds and minerals is not recommended since in
Chapter 5: Chemical Sulphuric Acid Deterioration 95
most of the cases it underestimates the quantities or does not detect the presence of
substances as a result of the presence of crystal dislocations, embedment of materials in
other phases or in gels and impurity of minerals (Ramachandran and Beaudoin, 2001).
Therefore XRD technique is not used to quantify the amounts of the crystals in this study.
1200
1100
1000
900
800
700
o 600
• 500
400 MH 300
200
100
0 5
20 Scale
Figure 5.13: XRD of mortar powder taken from top 0.5 mm surface of mortar surface before any treatment; dolomite (D), gypsum (G), quartz (Q), magnesium calcite (C), winchitte potassium (W).
The XRD of powdered mortar samples taken from an untreated mortar specimen were
compared with the chemically acidified mortar samples taken from specimens covered
with biofilm and without biofilm. The XRD results of the top 0.5 mm layer of untreated
mortar sample identified the presence of dolomite (D), quartz (Q), magnesium calcite
(C), and winchitte potassium (W) (Figure 5.13). The XRD analysis of control mortar
without biofilm and biofilm-covered mortar after chemical acidification is shown in
Chapter 5: Chemical Sulphuric Acid Deterioration 96
Figure 5.14 and Figure 5.15, respectively. As illustrated in these figures, regardless of the
presence of biofilm, the crystal composition of mortar specimens after chemical
acidification were similar to the untreated mortar except for the increase in the formation
of magnesium sulphate hydroxide (MH) (Figure 5.14 and Figure 5.15). The XRD
analysis of control mortar after chemical acidification confirms the SEM findings in
which no gypsum or ettrengite crystals were observed (Figure 5.7). As explained by
Skalny (2002) and Allahverdi and Skvara (2000) during the sulphuric acid attack of
cementitious materials, C-S-H and calcium hydroxide of the concrete will be ultimately
converted to amorphous silica gel hence the peak of gypsum or ettrengite crystals were
not present in the XRD pattern of the control mortar after acidification (Figure 5.14).
500
Q
^ 400
c 3 Q 300
MH
W
200 ' C
100 W
MH Q C
, V i • I
10 20 30
20 Scale 40 50
Figure 5.14: XRD of mortar powder taken from top 0.5 mm surface of mortar without biofilm after chemical acidification; dolomite (D), gypsum (G), quartz (Q), magnesium calcite (C), magnesium sulphate hydroxide (MH), winchitte potassium (W).
Chapter 5: Chemical Sulphuric Acid Deterioration 97
1500:
1400:
1300-
1200: 1100 1000 900
_ 800 % 700
o 600: 9 500
£ 400
"J 300 200 100
0
w
10
MH.W
C D
20 30 20 Scale
40 50
Figure 5.15: XRD of mortar powder taken from top 0.5 mm surface of biofilm-covered mortar after chemical acidification; calcium carbonate (CC), dolomite (D), gypsum (G), quartz (Q), magnesium calcite (C), magnesium sulphate hydroxide (MH), winchitte potassium (W).
5.7 CONCLUDING REMARKS
The effectiveness of biofilm as a protective barrier against sulphuric acid attack in mortar
was shown using sulphuric acid solutions. The data from calcium leach-out
concentration, SEM and EDS analysis all suggest that the presence of biofilm helped to
reduce the chemically induced mortar deterioration. The calcium concentration in control
reactors without biofilm was 23-47% higher than the reactors with biofilm-covered
mortar. This confirms a higher dissolution rate of calcium hydroxide and C-S-H from the
control mortars than the biofilm-covered mortars.
SEM micrographs taken after the chemical acidification process showed the presence of
silica gel on the mortar surface without biofilm which is an indication of sulphate attack.
Chapter 5: Chemical Sulphuric Acid Deterioration 98
The presence of silica gel was also confirmed with the EDS analysis and increase in the
atomic fraction of Si on the control mortar samples.
CLSM and VSS analysis both confirmed that the biofilm remained alive and continued to
grow during the acidification process.
CHAPTER 6. BIOGENIC SULPHURIC ACID
DETERIORATION
6.1 INTRODUCTION
The effectiveness of biofilm against the biogenic sulphuric acid deterioration was
evaluated in this chapter. In order to simulate the biogenic sulphuric acid deterioration,
two strains of SOB, Thiobacillus thiooxidans and Thiobacillus neapolitanus, were grown
in the modified broth at neutral pH to naturally reduce the pH of medium inside the
reactor by their activities. The severity of the mortar deterioration was evaluated by
measuring the concentration of calcium leach-out, microscopic analysis such as SEM and
EDS, crystal analysis using XRD. FISH was employed to confirm the presence of E.coli
biofilm and to distinguish the E.coli bacteria from the SOB on the mortar surface after the
biogenic acidification. VSS measurement was employed to compare the concentration of
biomass before and after acidification. The biofilm properties (i.e., live, dead and EPS
coverage) and their spatial distribution was evaluated on the biofilm-covered specimens
by CLSM. CLSM was also employed to identify the presence and viability of SOB
bacteria attached to the control mortar surface without biofilm after the biogenic
Figure 6.1: The pH decrease in different modified broths due to the growth of T.thiooxidans and T.neapolitanus.
6000 I I MB1
O O MB2 =5, 5000
o o .1 4000 ° 2? O O
O
O
o
§ 3000 c o
O 2000 CO x: "5 1000 O w o
0 : • •
0 2 4 6 8 10 12 Time (days)
Figure 6.2: The sulphate generation in different modified broths due to the growth of T.thiooxidans and T.neapolitanus; data points are the average of three readings with the standard deviation of less than 250 mg/L.
6.3 EVALUATION OF MORTAR DETERIORATION
In this section, the severity of deterioration due to the biogenic acidification on the
control mortar disks (i.e., mortar specimen without biofilm) and the biofilm-covered
30- , 1 s t cycle of ac id i f ica t ion 2" cycle of acidification M •
e Without biofilm .2 E 60 » With biofilm
| 8 2°
r 10 15 Time (day)
Figure 6.5: Accumulative calcium concentration in the reactor with biofilm-covered mortar and reactor with control mortar specimen without biofilm under biogenic acidification.
A duplicate set of experiments was performed to confirm the accuracy of the results and
to see if the contamination issue in the second cycle can be eliminated. Figure 6.6, Figure
6.7 and Figure 6.8 are the results of pH measurement, sulphate and calcium concentration
for the duplicate set of the experiments. As illustrated in Figure 6.6, the same trend was
observed for pH of the solution as the pH decreased in the control reactor but remained
constant without any decrease in the reactor with biofilm-covered mortar. However, in
the duplicate experiments, the time of exposure to the low acidic environment was lower
than the first set. For example, the time for the control reactor to reach the pH of 5.5 was
10 days in the duplicate experiment (Figure 6.6) compared to 4 days in the first set of
experiments (Figure 6.3). This observation may be explained by less activity of the SOB
in the duplicate experiment as compared to the first experiment. Comparing the sulphate
concentration graphs (Figure 6.4 and Figure 6.7) also shows that the SOB had a higher
growth rate in the first experiment and could increase the sulphate concentration to the
Figure 6.6: pH in the reactor with biofilm-covered mortar and control mortar specimen without biofilm under biogenic acidification for the duplicate set of experiment.
c o CO c <1> o c
(0 JC CL 3 c/3
5000
4000
3000 -
e Without biofilm
A With biofilm
O) V I-o E £ ̂ 2000
1000
10 20 30 Time (day)
Figure 6.7: Sulphate concentration in the reactor with biofilm-covered mortar and reactor with control mortar specimen without biofilm for duplicate experiment.
Figure 6.8: Accumulative calcium concentration in the reactor with biofilm-covered mortar and reactor with control mortar specimen without biofilm under biogenic acidification.
6.3.2 X-ray diffraction
The XRD analysis of an untreated mortar specimen was compared with the biologically
acidified mortar samples covered with biofilm and without biofilm. For each mortar
specimen, the XRD analysis was performed on the mortar powder collected from two
layers, the top 0.5 mm layer and the 0.5-1 mm layer. In order to identify the origin of
crystals on the untreated mortar sample, the XRD pattern of untreated mortar was
compared with the XRD pattern of the sand used for making the cement mortar. As
illustrated in Figure 6.9, the sand was mainly made of quartz (Q), winchite potassium
(W) and magnesium sulphate hydroxide (MH) crystals. The XRD pattern of hardened
cement mortar also showed the presence of Q, W and MH crystals but in different
Figure 6.9: XRD pattern of sand sample used for constructing the mortar specimens; dolomite (D), quartz (Q), magnesium calcite (C), winchite potassium (W), magnesium sulphate hydroxide (MH).
i-Q
1100
1000
900
£ 800 i
O 700 i
600
-1 500 i
400 i
300 i
200 1
100 1
50 10 20 5 30 20 Scale
Figure 6.10: XRD of mortar powder taken from top 0.5 mm surface of mortar surface before any treatment; dolomite (D), quartz (Q), magnesium calcite (C), winchite potassium (W), magnesium sulphate hydroxide (MH).
presence of flower-like crystals of calcium carbonate but no evidence of gypsum or
ettrengite formation.
b
crystals
50
Figure 6.14: SEM micrographs of biofilm-covered mortar specimen after biogenic acidification; a) 200x magnification showing biofilm covering the surface in big patches, b) 500x magnification of biofilm-covered biofilm after removing the biofilm showing the formation of calcium carbonate crystals.
Figure 6.15: SEM micrographs of control mortar specimen after biogenic acidification; a) 200x magnification showing a layer of SOB bacterial film on top of some crystals , b) 200x magnification showing cracks and gypsum crystals.
It was also noticed that the biogenic acidification increased the amount of A1 on the
control mortar from 0.75 to 4.37 % atomic fraction (Table 6.1). This may be explained by
the decomposition of calcium sulfoaluminate hydrate phases (i.e., AFm and AFt) and
their conversion to gypsum in the acidic environment. On the contrary, the EDS analysis
of biofilm-covered mortar did not show any increase in the atomic fraction of A1 and Si
Florescence in situ hybridization was employed to confirm the presence of E.coli bio film
on the biofilm-covered mortar after the biogenic acidification and to determine whether
SOB can compete with the E.coli for surface attachment. Figure 6.16 is the image of
bacteria collected from the biofilm-covered mortar after biogenic acidification. The
collected bacteria were stained with DAPI to identify all the bacteria and hybridized with
the E.coli FISH probe (green) to identify only the E.coli bacteria. Bacteria that were
stained with DAPI but not seen with the E. coli probe would be the SOB.
a
b
Figure 6.16: Image of bacteria collected from biofilm-covered mortar specimen after biogenic acidification a) DAPI stained image showing all the present bacteria in blue b) FISH image of the same view showing only the E.coli bacteria in green.
Figure 6.18: CLSM images of biofilm on mortar surface after biogenic acidification stained with calcoflour for polysaccharide (cyan); image of biofilm at (a) 20(^m, (b) 30 jim, (c) 40 |xm, (d) 55 |im, (e) 70 f*m distance from the mortar surface, f) projected image of all the subsections in the same view. Scale bar represents 10 (am.
Chapter 6: Biogenic Sulphuric Acid Deterioration
a
122
c d
e f
Figure 6.19: CLSM images of biofilm on mortar surface after biogenic acidification stained for live cells (green) and dead cells (red); image of biofilm at (a) 20^m, (b) 30 |am, (c) 40 |nm, (d) 55 ^im, (e) 70 |im distance from the mortar surface, f) projected image of all the subsections in the same view. Scale bar represents 10 (im.
Figure 6.20: Spatial distribution of bacterial viability within the E.coli biofilm attached to mortar surface after biogenic acidification at two different location.
The spatial distribution of biofilm viability after biogenic acidification which was
obtained by analysing the CLSM images are shown in Figure 6.20 for two different
positions with different biofilm thicknesses. Comparing the viability profiles in Figure
6.20a and b indicates the heterogeneity of the biofilm layer and its differences at each
field of view. For example, at the first field of view, the highest number of cells is at the
middle of biofilm layer, but the second field of view shows the highest number of cells
Volatile suspended solids of the biomass attached on mortar specimens before and after
biogenic acidification were measured to confirm the results of the CLSM analysis.
According to Figure 6.22, VSS concentration on the biofilm-covered mortar sample
increased from 16 mg/cm before the acidification to 60 mg/cm after the biogenic
acidification. The VSS concentration of 92 mg/cm2 was obtained for the control mortar
specimen which was higher than the biofilm-covered sample with the VSS of 60 mg/cm2.
This was likely due to the higher tendency of SOB for attachment to the mortar surface
and E.coli bacteria preventing SOB attachment. The VSS finding was in accordance with
the CLSM analysis showing an increase in biomass accumulation and confirming the
growth and sustainability of a biofilm layer during the biogenic acidification.
to 40
After biofilm formation
Biogenicly acidified -with
biofilm
Biogenicly acidified - no
biofilm
Figure 6.22: Volatile suspended solids measurement of biomass attached to mortar specimens after biogenic acidification (the values are the average of two VSS measurement on the surface of two mortar cubes).
Figure 7.1: pH in the reactor with biofilm-covered mortar and control mortar specimen without biofilm under biogenic acidification at elevated temperature of 37±1° C.
The graph of sulphate concentration as shown in Figure 7.2 also supported the higher
sulphate concentration representing a higher rate of SOB growth in the control reactor
compared with reactor containing the biofilm-covered mortar. After 23 days of exposure
to SOB during the first cycle of acidification, the highest sulphate concentration was
6350 mg/L and 3550 mg/L in the control reactor and reactor containing the biofilm-
covered mortar, respectively (Figure 7.2). Therefore, achieving a lower pH in the control
Chapter 7: Effect of High Temperature and Mechanisms of Deterioration 131
reactor compared to the reactor containing biofilm-covered mortar may also be due to the
higher activity of SOB in the control reactor, which was impeded in the biofilm-covered
reactor due to the E.coli activity. The decalcification of mortar was observed in both
reactors by an increase in the calcium concentration of the solution; the amount of
calcium leach-out was 4.9 times higher in the control reactor than the reactor with
biofilm-covered mortar: As illustrated in Figure 7.3, the calcium concentration after the
first cycle of acidification was 136 ppm in the control reactor compared with 28 ppm in
the reactor with the biofilm-covered mortar.
8000 1st cycle of acidification 2nd cycle of acidification
x
6000
a) —» o _i
§> 4000 o Without biofilm
With biofilm
Q. 2000
0 10 20 30 40 50 Time (day)
Figure 7.2: Sulphate concentration in the reactor with biofilm-covered mortar and control mortar specimen without biofilm under biogenic acidification at elevated temperature of 37±1° C (data points are the average of at least 3 readings with the maximum standard deviation of 225 mg/L).
In the second cycle of acidification, after refreshing the broth containing SOB, the SOB
growth rate increased drastically in the control reactor resulting in a sudden decrease in
the pH. As shown in Figure 7.2, the sulphate generation of 4650 mg/L was observed after
one day, causing a pH drop to 3.5. The sudden increase in sulphate concentration of the
Chapter 7: Effect of High Temperature and Mechanisms of Deterioration 132
reactor with control mortar can be explained by the presence of higher number of SOB
originating from the attached SOB to the mortar and addition of new SOB. Overall, the
rate of SOB growth in the second cycle of acidification was less than the first cycle in
both reactors. As illustrated in Figure 7.2, the maximum sulphate concentration in the
control reactor and biofilm-covered reactor was 5300 and 2400 mg/L in the second cycle
of acidification, compared to the first cycle with 6350 and 3550 mg/L sulphate
generation, respectively. Having a lower SOB growth in the second cycle of acidification
and most likely higher buffering capacity of E.coli bio film due to the biofilm growth
during the acidification cycles resulted in slight increase in the pH at the beginning of the
second cycle in the reactor with the biofilm-covered mortar (Figure 7.1). The pH in this
reactor then decreased over time to the pH of 6.
250 ist CyCie 0f acidification 2nd cycle of acidification
< M • o o
I ? 2 0 0 o o o ° ° ° O CL CTJ CL O o
CO
m c 150 ° o o > .2 oo
o
03 2 C 100 F <D § " 8 O < ° 50
0
o Without biofilm
With biofilm
0 10 20 30 40 50 Time (day)
Figure 7.3: Accumulative calcium concentration in the reactor with biofilm-covered mortar and control mortar specimen without biofilm under biogenic acidification at elevated temperature of 37±1° C.
A duplicate set of experiment consisting of the biogenic acidification at elevated
temperature in control reactor and reactor containing biofilm-covered mortar was
Chapter 7: Effect of High Temperature and Mechanisms of Deterioration 133
performed to confirm the accuracy of the results. Based on the observations in Figure 7.4,
Figure 7.5 and Figure 7.6, which are respectively the results of pH measurement,
sulphate and calcium concentration of the second replica, the same trend was observed
for pH, sulphate and calcium concentration in the control reactor. However, the reactor
containing biofilm-covered mortar showed more protective characteristics compared to
the first set of the experiment as the pH did not drop to below the initial pH in this reactor
(Figure 7.4). There was also lower SOB activity with less sulphate generation in the
biofilm-covered reactor of the second replica. As shown in Figure 7.5, the highest
sulphate concentration in biofilm-covered reactor of replica experiment was 1200 mg/L
compared with the first replica with the maximum sulphate concentration of 3550 mg/L
(Figure 7.2). The results from these experiments confirmed again the protective
properties of the E.coli biofilm against biogenic acidification with SOB even under
Figure 7.4: pH in the reactors of the second replica experiment under biogenic acidification at an elevated temperature of 37±1° C.
Chapter 7: Effect of High Temperature and Mechanisms of Deterioration 134
6000
4000
« Without biofilm
With biofilm E
2000 GL
0 10 20 30 40 50 Time (day)
Figure 7.5: Sulphate concentration in the reactors in second replica experiment under biogenic acidification at an elevated temperature of 37±1 ° C (data points are the average of at least 3 readings with the maximum standard deviation of 200 mg/L).
Figure 7.6: Accumulative calcium concentration of reactors in duplicate experiments under biogenic acidification at an elevated temperature of 37±1° C.
7.2.2 Crystal formation
The XRD analysis was performed on the powder sample taken from control mortar and
biofilm-covered mortar in two 0.5-mm-thick layers of mortar surface to identify the type
Chapter 7: Effect of High Temperature and Mechanisms of Deterioration 135
of crystal formations. Comparisons of the XRD pattern of the top 0.5-mm layer of control
mortar with the biofilm-covered mortar in Figure 7.7a and b showed almost the same
type of crystal formation in both cases, which contained mainly quartz, calcite, dolomite
and gypsum. In the control mortar aluminate formation was also observed. The presence
of gypsum which was observed in both control mortar and biofilm-covered mortar
indicates that the biofilm was not very effective in controlling the gypsum formation at
elevated temperature (Figure 7.7). The XRD analysis of the second layer of control
mortar (i.e., powder was taken from the 0.5-1 mm top layer of mortar surface) showed
the presence of ettrengite in addition to gypsum (Figure 7.8a). In Figure 7.8a, the
ettrengite formation was confirmed by the presence of all three main peaks of ettrengite
(i.e., 20=9.1, 15.8 and 22.9). As explained by Wang (1994) ettrengite is not stable at low
pH and is converted to gypsum, hence its presence was only observed at deeper sections
with higher alkalinity (Figure 7.8a). In the top layer with the lower pH, ettrengite most
likely converted to gypsum and some aluminate phases since both gypsum and aluminate
were present in the XRD of top layer (Figure 7.7a). As observed in Figure 7.8a, the
intensity of the aluminate peak decreased as the ettrengite was more stable in the deeper
section with higher alkalinity. The XRD analysis of second layer of biofilm-covered
mortar did not show any sign of gypsum or ettrengite (Figure 7.8). This observation
indicates that even though the gypsum formation was observed in the top surface layer,
mortar deterioration in biofilm-covered mortar was not as severe as the control mortar
sample in which the gypsum as well as ettrengite formation penetrated deeper into the
control mortar sample indicating deeper mortar deterioration.
Chapter 7: Effect of High Temperature and Mechanisms of Deterioration 136
G,Q
? M H r
Q
A
1H,W r r.
Q r
UJULJLJ Q r
~r
50 i 1 • 1 1 i
10 20 30
20 Scale
40 60
2100 2000 -1900 -1800 1700 1600 1500 d 1400
2" 1300 c 1200 O 1100 9, 1000
700 -600 -500 -
Q
W
~r
20 30 20 Scale
Figure 7.7: XRD pattern of mortar powder taken from top 0.5 mm surface after biogenic acidification at elevated temperature; a) control mortar, b) biofilm-covered mortar; dolomite (D), gypsum (G), quartz (Q), magnesium calcite (C), magnesium sulphate hydroxide(MH), winchitte potassium (W), aluminate (A).
Chapter 7: Effect of High Temperature and Mechanisms of Deterioration 137
c/> *-» c 3 o O
600
500"
400
300
200
100
Q
G,Q
W . MH
C,Q
A Q r r
Q r Q
I ' ' ' ' I 10 20 30
20 Scale 40 50 60
1100 i
1000-j
900 I
800 -j
£ 700 1
O 600 1
X 500 -I MH
W 400 1
300 I
200 1
r-Q 100 1
20 4 10 30 40 50 20 Scale
Figure 7.8: XRD pattern of second layer of mortar powder after biogenic acidification at elevated temperature; a) control mortar, b) biofilm-covered mortar; dolomite (D), gypsum (G), quartz (Q), magnesium calcite (C), magnesium sulphate hydroxide(MH), winchitte potassium (W), aluminate (A).
Chapter 7: Effect of High Temperature and Mechanisms of Deterioration 138
7.2.3 Visual inspection
The photographs of the mortar surface taken after biogenic acidification at elevated
temperatures are shown in Figure 7.9. Figure 7.9a and b are the photographs of control
mortar surface without biofilm. These two images show the mortar surface structure
became rougher with larger pore formation and some black spots appearing most likely
due to the microstructure changes.
The photograph of the biofilm-covered mortar from the first replicate is shown in Figure
7.9c and showed the non-uniform biofilm layer covering the mortar surface. In Figure
7.9d, the biofilm layer was brushed away to be able to see the mortar surface structure.
As illustrated in Figure 7.9d, due to the abrasion caused by brushing, the mortar surface
spalled away at the weak locations. Comparing Figure 7.9 c with Figure 7.9d showed that
the location with no biofilm coverage were the weakest locations which spalled away
during the brushing of the sample.
In Figure 7.9e, the image of the biofilm-covered mortar in the replica experiment is
shown. This image shows very good biofilm coverage on the mortar surface. The
removal of biofilm layer from the surface also showed an intact mortar surface with no
sign of damage or spalling (Figure 7.9f).
Chapter 7: Effect of High Temperature and Mechanisms of Deterioration 139
Figure 7.9: Visual inspection of mortar surface after biogenic acidification at elevated
temperature; a) first control mortar without biofilm, b) second control mortar without biofilm c) first biofilm-covered mortar showing the attached
biofilm, d) first biofilm-covered mortar after removing the biofilm layer, e) second biofilm-covered mortar showing the attached biofilm, f) second
biofilm-covered mortar after removing the biofilm layer.
Chapter 7: Effect of High Temperature and Mechanisms of Deterioration 140
7.3 MECHANISMS OF DETERIORATION: CHEMICAL VS. BIOGENIC
ACIDIFICATION
Due to the complexity of simulation of biogenic sulphuric acid attack, extensive studies
performed on assessing the resistance of concrete to biogenic sulphuric acid attack
usually consider simulating the deterioration with chemical acidification (Attiogbe and
Rizkalla, 1988; O'Connell et al. 2010). However, the mechanism of chemical
acidification may be different from the biogenic acidification since it does not consider
the bacterial aspects of the deterioration and may lead to unrealistic conclusions. Hence,
the differences of the mechanism of mortar deterioration under chemical acidification and
biogenic acidification at room temperature were investigated in this study.
As illustrated in Figure 7.10a, the decalcification of mortar, which is described by
the dissolution of calcium hydroxide and C-S-H in hydrated cement systems and
estimated by measuring the calcium concentration of the solution, was observed in both
mortars exposed to chemical and biogenic acidification. Decalcification reduces the bulk
density and porosity of the cement paste, hence resulting in a decrease of the mechanical
strength of the cement-based material (Glasser et al., 2007). The decalcification was 6.7
times higher under chemically induced acidification, even though the pH of the solution
was generally higher than the pH in biogenic acidification process (Figure 7.10a and b).
For example, after 12 days of exposure, and having a higher pH for 67% of the time (i.e.,
8 days out of 12 days) in the chemical acidification reactor than the biogenic reactor, the
amount of calcium leached out was 200 ppm in the chemical reactor compared to 45 ppm
in the biogenic reactor (Figure 7.10a and b). The higher rate of decalcification of the
Chapter 7: Effect of High Temperature and Mechanisms of Deterioration 141
chemically acidified mortar initiated the dissolution of C-S-H which usually occurs after
depletion of calcium hydroxide (Taylor and Gollop, 1997).
500 •e Chemical acidification
Biogenic acidification
It400 O Q. re 3 « C 300 ® o — '£5 a 2 2 c 200
< ° 100
12 16 8 0 4 Time (day)
7
•€> Chemical acidification
•A Biogenic acidification 6
4
3
8 12 16 0 4 Time (day)
Figure 7.10: Comparison of mortar deterioration due to biogenic acidification with
chemical acidification as measured by calcium concentration and pH measurement; a) calcium concentration and, b) pH measurement in reactors
under chemical and biogenic acidification at room temperature.
Chapter 7: Effect of High Temperature and Mechanisms of Deterioration 142
The dissolution of C-S-H in the chemically acidified mortar was also observed by SEM
analysis indicating the formation of silica gel which is formed by loss of Ca ion from C-
S-H (Figure 7.11a). On the other hand, the SEM image of mortar under biogenic
acidification revealed the formation of gypsum crystals, spalling and cracking of the
mortar (Figure 7.11b). According to Glasser et al. (2007), the formation of gypsum and
ettringite may lead to expansion, loss of cement-aggregate binding and consequent
surface cracking, the phenomena which were all observed on the surface of biogenicly
acidified mortar (Figure 7.11b). The XRD analysis of the top surface of mortar under
biogenic and chemical acidification also revealed the formation of gypsum crystals due to
the biogenic acidification which was not the case under chemical acidification (Figure
7.12).
Chapter 7: Effect of High Temperature and Mechanisms of Deterioration 143
Figure 7.11: SEM micrographs of mortar surface; a) after chemical acidification (lOOOx
magnification), b) after biogenic acidification (200x magnification).
Chapter 7: Effect of High Temperature and Mechanisms of Deterioration 144
800
700
MH 600
500
MH G,Q X2
400
£ 300 G.D W
Biogenic acidific itipn 200
100
; I Cherrocal acidificatic n i u , i
o 50 10 20 30 40 6
20 Scale
Figure 7.12: XRD analysis of powder taken from the top 0.5 cm surface of mortar under chemical (bottom XRD pattern) and biogenic (top XRD pattern)
acidification.
7.4 CONCLUDING REMARKS
The effectiveness of biofilm as a protective barrier against biogenic sulphuric acid at
elevated temperature of 37±1° C was evaluated. Evidence of calcium leaching showed
that the biofilm layer was protective to some extent. As observed by visual inspection, the
formation of a uniform biofilm after an 8-day period was a challenging task and if the
biofilm was grown for longer times, the protective characteristics of the biofilm would be
enhanced. It was also revealed that the biogenic acidification at elevated temperature is a
more severe deterioration compared with the room temperature biogenic acidification. As
Chapter 7: Effect of High Temperature and Mechanisms of Deterioration 145
shown by the XRD analysis, the biogenic acidification at elevated temperatures resulted
in the formation of gypsum in the biofilm-covered mortar which was not a case for the
room temperature experiment. XRD analysis also confirmed that gypsum formation was
reduced to some extent in the biofilm-covered mortar because gypsum was not present in
the deeper section.
Comparing the mechanism of chemical sulphuric acid deterioration with the biogenic
sulphuric acid deterioration illustrated that the chemical acidification changes the pore
structure of the mortar by the dissolution of C-S-H; however, biogenic acidification
causes cracking, spalling and loss of coherence due to gypsum formation and expansion.
CHAPTER 8. BIOFILM PERFORMANCE EVALUATION
USING AN ENZYME ELECTRODE
8.1 INTRODUCTION
In this chapter, an enzyme electrode that measures the sulphide concentration was used to
evaluate the effectiveness of a biofilm as a protective barrier for inhibition of
microbiologically influenced corrosion caused by the presence of sulphide. Reduction
and oxidation of sulphur is one of the major microbial activities that occur during
wastewater treatment and transport. Sulphate ion is naturally present in most water
supplies and wastewater. Under anaerobic conditions, sulphate ion is biologically reduced
to sulphide by sulphate reducing bacteria (SRB) and is converted to hydrogen sulphide in
the presence of hydrogen. Sulphide or hydrogen sulphide is responsible for the microbial
corrosion of metals (Booth 1964) and concrete deterioration (Vincke et al., 2001). Hence,
an effective biofilm against MIC would reduce or prevent the passage of sulphide ions.
The steady-state amperometric measurement of sulphide is performed by an enzyme
electrode which was prepared using sulphide oxydase (SO) enzyme (Papavinasam et al.
2004). During the amperometric measurement, the SO enzyme oxidizes sulphides and
sulphur compounds to elemental sulphur resulting in an electric current as:
146
Chapter 8: Biofllm Performance Evaluation Using an EE 147
Sulphide oxidase H2S — • S+2H +2e (8-1)
The electric current is proportional to the sulphide concentration in the solution;
therefore, by amperometric measurement of electric current, one can investigate the
sulphide concentration and subsequently the severity of microbial corrosion. In order to
develop a redox reaction (Eqs. 8-1 and 8-2) in the enzyme electrode, a mediator needs to
be added to the SO enzyme paste. A ferrocene derivative (1,1' dimethyl ferrocene) was
used as the mediator to accomplish the oxidation reaction (Eq. 8-3) (Sooknah et al., 2008
The enzyme electrode was used to assess Escheria coli DH5a biofilm for its ability to
inhibit the sulphide passage. If the tip of the enzyme electrode is covered with a biofilm,
the decrease observed in the electric current density with the biofilm compared to the
current density without the biofilm would be an indicator for the performance of the
biofilm. This simple method would enable the comparison of several microbial biofilms
in less than a day and selection of the best performing one against MIC. The method
would also eliminate the need for expensive, difficult and long-term testing of biofilms in
microbial studies.
Chapter 8: Biofilm Performance Evaluation Using an EE 148
8.2 MATERIALS AND METHODS
8.2.1 Microorganisms
A tetracycline-resistant enteric bacterium, Escheria coli DH5a (pKMY319) was used,
based on its ability to form biofilms (Jayaraman et al. 1997 a, b). The strain was
cultivated in 10 mL of Luria-Bertani (LB) medium with 0.25% tetracycline in a test tube
by streaking from the agar plate. The bacteria were grown overnight at 30° C under static
conditions (no mixing) while exposed to air. A 0.1% v/v inoculum from the overnight
grown sample was used as the seed for biofilm growth.
A sulphide oxidase-producing actinomycetes strain which belongs to the Arthrobacter
species, FR-3, was isolated from a swamp sediment and used for the production of SO
enzyme (Mohapatra et al., 2006). The Arthrobacter species, FR-3, was routinely
cultivated from an agar slant and revived on glucose-yeast extract (GY) broth containing
1% (w/v) glucose and 1% (w/v) yeast extract. The selection of FR-3 as a potential SO
producing microorganism and its isolation was performed according to the procedures
outlined in Mohapatra et al. (2006).
8.2.2 Biofilm growth
A bacterial biofilm was grown on a dialysis membrane with a molecular weight cut off
(MWCO) of 3,000 kD (Spectrum Laboratories, CA, US). The membrane was placed on
the bottom of a 60 mL glass bottle (QorPak, PA, USA) with a foam stopper. The biofilm
was grown in 10 mL of LB under static conditions with no agitation at 30° C. The LB
medium was replenished on a daily basis to provide enough nutrients for the growth and
seeded with a 0.1% (v/v) inoculum from an overnight grown culture. The membrane was
Chapter 8: Biofilm Performance Evaluation Using an EE 149
removed after 7 days and attached to the tip of the enzyme electrode with a rubber band
(Figure 8.1).
8.2.3 Production and purification of sulphide oxidase enzyme
For production of SO enzyme, FR-3 was cultivated in a 1,000 mL flask with a foam
stopper containing 500 mL of GY medium. After incubation for 7 days in an orbital
shaker at 100 rpm and 30° C, 1% (v/v) of ImM Na2S was added to the cultivation
medium in order to increase the production of SO. The bacteria were harvested by
centrifuging the medium at 6,000 rpm for 10 minutes on Day 8 and were washed three
times with 50 mM Tris-HCL buffer (pH 7.5). The SO enzyme was released by
sonification of the harvested cells at a power of 130W. The lysed cells were centrifuged
at 1,000 rpm for 20 minutes and the supernatant of the centrifuged lysate was used as the
cell-free extract of SO.
The molecular weight of the SO enzyme is 43 kD (Mohapatra et al., 2006); therefore the
enzyme was purified with membranes that have MWCO of 10 kD. The cell-free extract
of SO was purified by diafiltration using a Minimate Tangential Flow Filtration Capsule
(Pall Corporation, MWCO=10 kD), and further purified by gel filtration using a HiLoad
XI6/60 (Sephadex 75 Prep, grade) gel filtration column. The purified enzyme was
concentrated after each purification step by ultrafiltration using Macrosep Centrifugal
Device (Pall Corporation, MWCO=10 kD). Detailed information on the preparation and
purification of enzyme can be found in Mohapatra et al. (2006, 2007).
Chapter 8: Biofilm Performance Evaluation Using an EE 150
8.2.4 Enzyme electrode preparation
To improve the shelf life of SO, the purified enzyme was stabilized by adding 5% (w/v)
lactitol and 1% (w/v) DEAE-dextran (Sooknah et al., 2008 a). The enzyme electrode (EE)
was developed by immobilization of the stabilized SO in 1,1' dimethylferrocene and
carbon/graphite paste. The immobilized enzyme paste was placed on a commercially
available electrode body shown in Figure 8.1 (BioAnalytical Systems Instruments
Company, USA), which is made of a solvent-resistant plastic (7.5 cm length x 6 mm
outer diameter). The bottom of the electrode was perforated for a 3.0 mm inner diameter
to house the enzyme paste. A metal pin (0.75 cm) mounted in the plastic body of the
electrode was used to connect the electrode to a potantiostat for current density reading.
Figure 8.1: Body of the electrode used for placement of enzyme paste; the tip of the
electrode is covered with the biofilm-covered membrane where needed.
8.2.5 Electrochemical measurements
All of the amperometric measurements were carried out at room temperature using 50
mM Tris-HCL buffer (pH= 7.5) as the electrolyte and sodium sulphide solution as the
electroactive species. Standard sodium sulphide solution was prepared in an anaerobic
Metal s pin
/>
7 5 cm
1\ lembi ane
6 liim
Rubber band
Chapter 8: Biofilm Performance Evaluation Using an EE 151
chamber by dissolving the Na2S salt in nitrogen-saturated 50 mM Tris-HCl. The solution
was standardized by the modified iodometric method followed by titration. Since sodium
sulphide is not stale in presence of air, a setup was designed to maintain anaerobic
conditions (Figure 8.2). This setup consisted of a reservoir for holding the Tris-HCL
buffer, a 100 mL mixing cell for mixing the buffer with the sulphide solution and a 50
mL test cell. The test cell incorporated three electrodes: the EE as the working electrode,
an SCE (Standard Calomel Electrode) Ag/AgCl reference electrode, and a steel rod as
counter electrode. The electrodes were connected to a potentiostat (Solartron SI 1287
interface controlled by CorrWare® V 1.3 software). A potential of +0.3 V against the
reference electrode was applied to achieve the oxidation of sodium sulphide. A small
amount of sodium sulphide (1 to 5 mL) was withdrawn from the 25 mL glass vial
containing the standard sodium sulphide solution and injected in 100 mL deaerated Tris-
HC1 in the mixing reservoir to give a final concentration of 20-350 mg/L S ". After
mixing, the sulphide solution was transferred to the test cell by pressurizing the mixing
cell by argon gas. The current density was monitored as a function of time and the
stabilized current density was reported as the corresponding current density to the
sulphide concentration.
Chapter 8: Biofilm Performance Evaluation Using an EE 152
'p • PC? m
Potentiostat
>
21 buffer reservoir
100 mL mixing cell
50 mL test cell
2L waste reservoir
Figure 8.2: Schematic of the setup for amperometric measurements.
8.3 RESULTS AND DISCUSSION
The effectiveness of the E. coli DH5a biofilm was evaluated using the SO enzyme
electrode and amperometric measurements. Due to the challenges faced growing the
biofilm directly on the enzyme electrode, the biofilm was grown on a membrane and the
membrane was used to cover the tip of the enzyme electrode. The steady-state current
response of EE with the membrane was compared to the response of EE covered with the
biofilm-covered membrane in order to evaluate the performance of the biofilm against
passage of sulphide ion. Amperometric measurements were also conducted for the EE
with no membrane to provide a baseline reading.
8.3.1 Electrochemical measurements
Amperometric measurements were carried out using the SO EE as the working electrode
Chapter 8: Biofilm Performance Evaluation Using an EE 153
at increasing concentrations of sulphide. Figure 8.3, Figure 8.4, and Figure 8.5 illustrate
the results obtained without the membrane, with the membrane (no biofilm), and with the
biofilm-covered membrane, respectively. The initial current density measured at zero
concentration of sulphide took a longer time to stabilize in Figure 8.4 and Figure 8.5 due
to the presence of membrane which delayed the penetration of sulphide ions into the
enzyme paste. The EE that did not have a membrane was more sensitive to sulphide and
provided higher peak values at the same sulphide concentration (Figure 8.3 and Figure
8.4). For example, EE without the membrane showed a current density difference of
lxlO"5 (Amps/cm2) between 0.06 mg/mL and 0.09 mg/mL sulphide concentration (Figure
8.3) but the EE with the membrane showed a current density difference of O.lxlO"5
between 0.07 and 0.1 mg/mL sulphide concentration (Figure 8.4). As a result, a lower
sulphide concentration range (0 to 0.18 mg/mL) was used to calibrate the EE with no
membrane, and a higher concentration range was used to calibrate the EE with the
membrane (0 to 0.33 mg/mL) and with the biofilm-covered membrane (0 to 0.26
mg/mL). The EE with biofilm-covered membrane was not responsive to sulphide
concentration changes, and there was not a significant change in current density within
the concentration range tested (Figure 8.5). The results indicated that the biofilm was
effective in blocking the sulphide ions.
The calibration line representing the steady-state response of the EE was obtained from
the difference of the steady-state current density reading corresponding to a particular
sulphide concentration and the current density at zero sulphide concentration when the
experiments were run with the Tris-HCL buffer only (Sooknah et al. 2008 b). The current
was monitored as a function of time and the stabilized current density was reported as the
Chapter 8: Biofilm Performance Evaluation Using an EE 154
corresponding current density to the sulphide concentration. The calibration lines of the
EE with and without the membrane and with the biofilm grown membrane are provided
in Figure 8.6. The data illustrate that the EE with the membrane had a lower sensitivity
than the EE without the membrane. The sensitivity of the EE with the membrane, which
is defined as the slope of the calibration line (Sooknah et al., 2008 b), was 51.73
(iA.mL/mg compared to 186.7 |aA.mL/mg for the EE without the membrane (Figure 8.6).
Most importantly, the steady-state response of EE with the biofilm grown membrane
stayed at around zero, and no significant increase in current density was observed with
increasing sulphide concentration. This indicates that the biofilm was successful as a
barrier against the sulphide ions and almost completely prevented the transport of the
sulphide ions.
0.0001
8E-005
g 6E-005 U t/J a*
2E-005
0
^>.15 S"2
0.09 S"2 J
I "I"' ""J* S"2 0.03 S-2 !JP\»
0.18 S"2
I
I .i rr 3 4E-005
0.06 S"2
0 2000 4000 6000 Time (S)
Figure 8.3: Current densities measured using a sulphide oxidase enzyme electrode, at
ambient temperature, with a potential hold of 0.3 V (vs. SCE); concentration
of sulphide reported on the graph as mg/mL.
Chapter 8: Biofilm Performance Evaluation Using an EE 155
8E-005
6E-005
N
£ O
"ft, 4E-005 6 <
2E-005
0.33 S"2
0.164 S"2 / 0.033 S-2 0.07 S-2 j ^
r f 0.23*2 RJ 0 098 S"2
0S"
2000 4000 Time (S)
6000 8000
Figure 8.4: Current densities measured using a sulphide oxidase enzyme electrode with a membrane on the tip, at ambient temperature, with a potential hold of 0.3 V (vs. SCE); concentration of sulphide reported on the graph as mg/mL.
8E-005
6E-005
I 4E-005 i \ 6 <
2E-005
0
0.064 S"2
i t i, t , , 0.032 S"2 0.09 S"2
0.096 S-2 0.26 S"2
JL I
4000 8000 Time (S)
12000
Figure 8.5: Current densities measured using a sulphide oxidase enzyme electrode with a biofilm grown membrane on the tip, at ambient temperature, with a
potential hold of 0.3 V (vs. SCE); concentration of sulphide reported on the graph as mg/mL.
Chapter 8: Biofilm Performance Evaluation Using an EE 156
Figure 8.6: Calibration lines for enzyme electrodes with and without the membrane and steady-state current density reading for the enzyme electrode with the biofilm grown membrane.
8.4 CONCLUDING REMARKS
Biofilm performance as a protective barrier against sulphide passage was evaluated using
a sulphide oxidase enzyme electrode. The simple method presented herein was shown to
be valuable in rapidly determining the effectiveness of a biofilm as a protective barrier.
Results from amperometric measurements showed that E.coli DH5a biofilm was
successful in blocking the sulphide ions and provided an effective barrier against MICD
and MIC.
CHAPTER 9. CONLUSIONS AND FUTURE WORK
9.1 CONCLUSIONS
This project was designed to investigate the possibility of using E.coli biofilm as a
protective barrier against microbial influenced concrete deterioration in wastewater
structures. The detailed discussion and specific conclusions for each part of the thesis
were presented in the relevant chapters and summarized as follows:
In Chapter 4, a setup was designed to grow biofilm on the mortar specimens. Using
CLSM and SEM image analysis, a non-uniform biofilm formation was observed on the
mortar surface. CLSM images also provided insight on quantification of the biofilm
thickness and relative proportions of live cells, dead cells, and EPS coverage. The purity
of the E.coli biofilm was confirmed by FISH analysis through comparison of the FISH
images with the DAPI stained images.
Chapter 5 presented the results of the performance of biofilm and its effectiveness as a
protective barrier against chemically induced sulphuric acid attack. The data from
calcium leach-out concentration, SEM and EDS analyses all suggest that the presence of
biofilm helped to reduce the chemically induced mortar deterioration. The calcium
concentration in control reactors without biofilm was 23-47% higher than the reactors
157
Chapter 9: Conclusions and Future Work 158
with biofilm-covered mortar. The formation of silica gel as an indication of sulphate
attack was only observed on control mortar specimens without biofilm. CLSM and VSS
analysis both confirmed that the biofilm remained alive and continued to grow during the
acidification process.
Chapter 6 presented the results of the effectiveness of biofilm as a protective barrier
against biogenic sulphuric acid attack by naturally reducing the pH using two SOB. It
was shown that the presence of biofilm prevented or controlled the biologically induced
mortar deterioration. The pH of the solution in the reactor containing biofilm-covered
mortar did not decrease as the SOB were not able to grow in the respective reactor.
However, the growth of SOB in the control reactor increased the sulphate concentration
to as high as 6350 mg/L and consequently increased the calcium leach-out to 69 ppm.
The presence of gypsum crystals as an indication of concrete deterioration was only
observed on the control mortar by SEM and XRD analyses. FISH analysis showed that
SOB did not attach to the surface of biofilm-covered mortar. The CLSM and VSS
analyses both indicated that the biofilm was sustained and growing during the
acidification process.
In Chapter 7, the performance of biofilm as a protective barrier against biogenic sulphuric
acid at elevated temperature of 37±1° C was evaluated. The evidence of the calcium
leaching measurement and XRD analysis showed that the biofilm layer was protective to
some extent. It was also revealed that the biogenic acidification at the elevated
temperature led to a more severe deterioration in comparison with the deterioration at
room temperature. At the end of this chapter a comparison of the mechanisms of
chemical sulphuric acid deterioration with the biogenic sulphuric acid deterioration was
Chapter 9: Conclusions and Future Work 159
provided. The comparative analysis showed that chemical acidification deteriorates
mortar by dissolution of C-S-H whereas biogenic acidification causes gypsum and
ettrengite formation resulting in the destruction of mortar.
In Chapter 8, the E.coli biofilm was evaluated in terms of its capability to prevent the
passage of ions, specifically, sulphide ion as the main cause of MICD and MIC. As
shown in the chapter, the biofilm was capable of preventing sulphide ion passage and
hence can be used as a protective barrier.
Based on the above observations, the most important general achievements of the current
study are described as follows:
1. The simulation of accelerated biogenic sulphuric acid attack of concrete is a
controversial subject as it is important to identify the role of bacteria in the deterioration
process and distinguish the deterioration caused by purely chemical acidification from the
biogenic acidification. In this study, biogenic sulphuric acid was simulated successfully
by growing two strains of SOB, Thiobacillus thiooxidans and Thiobacillus neapolitanus
in a modified broth at neutral pH to naturally reduce the pH inside the reactor by their
activities and producing sulphuric acid.
2. This is the first study of its kind to grow E.coli DH5a biofilm on a cement mortar
surface. Biofilm formation on the mortar surface was a challenge due to the high surface
pH of mortars. The calcium hydroxide leach-out from the mortar specimens leading to an
increase in the pH of the solution was another obstacle for the bacterial growth. However,
these difficulties were eliminated to some extend and it was possible to grow a fairy well
biofilm in a short period of time.
Chapter 9: Conclusions and Future Work 160
3. Attachment of E.coli DH5a biofilm on the surface of metals have shown some
promising results in terms of corrosion inhibition of metals. In this study, for the first
time, E.coli DH5a biofilm was applied on a mortar surface to evaluate its effectiveness in
controlling microbial influenced concrete deterioration. It was shown that E.coli biofilm
can be used as an effective, environmental friendly alternative for inhibition and control
of concrete deterioration in existing and new wastewater structures and sewer pipelines.
9.2 RECOMMENDATIONS FOR FUTURE WORK
Despite the potential ability of the biofilm to prevent corrosion of metals and MICD as
shown in this study, various aspects of the characteristics and behavior of biofilm still
need to be addressed before it can be used in larger scale structures to predictably prevent
MICD. The growth rate of the bacterial biofilm depends on the available nutrients,
substrate and temperature; therefore, small perturbations in the environmental conditions
may change the response of the bacteria in the biofilm. Bacteria can grow on all types of
engineering materials and form biofilm. However, the structure of the biofilm changes
over time as the cells inside the biofilm die or slough from the surface which can convert
a more uniform biofilm to a patchy-like biofilm. On the other hand, for concrete material,
the mechanism of concrete deterioration and the interaction of bacteria involved with the
deterioration are other complicated phenomena that need to be studied more thoroughly.
A couple of relevant investigations to advance the knowledge of MICD and the use of
biofilm as a prevention alternative in the future are suggested as follows:
1. The biogenic sulphuric acid deterioration test developed in the current thesis is using
the pure culture of two SOB to simulate the accelerated biogenic acidification. It is more
Chapter 9: Conclusions and Future Work 161
realistic if a real wastewater solution is exposed to concrete to understand the interaction
of SOB with other bacteria present in the wastewater. Investigating MICD by exposing
the concrete samples to a wastewater solution can also help to understand if wastewater
can provide enough nutrients for the growth and sustainability of E.coli biofilm or if there
is a natural competence for attachment of other bacteria to the concrete surface which can
alter the microbial constituents of the biofilm.
2. Estimating the remaining service life of structures exposed to wastewater and under
biogenic sulphuric acid deterioration is important in order to develop repair and
maintenance schedules for such structures. The prediction of the expected long-term
performance of concrete is difficult as it is affected by a large number of parameters.
There is a good advancement in the modelling of the sulphate attack to investigate the
service life of the structure. It is also necessary to couple the Monod equation for
modelling bacterial growth into the respected models to consider the attachment of SOB
and the resultant deterioration caused by the production of sulphate due to the growth of
SOB.
3. The current study indicated the potential ability of E.coli biofilm as a protective
barrier to control MICD. However, as it was shown in the results, it is important to form a
uniform E.coli biofilm on the mortar surface since the mechanism of protection is by
providing a physical barrier. Since, it is not an easy task to grow a uniform biofilm; it is
also interesting to look into the application of other types of biofilm forming bacteria
with a different mechanism of protection. Such bacteria can be Bacillus Brevis with the
ability to produce antimicrobial agents. Biofilm in real systems are usually made of
Chapter 9: Conclusions and Future Work 162
many different bacterial species, hence it is also useful to look at the ability of multi-
species biofilm to prevent MICD.
4. The current study demonstrated the potential ability of E.coli biofilm to mitigate
MICD using the bench-scale experiments. It is acknowledged that in order to use
beneficial biofilms to resist concrete deterioration caused by biogenic acidification in
real-life applications, large-scale experiments and demonstration projects are required to
address the practical issues related to the growth and maintenance of healthy biofilm on a
large scale concrete structure. To perform this task, it is recommended that the biofilm-
covered mortar specimens are placed inside an actual sewer pipe or a wastewater
treatment structure under the biogenic attack and investigate the performance of these
specimens over time.
5. The attachment of E.coli biofilm to concrete surfaces might have a secondary benefit
in treating wastewater during the collection process. The presence of biofilm on the
surface of wastewater collection pipes can help degrade organic matters and improve
wastewater treatment. It is recommended to investigate this hypothesis by applying a real
wastewater solution to the biofilm-covered concrete and measuring the treatment indexes
such as VSS, biological oxygen demand and total carbon inside the wastewater over time.
6. Surface cracking of concrete is a major contributor to deterioration of structures.
The use of different bacteria in a concrete mixture for the remediation of cracks and
enhancement of compressive strength was reported by Ramachandran et al. (2001) and
Van Tittelboom (2009). Therefore, it is believed that E.coli biofilm (or others that are not
studied in this thesis) is not only effective in inhibiting MICD but might also have
potential for promoting self-healing of concrete by filling the cracks. Hence, it is
Chapter 9: Conclusions and Future Work 163
recommended to study this hypothesis in a more detailed experimental plan to investigate
the influence of biofilms to enhance the self-healing properties of concrete.
REFERENCES
Abdelmseeh, V. A., Jofriet, J. C., Negi, S. C., & Hayward, G. (2006). Sulphide, sulphate
and sulphuric acid corrosion of concrete in laboratory tests. Solid Mechanics and Its
Applications, 140: 55-65.
Abdelmseeh, V. A., Jofriet, J. C., Negi, S. C., & Hayward, G. L. (2005). Corrosion of
reinforced concrete specimens exposed to hydrogen sulfide and sodium sulfate.
Agricultural Engineering International: The CIGR EJournal.
ACI Committee 201,(2008). Guide to durable concrete. ACI Manual of Concrete
Practice. 201.2R-08.
Akid, R., Wang, H., Smith, T. J., & Greenfield, D. E., Earthman, J.C. (2008). Biological
functioning of a sol-gel coating for the mitigation of microbial-induced corrosion.
Advanced Functional Materials, 18: 203-211.
Allahverdi, A., & Skvara, F. (2000). Acidic Corrosion of Hydrated Cement based
Materials-PART 1. - Mechanism of the Phenomenon. Ceramics-Silkaty, 44, no.4:
114-120.
Alunno Rossettia, V., Chiocchioa, G. and Paolinia, A.E. (1982). Expansive properties of
the mixture C4ASH12 - 2CS, I. An hypothesis on the expansion mechanism. Cement
and Concrete Research 12, no. 5: 577-585.
Amann, R. I. (1995). In situ identification of micro-organisms by whole cell
hybridization with rRNA-targeted nucleic acid probes. Molecular Microbial
Videla, H. A. and Characklis, W. G. (1992). Biofouling and microbially influenced
corrosion. International Biodeterioration & Biodegradation, 29, no.3-4: 195-212.
Videla, H. A., Herrera, L. K. (2005). Microbiologically influenced corrosion: looking to
the future. International microbiology 8: 169-180.
Vincke, E., Boon, N. and Verstraete, W. (2001). Analysis of the microbial communities
on corroded concrete sewer pipes-a case study. Applied Microbiology and
Biotechnology 57, no. 5: 776-785.
Vincke, E., Van Wanseele, E.; Monteny, J., Beeldens, A., De Belie, N., Taerwe, L., Van
Gemert, D„ Verstraete, W. (2002). Influence of polymer addition on biogenic
sulfuric acid attack of concrete. International Biodeterioration & Biodegradation 49:
283-292.
Vincke, E., Verstichel, S., Monteny, J. and Verstraete, W. (1999). A new test procedure
for biogenic sulfuric acid corrosion of concrete. Biodegradation 10, no. 6: 421-428.
Vishniac, W., & Santer, M. (1957). The thiobacilli. Microbiology and Molecular Biology
Reviews, 21, no.3: 195.
Waksman, S. A., & Joffe, J. S. (1922). The chemistry of the oxidation of sulfur by
microorganisms to sulfuric acid and transformation of insoluble phosphates into
soluble forms. Journal of Bioliological Chemistry, 50: 35-45.
Wang, J.G. (1994). Sulfate attack on hardened cement paste. Cement and concrete
research 24, no. 4: 735-742.
Yamanaka, T„ Aso, I., Togashi, S., Tanigawa, M., Shoji, K., Watanabe, T., et al. (2002).
Corrosion by bacteria of concrete in sewerage systems and inhibitory effects of
formates on their growth. Water Research, 36, no. 10: 2636-2642.
References 174
Zarda, B., Hahn, D., Chatzinotas, A., Schonhuber, W., Neef, A., Amann, R. I., & Zeyer,
J. (1997). Analysis of bacterial community structure in bulk soil by in situ
hybridization. Archives of Microbiology, 168, no. 3: 185-192.
Zivica, V., & Bajza, A. (2001). Acidic attack of cement based materials-a review: Part 1.
Principle of acidic attack. Construction and Building Materials, 15, no.8: 331-340.
Zuo, R. (2007). Biofilms: strategies for metal corrosion inhibition employing
microorganisms. Applied Microbiology and Biotechnology 76, no. 6 (Oct): 1245-
1253.
Zuo, R., Kus, E., Mansfeld, F. and Wood, T. K. (2005). The importance of live biofilms
in corrosion protection. Corrosion Science 47, no. 2: 279-287.
Zuo, R., Ornek, D., Syrett, B. C., Green, R. M., Hsu, C. H., Mansfeld, F. B., and Wood,
T. K. (2004). Inhibiting mild steel corrosion from sulfate-reducing bacteria using
antimicrobial-producing biofilms in Three-Mile-Island process water. Applied
Microbiology and Biotechnology 64, no. 2: 275-283.
Zuo, R., Wood., T. K. (2004). Inhibiting mild steel corrosion from sulfate-reducing and
iron-oxidizing bacteria using gramicidin-S-producing biofilms. Applied
Microbiology and Biotechnology 65, no. 6: 747-753.
APPENDIX A: SUPPLEMENTARY XRD ANALYSIS
Q r A
Q
W f
° Q,C i y ™ r AQ °
\**j{lKAjAsKb^
10 20 30
20 Scale
40 50 60
Figure A.l: XRD of mortar powder taken from second layer of mortar surface (the powder was collected from the top 0.5-1 mm of the mortar surface) before any treatment; dolomite (D), gypsum (G), quartz (Q), magnesium calcite (MC), winchitte potassium (W), aluminate phase (A)
175
Appendix A 176
</)
c • o O c -J
MH
C.Q A.D
30 40 10 20 50 6 26 Scale
Figure A.2: XRD analysis of second layer of mortar with biofilm after biogenic acidification; dolomite (D), gypsum (G), quartz (Q), magnesium calcite (C), magnesium sulphate hydroxide(MH), winchitte potassium (W), aluminate phase (A).
600
500
O 300 Q,A
MH -1 200
20 30 40 50 5 10 60 20 Scale
Figure A.3: XRD analysis of second layer of mortar without biofilm after chemical acidification; dolomite (D), gypsum (G), quartz (Q), magnesium calcite (C), magnesium sulphate hydroxide(MH), winchitte potassium (W), aluminate phase (A).
Appendix A 177
1000
900
800
700
600
2 500
~ 400 4 c -1 300 \
C,Q 200 4 A.D
100
10 30 50 6 20 40
26 Scale
Figure A.4: XRD analysis of second layer of mortar with biofilm after chemical acidification; dolomite (D), gypsum (G), quartz (Q), magnesium calcite (C), magnesium sulphate hydroxide(MH), winchitte potassium (W), aluminate phase (A).
Q
1500^
1400-1300-1200-
1100:
1000^ 'in 900 -
§ 800
20 Scale
Figure A.5: XRD of concrete powder taken from top 0.5 cm surface of biofilm-covered mortar after chemical acidification; calcium carbonate (CC), dolomite (D), gypsum (G), quartz (Q), magnesium calcite (C), magnesium sulphate hydroxide (MH), winchitte potassium (W).
APPENDIX B: SUPPLEMENTARY CLSM IMAGES
Figure B.l: CLSM images of biofilm-covered mortar before acidification stained with calcoflour for polysaccharide (cyan); image of biofilm at, a) 10 |am, b) 20 |am, c) 26 (am distance from the mortar surface, d) projected image of all the subsections in the same view. Scale bar represents 10 |am.
178
Appendix B 179
Figure B.2: CLSM images of biofilm-covered mortar before acidification stained for live cells (green) and dead cells (red); image of biofilm at, a) 5 ^m, b) 10 (jm, c) 15 jam, d) 20 (am, e) 26 (am distance from the mortar surface, f) projected image of all the subsections in the same view. Scale bar represents 10 |im.
Appendix B 180
Figure B.3: CLSM images of biofilm-covered mortar after chemical acidification stained with calcoflour for polysaccharide (cyan); image of biofilm at, a) 20 fim, b) 40 nm, c) 60 (am, d) 82 |im, e) 110 |im distance from the mortar surface, f) projected image of all the subsections in the same view. Scale bar represents 10 |im.
Appendix B 181
Figure B.4: CLSM images of biofilm-covered mortar after chemical acidification stained for live cells (green) and dead cells (red); image of biofilm at, a) 5 Hm, b) 10 i^m, c) 15 jam, d) 20 (im, e) 22 jim distance from the mortar surface, f) projected image of all the subsections in the same view. Scale bar represents 10 |am.
Appendix B 182
Figure B.5: CLSM images of biofilm-covered mortar after biogenic acidification stained with calcoflour for polysaccharide (cyan); image of biofilm at, a) 11 (am, b) 15 (am, c) 20 jxm, d) 30 (am distance from the mortar surface, e) projected image of all the subsections in the same view. Scale bar represents 10 (am.
Appendix B 183
c
b
d
f
Figure B.6: CLSM images of biofilm-covered mortar after chemical acidification stained for live cells (green) and dead cells (red); image of biofilm at, a) 20 |im, b) 32 fam, c) 51 (im, d) 64 (am, e) 91 |am distance from the mortar surface, f) projected image of all the subsections in the same view. Scale bar represents 10 |am.
APPENDIX C: TABULAR DATA USED FOR DRAWING
GRAPHS
Table C.l: Data points of Figure 4.1; bacterial growth at elevated temperature of 37±1 ° c.
Time Average Spectrophotometer reading at 600 nm (day) reading First Second Third
Table C.7: Data points of Figure 5.1 and 5.2; accumulative calcium and pH measurement in biofilm-covered and control reactors after chemical acidification.
Biofilm-covered mortar Control mortar Time (day) Accum. Ca (ppm) PH Accum. Ca (ppm) pH
Table C. 13: Data points of Figure 6.4; sulphate concentration in biofilm-covered and control reactors during biogenic acidification; units are in mg/L.
Biofilm-covered mortar Control mortar Time Sulfate concentration in Average Sulfate concentration in Average
Table C.17: Data points of Figure 7.1 and 7.3; accumulative calcium and pH measurement in biofilm-covered and control reactors during biogenic acidification at an elevated temperature.
Table C. 18: Data points of Figure 7.2; sulphate concentration in biofilm-covered and control reactors during biogenic acidification at an elevated temperature; units are in mg/L.
Control Mortar Biofilm-covered mortar Time Sulfate concentration in Average Sulfate concentration in Average