166
Prevention of muddy taints in farmed Barramundi Sue Poole and Paul Exley Project No. 2009/775 February 2015
Prevention of muddy taints in farmed Barramundi
Sue Poole and Paul Exley
Project No. 2009/775
February 2015
- - 2 - -
This project was conducted by: Department of Agriculture and Fisheries Queensland Government 39 Kessels Road, Coopers Plains, Brisbane In collaboration with: Australian Barramundi Farmers Association PO Box 26, Cooroy, QLD 4563 ISBN: 978 0 7345 0447 0 Copyright, 2012: The Seafood CRC Company Ltd, the Fisheries Research and Development Corporation and [Insert other organisations here]. This work is copyright. Except as permitted under the Copyright Act 1968 (Cth), no part of this publication may be reproduced by any process, electronic or otherwise, without the specific written permission of the copyright owners. Neither may information be stored electronically in any form whatsoever without such permission.
The Australian Seafood CRC is established and supported under the Australian Government’s Cooperative Research Centres Program. Other investors in the CRC are
the Fisheries Research and Development Corporation, Seafood CRC company members, and supporting participants.
Office Mark Oliphant Building, Laffer Drive, Bedford Park SA 5042
Postal Box 26, Mark Oliphant Building, Laffer Drive, Bedford Park SA 5042 Tollfree 1300 732 213 Phone 08 8201 7650 Facsimile 08 8201 7659
Website www.seafoodcrc.com ABN 51 126 074 048 Important Notice Although the Australian Seafood CRC has taken all reasonable care in preparing this report, neither the Seafood CRC nor its officers accept any liability from the interpretation or use of the information set out in this document. Information contained in this document is subject to change without notice.
- - 3 - -
Non-Technical Summary Seafood CRC 2009/775 Prevention of muddy taints in farmed barramundi PRINCIPAL INVESTIGATOR: Sue Poole Innovative Food Technologies Department of Agriculture and Fisheries Queensland Government [email protected] Mob 0428 101 032 ADDRESS: 39 Kessels Road, Coopers Plains Brisbane QLD 4108 PROJECT OBJECTIVES: 1. Develop a simple muddy taint flesh evaluation method for use by industry 2. Summarise current knowledge on prevention of algal blooms that cause taints 3. Select best protocols specific to grow-out system for the restriction of algal
bloom and trial these on-farm 4. Recommend best practice effective for ABFA members 5. Extend knowledge to the entire industry value chain ABSTRACT Research work within this project has generated a wealth of new information on muddy taints occurring in freshwater barramundi farmed in open-culture ponds in North Queensland. Extensive monitoring of ponds for taint presence illustrated that taint events were highly farm specific and dependent on environmental conditions. It was clear that water quality is a critical factor and where intake water has a high nutrient load, algal blooms flourished usually with a concomitant taint event. There was a seasonal pattern of incidence showing a trend of low incidence during winter months, more frequent incidence as temperature increased with greater taint intensity. Heavy rainfall events did not appear to affect occurrence of taint. It was discovered that the primary compound contributing to muddy taint was geosmin and this held true across all farms. Within a pond, geosmin was present in both soil and water samples with highest concentrations occurring in pond bank mud, especially when there was a Microcystis bloom episode. Water geosmin levels were related to the geosmin concentration in the mud but not directly proportional, illustrated by geosmin
- - 4 - -
presence in mud samples at times when it was undetectable in the water. Presence of geosmin in fish was correlated to geosmin presence in water, but again not directly. Geosmin in fish flesh was bioaccumulative and occurs very rapidly. Depletion from the fish flesh occurs slowly underpinning the importance of taste testing fish prior to harvest. Most significantly, actinomycetes species were identified as the origin of geosmin and not a blue-green algae source as was expected. There was a vast range of actinomycetes species present in ponds and many of these exhibited a strong capability for geosmin production. It was also repeatedly observed that muddy taint was noted whenever a Microcystis bloom occurred and a significant discovery was illustration of a synergistic relationship between actinomycetes and Microcystis, the interaction resulting in far greater geosmin production. A broad range of taint mitigation methods were evaluated:
biological – probiotic, duckweed, tropical water hyacinth, actinophage, cyanophage chemical – copper sulphate, potassium permanganate, lysine physical – barley straw, phoslock, ultrasonics, water exchange, fish starvation
All of these methods showed some beneficial effect in reducing geosmin levels but effect was very clearly directly related to pond, farm management practices and environmental conditions. The exception was phoslock, however this was due to this product being applied beyond the recommendations for use. Aquatic plants were beneficial depending on farm pond design and water flow. The chemical agents were highly effective in crashing algal blooms but expensive and not appropriate for long-term use. Naturally-occurring pond viruses, actinophages and cyanophages, showed potential as treatment tools, however a good deal of further work is required before they can be used on a commercial basis. The most practical methods demonstrating effectiveness were lysine and molasses. Lysine application to the pond water was relatively inexpensive and crashed rafting Microcystis blooms within 48 hours. There was a subsequent decrease in geosmin concentration in the water for 8-14 days after application however after this period Microcystis re-established in the pond under the right environmental conditions. Molasses was successfully used as a pond maintenance tool for prevention of algal bloom, although this needed continual application which adds to the cost of the method. Regretfully but not unexpectedly, there is no ‘silver bullet’ solution. Rather, the project research has demonstrated a range of tools that can be used within the Industry according to individual farm and taint event.
- - 5 - -
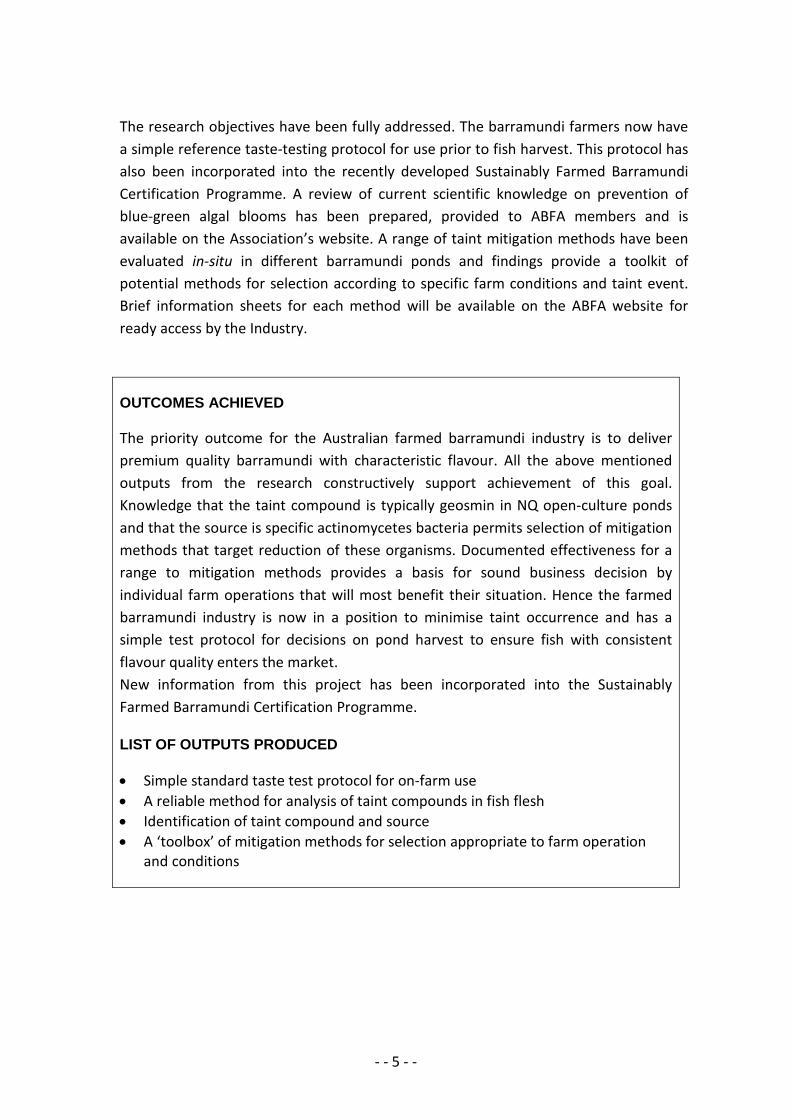
The research objectives have been fully addressed. The barramundi farmers now have a simple reference taste-testing protocol for use prior to fish harvest. This protocol has also been incorporated into the recently developed Sustainably Farmed Barramundi Certification Programme. A review of current scientific knowledge on prevention of blue-green algal blooms has been prepared, provided to ABFA members and is available on the Association’s website. A range of taint mitigation methods have been evaluated in-situ in different barramundi ponds and findings provide a toolkit of potential methods for selection according to specific farm conditions and taint event. Brief information sheets for each method will be available on the ABFA website for ready access by the Industry. OUTCOMES ACHIEVED The priority outcome for the Australian farmed barramundi industry is to deliver premium quality barramundi with characteristic flavour. All the above mentioned outputs from the research constructively support achievement of this goal. Knowledge that the taint compound is typically geosmin in NQ open-culture ponds and that the source is specific actinomycetes bacteria permits selection of mitigation methods that target reduction of these organisms. Documented effectiveness for a range to mitigation methods provides a basis for sound business decision by individual farm operations that will most benefit their situation. Hence the farmed barramundi industry is now in a position to minimise taint occurrence and has a simple test protocol for decisions on pond harvest to ensure fish with consistent flavour quality enters the market. New information from this project has been incorporated into the Sustainably Farmed Barramundi Certification Programme. LIST OF OUTPUTS PRODUCED • Simple standard taste test protocol for on-farm use • A reliable method for analysis of taint compounds in fish flesh • Identification of taint compound and source • A ‘toolbox’ of mitigation methods for selection appropriate to farm operation
and conditions
- - 6 - -
ACKNOWLEDGEMENTS This project has taken many unexpected turns throughout the 5 years of investigation and achievement would not have been possible without the extensive assistance from many people.
First and foremost, we would like to acknowledge the ABFA and all members who allowed us open access to farm operations and data. Specific access on to seven farms allowed us to sample regularly and engage with industry at a ground roots levels to understand the complexity of the issues. We would especially like to thank PEJO, King Reef, Good Fortune Bay and Daintree River Barramundi for allowing us to conduct on- farm trials and their committed assistance with water sampling and data collection. Without industry input and ownership, this project would not have been a success. We gratefully acknowledge the steadfast support received from the Phycology Laboratory, Department of Health, Queensland. The enthusiasm with which they embraced our project, as a way to assist Queensland farmers, by offering professional advice on algae analysis was limitless. With such support from Queensland Health, we gained the confidence to analyse thousands more algae samples than otherwise would have been possible within the original project.
We are strongly indebted to Dr Ipek Kurtboke and her staff at the University of the Sunshine Coast for her willing provision of professional expertise and advice within the world of actinomycetes and bacteriophage. This is an area we only scratched the surface of, but extend appreciative thanks to Dr Kurtboke for her constant fervour and assistance in guiding us in this new approach to find an industry solution. Two specific companies generously gave of their time, expertise and product to assist in supporting this research allowing us to conduct specific trials: ADM Australia very generously supplied bulk lysine for our on-farm pond trials. Aqua Sonic Management Pty Ltd provided with ultrasonic units for laboratory trials and on-farm trials. This generosity has allowed us to stretch our research dollar much further than the original budget. We would also like to extend specific gratitude to project staff that undertook a large research component within the project:
- - 7 - -
Steve Fuller (DAF, Queensland) for the thousands of geosmin and MIB water tests he performed including method development of a successful analysis method for determining taint compounds in barramundi flesh. Dave Mann (Bribie Island Research Centre, DAF, Queensland) who was contributed enormously to the Information Review and took much of the onus for ultrasound farm trials. Dr Heather Smyth (Queensland Alliance for Agriculture and Food Innovation) for development the standardised on-farm sensory protocols with reference tool, along with running the Barramundi Farmers Workshop on taste assessment within this project. Lastly, but certainly not least, we wish to acknowledge the financial support of the Australian Seafood Cooperative Research Centre in cooperation with the Fisheries Research and Development Corporation and ABFA investment.
- - 8 - -
Contents
Introduction and Background ........................................................................................- 9 - Need ............................................................................................................................ - 12 - Objectives.................................................................................................................... - 13 - Section 1. Off-odour and flavour presence ............................................................... - 15 -
Sensory evaluation of taint compounds ............................................................. - 15 - Chemical compound analysis .............................................................................. - 25 - Monitoring of ponds for off-flavour compounds ............................................... - 26 -
Section 2. Source of taint compounds ...................................................................... - 42 - The search for blue-green algae in NQ ponds .................................................... - 43 - The Microcystis story .......................................................................................... - 47 -
Section 3. Taint management tools .......................................................................... - 64 - Actinophage ........................................................................................................ - 72 - Aquatic plants ..................................................................................................... - 75 - Copper sulphate .................................................................................................. - 80 - Cyanophage ........................................................................................................ - 85 - Lysine .................................................................................................................. - 91 - Molasses ........................................................................................................... - 115 - Phoslock® ........................................................................................................... - 119 - Potassium permanganate ................................................................................. - 121 - Probiotic - ProW ................................................................................................ - 123 - Mitigation Trials for Recirculating Aquaculture Systems (RAS) ....................... - 126 - Ultrasonics ........................................................................................................ - 129 -
Section 4. Flavour enhancement ............................................................................ - 135 - Benefits and Adoption .............................................................................................. - 142 - Further Development ............................................................................................... - 143 - Planned Outcomes .................................................................................................... - 145 - Conclusion ................................................................................................................. - 147 - References ................................................................................................................ - 149 - Appendix 1. IP......................................................................................................... - 160 - Appendix 2. Research Project Staff ........................................................................ - 160 - Appendix 3. ............................................................................................................... - 161 - Appendix 4. ............................................................................................................... - 162 -

- - 9 - -
Introduction and Background Barramundi (Lates calcarifer) is a prime candidate for aquaculture due to being euryhaline, relatively fast-growing and tolerant of production handling. It has an added advantage of being recognised as an “iconic” Australian fish species naturally occurring throughout northern waters, with an established reputation for an excellent eating quality. Aquaculture of barramundi was initiated in Queensland with a hatchery and farm operation near Innisfail in the early 1980s. The industry expanded through north Queensland using freshwater pond culture systems and is now established in all mainland states and the Northern Territory utilising different growout methods. Barramundi farming is an important industry in tropical Australia, contributing to tropical agricultural economies. Current total production of farmed barramundi in Australia is estimated c. 5,000 tonnes with a value of >$50 million (pers.comm., ABFA, 2014).
The industry can be divided broadly into three categories of farming: • pond culture - in purpose built freshwater ponds (including caged and free-range
fish) • sea-cage culture in estuarine waters • intensive production in indoor facilities (recirculation or flow-through systems) The farmed barramundi industry faces multiple challenges: increasing costs of production; presence of alternative cheaper fish protein products in the marketplace and consumer demand for minimal preparation of food products. There is a need to reposition farmed barramundi within the seafood market to meet consumer expectations and gain both domestic and export market share. Fundamental to achieving this, and for maximum financial return to the industry, is production of an excellent barramundi product that has assured quality with a great characteristic flavour to ensure a positive eating experience. A factor limiting the market growth for the Australian freshwater barramundi industry has been inconsistency of quality of fish presented to market, particularly with respect to flavour. Some barramundi can exhibit undesirable muddy/earthy off-flavours frequently unacceptable to the consuming public (Percival et al., 2008). Within the retail and hospitality sectors of the industry, fish is generally an expensive consumer purchase, hence a positive and pleasant eating experience is essential for the consumer to repeat purchase and to delimit negative publicity. However despite the desire to buy, inconsistent quality of farmed barramundi in the marketplace is identified as a major issue resulting in purchaser resistance. Such negative market impact is limiting full revenue return for farmed barramundi.
- - 10 - -
The inconsistency in flavour quality is associated with flavour taint presence. Flavour taints in freshwater environments are known to be caused by the presence of geosmin (GSM) and 2-methyl isoborneol (MIB) in the fish flesh (Howgate, 2004). These compounds originate from a range of micro-organisms, including algae and bacteria (van der Ploeg et al, 1992; Tucker, 2000; Juttner and Watson, 2007; Schrader and Summerfelt, 2010), that can flourish under certain conditions within freshwater environments. The presence of these compounds is not as evident in salt water environments where nutrient loads tend to be more diluted and environmental conditions less conducive to blue-green algae blooms. Unfortunately, the taint compounds, GSM and MIB, are detectable by human olfactory senses at extremely low concentrations in water and fish (Polak and Provasi, 1992; Howgate, 2004; Robertson et al, 2005). Sensory thresholds for these compounds in water are as low as 0.015µg/L and 0.035 µg/L for GSM and MIB respectively (Howgate, 2004). In fish, thresholds are somewhat higher due to masking effect from other volatile odour compounds. Moreover, the lipid content within the fish tissue tends to hold the tainting compounds within the muscle matrix, so inhibiting release of these volatiles into the immediate atmosphere where they are easily detected by the human olfactory system. It is accepted that flavour taint issue is not confined to farmed barramundi, but also occurs in other freshwater farmed Australian fish: silver perch, jade perch, eels, Murray cod, golden perch and trout (Palmeri et al, 2008; Sarac et at, 2012; Tisdell, 2001 ). It has also been widely documented in the US catfish industry (Schrader and Dennis, 2005; Zimba and Grimm, 2003), cultured tilapia (Yamprayoon and Noonhorm, 2000), the trout industry (Robertson et al. 2006; Robin et al, 2006) and also wild lake fisheries of Japan (Sugiura and Nakano, 2000) and Canada (Yurkowski and Tabachek 1980). The muddy taint issue is also ubiquitous within the potable drinking water industry, with almost all municipal drinking water suppliers having to tackle the problem at some time throughout the year. (Water Quality Research Australia, 2010). Due to the omnipresent nature of flavour taints, considerable research effort has gone into understanding the cause and the environmental conditions related to occurrence which has generated a large background body of information. Being common to all freshwater ponds and water reservoirs, knowledge of environmental conditions allowing blooms to flourish, and parameters that restrict the same, is extensive and can be sourced for relevance to Australian systems. As taint issues are so universal within freshwater environments, even if intermittent, there has been strong investigative effort directed towards finding mitigation methods or management strategies to minimise taint impact. The resultant body of literature illustrates clearly that there is no ‘silver bullet’ with respect to negating taint
- - 11 - -
occurrence across diverse situations. Rather, various mitigation options have specific beneficial effect (or not) directly according to specific water body environmental conditions. Some of the preventative measures investigated include: de-stratification of pond bottoms to limit temperature strata; bacterial lysis of algae; addition of chemicals that deplete algal blooms; water treatment (drinking water treatment stations and recirculating aquaculture systems); addition of compounds that prevent algal growth and addition of materials that absorb the taint chemicals present. There have been a large number of studies carried out within municipal water reservoirs. These have investigated causative organisms and possible remedies, however the suggested treatments are not always applicable or appropriate to aquaculture systems where fish are raised for human consumption. There is wide documentation of identified causative organisms within aquaculture industries overseas, but little specific species information from Australian aquaculture to date. However, much of the information garnered from other countries can be used as a likely starting base concerning the off-flavour issue in barramundi. From the information available on trialling various mitigation strategies within aquaculture systems, there is strong evidence that the simplest and most cost effective solution is not prevention but to depurate or purge the fish in clean taint-free water immediately after harvest. This, reputedly, is not a desirable option for barramundi farmers on the basis of logistical issues with harvest volumes; required extra infrastructure; in some instances no guaranteed taint-free water supply and the resistance to double handling of fish adding to their stress levels. Therefore it is likely worth pursuing strategies that may control organism blooms to a large extent. One of the currently recognised ways of minimising taint in fish is remedial rather than preventative and involves depuration of live fish in clean taint-free water for a suitable period immediately after harvest and prior to sale. Reportedly, flavour taint in fish flesh is reduced successfully with 5 to 7 days of purging (Tucker, 2000). This depuration method has been demonstrated with some success to reduce taint in Australian farmed barramundi (Poole et al, 1999; Glencross et al, 2007) and has additional beneficial effect when the fish are purged in seawater (Poole et al, 1999). Compounding the problems of discovering a practical simple method for mitigating taint is the difficulty of measuring taint compounds accurately. Laboratory analytical detection of GSM and MIB in water is relatively straightforward due to the compounds having low solubility in solution (Lloyd et al, 1998). However, in fish flesh the compounds are bound within the lipid matrix and hence accuracy of analysis depends on a perfectly effective extraction method. Research studies have fully illustrated the complications in developing an objective method of assessment for 'muddy' taints and
- - 12 - -
have resulted in a range of methodologies with varying degrees of robustness (Grimm et al., 2004; Robertson et al., 2005; Percival et al., 2008). Given the complexity of background surrounding taint issues in freshwater fish, there remains a research need to quantify the incidence and cause of taint occurrence within Australian farmed barramundi and to evaluate possible mitigation strategies appropriate to our Industry. (for further detail see attached document Appendix 3: Mitigation of off-flavour in farmed freshwater fish – A Review of current knowledge. Poole S, Exley P and Mann D., 2011)
Need The issue of muddy tasting farmed barramundi has a long history yet has not been resolved. End chain buyers have learnt to expect some flavour ‘muddiness’ at times and this builds a barrier to purchase and loss of customer base. The impact of market perception along with fierce competition from imported product is illustrated by the price for farmed barramundi having remained relatively static at $8-10/kg (farm-gate) for over 10 years despite the species having an ‘iconic’ name with consumers. There is a substantial body of information existing on the presence and production of muddy taints by freshwater algal blooms. There is also existing experience of different mitigation methods in freshwater farm systems, although not all of these are appropriate to farmed food production. This bank of information needs to be summarised in a concise document as a basis of relevant knowledge for the industry. Occurrence and severity of taint issues within the Australian farmed barramundi industry need to be documented to provide clear indication that not all fish are affected all the time. Further, relevant mitigation strategies need to be evaluated from which information, best practice options can be selected for trialling in situ within the different grow-out systems used in Australia. Specific protocols to manage water quality for the prevention of taint occurrence are needed to: • assure the flavour quality of farmed barramundi • underpin quality standards being developed within the ABFA gold tick • meet requirements for certification as written into the ABFA gold tick • underpin other current initiatives, for example repositioning barramundi in the
marketplace
- - 13 - -
This project seeks to address these needs by summarising current knowledge, identifying likely effective mitigation protocols and trialling selected protocols on-farm and assessing the effectiveness. Additionally, there is an opportunity to further assess the potential to enhance barramundi flavour.
Objectives 1. Develop a simple muddy taint flesh evaluation method for use by industry. Achieved A simple test odour reference system was developed for the detection of the presence of taint compounds in fish for on-farm use. This is primarily for farm personnel ‘training’ and verification of individual detection capability as staff handling barramundi product on a daily basis can readily become de-sensitised to low level taint presence. The reference system was workshopped to industry at an ABFA R&D forum (Cairns, February 2011) followed by successful use on-farm. 2. Summarise current knowledge on prevention of algal blooms that cause taints
Completed A comprehensive search of all published literature was undertaken to source information on muddy taints occurring in semi-static freshwater bodies and specifically, occurrence in freshwater aquaculture systems. Information sourced was focused on the organisms that produce off-flavour compounds of geosmin and 2-methyl isoborneol; growth conditions that allow them to flourish; and protocols that have been tried for prevention of muddy taint in waters and fish. Review document: Attachment 3. Mitigation of muddy flavour in farmed freshwater fish: a Review. Poole et al, 2011. 3. Select best protocols specific to grow-out system for the restriction of algal
bloom and trial these on-farm Achieved
From reported knowledge and farmer experience, likely mitigation options were selected for evaluation appropriate to individual farm. A broad range of taint mitigation methods were evaluated: biological – probiotic, duckweed, tropical water hyacinth, actinophage, cyanophage chemical – copper sulphate, potassium permanganate, lysine physical – barley straw, phoslock, ultrasonics, water exchange, fish starvation All of these methods showed some beneficial effect in reducing geosmin levels but effect was very clearly directly related to pond, farm management practices and
- - 14 - -
environmental conditions. The most practical methods demonstrating effectiveness were lysine and molasses. 4. Recommend best practice effective for ABFA members
Undertaken A simple reference test method for taint detection in fish flesh on-farm was developed and adopted by industry. The methodology also provides for on-going training for assessors to ensure assessment is comparative across operations. Standardised methodology for taste assessment of fish product prior to sending to market was developed, work-shopped with all ABFA members and has become recommended Best Practice adopted by the industry in their gold tick program. Industry was fully involved in each development within the investigations as they occurred, the significance of the findings discussed and subsequent next research actions within the project were driven by industry at all stages. Different protocols are specific to individual farms and there will be on-going communication to effect the best solution for the occurrence. 5. Extend knowledge to the entire industry value chain
Achieved There was high awareness of research focus, actions and outputs across the wider Aquaculture Industry, including ancillary parties, engendered through regular presentation at Industry Annual Conferences and R&D 6 monthly meeting forums. The project also underpins quality aspects incorporated into the Sustainably Farmed Barramundi Sustainably Farmed Barramundi Certification Programme, through which the entire value chain will become aware of the effort and quality commitment from the barramundi farming industry.
- - 15 - -
Section 1. Off-odour and flavour presence Presence of taint compounds in barramundi ponds Flavour taint is not confined to farmed barramundi, but also occurs in other freshwater farmed fish in Australian: silver perch, jade perch, eels, Murray cod, golden perch and trout. It has also been widely documented in the US catfish industry (Zimba and Grimm, 2003), cultured tilapia (Yamprayoon and Noonhorm, 2000), the trout industry (Robertson et al. 2006) and also wild lake fisheries of Japan (Sugiura and Nakano, 2000) and Canada (Yurkowski and Tabachek 1980). The muddy taint issue is also ubiquitous within the potable drinking water industry, with almost all municipal drinking water suppliers having to tackle the problem at some time throughout the year (Water Quality Research Australia, 2010). With the realism that taint events will occur despite the best farm management practices, the US catfish aquaculture industry has expended considerable effort in research for simple methods for detection of taints. Investigations have even included the use of trained dogs to sniff out taint odour in both water and fillets with reasonable success ( Shelby et al, 2004; 2006). However, the established practice demands that all fish sent for processing be subject to a taste assessment by a quality officer whose sole role is to check fish flavour. Where flavour of the fish is deemed unacceptable, the entire shipment is sent back to the farm at the cost of the farmer. This is possible within the US industry as all fish are sent to processing factories as live product. A similar taste assessment is used within the Australian barramundi industry, where sample fish from ponds are tasted by an experienced assessor prior to full harvest of the pond. However, there was a need to standardise the assessment methodology across different farm operations. Sensory evaluation of taint compounds The ultimate assessment of fish quality, especially in the buying consumer sector, is in eating the fish flesh and on this basis, taste testing is still regarded as the needed test prior to placing product on the market. Olfactory senses in humans can detect muddy taint compounds, geosmin (GSM) and 2-methyl isoborneol (MIB), at very low levels in both water and fish flesh (Polak and Provasi, 1992; Howgate, 2004; Robertson et al, 2005). Sensory thresholds for these compounds in water are as low as 0.015µg/L and 0.035 µg/L for GSM and MIB respectively (Howgate, 2004). In fish, thresholds are somewhat higher due to masking effect from other volatile odour compounds and are typically reported at c. 0.7-0.9 µg/kg (Robertson et al 2005). However, individual sensitivity to different compounds varies widely with some individuals unable to pick
- - 16 - -
relatively strong taint and other extremely low levels as exemplified by one farm staff detected geosmin in barramundi flesh at a level of 0.02µg/L. Moreover the oil contained within the fish tissue tends to hold the tainting compounds within the muscle matrix, so inhibiting release of these volatiles into the immediate atmosphere where they are easily detected by the human olfactory system. From the few figures provided from analysis of fish flesh for GSM and MIB, their thresholds appear to be about an order of magnitude higher for that when in water. However, the accuracy of this data is dependent on analytical detection sensitivities. Development of sensory assessment protocol Discussions with industry confirmed that a quick on-farm reference test method would be useful for determining whether their fish were tainted or not. Having three standard references representing low medium and high levels of off-flavour and odour compounds would provide a ‘yardstick’ for the industry to assess level of taint present. The need for reference points arises from the sensorial/olfactory variation amongst individuals in ability to detect off-odour compounds, including threshold levels. Additionally, sensory overload frequently occurs when farm personnel are surrounded by these odour compounds rendering the odours undetectable to farm staff. The requirements for such a reference test are that it must be simple, user friendly, provide appropriate taint compound levels and exhibit stability for a practical storage life. Hence, much thought and discussion surrounded format of the test method. A range of formats were identified to be explored for suitability as a reference standard with pertinent considerations listed: • a retractable lipstick-like device (required a semi-hard formula – danger of the
carrier matrix oxidising and odour over-riding taint compound present and could melt very quickly in tropical temperatures; could be made up from the basic formula of a lipstick - a mix of castor oil, waxes, isopropyl meristate
• a gel that is dispensed from a jar, tube or roll-on device - could be dispensed by application to a swab, smelling strip for a single use then thrown away; carbopol gel - used in suspension in a 10-20% alcohol aqueous solution to make a clear gel that sets with increasing pH; polyethylene glycols (varying molecular weights) - from clear liquids (carbon molecules: 200-400) to hard waxes (carbon molecules ~1000); could use a mix of 3 carbon chain lengths to get a more stable product.
• disposable options, in a sachet (like an alcohol swab) - pre-soaked strips/swabs that are sealed in a sachet with date of preparation / best before date and instructions on it; single use, a strip of 10 can be easily carried in the pocket without mess; could include a swab on a clip or stand for ease of presentation (like a photo or note clip on a paperweight to sit on bench top); likely can use a
- - 17 - -
simple gel for sample prep for this; can readily re-manufacture according to industry need
• other matrices include paraffin wax /oil (mineral oil like Johnsons baby oil - odour free)
• water based options - simplest of all to prepare; could be presented in a sachet, or a small screw-capped glass vial.
Methods The following solutions were prepared and assessed: • water-based solutions of geosmin and MIB were prepared at concentrations of 0,
100, 500, 2500, 5000 µg/L.
• paraffin based solutions were prepared using geosmin and 2-methylisoboreol concentrations of 0, 2.5, 25, 100, 1000, 2500 µg/L (µg/kg).
• a solid paraffin-based lipstick formula using geosmin and 2-methylisoboreol concentration of 500 µg/kg.
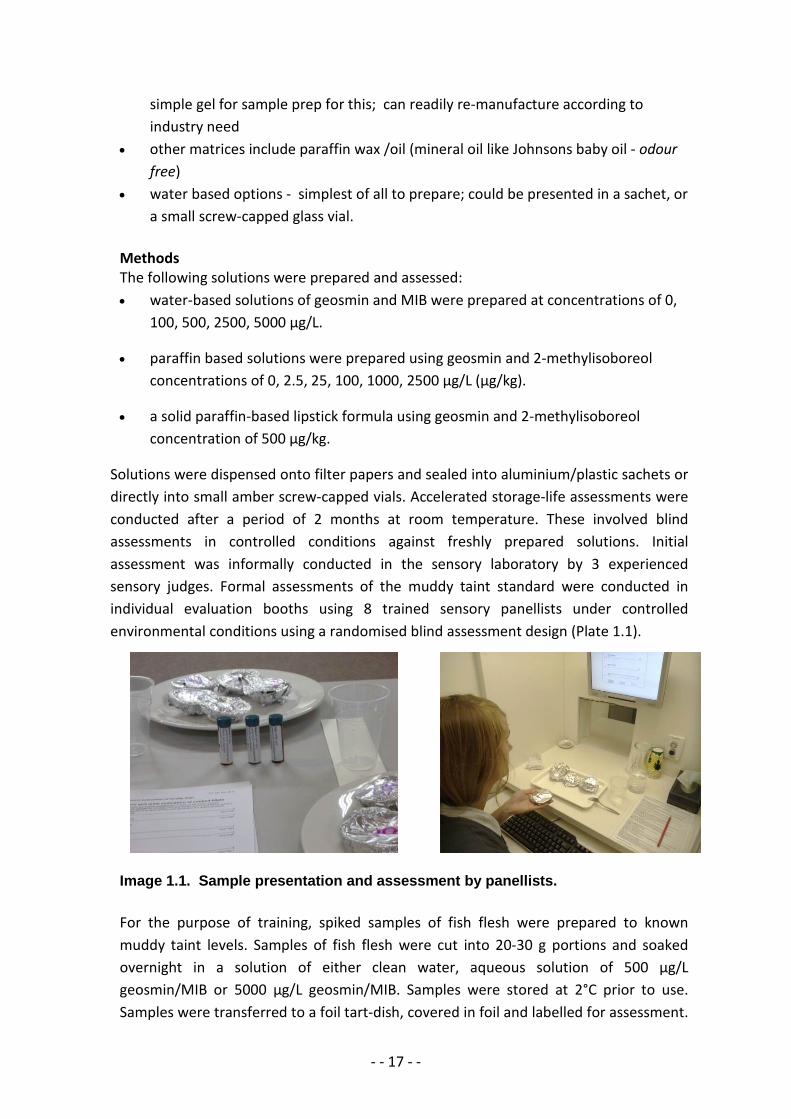
Solutions were dispensed onto filter papers and sealed into aluminium/plastic sachets or directly into small amber screw-capped vials. Accelerated storage-life assessments were conducted after a period of 2 months at room temperature. These involved blind assessments in controlled conditions against freshly prepared solutions. Initial assessment was informally conducted in the sensory laboratory by 3 experienced sensory judges. Formal assessments of the muddy taint standard were conducted in individual evaluation booths using 8 trained sensory panellists under controlled environmental conditions using a randomised blind assessment design (Plate 1.1).
Image 1.1. Sample presentation and assessment by panellists. For the purpose of training, spiked samples of fish flesh were prepared to known muddy taint levels. Samples of fish flesh were cut into 20-30 g portions and soaked overnight in a solution of either clean water, aqueous solution of 500 µg/L geosmin/MIB or 5000 µg/L geosmin/MIB. Samples were stored at 2°C prior to use. Samples were transferred to a foil tart-dish, covered in foil and labelled for assessment.
- - 18 - -
Several cooking methods and a raw fillet assessment method were explored. All method involved sampling a 20-30g piece of flesh from the main tissue block (deliberately avoiding the belly flap and dorsal regions for this panel. Cooking methods included: • microwave on high for 10 seconds between two porcelain plates. • microwave on high for 10 seconds in a plastic freezer bag • baked for 7 minutes at 180°C on a foil tart-dish covered with foil • cooked a Silex grill for 2 minutes at 180°C between two pieces of baking paper,
followed by presentation in a covered tart-dish Results and discussion Practical requirements for the reference standard were to: • provide a strong muddy odour for training purposes and be effective in its use • be appropriate for use by multiple users • have a reasonable shelf-life and stability in tropical environment (warm and
humid) • be made up in a basic carrier • based on known technology • be easy to use and small enough to transport in a pocket if needed • be simple enough to prepare and distribute in larger numbers • avoid plastic which can scalp flavour compounds Of particular interest initially were paraffin-based standards either in a lipstick or pellet-like format. It was thought that an oil-based preparation would allow the compounds to be more comparable to lipid-based barramundi flesh. Nevertheless, these preparations were not suitable as even at the highest concentration assessed, the odour of geosmin and 2-methylisobornel was almost undetectable. It was clear that these 100% oil-based solutions bound the compounds of interest entirely in the matrix with little volatile release for sensory detection. The critical factors with respect to the format of a reference test are: • muddy taint compounds of geosmin and MIB are highly volatile • the compounds are detectable by human senses at extremely low levels, >1 part
per billion in fish and even lower in water These two factors suggest a single use format would be most appropriate and design concepts considered included sealed foil sachets containing pre-soaked filter paper with relevant compound level; snap-top glass vials with a liquid form of taint compound. However, single-use tests are costly, so design turned to multi-use formats. Several ingenious ideas were conceived including a ‘lipstick’ format with the taint compounds incorporated into a paraffin or ester matrix. The benefit of this format was the direct parallel of using an oil/lipid-like matrix which is similar to incorporation of
- - 19 - -
the compounds into fish flesh. Three main negatives arose with this format when tested in the laboratory: • the unknown storage life of the compounds at specific levels within the solid matrix • interference odour compounds from the wax, and ester matrix masking the true
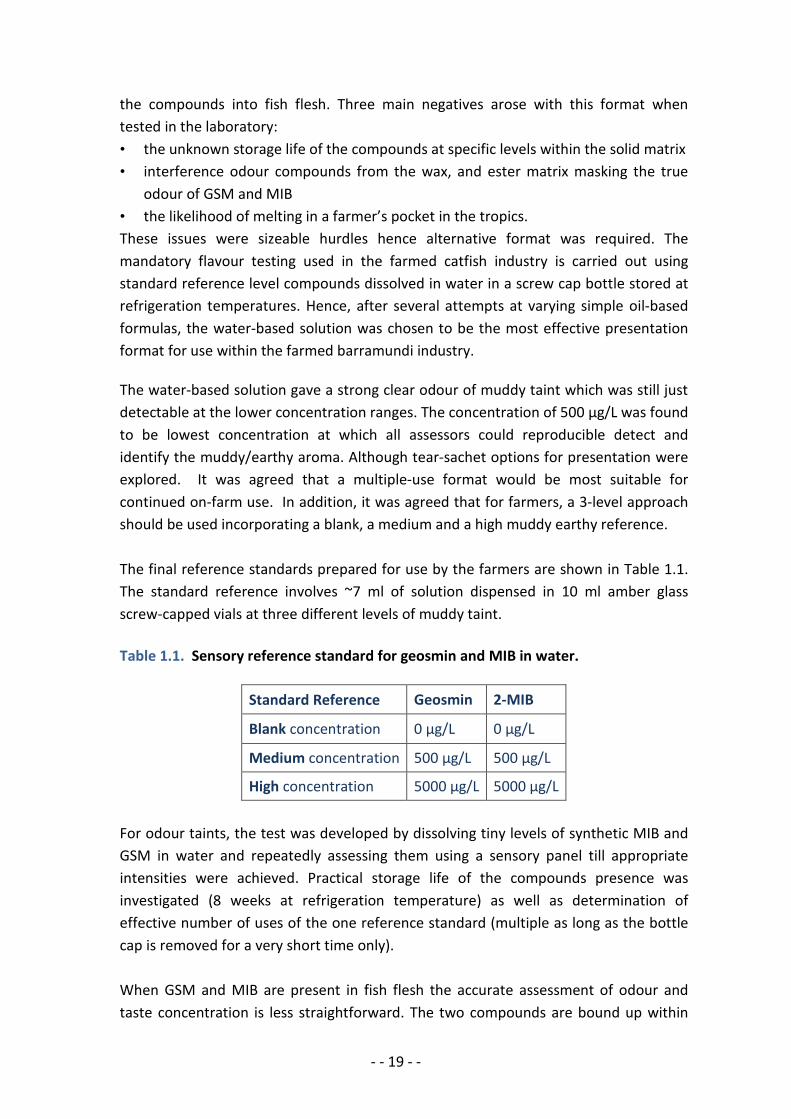
odour of GSM and MIB • the likelihood of melting in a farmer’s pocket in the tropics. These issues were sizeable hurdles hence alternative format was required. The mandatory flavour testing used in the farmed catfish industry is carried out using standard reference level compounds dissolved in water in a screw cap bottle stored at refrigeration temperatures. Hence, after several attempts at varying simple oil-based formulas, the water-based solution was chosen to be the most effective presentation format for use within the farmed barramundi industry. The water-based solution gave a strong clear odour of muddy taint which was still just detectable at the lower concentration ranges. The concentration of 500 µg/L was found to be lowest concentration at which all assessors could reproducible detect and identify the muddy/earthy aroma. Although tear-sachet options for presentation were explored. It was agreed that a multiple-use format would be most suitable for continued on-farm use. In addition, it was agreed that for farmers, a 3-level approach should be used incorporating a blank, a medium and a high muddy earthy reference. The final reference standards prepared for use by the farmers are shown in Table 1.1. The standard reference involves ~7 ml of solution dispensed in 10 ml amber glass screw-capped vials at three different levels of muddy taint. Table 1.1. Sensory reference standard for geosmin and MIB in water.
Standard Reference Geosmin 2-MIB
Blank concentration 0 µg/L 0 µg/L
Medium concentration 500 µg/L 500 µg/L
High concentration 5000 µg/L 5000 µg/L For odour taints, the test was developed by dissolving tiny levels of synthetic MIB and GSM in water and repeatedly assessing them using a sensory panel till appropriate intensities were achieved. Practical storage life of the compounds presence was investigated (8 weeks at refrigeration temperature) as well as determination of effective number of uses of the one reference standard (multiple as long as the bottle cap is removed for a very short time only). When GSM and MIB are present in fish flesh the accurate assessment of odour and taste concentration is less straightforward. The two compounds are bound up within
- - 20 - -
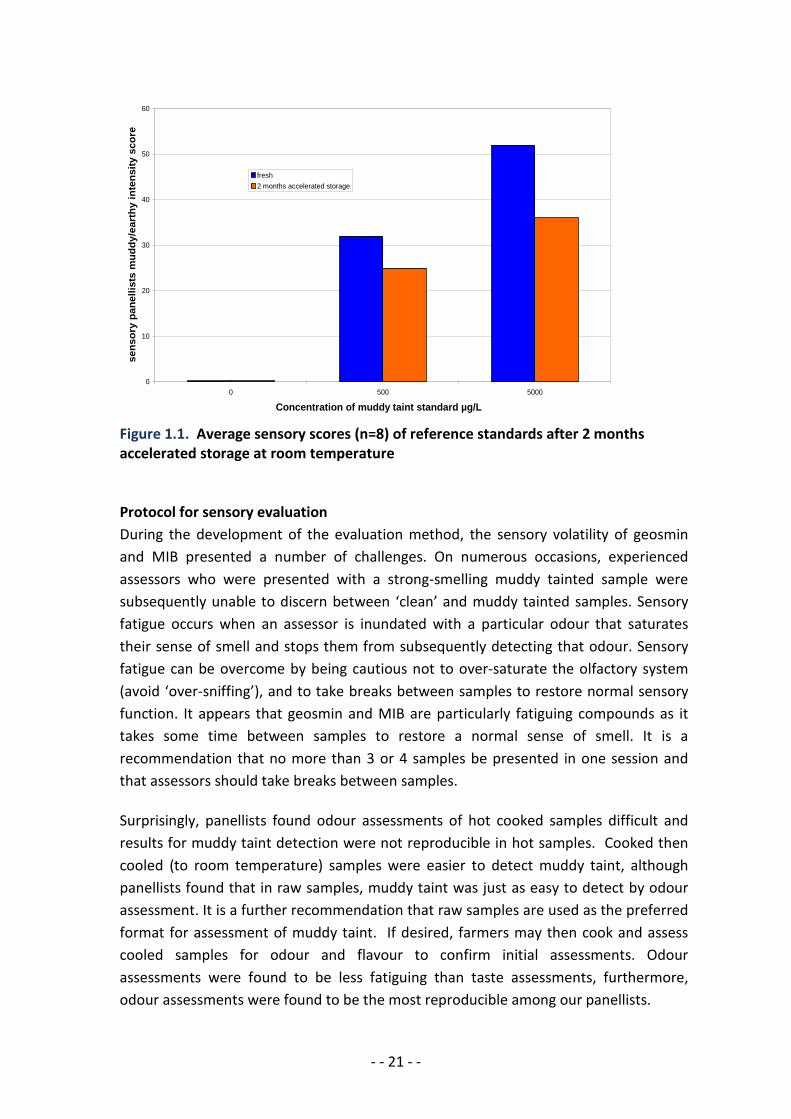
the lipid matrix in the fish flesh and hence less volatile which explains the higher threshold levels of human detection in fish. Additionally, when fish flesh is cooked, the heat causes the release of many other volatiles from proteins and lipids which masks taint to some extent. The sensory panel found that taint odours were more readily detectable in ‘cold’ flesh samples. Samples were microwave cooked and assessed whilst still hot, then the same cooked samples were allowed to cool to room temperature before being re-assessed. It was the cold sample that offered a greater differentiation of off-odour compounds without being confused by the addition of hot volatiles from the fish flesh. Therefore we explored the use of raw flesh for odour assessment as this could be readily done on-farm. However, while results indicated this was a valid method for assessment of taint in fish flesh, the ultimate taste test is from the consumer plate where the barramundi is most likely to be cooked. Therefore it was considered that taint assessment of fish flesh was more relevant to be carried out with cooked fish. The reference samples are provided to barramundi farmers as a training guide to assist assessors to recognise and rate the intensity of muddy taint in barramundi samples. They are not identical to the aromas that may be perceived in real samples. A real fish sample has other flavours present which will vary from sample to sample and will slightly change the way muddy taint is perceived Shelf-life evaluations were conducted on the chosen sensory reference standards after two months storage at room temperature. The results are shown in Figure 1.1. The scores indicate a reduction in odour intensity over time. Nevertheless, the scores for the high standard (5000 µg/L) were above the scores for the fresh medium (500 µg/L) standard which our panel found to be a reproducibly detectable level. It is recommended to keep the standards in refrigerated storage 4°C to extend the shelf-life further, however, to be wary that the reference will not last indefinitely and should be refreshed periodically if required. Aside from reference standards, fish samples were soaked in spiked solutions of geosmin and 2-methylisoborneol. This method allowed for training of participants to detect mid and very high range levels of muddy taint in real fish samples.
- - 21 - -
0
10
20
30
40
50
60
0 500 5000
Concentration of muddy taint standard µg/L
sens
ory
pane
llist
s m
uddy
/ear
thy
inte
nsity
sco
re
fresh2 months accelerated storage
Figure 1.1. Average sensory scores (n=8) of reference standards after 2 months accelerated storage at room temperature Protocol for sensory evaluation During the development of the evaluation method, the sensory volatility of geosmin and MIB presented a number of challenges. On numerous occasions, experienced assessors who were presented with a strong-smelling muddy tainted sample were subsequently unable to discern between ‘clean’ and muddy tainted samples. Sensory fatigue occurs when an assessor is inundated with a particular odour that saturates their sense of smell and stops them from subsequently detecting that odour. Sensory fatigue can be overcome by being cautious not to over-saturate the olfactory system (avoid ‘over-sniffing’), and to take breaks between samples to restore normal sensory function. It appears that geosmin and MIB are particularly fatiguing compounds as it takes some time between samples to restore a normal sense of smell. It is a recommendation that no more than 3 or 4 samples be presented in one session and that assessors should take breaks between samples. Surprisingly, panellists found odour assessments of hot cooked samples difficult and results for muddy taint detection were not reproducible in hot samples. Cooked then cooled (to room temperature) samples were easier to detect muddy taint, although panellists found that in raw samples, muddy taint was just as easy to detect by odour assessment. It is a further recommendation that raw samples are used as the preferred format for assessment of muddy taint. If desired, farmers may then cook and assess cooled samples for odour and flavour to confirm initial assessments. Odour assessments were found to be less fatiguing than taste assessments, furthermore, odour assessments were found to be the most reproducible among our panellists.
- - 22 - -
A number of different preparation methods were investigated to determine a consistent and simple way to assess muddy taint in barramundi flesh. For both cooked and raw sample preparation, samples were cut form the main mussel block avoiding belly flap and tail. The method recommended involves raw fillet odour evaluation described as follows:
Raw fillet assessment sample preparation • cut ~20-30 g portions of raw fillet for each assessor • place each portion on a small plate or foil dish and cover individually with foil at
room temperature • code the sample appropriately • present immediately for assessment
Cooked fillet assessment sample preparation: • cut raw fillet into ~20-30 g portions • arrange portions on a plate and cover with a second plate (avoid plastic wrap) • microwave on high for 10-20 sec until just cooked through • keep covered to retain odour while sample cools for 15 minutes • if testing multiple samples, place each cooked sample on a small plate or foil
dish and cover individually with foil. • code sample and assess
Industry Workshop. The standard reference solutions and assessment protocol was presented to ABFA members at an R&D workshop in Cairns , February 2011. The sensory workshop was divided into 3 sessions: 1. Information: a brief overview of sensory assessment – the theory behind sensory
perception, the why and how. This provided background for carrying out assessments with fish on-farm, the importance of clean testing environments and sensory fitness capability of the assessor.
2. Odour assessment: muddy taint reference test demonstration – the simple test system developed for the detection of the presence of taint compounds in fish was demonstrated to farmers. The method was required to be simple, user friendly, provide appropriate taint compound levels and exhibit stability for a practical storage life. The prototype reference method consisting of a water based medium with three reference levels of geosmin were assessed by individuals and ratings of odour intensity discussed.
3. Odour and flavour testing: assessment of different fish samples – the ability to assess either raw flesh samples for odour and cooked fish flesh for flavour was demonstrated and method protocols provided for application of testing on-farm.
- - 23 - -
Workshop discussion and feedback Session 1. Sensory information • participants responded positively to the brief background information on volatile
chemistry and sensory perception • there was genuine interested in how sensory characteristics of fish are assessed and
the different ways that this is done to provide different sets of information Session 2. Odour reference assessment • positive response to the simple liquid format of the reference samples - heartened
by this format being that used as standard reference in the US catfish industry • understood that the reference odour samples were not used as a direct comparative
rating scale – but for use to establish sensitivity of staff in ability to register geosmin odour, therefore to be used as a ‘training’ tool.
• participants were highly surprised at the variation in an individual’s ability to smell the volatile, which underscored the importance of selecting a ‘sensitive nose’ as the on-farm assessor.
• the 8 week storage life of the reference samples when stored at refrigeration temperature was accepted as practical and suitable.
• a suggestion that it would be good to have a comparative reference scale – hence a graduation of geosmin intensity in a series of phials. Discussion occurred around the unfeasibility of this in the sample format due to loss of odour over time and with repeat removal of the phial cap resulting in volatile release. To achieve a set of reference standards for ranking purposes a solid matrix format would need to be produced.
• all attendees took away a fresh set of reference standards for use on-farm • suggestion was that it would be useful for project team to re-demonstrate and talk
through the odour reference standard use during future farm visits. This was undertaken as requested.
Session 3. Odour and Flavour assessment of fish samples Odour assessment- raw samples • samples comprised untainted flesh and flesh pre-soaked in a low level of geosmin
solution. The differences in odour detection between ‘pure’ geosmin reference standards (as in the phials) and that in raw fish flesh samples was commented on. There was a general learning around fish flesh having a complexity of odours which changed the perception of the geosmin present. Again, there were participants who could not detect the geosmin odour now it was in amongst other inherent fish odours as well as some attendees that were highly sensitive to the taint – accidently ideal for the workshop goals – as highly illustrative of likely scenarios among separate farm staff.
- - 24 - -
• participants were then presented with 5 samples (raw) sourced from different farms – selected by project team as likely to cover a range of muddy taint levels. This engendered a strong reaction with the over-riding comment being huge surprise at how different the odours from individual fish samples were. It was noted that where samples had no taint, there was still broad difference in odour profiles between fish from different farms. Round table discussion included likely odour causes – pond water; weed, algal types present in pond etc. Outcome was a hugely increased awareness that fish odour is not a simplistic thing.
Flavour assessment – cooked samples • with cooked samples, participants were asked to assess both odour and flavour. • samples were the same as sourced for the above raw assessment. • comments on the differences between raw and cooked odours – general
consensus that cooked odours were stronger but even more complex. Discussion on volatile nature of compounds in fish flesh being released when flesh is cooked.
• There was lively discussion as to flesh sample positioning within the fillet – all aspects raised around differences between shoulder, tail or belly flap portions. Also strong exchange on whether taints are more concentrated in the dark muscle flesh compared to the white muscle.
• comments on cooking method and associated condiments ensued – an experienced opinion was that muddy taint can be reduced (or removed) by soaking the fillet in milk.
• one of the unexpected but strong illustrations to come from this tasting session was the surprise by the participants about the large differences in flavour between barramundi grown out on different farms under different conditions. They all “knew” what barramundi tasted like and that is of course – True, however most farmers only taste their own fish or maybe occasionally dining at a restaurant (which all claimed they did not select fish off the menu!) and this was the first time they had had an opportunity to taste different sourced fish side-by-side comparatively. This was an unplanned but true winning outcome of the tasting session.
Conclusive points: • most farmers happy that could detect taint odours in raw fish flesh – but most
decided the presence was more obvious in cooked flesh • strongly increased awareness of differences between individuals to detect taint –
and the implications of this for whomever is assessing the fish on-farm • demonstration on-farm during future visits by project team would be great This taint assessment protocol has been incorporated into the recently established quality practices certification system: Sustainably Farmed Barramundi Gold Tick.
- - 25 - -
Chemical compound analysis Analytical detection of GSM and MIB in water is relatively straightforward due to the compounds having low solubility in solution. A number of analytical methods have been developed based on headspace using gas chromatography and mass spectroscopy (GC-MS), as well as solid phase micro-extraction (SPME) for the analysis of these compounds in water (Lloyd et al, 1998; Saito et al, 2008). The determination of these compounds in fish flesh is more difficult however, as they bind to the lipid matrix of the fish and are understood to be present in very small amounts but still be detectable to the human senses. Consequently, reported values can be unreliable and illustrate highly variable recoveries from ‘spiked’ flesh samples (ranging from 30% to 90%, Yamprayoon and Noonhorm, 2000; Robertson et al, 2005). Hence until recently, the detection of these compounds in fish flesh relied heavily upon expensive sensory testing procedures. Recent advances in technology (Zhang et al, 2009) indicate that new analytical methods based upon extraction and concentration procedures will result in greatly improved and more sensitive methods of detection. Methods have been proposed specifically for monitoring GSM and MIB residues in channel catfish (Conte et al., 1996; Lloyd and Grimm, 1999; Grimm et al, 2000). However as the compounds are retained within the lipid matrix of the flesh, their presence and detection are affected by the fat content of the specific fish (Howgate, 2004). Catfish, for which the current methods have been developed, have a lipid content ~ 0.5% while farmed barramundi can have a fat content up to 3% depending on diet and culture regime. Development of a sensitive reliable analytical method is needed to confidently determine GSM and MIB levels in Australian farmed freshwater fish. Analysis of geosmin and 2-MIB in pond water and fish Pond water (10mL) was transferred to a 20ml headspace vial. A fixed amount of tetramethyl pyrazine (TMP) was used as an internal standard and 2g of sodium chloride was added to the vial which was subsequently securely capped and then stored at -20°C until analysed. Each sample was prepared in duplicate. Prior to GC-MS analysis vials were removed from -20°C storage, thawed and then mixed thoroughly using a vortex stirrer. Sample extracts and calibration samples were placed in the GC-MS auto-sampler and subsequently extracted using solid phase micro extraction (SPME) of the sample headspace. Analysis of the extracts was undertaken by GC-MS with the mass spectrophotometer set to selected ion monitoring (SIM). Geosmin and 2-MIB were identified by a combination of retention time matches and the relative intensities of selected qualifier ions to the selected quantitative ion for
- - 26 - -
each compound. Geosmin and 2-MIB levels in fish and pond water were determined using a linear internal standard method. Calibration samples for waters were prepared in a similar way to that described above using water known to be free of geosmin and of 2-MIB. A constant amount of TMP and a variable amount of geosmin and 2-MIB were added to 10mL of water. Sodium chloride (2g) was also added to each vial. A minimum of 5 calibration extracts were prepared to span the range of geosmin and 2-MIB levels likely to occur in the pond water samples. Calibration samples for fish flesh were prepared in a similar way to that described above using barramundi known to be free of geosmin and 2-MIB. A constant amount of TMP and a variable amount of geosmin and 2-MIB were added with the minced fish in the ball mill and then homogenized and extracted as described above. A minimum of 5 calibration extracts were prepared to span the range of geosmin and 2-MIB levels expected in the fish samples. A sub-sample of fish flesh was accurately weighed into a ball mill. A solution of TMP was added to the ball mill as an internal standard and the mix homogenized for 60 seconds. Approximately 20g of homogenate was then transferred to a micro-kjeldahl extraction apparatus, 10mL of water and 1mL of 1N NaOH were also added to the extraction unit. The mixture was steam extracted and distilled until 8mL of distillate was collected in a glass headspace vial. The steam extract was subsequently made to 10mL with water. Sodium chloride, 2g, was also added to the vial which was then securely capped and stored at -20°C until analysed. Each sample was prepared in duplicate. Monitoring of ponds for off-flavour compounds Flavour taint in fish grown in freshwater fish farms is a universal issue and has been noted in Australian grow-out systems, both open pond and recirculation freshwater operations. However to date, there have been no records kept of events and the corresponding environmental factors that may affect event severity. It is important to obtain a record of off-flavour events as they occur as this provides a base or background picture including which ponds are involved; where they are located; when the events occur and potentially what was the causative organism, for example presence of certain algae. The qualification on collected data is that it only really holds true for the time period of sampling and cannot necessarily be extrapolated across seasons or locations. This is due to the vast number of variables involved and so it is possible that monitoring through a second season with different climatic conditions may paint a different picture. Monitoring ponds not only illustrates levels of off-flavour
- - 27 - -
compounds present but allows possible identification of causative organisms. If causative organisms can be pinpointed as the source of off-flavour occurrence, it allows development of remedial tools specific to the organisms. Collection of pond data also provides broader information on:
• any similarities / differences between regions / farms • ability to correlate environmental factors with events
Investigation purpose To understand off-flavour occurrence and incidence. To determine the common endogenous causative organisms that produce geosmin Farms monitored Separate farms at different geographical locations were included to establish extent and occurrence of off-flavour events: Daintree River Barramundi - Daintree Barramundi Gardens – NQ Tablelands Kula Park – NQ Tablelands King Reef – Innisfail PEJO – Innisfail Kelso – Good Fortune Bay, Townsville Humpty Doo Barra – Northern Territory Not all sites were relevant for regular monitoring, as not all farms had issues with off-flavour, hence monitoring occurred according to taint events, recent history and associated environmental conditions. Monitoring methods Selected ponds were sampled for geosmin, 2-methyl isoborneol (2-MIB) and plankton identification at each sampling time point. As appropriate to the pond being monitored, sample intervals were 3 days to 2 weeks. Farm records were used for monitoring water quality and pond/stock conditions and management activities to correlate with sample results. Farm monitoring sheet is attached in Appendix 4: 4.2. Sampling of waters in ponds Water was sampled in clean glass 70ml jars that had a fully lined seal within the lid, appropriately labelled. These were frozen immediately and sent to Brisbane in insulated containers for analysis. Preliminary sampling was undertaken to establish whether geosmin levels differed within the water column or by location in pond. All sites sampled returned very similar results. Consequently, it was decided that surface water samples from a readily-accessible corner of the pond would provide a satisfactory monitoring point. Care was taken not to include obvious algal bloom growth or organic debris. Additional
- - 28 - -
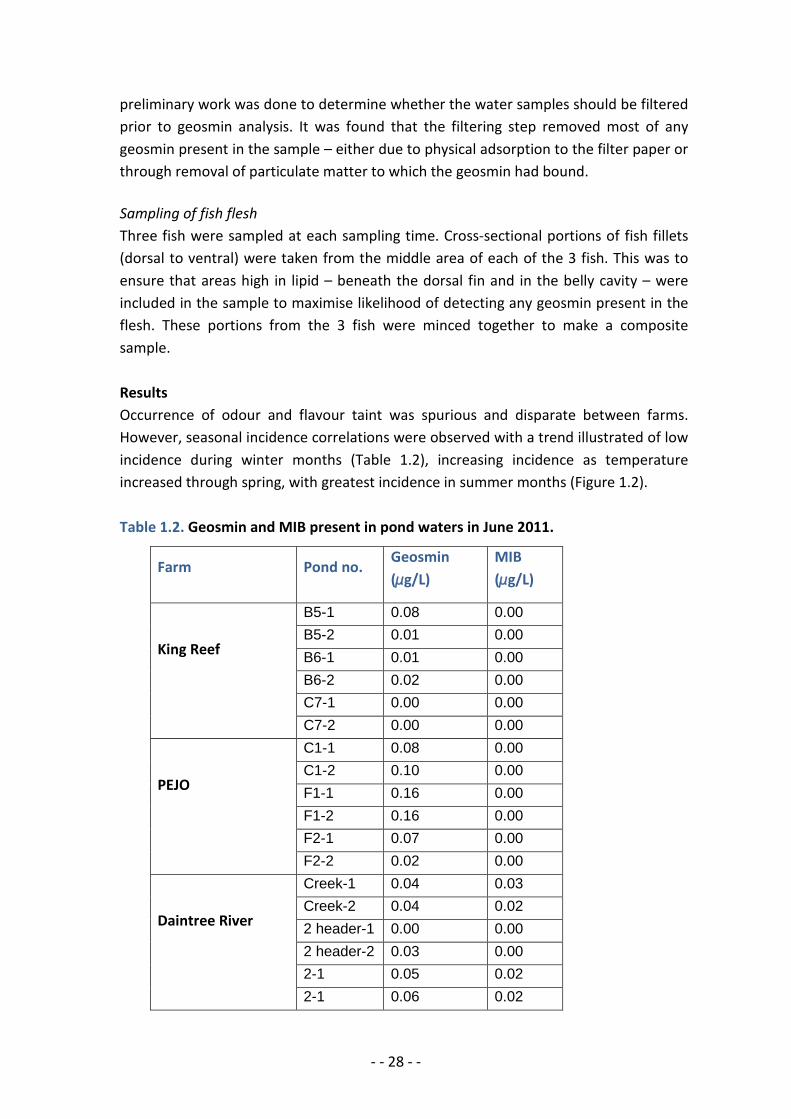
preliminary work was done to determine whether the water samples should be filtered prior to geosmin analysis. It was found that the filtering step removed most of any geosmin present in the sample – either due to physical adsorption to the filter paper or through removal of particulate matter to which the geosmin had bound. Sampling of fish flesh Three fish were sampled at each sampling time. Cross-sectional portions of fish fillets (dorsal to ventral) were taken from the middle area of each of the 3 fish. This was to ensure that areas high in lipid – beneath the dorsal fin and in the belly cavity – were included in the sample to maximise likelihood of detecting any geosmin present in the flesh. These portions from the 3 fish were minced together to make a composite sample. Results Occurrence of odour and flavour taint was spurious and disparate between farms. However, seasonal incidence correlations were observed with a trend illustrated of low incidence during winter months (Table 1.2), increasing incidence as temperature increased through spring, with greatest incidence in summer months (Figure 1.2). Table 1.2. Geosmin and MIB present in pond waters in June 2011.
Farm Pond no. Geosmin (µg/L)
MIB (µg/L)
King Reef
B5-1 0.08 0.00 B5-2 0.01 0.00 B6-1 0.01 0.00 B6-2 0.02 0.00 C7-1 0.00 0.00 C7-2 0.00 0.00
PEJO
C1-1 0.08 0.00 C1-2 0.10 0.00 F1-1 0.16 0.00 F1-2 0.16 0.00 F2-1 0.07 0.00 F2-2 0.02 0.00
Daintree River
Creek-1 0.04 0.03 Creek-2 0.04 0.02 2 header-1 0.00 0.00 2 header-2 0.03 0.00 2-1 0.05 0.02 2-1 0.06 0.02

- - 29 - -
Figure 1.2. Geosmin and MIB present in pond waters over summer months. Occurrence of taint events was clearly farm specific and characteristic to a farm. Two farms are located geographically close and thereby experience similar climatic conditions, even so one farm encounters a distinct peak period of high geosmin occurrence (Figure 1.3) during early Spring (August). Figure 1.3. Geosmin water level spike occurring each August on one farm.
0
1
2
3
4
5
6
7
8
9
Pond
wat
er g
eosm
in u
g/L
- - 30 - -
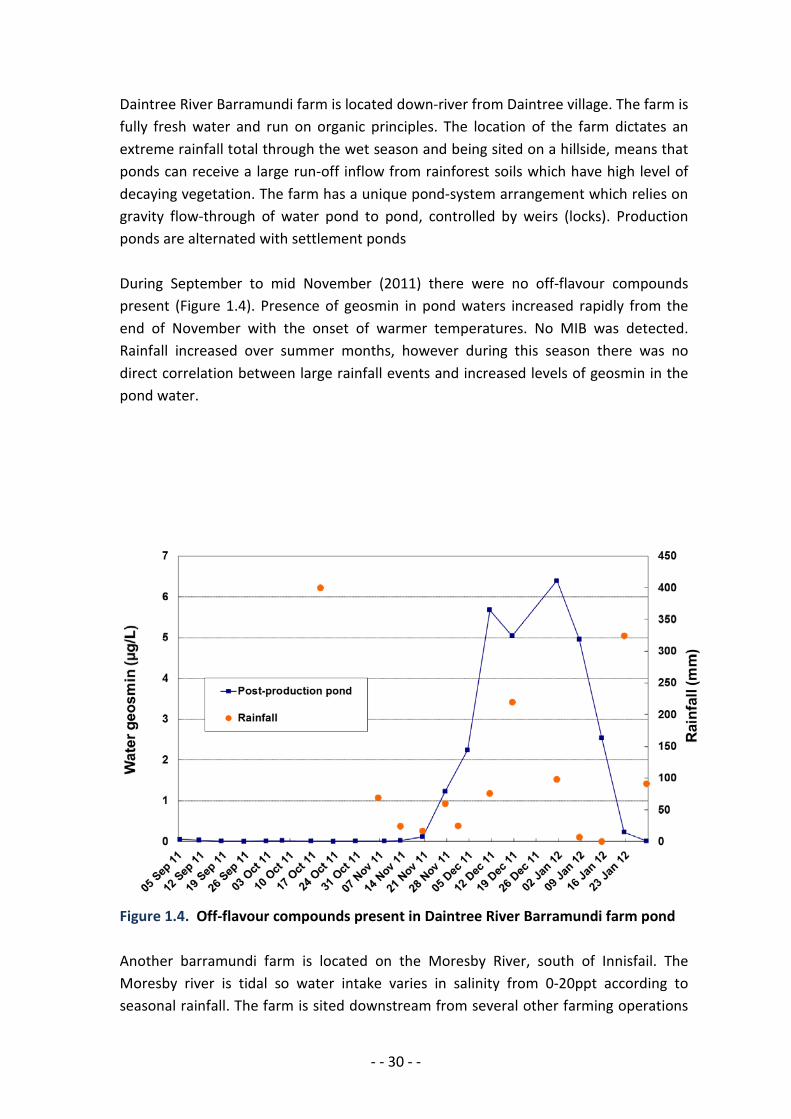
Daintree River Barramundi farm is located down-river from Daintree village. The farm is fully fresh water and run on organic principles. The location of the farm dictates an extreme rainfall total through the wet season and being sited on a hillside, means that ponds can receive a large run-off inflow from rainforest soils which have high level of decaying vegetation. The farm has a unique pond-system arrangement which relies on gravity flow-through of water pond to pond, controlled by weirs (locks). Production ponds are alternated with settlement ponds During September to mid November (2011) there were no off-flavour compounds present (Figure 1.4). Presence of geosmin in pond waters increased rapidly from the end of November with the onset of warmer temperatures. No MIB was detected. Rainfall increased over summer months, however during this season there was no direct correlation between large rainfall events and increased levels of geosmin in the pond water.
Figure 1.4. Off-flavour compounds present in Daintree River Barramundi farm pond Another barramundi farm is located on the Moresby River, south of Innisfail. The Moresby river is tidal so water intake varies in salinity from 0-20ppt according to seasonal rainfall. The farm is sited downstream from several other farming operations
- - 31 - -
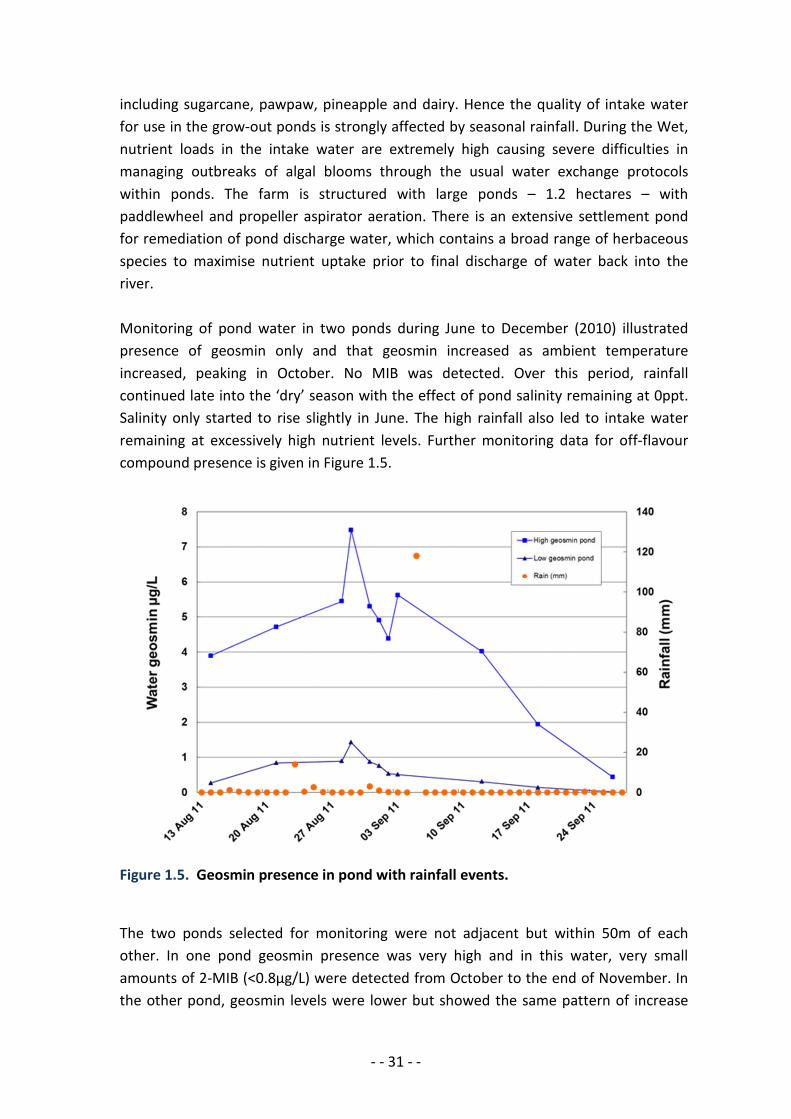
including sugarcane, pawpaw, pineapple and dairy. Hence the quality of intake water for use in the grow-out ponds is strongly affected by seasonal rainfall. During the Wet, nutrient loads in the intake water are extremely high causing severe difficulties in managing outbreaks of algal blooms through the usual water exchange protocols within ponds. The farm is structured with large ponds – 1.2 hectares – with paddlewheel and propeller aspirator aeration. There is an extensive settlement pond for remediation of pond discharge water, which contains a broad range of herbaceous species to maximise nutrient uptake prior to final discharge of water back into the river. Monitoring of pond water in two ponds during June to December (2010) illustrated presence of geosmin only and that geosmin increased as ambient temperature increased, peaking in October. No MIB was detected. Over this period, rainfall continued late into the ‘dry’ season with the effect of pond salinity remaining at 0ppt. Salinity only started to rise slightly in June. The high rainfall also led to intake water remaining at excessively high nutrient levels. Further monitoring data for off-flavour compound presence is given in Figure 1.5. Figure 1.5. Geosmin presence in pond with rainfall events. The two ponds selected for monitoring were not adjacent but within 50m of each other. In one pond geosmin presence was very high and in this water, very small amounts of 2-MIB (<0.8µg/L) were detected from October to the end of November. In the other pond, geosmin levels were lower but showed the same pattern of increase
- - 32 - -
and disappearance of geosmin. In this latter pond no 2-MIB was detected. Two different ponds also showed variably high and low increase in geosmin presence in the water and followed the same pattern as illustrated above over the same period. Again there is no apparent effect from high rainfall on the presence of geosmin. Both ponds demonstrated an increase in geosmin in the water, peaking at similar dates and decreasing over a similar timeframe irrespective of the high rainfall event. King Reef barramundi farm is located near Cowley, south of Innisfail. It has very large ponds and access to clean river freshwater all year round, which is used for pond water exchange. Aeration of ponds is by multiple paddlewheels. Most ponds have a clay base and water in freshly prepared ponds remains clear initially until a green algae culture develops over about 6 months. After this time, colloidal silt establishes throughout the water column. The silt particles are quite dense (hand immersed in water is not visible 5-10cm below the surface) and this phenomenon happens in most ponds. It is likely that this colloidal silt will prevent light penetration and hence assist in limiting cyanobacterial blooms. King Reef has a small amount of duckweed present on farm – and the farm is quite happy to cultivate this as a potential mitigation method. Duckweed potentially reduces bloom occurrence both through competition for nutrients in the water column and by restricting light as it floats on or near the pond surface in dense mat. This farm reports no issue with muddy taint in pond water or fish apart from the infrequent minor outbreak which usually can be readily dealt with through water exchange, increased aeration effort and delaying harvest. The farm operates on a policy of taste-testing sampled fish from a pond prior to harvesting for market. Location of geosmin within a pond Initially, taint compound measurement was focussed on water samples from the pond as it is widely accepted that certain rafting blue-green algal blooms are the contributory origin of taint compounds and therefore concentration present in the water column would dictate the amount of taint available to the fish. Uptake of taint compounds is mainly through the alimentary system, particularly during feeding behaviour, but is also significantly via the gills and skin (From and Horlyck, 2011; Howgate, 2004; Persson, 1984). Observation on farms noted several occasions when taint was unmistakeable in the pond by olfactory sense but no algal bloom was evident and nor had there been recent
- - 33 - -
history of any bloom. Additionally, the sharp increases and decreases in geosmin concentrations in the water raised questions as to the pond source of the compounds:
• was it due to bloom proliferation only ? • were benthic algae contributing ? • was geosmin captured in the bottom or pond wall mud from actinomycetes
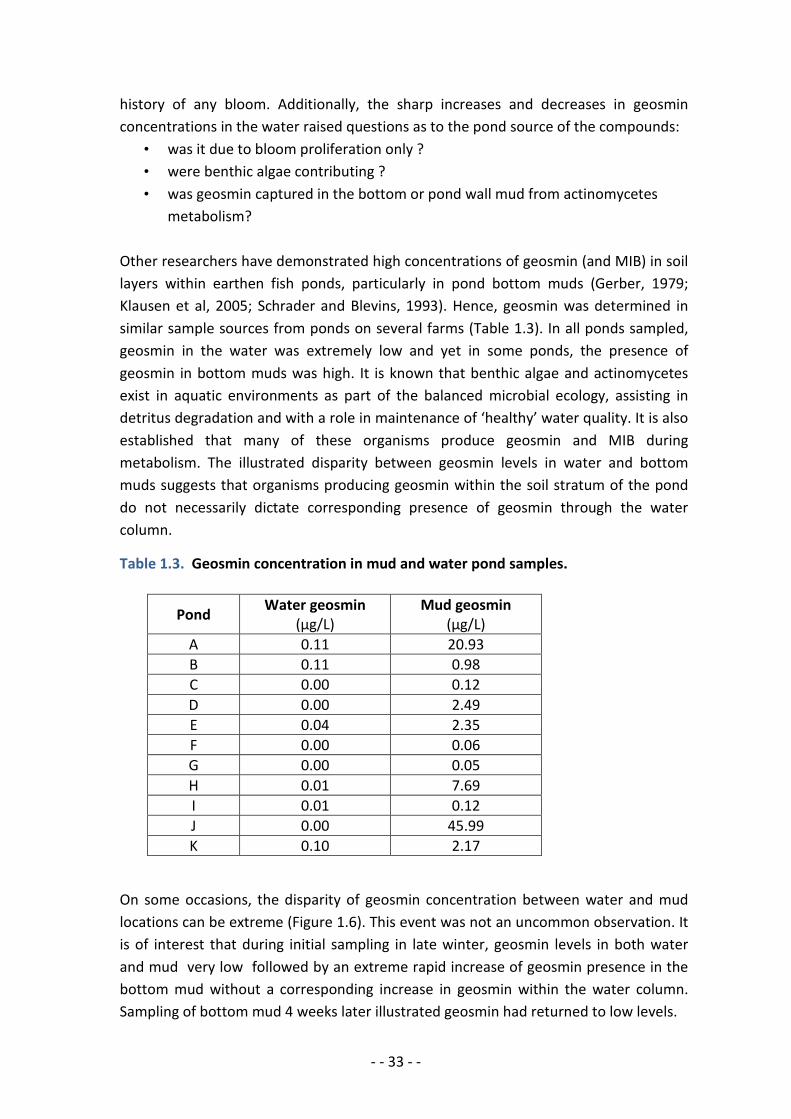
metabolism? Other researchers have demonstrated high concentrations of geosmin (and MIB) in soil layers within earthen fish ponds, particularly in pond bottom muds (Gerber, 1979; Klausen et al, 2005; Schrader and Blevins, 1993). Hence, geosmin was determined in similar sample sources from ponds on several farms (Table 1.3). In all ponds sampled, geosmin in the water was extremely low and yet in some ponds, the presence of geosmin in bottom muds was high. It is known that benthic algae and actinomycetes exist in aquatic environments as part of the balanced microbial ecology, assisting in detritus degradation and with a role in maintenance of ‘healthy’ water quality. It is also established that many of these organisms produce geosmin and MIB during metabolism. The illustrated disparity between geosmin levels in water and bottom muds suggests that organisms producing geosmin within the soil stratum of the pond do not necessarily dictate corresponding presence of geosmin through the water column.
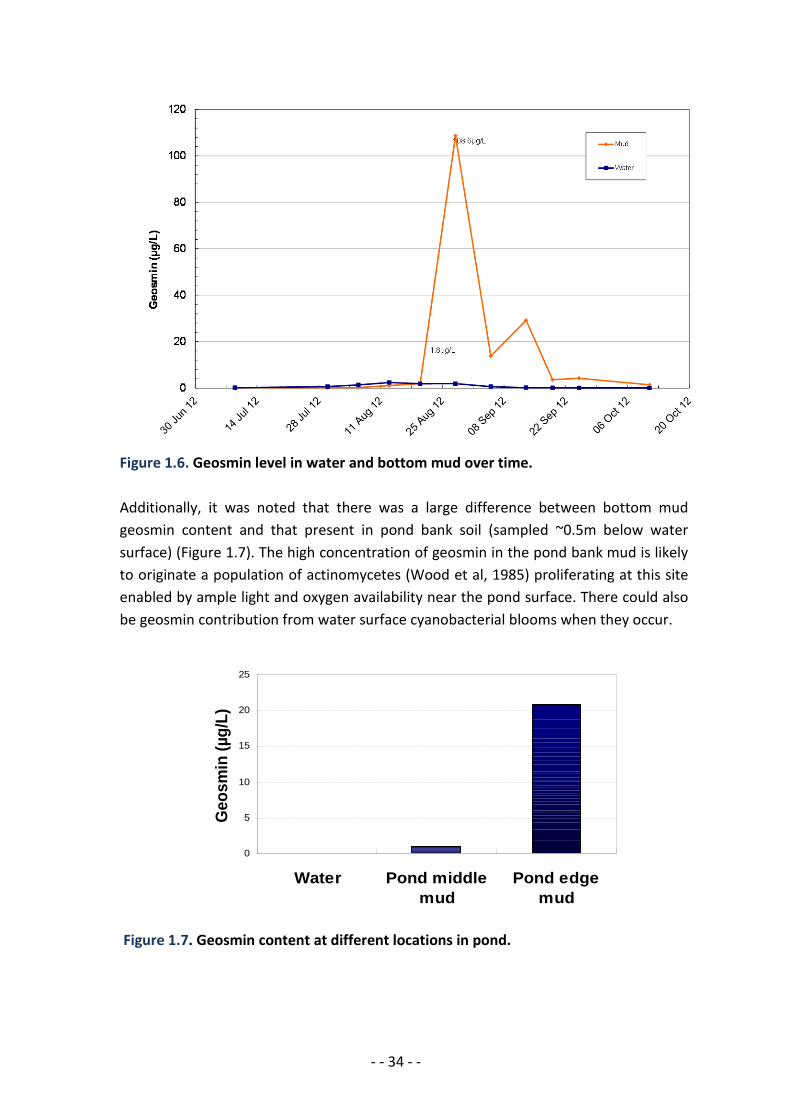
Table 1.3. Geosmin concentration in mud and water pond samples. On some occasions, the disparity of geosmin concentration between water and mud locations can be extreme (Figure 1.6). This event was not an uncommon observation. It is of interest that during initial sampling in late winter, geosmin levels in both water and mud very low followed by an extreme rapid increase of geosmin presence in the bottom mud without a corresponding increase in geosmin within the water column. Sampling of bottom mud 4 weeks later illustrated geosmin had returned to low levels.
Pond Water geosmin (µg/L)
Mud geosmin (µg/L)
A 0.11 20.93 B 0.11 0.98 C 0.00 0.12 D 0.00 2.49 E 0.04 2.35 F 0.00 0.06 G 0.00 0.05 H 0.01 7.69 I 0.01 0.12 J 0.00 45.99 K 0.10 2.17
- - 34 - -
Figure 1.6. Geosmin level in water and bottom mud over time. Additionally, it was noted that there was a large difference between bottom mud geosmin content and that present in pond bank soil (sampled ~0.5m below water surface) (Figure 1.7). The high concentration of geosmin in the pond bank mud is likely to originate a population of actinomycetes (Wood et al, 1985) proliferating at this site enabled by ample light and oxygen availability near the pond surface. There could also be geosmin contribution from water surface cyanobacterial blooms when they occur. Figure 1.7. Geosmin content at different locations in pond.
0
5
10
15
20
25
Water Pond middlemud
Pond edgemud
Geo
smin
(µg/
L)
- - 35 - -
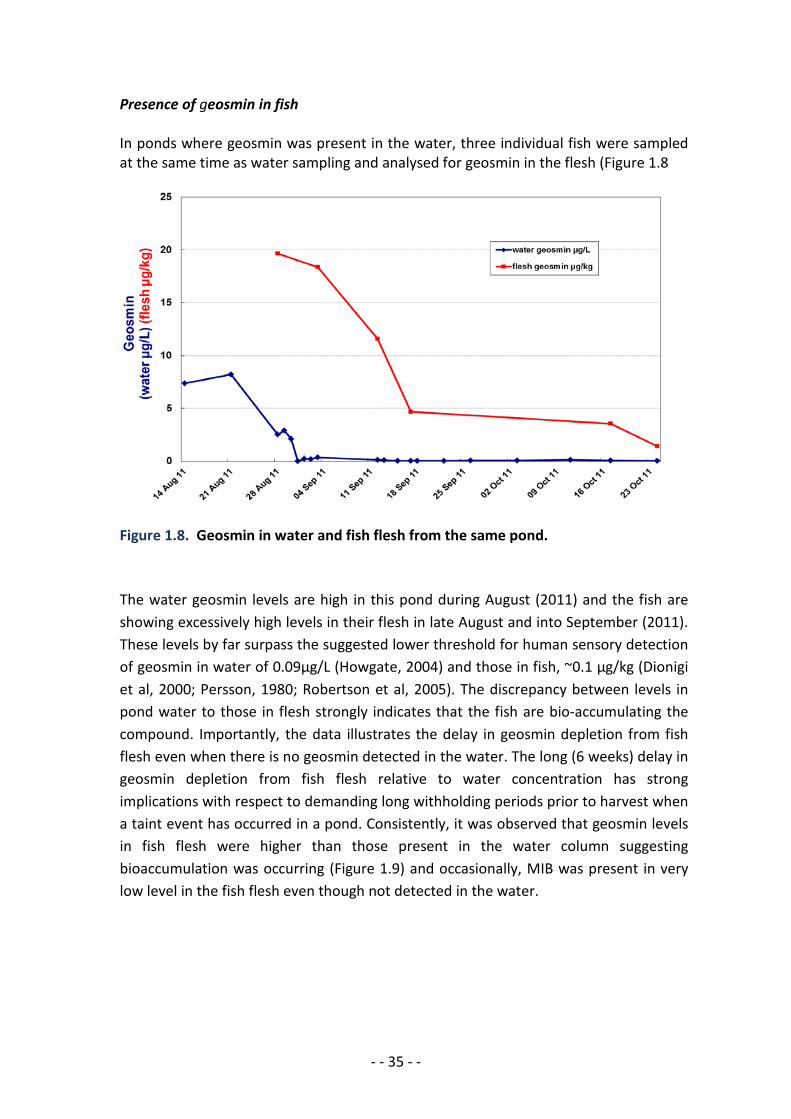
Presence of geosmin in fish In ponds where geosmin was present in the water, three individual fish were sampled at the same time as water sampling and analysed for geosmin in the flesh (Figure 1.8
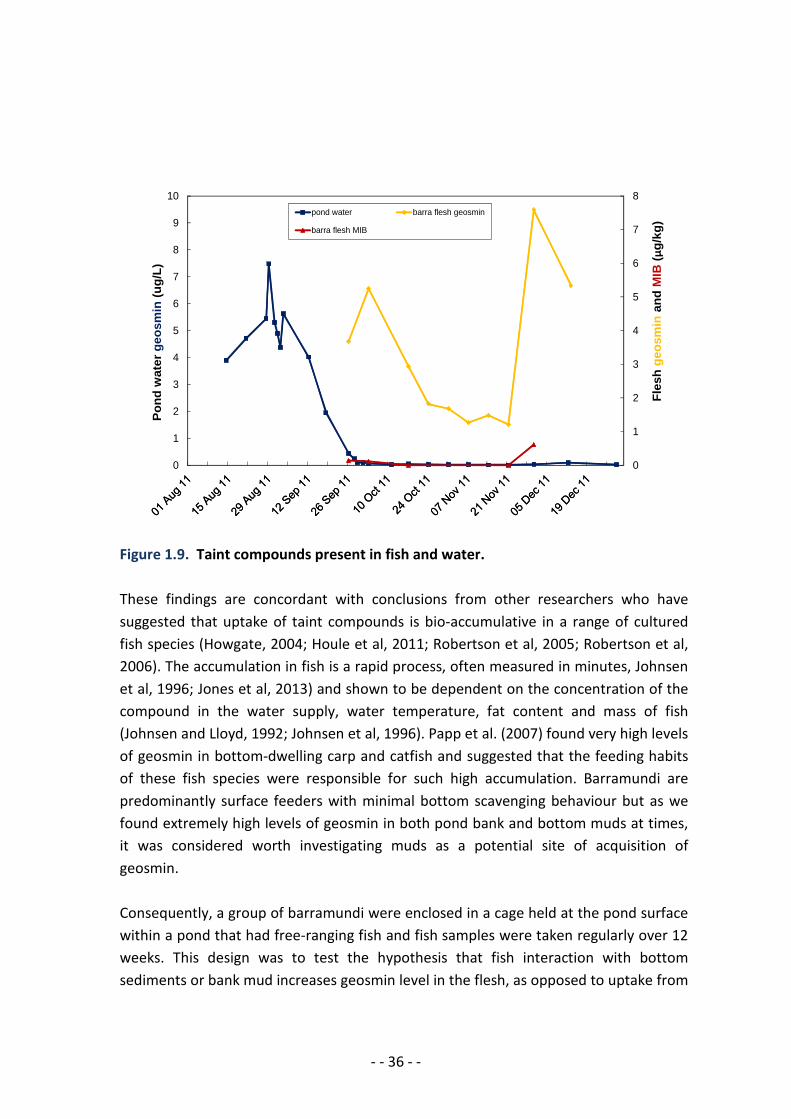
Figure 1.8. Geosmin in water and fish flesh from the same pond. The water geosmin levels are high in this pond during August (2011) and the fish are showing excessively high levels in their flesh in late August and into September (2011). These levels by far surpass the suggested lower threshold for human sensory detection of geosmin in water of 0.09µg/L (Howgate, 2004) and those in fish, ~0.1 µg/kg (Dionigi et al, 2000; Persson, 1980; Robertson et al, 2005). The discrepancy between levels in pond water to those in flesh strongly indicates that the fish are bio-accumulating the compound. Importantly, the data illustrates the delay in geosmin depletion from fish flesh even when there is no geosmin detected in the water. The long (6 weeks) delay in geosmin depletion from fish flesh relative to water concentration has strong implications with respect to demanding long withholding periods prior to harvest when a taint event has occurred in a pond. Consistently, it was observed that geosmin levels in fish flesh were higher than those present in the water column suggesting bioaccumulation was occurring (Figure 1.9) and occasionally, MIB was present in very low level in the fish flesh even though not detected in the water.
- - 36 - -
Figure 1.9. Taint compounds present in fish and water. These findings are concordant with conclusions from other researchers who have suggested that uptake of taint compounds is bio-accumulative in a range of cultured fish species (Howgate, 2004; Houle et al, 2011; Robertson et al, 2005; Robertson et al, 2006). The accumulation in fish is a rapid process, often measured in minutes, Johnsen et al, 1996; Jones et al, 2013) and shown to be dependent on the concentration of the compound in the water supply, water temperature, fat content and mass of fish (Johnsen and Lloyd, 1992; Johnsen et al, 1996). Papp et al. (2007) found very high levels of geosmin in bottom-dwelling carp and catfish and suggested that the feeding habits of these fish species were responsible for such high accumulation. Barramundi are predominantly surface feeders with minimal bottom scavenging behaviour but as we found extremely high levels of geosmin in both pond bank and bottom muds at times, it was considered worth investigating muds as a potential site of acquisition of geosmin. Consequently, a group of barramundi were enclosed in a cage held at the pond surface within a pond that had free-ranging fish and fish samples were taken regularly over 12 weeks. This design was to test the hypothesis that fish interaction with bottom sediments or bank mud increases geosmin level in the flesh, as opposed to uptake from
0
1
2
3
4
5
6
7
8
0
1
2
3
4
5
6
7
8
9
10
Fles
h ge
osm
inan
d M
IB(µ
g/kg
)
Pond
wat
er g
eosm
in(u
g/L)
pond water barra flesh geosmin
barra flesh MIB

- - 37 - -
disturbed sediments rising in the water column by the fish at the surface. Analysis of the fish for geosmin in their flesh showed Figure 1.10.
Figure 1.10. Geosmin presence the flesh of free-ranging and caged fish. During this trial water geosmin remained at negligible levels throughout but both free ranging and caged fish had high levels of geosmin in their flesh. There followed a typical pattern of depletion to low levels within both sets of fish, however the encaged fish retained more geosmin over the first 4 weeks. After this time, geosmin in the fish was similar and also showed similar subsequent increase in geosmin despite water levels remaining very low. Results indicate that free-ranging fish are not attaining additional geosmin from pond mud. It was suggested that harvest operation itself may disturb up the top layers of mud, both at the bottom and on sides of the pond. That fish were not picking up geosmin during was further supported in drain-harvest trials in which levels of geosmin in fish flesh were determined in fish prior to harvest, then after the pond was drained and the fish had experienced close contact with bottom mud during the harvesting period. This was an opportunistically undertaken trial and unfortunately geosmin presence in the fish prior to harvest was very low (Figure 1.11). After contact with pond mud there was a slightly higher level of geosmin detected in the fish, however levels remained well below sensory threshold detection levels.

- - 38 - -
Figure 1.11. Geosmin levels in fish subjected to drain harvest. Further indication that mud was not likely a primary source of geosmin is given in Figure 1.12. Geosmin increased from negligible level to high levels in fish around the middle of August (2012) and at this time there occurred an extreme spike in geosmin level of the mud. However additional to the spike in mud geosmin concentration, Microcystis slick present in the pond at the same time evidenced geosmin levels of >250µg/L, this level was beyond the calibration of the gas chromatograph instrument used for analysis.
Figure 1.12. Geosmin concentrations of levels in fish, water and bottom mud of pond. It is suggested that the fish could be ingesting geosmin from the surface algae during feeding, rather than attaining it from the bottom mud in the pond.
0
0.002
0.004
0.006
0.008
0.01
0.012
0.014
Pond A Pond B
Wat
er g
eosm
in (µ
g/L)
before harvest
during harvest
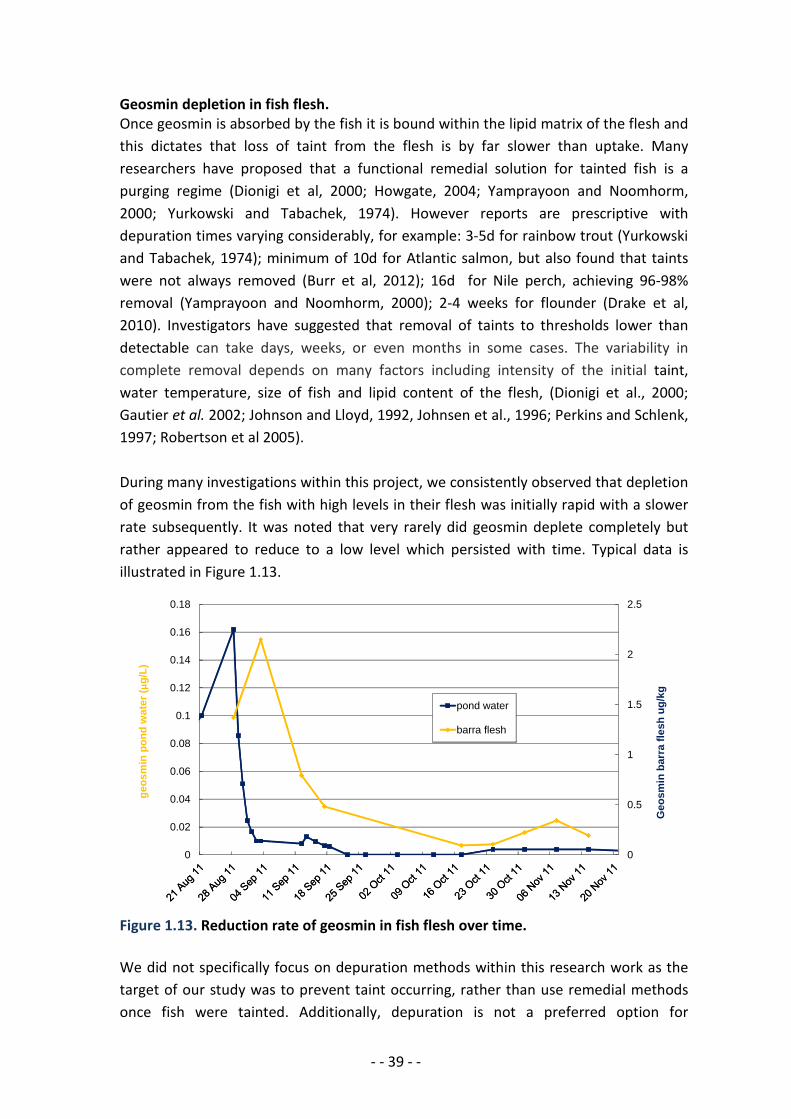
- - 39 - -
Geosmin depletion in fish flesh. Once geosmin is absorbed by the fish it is bound within the lipid matrix of the flesh and this dictates that loss of taint from the flesh is by far slower than uptake. Many researchers have proposed that a functional remedial solution for tainted fish is a purging regime (Dionigi et al, 2000; Howgate, 2004; Yamprayoon and Noomhorm, 2000; Yurkowski and Tabachek, 1974). However reports are prescriptive with depuration times varying considerably, for example: 3-5d for rainbow trout (Yurkowski and Tabachek, 1974); minimum of 10d for Atlantic salmon, but also found that taints were not always removed (Burr et al, 2012); 16d for Nile perch, achieving 96-98% removal (Yamprayoon and Noomhorm, 2000); 2-4 weeks for flounder (Drake et al, 2010). Investigators have suggested that removal of taints to thresholds lower than detectable can take days, weeks, or even months in some cases. The variability in complete removal depends on many factors including intensity of the initial taint, water temperature, size of fish and lipid content of the flesh, (Dionigi et al., 2000; Gautier et al. 2002; Johnson and Lloyd, 1992, Johnsen et al., 1996; Perkins and Schlenk, 1997; Robertson et al 2005). During many investigations within this project, we consistently observed that depletion of geosmin from the fish with high levels in their flesh was initially rapid with a slower rate subsequently. It was noted that very rarely did geosmin deplete completely but rather appeared to reduce to a low level which persisted with time. Typical data is illustrated in Figure 1.13. Figure 1.13. Reduction rate of geosmin in fish flesh over time. We did not specifically focus on depuration methods within this research work as the target of our study was to prevent taint occurring, rather than use remedial methods once fish were tainted. Additionally, depuration is not a preferred option for
0
0.5
1
1.5
2
2.5
0
0.02
0.04
0.06
0.08
0.1
0.12
0.14
0.16
0.18
Geo
smin
bar
ra fl
esh
ug/k
g
geos
min
pon
d w
ater
(µg/
L)
pond water
barra flesh
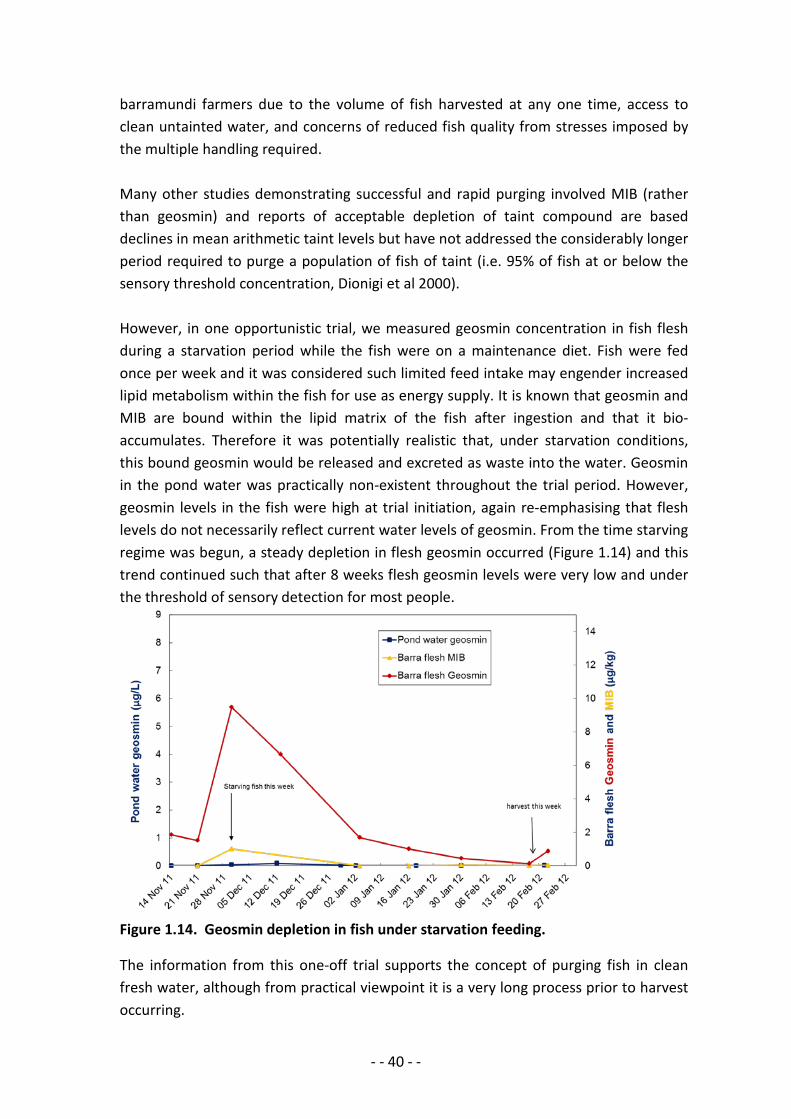
- - 40 - -
barramundi farmers due to the volume of fish harvested at any one time, access to clean untainted water, and concerns of reduced fish quality from stresses imposed by the multiple handling required. Many other studies demonstrating successful and rapid purging involved MIB (rather than geosmin) and reports of acceptable depletion of taint compound are based declines in mean arithmetic taint levels but have not addressed the considerably longer period required to purge a population of fish of taint (i.e. 95% of fish at or below the sensory threshold concentration, Dionigi et al 2000). However, in one opportunistic trial, we measured geosmin concentration in fish flesh during a starvation period while the fish were on a maintenance diet. Fish were fed once per week and it was considered such limited feed intake may engender increased lipid metabolism within the fish for use as energy supply. It is known that geosmin and MIB are bound within the lipid matrix of the fish after ingestion and that it bio-accumulates. Therefore it was potentially realistic that, under starvation conditions, this bound geosmin would be released and excreted as waste into the water. Geosmin in the pond water was practically non-existent throughout the trial period. However, geosmin levels in the fish were high at trial initiation, again re-emphasising that flesh levels do not necessarily reflect current water levels of geosmin. From the time starving regime was begun, a steady depletion in flesh geosmin occurred (Figure 1.14) and this trend continued such that after 8 weeks flesh geosmin levels were very low and under the threshold of sensory detection for most people.
Figure 1.14. Geosmin depletion in fish under starvation feeding.
The information from this one-off trial supports the concept of purging fish in clean fresh water, although from practical viewpoint it is a very long process prior to harvest occurring.
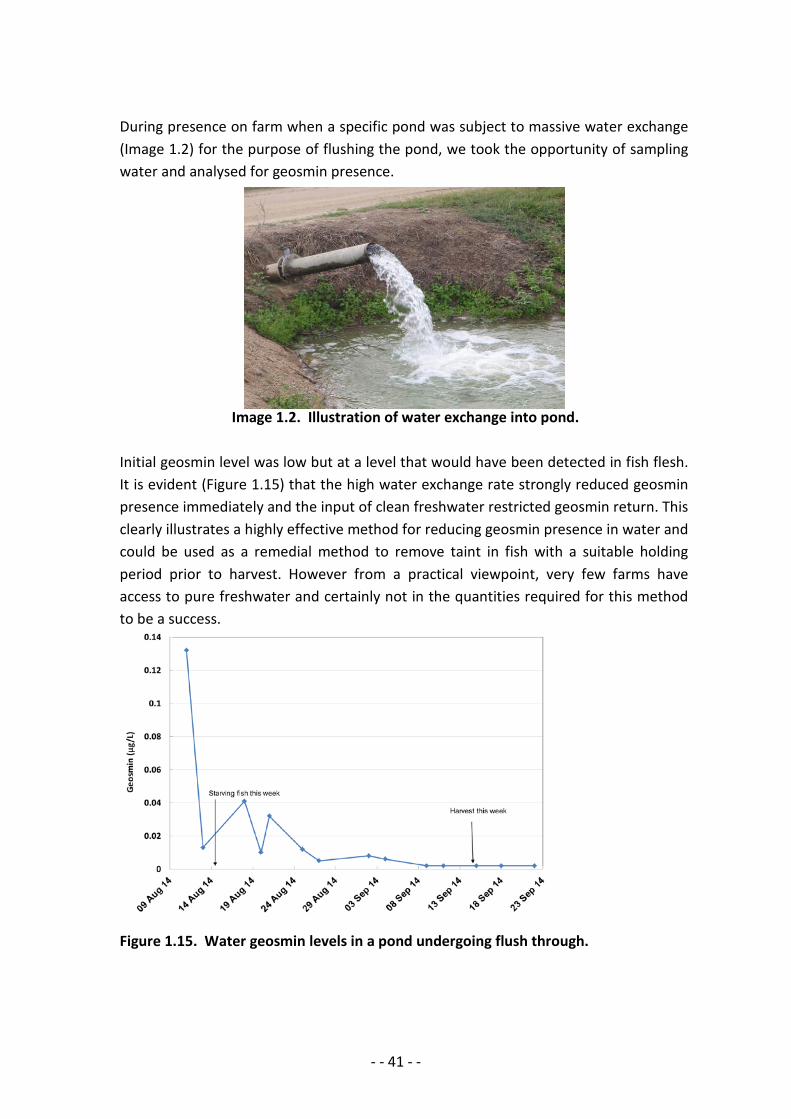
- - 41 - -
During presence on farm when a specific pond was subject to massive water exchange (Image 1.2) for the purpose of flushing the pond, we took the opportunity of sampling water and analysed for geosmin presence.
Image 1.2. Illustration of water exchange into pond. Initial geosmin level was low but at a level that would have been detected in fish flesh. It is evident (Figure 1.15) that the high water exchange rate strongly reduced geosmin presence immediately and the input of clean freshwater restricted geosmin return. This clearly illustrates a highly effective method for reducing geosmin presence in water and could be used as a remedial method to remove taint in fish with a suitable holding period prior to harvest. However from a practical viewpoint, very few farms have access to pure freshwater and certainly not in the quantities required for this method to be a success.
Figure 1.15. Water geosmin levels in a pond undergoing flush through.
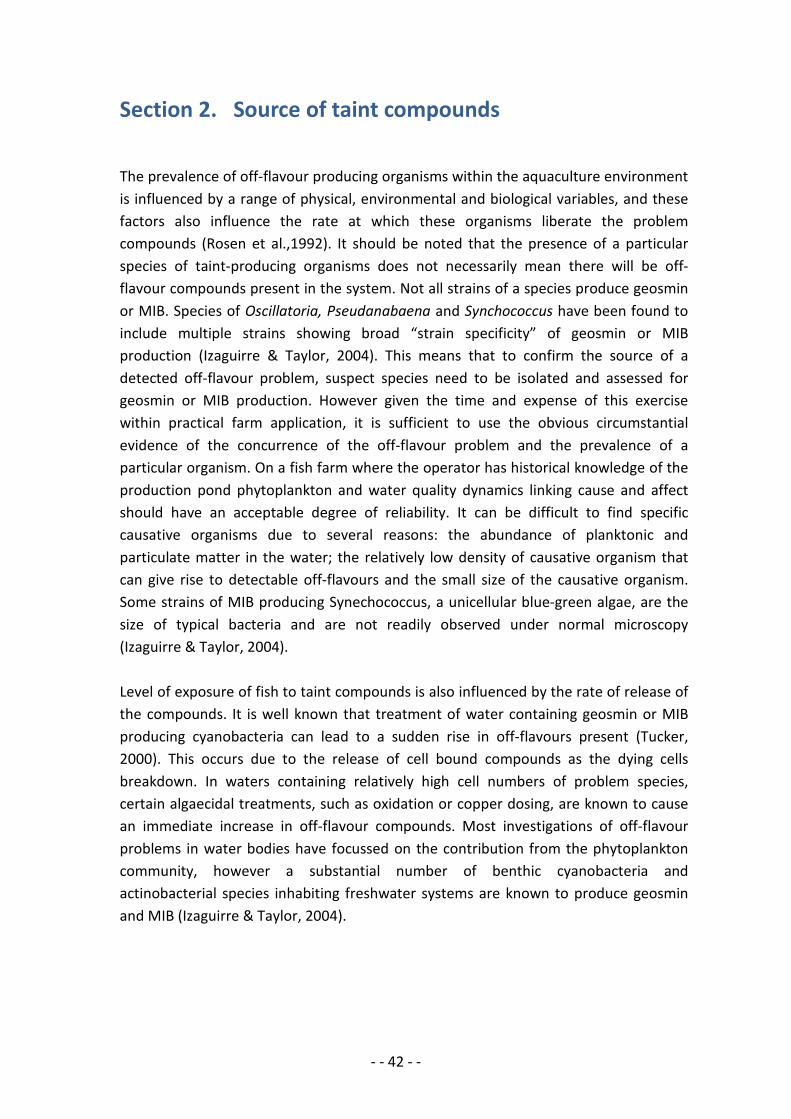
- - 42 - -
Section 2. Source of taint compounds The prevalence of off-flavour producing organisms within the aquaculture environment is influenced by a range of physical, environmental and biological variables, and these factors also influence the rate at which these organisms liberate the problem compounds (Rosen et al.,1992). It should be noted that the presence of a particular species of taint-producing organisms does not necessarily mean there will be off-flavour compounds present in the system. Not all strains of a species produce geosmin or MIB. Species of Oscillatoria, Pseudanabaena and Synchococcus have been found to include multiple strains showing broad “strain specificity” of geosmin or MIB production (Izaguirre & Taylor, 2004). This means that to confirm the source of a detected off-flavour problem, suspect species need to be isolated and assessed for geosmin or MIB production. However given the time and expense of this exercise within practical farm application, it is sufficient to use the obvious circumstantial evidence of the concurrence of the off-flavour problem and the prevalence of a particular organism. On a fish farm where the operator has historical knowledge of the production pond phytoplankton and water quality dynamics linking cause and affect should have an acceptable degree of reliability. It can be difficult to find specific causative organisms due to several reasons: the abundance of planktonic and particulate matter in the water; the relatively low density of causative organism that can give rise to detectable off-flavours and the small size of the causative organism. Some strains of MIB producing Synechococcus, a unicellular blue-green algae, are the size of typical bacteria and are not readily observed under normal microscopy (Izaguirre & Taylor, 2004). Level of exposure of fish to taint compounds is also influenced by the rate of release of the compounds. It is well known that treatment of water containing geosmin or MIB producing cyanobacteria can lead to a sudden rise in off-flavours present (Tucker, 2000). This occurs due to the release of cell bound compounds as the dying cells breakdown. In waters containing relatively high cell numbers of problem species, certain algaecidal treatments, such as oxidation or copper dosing, are known to cause an immediate increase in off-flavour compounds. Most investigations of off-flavour problems in water bodies have focussed on the contribution from the phytoplankton community, however a substantial number of benthic cyanobacteria and actinobacterial species inhabiting freshwater systems are known to produce geosmin and MIB (Izaguirre & Taylor, 2004).
- - 43 - -
The search for blue-green algae in NQ ponds In aquaculture systems most taste and odour problems are of biogenic origin and in aquaculture ponds, cyanobacteria, or blue-green algae, are the primary causative organism (Tucker, 2000; Jüttner, 1995; Howgate, 2004, Xu et al, 2010). Many studies have identified specific species associated with geosmin and MIB presence in both fish-culture water and fish flesh (Table 2.1, for references in Table see Review document: Appendix 3). It is commonly recognised that cyanobacterial bloom occurrence is the direct consequence of water eutrophication. Further, Reynolds and Peterson (2000) noted that occurrence of the blooms is usually caused by hydrophysical and specific weather conditions. Members of the cyanobacterial group are found in a wide diversity of terrestrial and aquatic environments as unicellular and colonial forms. Colonies range in size from microscopic to several centimetres and may be in the form of filaments, sheets or globules (Baker & Fabbro, 2002). A small number of forms are capable of restricted movement but are not highly motile. Some aquatic cyanobacteria form gas vesicles that enable them to float and can form dense rafts at the surface of still waters. The common name used to refer to cyanobacteria, blue-green algae, refers to the two dominant photosynthetic pigments, chlorophyll (green) and phycocyanin (blue), though the colour of a bloom can vary considerably.
Cyanobacteria are ubiquitous and are generally well suited to aquaculture pond conditions. In catfish ponds in the United States, the phytoplankton community is dominated by cyanobacteria for most of the year and during the warmer months can make up over 75% of the phytoplankton (Tucker & Van der Ploeg, 1993; Schrader & Dennis, 2005). There are around 50 cyanobacteria species known to produce geosmin or MIB (Smith et al., 2008 ; Juttner & Watson, 2007). Most cyanobacteria produce either geosmin or MIB, with comparatively few (12-14%) that produce both compounds (Smith et al., 2008; Tucker, 2000; Izaguirre & Taylor, 2004; Juttner & Watson, 2007). Three genera of cyanobacteria are considered to be the most common cause of off-flavour problems in freshwater fish ponds; Anabaena, Aphanizomenon and Oscillatoria (Image 2.1).
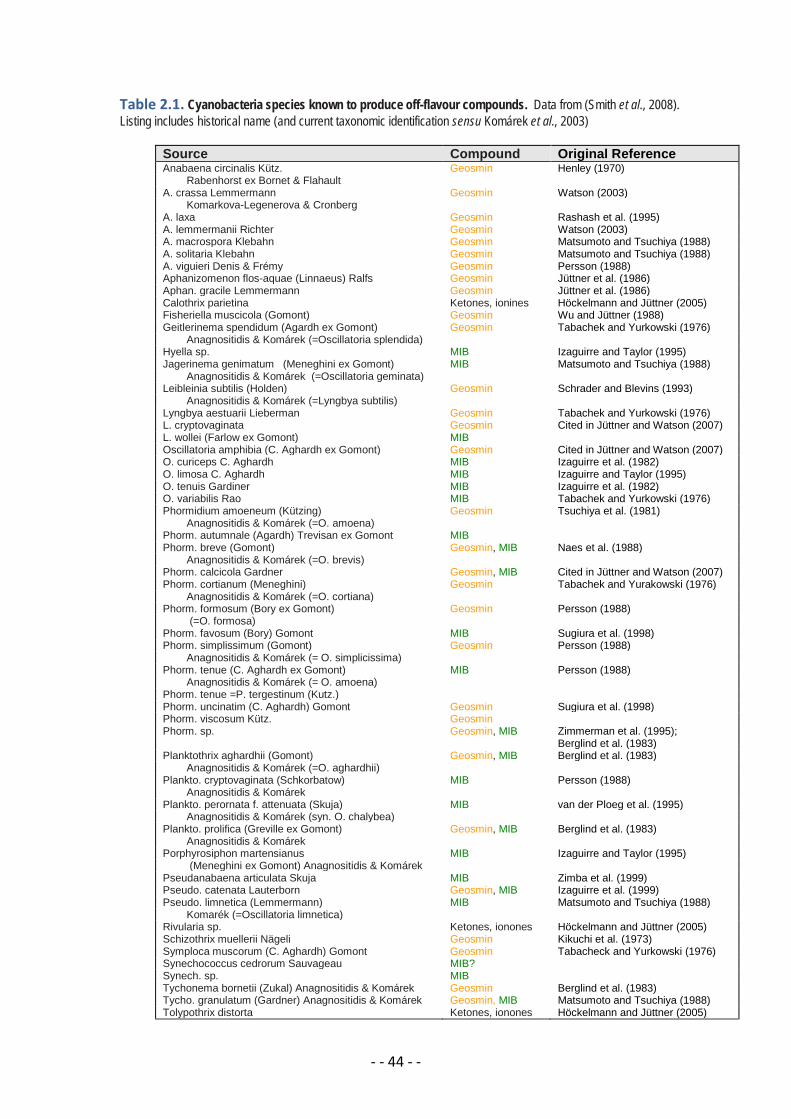
- - 44 - -
Table 2.1. Cyanobacteria species known to produce off-flavour compounds. Data from (Smith et al., 2008). Listing includes historical name (and current taxonomic identification sensu Komárek et al., 2003)
Source Compound Original Reference Anabaena circinalis Kütz. Geosmin Henley (1970) Rabenhorst ex Bornet & Flahault A. crassa Lemmermann Geosmin Watson (2003) Komarkova-Legenerova & Cronberg A. laxa Geosmin Rashash et al. (1995) A. lemmermanii Richter Geosmin Watson (2003) A. macrospora Klebahn Geosmin Matsumoto and Tsuchiya (1988) A. solitaria Klebahn Geosmin Matsumoto and Tsuchiya (1988) A. viguieri Denis & Frémy Geosmin Persson (1988) Aphanizomenon flos-aquae (Linnaeus) Ralfs Geosmin Jüttner et al. (1986) Aphan. gracile Lemmermann Geosmin Jüttner et al. (1986) Calothrix parietina Ketones, ionines Höckelmann and Jüttner (2005) Fisheriella muscicola (Gomont) Geosmin Wu and Jüttner (1988) Geitlerinema spendidum (Agardh ex Gomont) Geosmin Tabachek and Yurkowski (1976) Anagnositidis & Komárek (=Oscillatoria splendida) Hyella sp. MIB Izaguirre and Taylor (1995) Jagerinema genimatum (Meneghini ex Gomont) MIB Matsumoto and Tsuchiya (1988) Anagnositidis & Komárek (=Oscillatoria geminata) Leibleinia subtilis (Holden) Geosmin Schrader and Blevins (1993) Anagnositidis & Komárek (=Lyngbya subtilis) Lyngbya aestuarii Lieberman Geosmin Tabachek and Yurkowski (1976) L. cryptovaginata Geosmin Cited in Jüttner and Watson (2007) L. wollei (Farlow ex Gomont) MIB Oscillatoria amphibia (C. Aghardh ex Gomont) Geosmin Cited in Jüttner and Watson (2007) O. curiceps C. Aghardh MIB Izaguirre et al. (1982) O. limosa C. Aghardh MIB Izaguirre and Taylor (1995) O. tenuis Gardiner MIB Izaguirre et al. (1982) O. variabilis Rao MIB Tabachek and Yurkowski (1976) Phormidium amoeneum (Kützing) Geosmin Tsuchiya et al. (1981) Anagnositidis & Komárek (=O. amoena) Phorm. autumnale (Agardh) Trevisan ex Gomont MIB Phorm. breve (Gomont) Geosmin, MIB Naes et al. (1988) Anagnositidis & Komárek (=O. brevis) Phorm. calcicola Gardner Geosmin, MIB Cited in Jüttner and Watson (2007) Phorm. cortianum (Meneghini) Geosmin Tabachek and Yurakowski (1976) Anagnositidis & Komárek (=O. cortiana) Phorm. formosum (Bory ex Gomont) Geosmin Persson (1988) (=O. formosa) Phorm. favosum (Bory) Gomont MIB Sugiura et al. (1998) Phorm. simplissimum (Gomont) Geosmin Persson (1988) Anagnositidis & Komárek (= O. simplicissima) Phorm. tenue (C. Aghardh ex Gomont) MIB Persson (1988) Anagnositidis & Komárek (= O. amoena) Phorm. tenue =P. tergestinum (Kutz.) Phorm. uncinatim (C. Aghardh) Gomont Geosmin Sugiura et al. (1998) Phorm. viscosum Kütz. Geosmin Phorm. sp. Geosmin, MIB Zimmerman et al. (1995);
Berglind et al. (1983) Planktothrix aghardhii (Gomont) Geosmin, MIB Berglind et al. (1983) Anagnositidis & Komárek (=O. aghardhii) Plankto. cryptovaginata (Schkorbatow) MIB Persson (1988) Anagnositidis & Komárek Plankto. perornata f. attenuata (Skuja) MIB van der Ploeg et al. (1995) Anagnositidis & Komárek (syn. O. chalybea) Plankto. prolifica (Greville ex Gomont) Geosmin, MIB Berglind et al. (1983) Anagnositidis & Komárek Porphyrosiphon martensianus MIB Izaguirre and Taylor (1995) (Meneghini ex Gomont) Anagnositidis & Komárek Pseudanabaena articulata Skuja MIB Zimba et al. (1999) Pseudo. catenata Lauterborn Geosmin, MIB Izaguirre et al. (1999) Pseudo. limnetica (Lemmermann) MIB Matsumoto and Tsuchiya (1988) Komarék (=Oscillatoria limnetica) Rivularia sp. Ketones, ionones Höckelmann and Jüttner (2005) Schizothrix muellerii Nägeli Geosmin Kikuchi et al. (1973) Symploca muscorum (C. Aghardh) Gomont Geosmin Tabacheck and Yurkowski (1976) Synechococcus cedrorum Sauvageau MIB? Synech. sp. MIB Tychonema bornetii (Zukal) Anagnositidis & Komárek Geosmin Berglind et al. (1983) Tycho. granulatum (Gardner) Anagnositidis & Komárek Geosmin, MIB Matsumoto and Tsuchiya (1988) Tolypothrix distorta Ketones, ionones Höckelmann and Jüttner (2005)
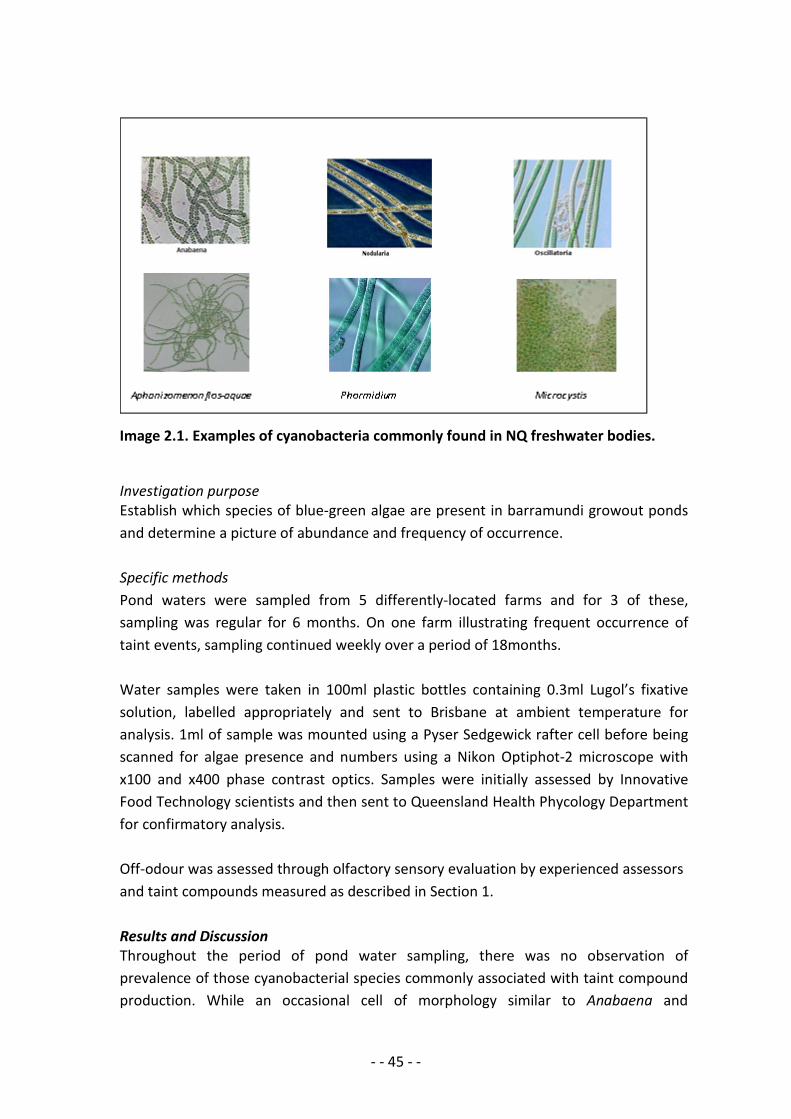
- - 45 - -
Image 2.1. Examples of cyanobacteria commonly found in NQ freshwater bodies.
Investigation purpose Establish which species of blue-green algae are present in barramundi growout ponds and determine a picture of abundance and frequency of occurrence. Specific methods Pond waters were sampled from 5 differently-located farms and for 3 of these, sampling was regular for 6 months. On one farm illustrating frequent occurrence of taint events, sampling continued weekly over a period of 18months. Water samples were taken in 100ml plastic bottles containing 0.3ml Lugol’s fixative solution, labelled appropriately and sent to Brisbane at ambient temperature for analysis. 1ml of sample was mounted using a Pyser Sedgewick rafter cell before being scanned for algae presence and numbers using a Nikon Optiphot-2 microscope with x100 and x400 phase contrast optics. Samples were initially assessed by Innovative Food Technology scientists and then sent to Queensland Health Phycology Department for confirmatory analysis. Off-odour was assessed through olfactory sensory evaluation by experienced assessors and taint compounds measured as described in Section 1. Results and Discussion Throughout the period of pond water sampling, there was no observation of prevalence of those cyanobacterial species commonly associated with taint compound production. While an occasional cell of morphology similar to Anabaena and
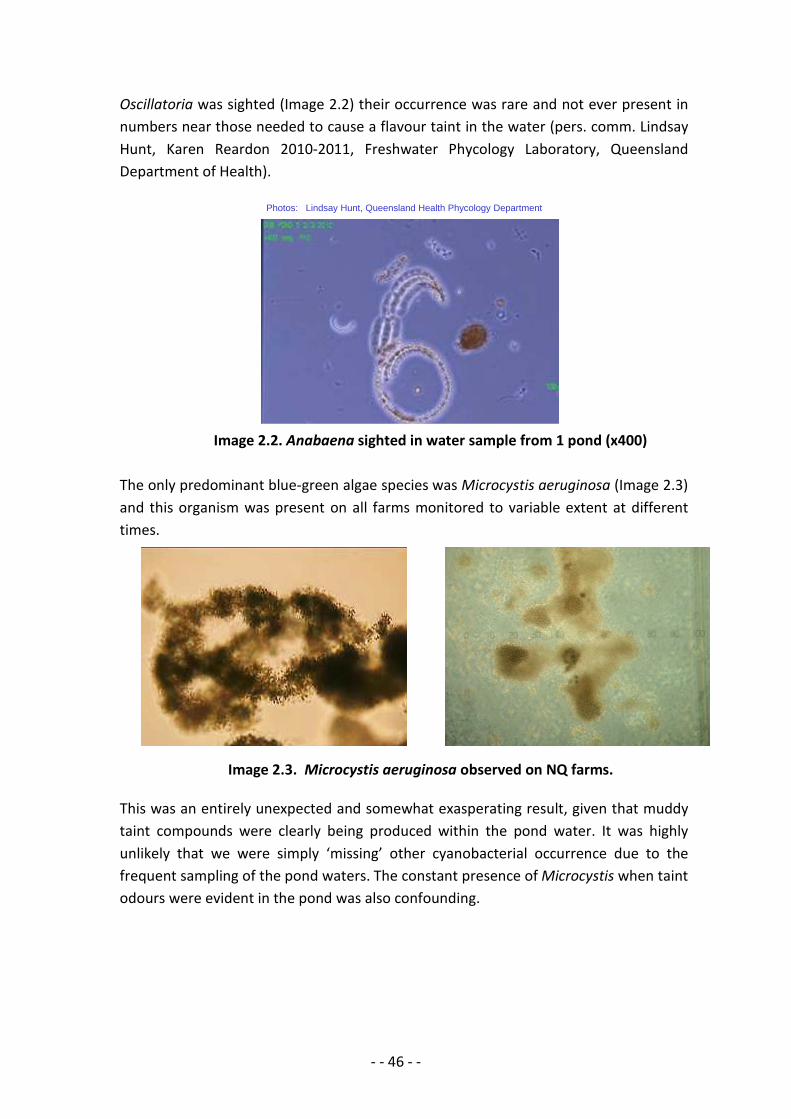
- - 46 - -
Oscillatoria was sighted (Image 2.2) their occurrence was rare and not ever present in numbers near those needed to cause a flavour taint in the water (pers. comm. Lindsay Hunt, Karen Reardon 2010-2011, Freshwater Phycology Laboratory, Queensland Department of Health). Image 2.2. Anabaena sighted in water sample from 1 pond (x400) The only predominant blue-green algae species was Microcystis aeruginosa (Image 2.3) and this organism was present on all farms monitored to variable extent at different times. Image 2.3. Microcystis aeruginosa observed on NQ farms. This was an entirely unexpected and somewhat exasperating result, given that muddy taint compounds were clearly being produced within the pond water. It was highly unlikely that we were simply ‘missing’ other cyanobacterial occurrence due to the frequent sampling of the pond waters. The constant presence of Microcystis when taint odours were evident in the pond was also confounding.
Photos: Lindsay Hunt, Queensland Health Phycology Department
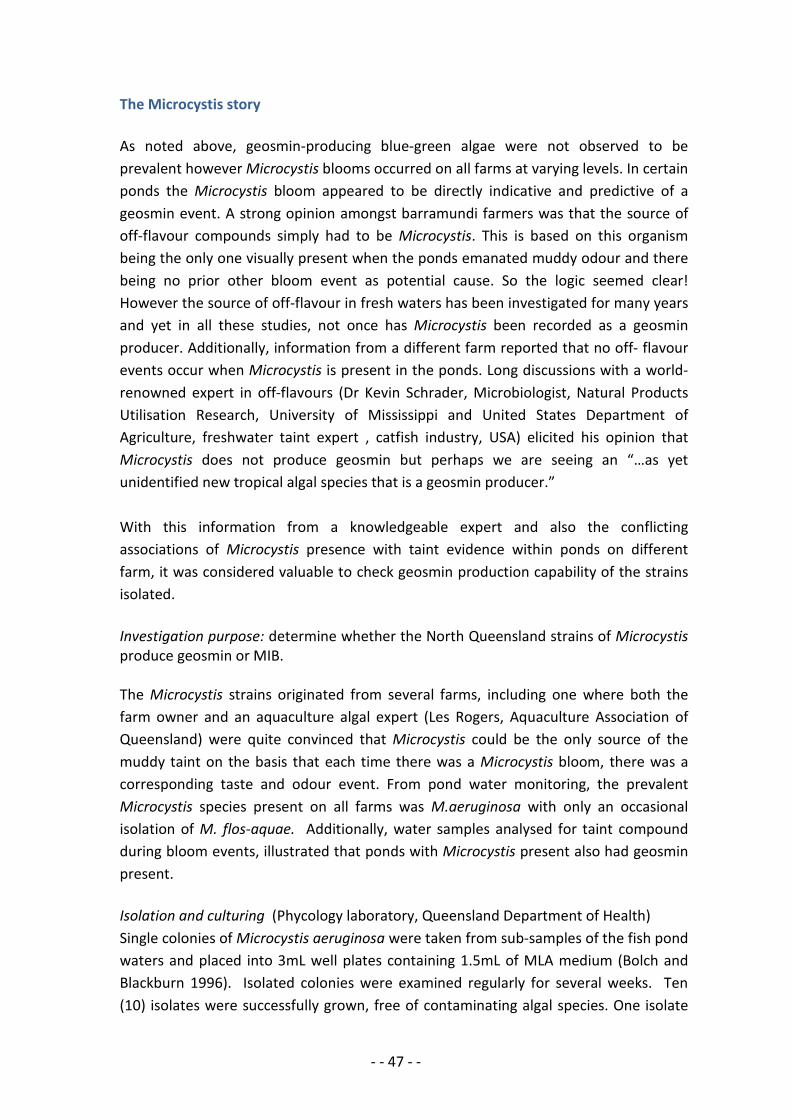
- - 47 - -
The Microcystis story As noted above, geosmin-producing blue-green algae were not observed to be prevalent however Microcystis blooms occurred on all farms at varying levels. In certain ponds the Microcystis bloom appeared to be directly indicative and predictive of a geosmin event. A strong opinion amongst barramundi farmers was that the source of off-flavour compounds simply had to be Microcystis. This is based on this organism being the only one visually present when the ponds emanated muddy odour and there being no prior other bloom event as potential cause. So the logic seemed clear! However the source of off-flavour in fresh waters has been investigated for many years and yet in all these studies, not once has Microcystis been recorded as a geosmin producer. Additionally, information from a different farm reported that no off- flavour events occur when Microcystis is present in the ponds. Long discussions with a world-renowned expert in off-flavours (Dr Kevin Schrader, Microbiologist, Natural Products Utilisation Research, University of Mississippi and United States Department of Agriculture, freshwater taint expert , catfish industry, USA) elicited his opinion that Microcystis does not produce geosmin but perhaps we are seeing an “…as yet unidentified new tropical algal species that is a geosmin producer.” With this information from a knowledgeable expert and also the conflicting associations of Microcystis presence with taint evidence within ponds on different farm, it was considered valuable to check geosmin production capability of the strains isolated. Investigation purpose: determine whether the North Queensland strains of Microcystis produce geosmin or MIB. The Microcystis strains originated from several farms, including one where both the farm owner and an aquaculture algal expert (Les Rogers, Aquaculture Association of Queensland) were quite convinced that Microcystis could be the only source of the muddy taint on the basis that each time there was a Microcystis bloom, there was a corresponding taste and odour event. From pond water monitoring, the prevalent Microcystis species present on all farms was M.aeruginosa with only an occasional isolation of M. flos-aquae. Additionally, water samples analysed for taint compound during bloom events, illustrated that ponds with Microcystis present also had geosmin present. Isolation and culturing (Phycology laboratory, Queensland Department of Health) Single colonies of Microcystis aeruginosa were taken from sub-samples of the fish pond waters and placed into 3mL well plates containing 1.5mL of MLA medium (Bolch and Blackburn 1996). Isolated colonies were examined regularly for several weeks. Ten (10) isolates were successfully grown, free of contaminating algal species. One isolate
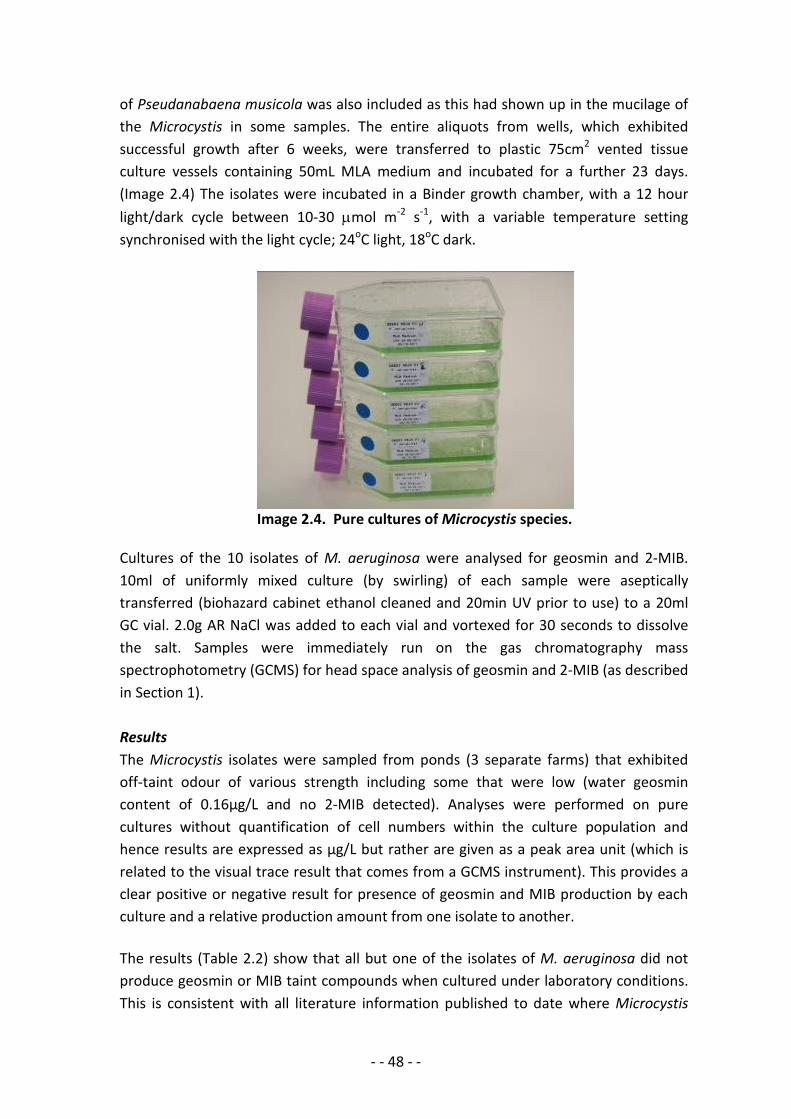
- - 48 - -
of Pseudanabaena musicola was also included as this had shown up in the mucilage of the Microcystis in some samples. The entire aliquots from wells, which exhibited successful growth after 6 weeks, were transferred to plastic 75cm2 vented tissue culture vessels containing 50mL MLA medium and incubated for a further 23 days. (Image 2.4) The isolates were incubated in a Binder growth chamber, with a 12 hour light/dark cycle between 10-30 µmol m-2 s-1, with a variable temperature setting synchronised with the light cycle; 24oC light, 18oC dark.
Image 2.4. Pure cultures of Microcystis species. Cultures of the 10 isolates of M. aeruginosa were analysed for geosmin and 2-MIB. 10ml of uniformly mixed culture (by swirling) of each sample were aseptically transferred (biohazard cabinet ethanol cleaned and 20min UV prior to use) to a 20ml GC vial. 2.0g AR NaCl was added to each vial and vortexed for 30 seconds to dissolve the salt. Samples were immediately run on the gas chromatography mass spectrophotometry (GCMS) for head space analysis of geosmin and 2-MIB (as described in Section 1). Results The Microcystis isolates were sampled from ponds (3 separate farms) that exhibited off-taint odour of various strength including some that were low (water geosmin content of 0.16µg/L and no 2-MIB detected). Analyses were performed on pure cultures without quantification of cell numbers within the culture population and hence results are expressed as µg/L but rather are given as a peak area unit (which is related to the visual trace result that comes from a GCMS instrument). This provides a clear positive or negative result for presence of geosmin and MIB production by each culture and a relative production amount from one isolate to another. The results (Table 2.2) show that all but one of the isolates of M. aeruginosa did not produce geosmin or MIB taint compounds when cultured under laboratory conditions. This is consistent with all literature information published to date where Microcystis
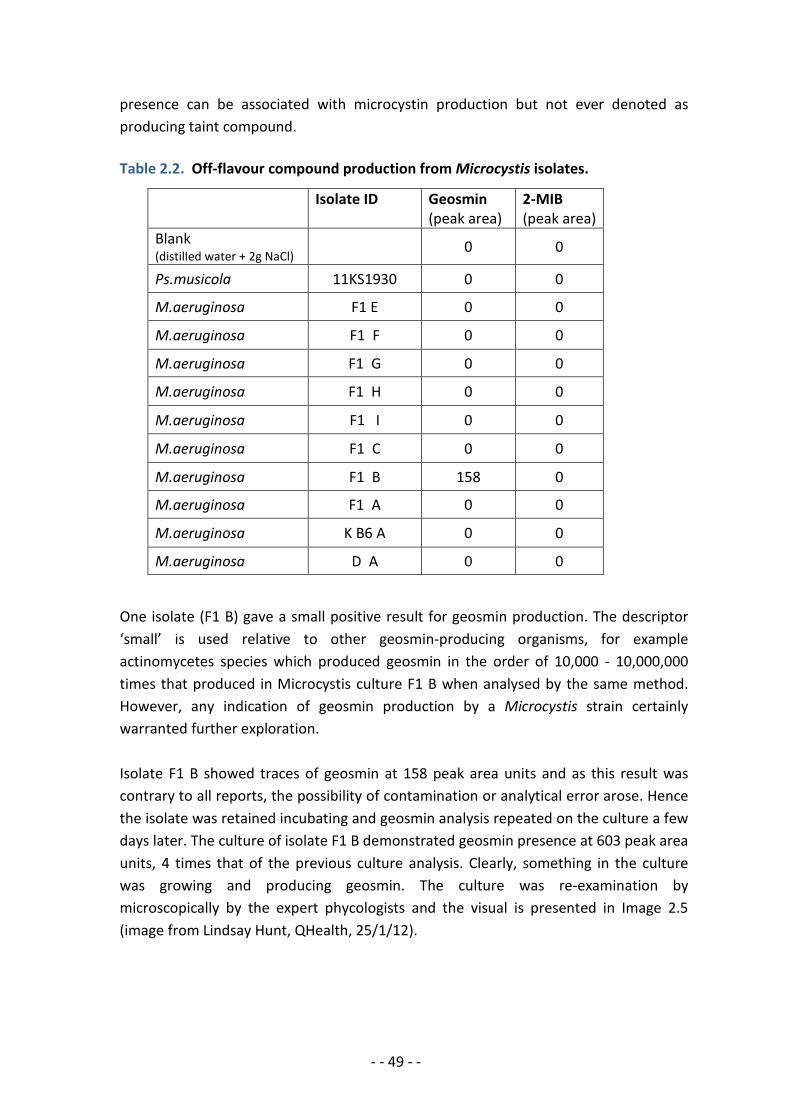
- - 49 - -
presence can be associated with microcystin production but not ever denoted as producing taint compound. Table 2.2. Off-flavour compound production from Microcystis isolates.
One isolate (F1 B) gave a small positive result for geosmin production. The descriptor ‘small’ is used relative to other geosmin-producing organisms, for example actinomycetes species which produced geosmin in the order of 10,000 - 10,000,000 times that produced in Microcystis culture F1 B when analysed by the same method. However, any indication of geosmin production by a Microcystis strain certainly warranted further exploration. Isolate F1 B showed traces of geosmin at 158 peak area units and as this result was contrary to all reports, the possibility of contamination or analytical error arose. Hence the isolate was retained incubating and geosmin analysis repeated on the culture a few days later. The culture of isolate F1 B demonstrated geosmin presence at 603 peak area units, 4 times that of the previous culture analysis. Clearly, something in the culture was growing and producing geosmin. The culture was re-examination by microscopically by the expert phycologists and the visual is presented in Image 2.5 (image from Lindsay Hunt, QHealth, 25/1/12).
Isolate ID Geosmin
(peak area) 2-MIB (peak area)
Blank (distilled water + 2g NaCl)
0 0
Ps.musicola 11KS1930 0 0
M.aeruginosa F1 E 0 0
M.aeruginosa F1 F 0 0
M.aeruginosa F1 G 0 0
M.aeruginosa F1 H 0 0
M.aeruginosa F1 I 0 0
M.aeruginosa F1 C 0 0
M.aeruginosa F1 B 158 0
M.aeruginosa F1 A 0 0
M.aeruginosa K B6 A 0 0
M.aeruginosa D A 0 0
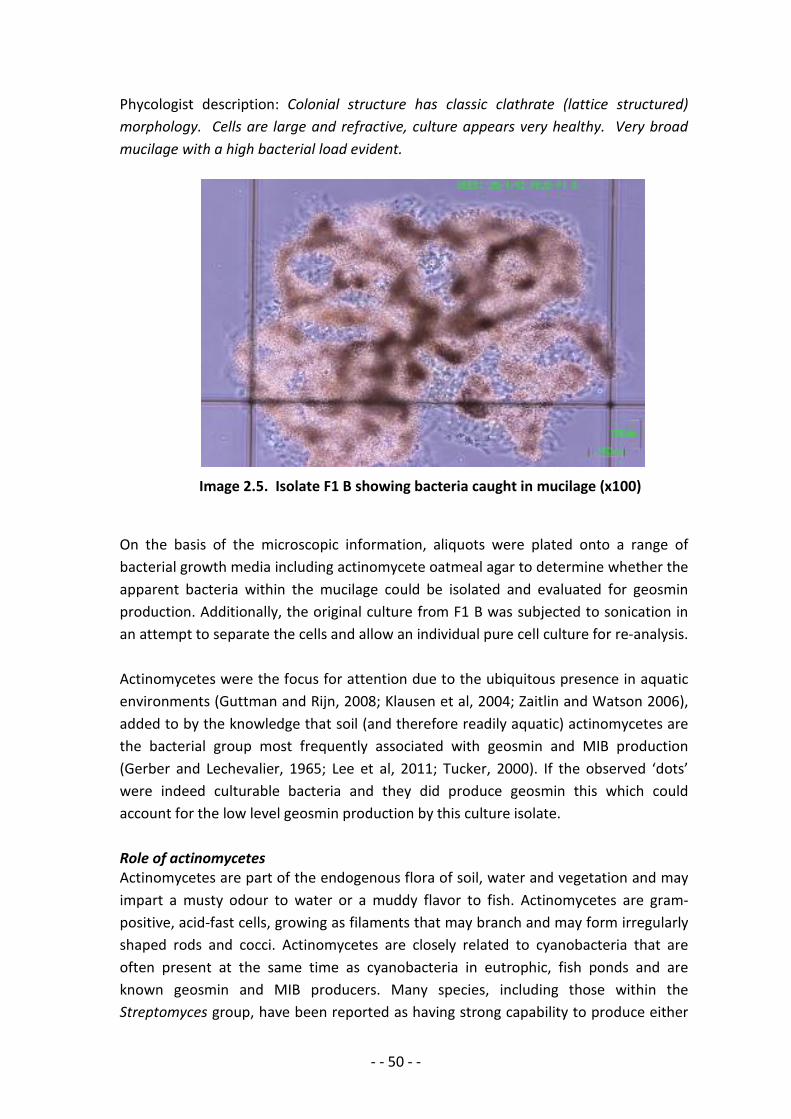
- - 50 - -
Phycologist description: Colonial structure has classic clathrate (lattice structured) morphology. Cells are large and refractive, culture appears very healthy. Very broad mucilage with a high bacterial load evident. Image 2.5. Isolate F1 B showing bacteria caught in mucilage (x100) On the basis of the microscopic information, aliquots were plated onto a range of bacterial growth media including actinomycete oatmeal agar to determine whether the apparent bacteria within the mucilage could be isolated and evaluated for geosmin production. Additionally, the original culture from F1 B was subjected to sonication in an attempt to separate the cells and allow an individual pure cell culture for re-analysis. Actinomycetes were the focus for attention due to the ubiquitous presence in aquatic environments (Guttman and Rijn, 2008; Klausen et al, 2004; Zaitlin and Watson 2006), added to by the knowledge that soil (and therefore readily aquatic) actinomycetes are the bacterial group most frequently associated with geosmin and MIB production (Gerber and Lechevalier, 1965; Lee et al, 2011; Tucker, 2000). If the observed ‘dots’ were indeed culturable bacteria and they did produce geosmin this which could account for the low level geosmin production by this culture isolate. Role of actinomycetes Actinomycetes are part of the endogenous flora of soil, water and vegetation and may impart a musty odour to water or a muddy flavor to fish. Actinomycetes are gram-positive, acid-fast cells, growing as filaments that may branch and may form irregularly shaped rods and cocci. Actinomycetes are closely related to cyanobacteria that are often present at the same time as cyanobacteria in eutrophic, fish ponds and are known geosmin and MIB producers. Many species, including those within the Streptomyces group, have been reported as having strong capability to produce either
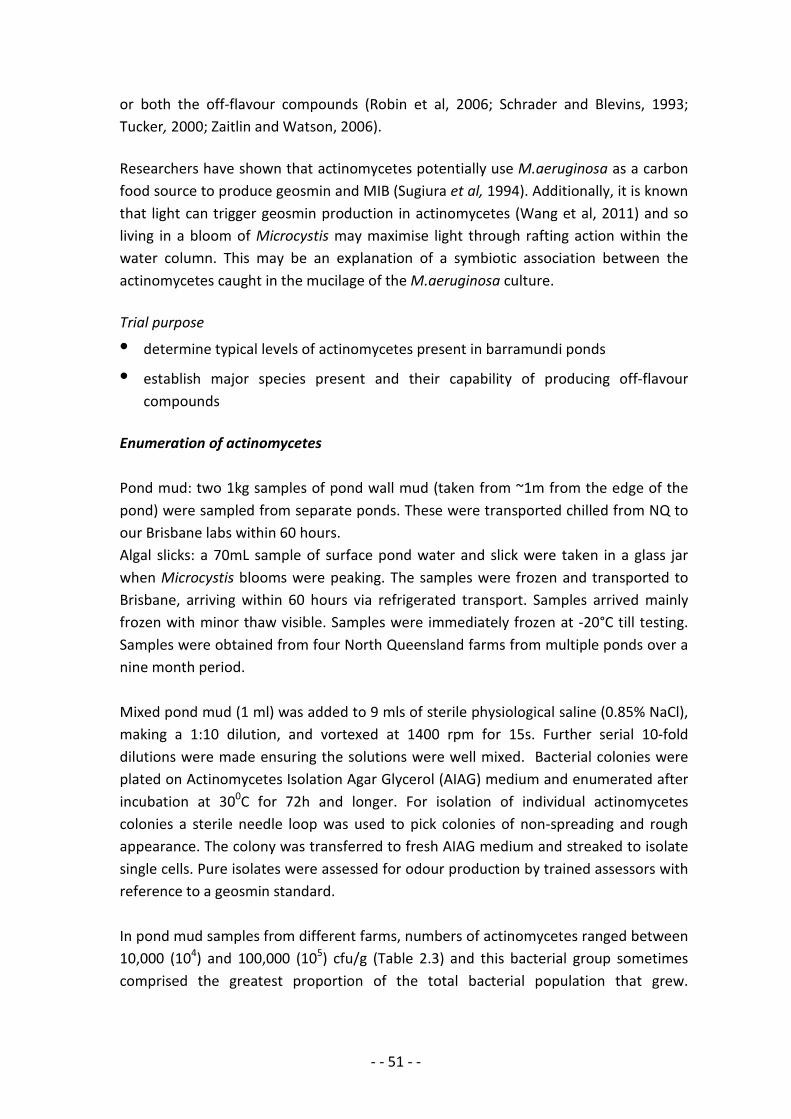
- - 51 - -
or both the off-flavour compounds (Robin et al, 2006; Schrader and Blevins, 1993; Tucker, 2000; Zaitlin and Watson, 2006). Researchers have shown that actinomycetes potentially use M.aeruginosa as a carbon food source to produce geosmin and MIB (Sugiura et al, 1994). Additionally, it is known that light can trigger geosmin production in actinomycetes (Wang et al, 2011) and so living in a bloom of Microcystis may maximise light through rafting action within the water column. This may be an explanation of a symbiotic association between the actinomycetes caught in the mucilage of the M.aeruginosa culture. Trial purpose
• determine typical levels of actinomycetes present in barramundi ponds
• establish major species present and their capability of producing off-flavour compounds
Enumeration of actinomycetes Pond mud: two 1kg samples of pond wall mud (taken from ~1m from the edge of the pond) were sampled from separate ponds. These were transported chilled from NQ to our Brisbane labs within 60 hours. Algal slicks: a 70mL sample of surface pond water and slick were taken in a glass jar when Microcystis blooms were peaking. The samples were frozen and transported to Brisbane, arriving within 60 hours via refrigerated transport. Samples arrived mainly frozen with minor thaw visible. Samples were immediately frozen at -20°C till testing. Samples were obtained from four North Queensland farms from multiple ponds over a nine month period. Mixed pond mud (1 ml) was added to 9 mls of sterile physiological saline (0.85% NaCl), making a 1:10 dilution, and vortexed at 1400 rpm for 15s. Further serial 10-fold dilutions were made ensuring the solutions were well mixed. Bacterial colonies were plated on Actinomycetes Isolation Agar Glycerol (AIAG) medium and enumerated after incubation at 300C for 72h and longer. For isolation of individual actinomycetes colonies a sterile needle loop was used to pick colonies of non-spreading and rough appearance. The colony was transferred to fresh AIAG medium and streaked to isolate single cells. Pure isolates were assessed for odour production by trained assessors with reference to a geosmin standard. In pond mud samples from different farms, numbers of actinomycetes ranged between 10,000 (104) and 100,000 (105) cfu/g (Table 2.3) and this bacterial group sometimes comprised the greatest proportion of the total bacterial population that grew.
- - 52 - -
However, the proportion of actinomycetes present was variable across ponds and sampling time. Table 2.3. Actinomycetes present in pond muds.
Variability within a pond is clearly evidenced by considering pond B1 sampled 26/11 and then again 12/12. While the total population of bacteria present was similar at both sampling times, the proportion of the population that belonged to the actinomycetes group was very different between the samples. This is an expected result as actinomycetes are ubiquitous in the environment and hence can ‘arrive’ and establish within a pond from many sources: rain; runoff water from soils; wind-borne. Many actinomycetes are of benefit within pond environments as they contribute to degrading detritus and so a have role in maintaining good water quality. Hence it was deemed inappropriate to undertake detailed identification of the actinomycetes. From multiple isolations, it was evident that a wide morphological range of actinomycetes were present in pond water and mud (Image 2.6).
Pond mud
sample
Growth on actinomycetes agar
Growth on tryptone yeast extract agar
Actinomycetes Count/g
Total Bacteria Count/g
% Actinomycetes
C2 11/10 2.3x10⁵ 4.9x10⁶ 5
F5 11/10 1.3x10⁵ 3.2x10⁶ 4
DRB 5 30/10 7.7x10⁴ 3.6x10⁵ 21
B1 26/11 5.1x10⁴ 1.1x10⁵ 46
B1 30/11 3.9x10⁵ 1.2x10⁶ 32
A4 30/11 5.1x10⁴ 6.4x10⁶ 1
E4 30/11 6.9 x10⁴ 6.8x10⁵ 10
D1 30/11 4.5x10⁴ 1.1x10⁷ 0.05
B1 12/12 8.5x10⁴ 1.1x10⁵ 1
A4 12/12 6.9x10⁴ 1.2x10⁶ 0.05
E4 12/12 5.0x10⁴ 6.4x10⁶ 0.01
D1 12/12 1.7x10⁵ 7.6x10⁵ 22
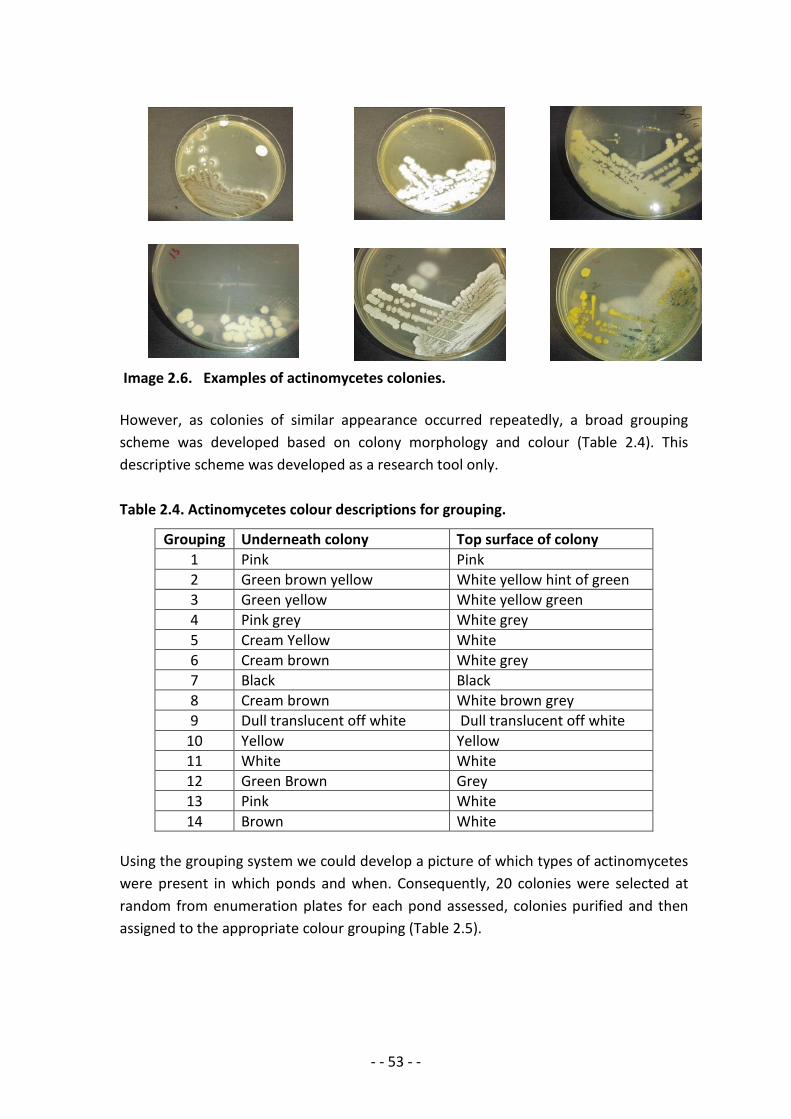
- - 53 - -
Image 2.6. Examples of actinomycetes colonies. However, as colonies of similar appearance occurred repeatedly, a broad grouping scheme was developed based on colony morphology and colour (Table 2.4). This descriptive scheme was developed as a research tool only. Table 2.4. Actinomycetes colour descriptions for grouping.
Grouping Underneath colony Top surface of colony 1 Pink Pink 2 Green brown yellow White yellow hint of green 3 Green yellow White yellow green 4 Pink grey White grey 5 Cream Yellow White 6 Cream brown White grey 7 Black Black 8 Cream brown White brown grey 9 Dull translucent off white Dull translucent off white
10 Yellow Yellow 11 White White 12 Green Brown Grey 13 Pink White 14 Brown White
Using the grouping system we could develop a picture of which types of actinomycetes were present in which ponds and when. Consequently, 20 colonies were selected at random from enumeration plates for each pond assessed, colonies purified and then assigned to the appropriate colour grouping (Table 2.5).
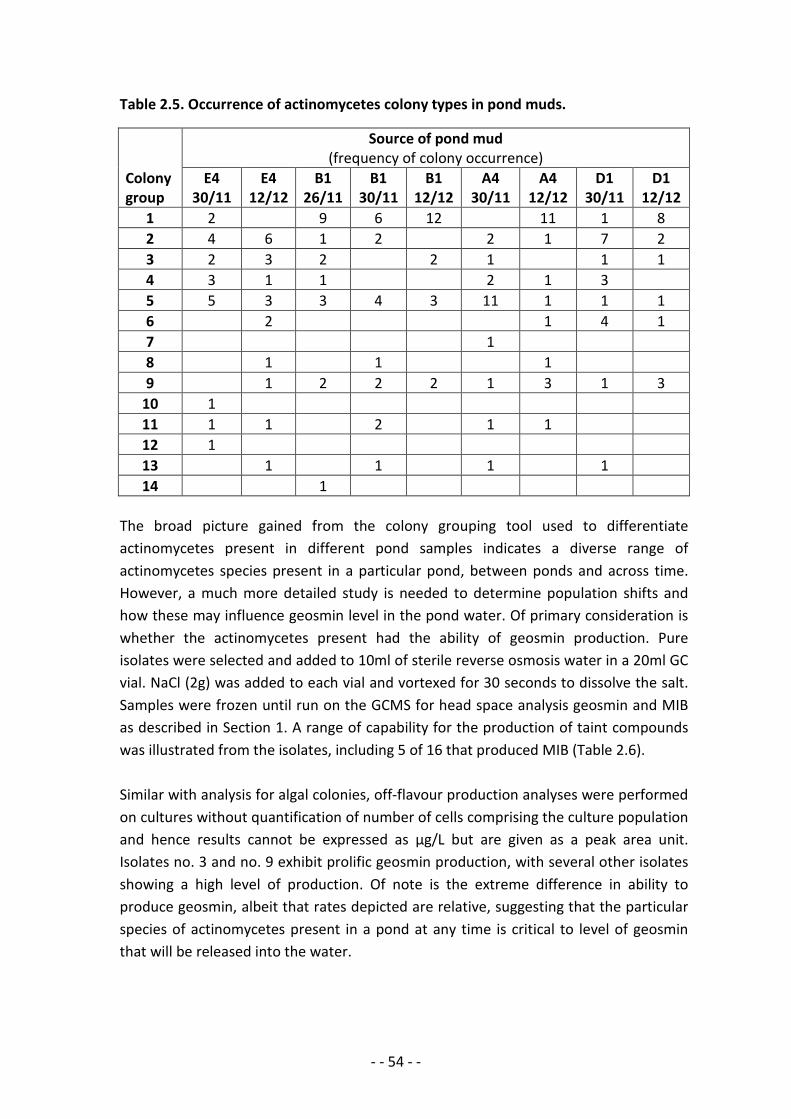
- - 54 - -
Table 2.5. Occurrence of actinomycetes colony types in pond muds.
Colony group
Source of pond mud (frequency of colony occurrence)
E4 30/11
E4 12/12
B1 26/11
B1 30/11
B1 12/12
A4 30/11
A4 12/12
D1 30/11
D1 12/12
1 2 9 6 12 11 1 8 2 4 6 1 2 2 1 7 2 3 2 3 2 2 1 1 1 4 3 1 1 2 1 3 5 5 3 3 4 3 11 1 1 1 6 2 1 4 1 7 1 8 1 1 1 9 1 2 2 2 1 3 1 3
10 1 11 1 1 2 1 1 12 1 13 1 1 1 1 14 1
The broad picture gained from the colony grouping tool used to differentiate actinomycetes present in different pond samples indicates a diverse range of actinomycetes species present in a particular pond, between ponds and across time. However, a much more detailed study is needed to determine population shifts and how these may influence geosmin level in the pond water. Of primary consideration is whether the actinomycetes present had the ability of geosmin production. Pure isolates were selected and added to 10ml of sterile reverse osmosis water in a 20ml GC vial. NaCl (2g) was added to each vial and vortexed for 30 seconds to dissolve the salt. Samples were frozen until run on the GCMS for head space analysis geosmin and MIB as described in Section 1. A range of capability for the production of taint compounds was illustrated from the isolates, including 5 of 16 that produced MIB (Table 2.6). Similar with analysis for algal colonies, off-flavour production analyses were performed on cultures without quantification of number of cells comprising the culture population and hence results cannot be expressed as µg/L but are given as a peak area unit. Isolates no. 3 and no. 9 exhibit prolific geosmin production, with several other isolates showing a high level of production. Of note is the extreme difference in ability to produce geosmin, albeit that rates depicted are relative, suggesting that the particular species of actinomycetes present in a pond at any time is critical to level of geosmin that will be released into the water.
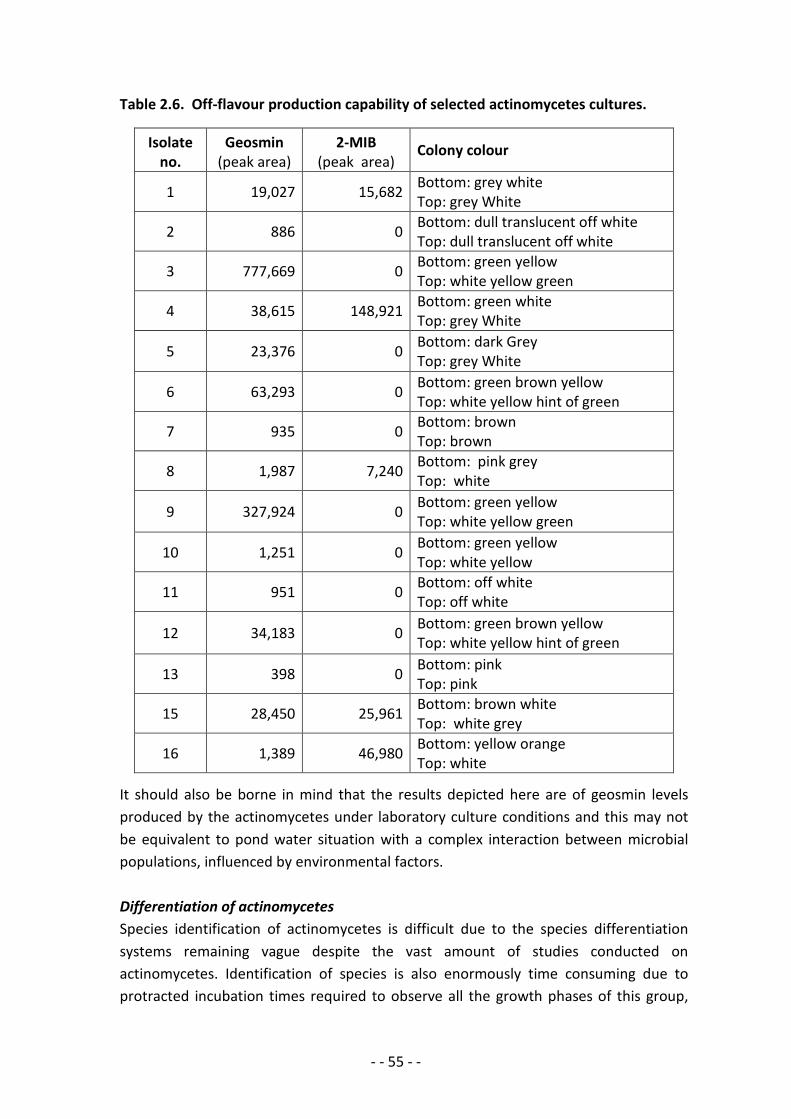
- - 55 - -
Table 2.6. Off-flavour production capability of selected actinomycetes cultures.
Isolate no.
Geosmin (peak area)
2-MIB (peak area)
Colony colour
1 19,027 15,682 Bottom: grey white Top: grey White
2 886 0 Bottom: dull translucent off white Top: dull translucent off white
3 777,669 0 Bottom: green yellow Top: white yellow green
4 38,615 148,921 Bottom: green white Top: grey White
5 23,376 0 Bottom: dark Grey Top: grey White
6 63,293 0 Bottom: green brown yellow Top: white yellow hint of green
7 935 0 Bottom: brown Top: brown
8 1,987 7,240 Bottom: pink grey Top: white
9 327,924 0 Bottom: green yellow Top: white yellow green
10 1,251 0 Bottom: green yellow Top: white yellow
11 951 0 Bottom: off white Top: off white
12 34,183 0 Bottom: green brown yellow Top: white yellow hint of green
13 398 0 Bottom: pink Top: pink
15 28,450 25,961 Bottom: brown white Top: white grey
16 1,389 46,980 Bottom: yellow orange Top: white
It should also be borne in mind that the results depicted here are of geosmin levels produced by the actinomycetes under laboratory culture conditions and this may not be equivalent to pond water situation with a complex interaction between microbial populations, influenced by environmental factors. Differentiation of actinomycetes Species identification of actinomycetes is difficult due to the species differentiation systems remaining vague despite the vast amount of studies conducted on actinomycetes. Identification of species is also enormously time consuming due to protracted incubation times required to observe all the growth phases of this group,
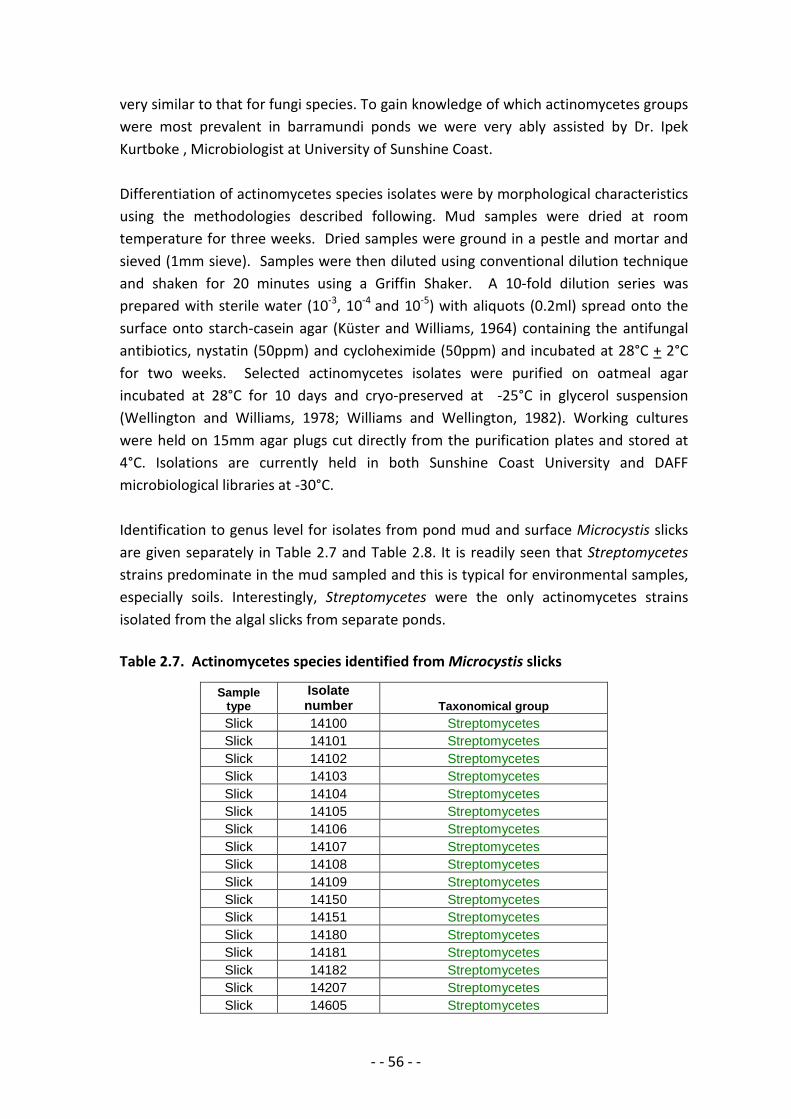
- - 56 - -
very similar to that for fungi species. To gain knowledge of which actinomycetes groups were most prevalent in barramundi ponds we were very ably assisted by Dr. Ipek Kurtboke , Microbiologist at University of Sunshine Coast. Differentiation of actinomycetes species isolates were by morphological characteristics using the methodologies described following. Mud samples were dried at room temperature for three weeks. Dried samples were ground in a pestle and mortar and sieved (1mm sieve). Samples were then diluted using conventional dilution technique and shaken for 20 minutes using a Griffin Shaker. A 10-fold dilution series was prepared with sterile water (10-3, 10-4 and 10-5) with aliquots (0.2ml) spread onto the surface onto starch-casein agar (Küster and Williams, 1964) containing the antifungal antibiotics, nystatin (50ppm) and cycloheximide (50ppm) and incubated at 28°C + 2°C for two weeks. Selected actinomycetes isolates were purified on oatmeal agar incubated at 28°C for 10 days and cryo-preserved at -25°C in glycerol suspension (Wellington and Williams, 1978; Williams and Wellington, 1982). Working cultures were held on 15mm agar plugs cut directly from the purification plates and stored at 4°C. Isolations are currently held in both Sunshine Coast University and DAFF microbiological libraries at -30°C. Identification to genus level for isolates from pond mud and surface Microcystis slicks are given separately in Table 2.7 and Table 2.8. It is readily seen that Streptomycetes strains predominate in the mud sampled and this is typical for environmental samples, especially soils. Interestingly, Streptomycetes were the only actinomycetes strains isolated from the algal slicks from separate ponds. Table 2.7. Actinomycetes species identified from Microcystis slicks
Sample type
Isolate number Taxonomical group
Slick 14100 Streptomycetes Slick 14101 Streptomycetes Slick 14102 Streptomycetes Slick 14103 Streptomycetes Slick 14104 Streptomycetes Slick 14105 Streptomycetes Slick 14106 Streptomycetes Slick 14107 Streptomycetes Slick 14108 Streptomycetes Slick 14109 Streptomycetes Slick 14150 Streptomycetes Slick 14151 Streptomycetes Slick 14180 Streptomycetes Slick 14181 Streptomycetes Slick 14182 Streptomycetes Slick 14207 Streptomycetes Slick 14605 Streptomycetes
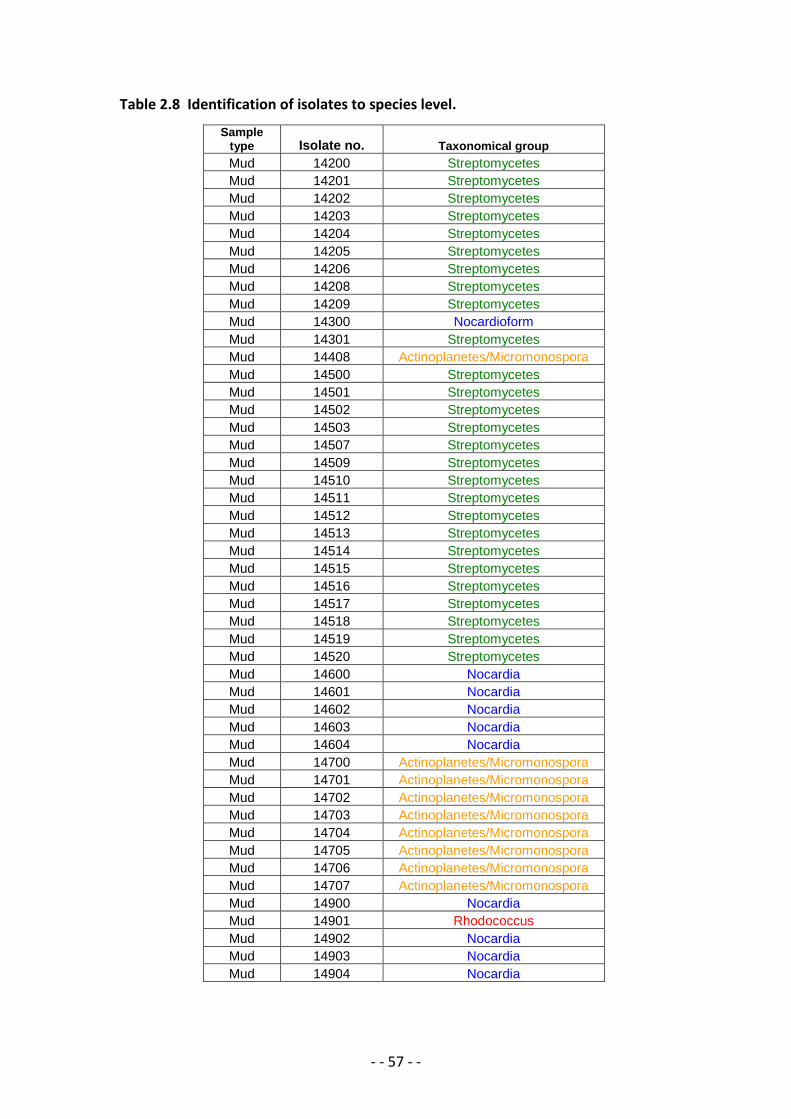
- - 57 - -
Table 2.8 Identification of isolates to species level.
Sample type Isolate no. Taxonomical group Mud 14200 Streptomycetes Mud 14201 Streptomycetes Mud 14202 Streptomycetes Mud 14203 Streptomycetes Mud 14204 Streptomycetes Mud 14205 Streptomycetes Mud 14206 Streptomycetes Mud 14208 Streptomycetes Mud 14209 Streptomycetes Mud 14300 Nocardioform Mud 14301 Streptomycetes Mud 14408 Actinoplanetes/Micromonospora Mud 14500 Streptomycetes Mud 14501 Streptomycetes Mud 14502 Streptomycetes Mud 14503 Streptomycetes Mud 14507 Streptomycetes Mud 14509 Streptomycetes Mud 14510 Streptomycetes Mud 14511 Streptomycetes Mud 14512 Streptomycetes Mud 14513 Streptomycetes Mud 14514 Streptomycetes Mud 14515 Streptomycetes Mud 14516 Streptomycetes Mud 14517 Streptomycetes Mud 14518 Streptomycetes Mud 14519 Streptomycetes Mud 14520 Streptomycetes Mud 14600 Nocardia Mud 14601 Nocardia Mud 14602 Nocardia Mud 14603 Nocardia Mud 14604 Nocardia Mud 14700 Actinoplanetes/Micromonospora Mud 14701 Actinoplanetes/Micromonospora Mud 14702 Actinoplanetes/Micromonospora Mud 14703 Actinoplanetes/Micromonospora Mud 14704 Actinoplanetes/Micromonospora Mud 14705 Actinoplanetes/Micromonospora Mud 14706 Actinoplanetes/Micromonospora Mud 14707 Actinoplanetes/Micromonospora Mud 14900 Nocardia Mud 14901 Rhodococcus Mud 14902 Nocardia Mud 14903 Nocardia Mud 14904 Nocardia
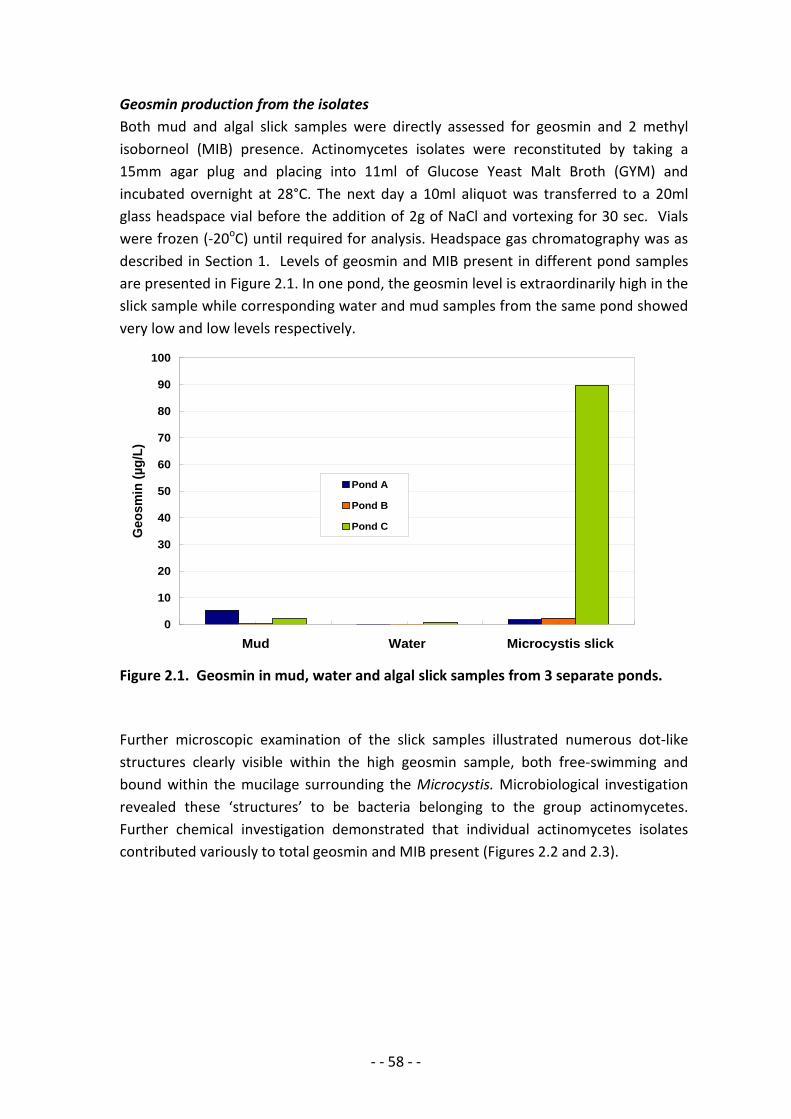
- - 58 - -
Geosmin production from the isolates Both mud and algal slick samples were directly assessed for geosmin and 2 methyl isoborneol (MIB) presence. Actinomycetes isolates were reconstituted by taking a 15mm agar plug and placing into 11ml of Glucose Yeast Malt Broth (GYM) and incubated overnight at 28°C. The next day a 10ml aliquot was transferred to a 20ml glass headspace vial before the addition of 2g of NaCl and vortexing for 30 sec. Vials were frozen (-20oC) until required for analysis. Headspace gas chromatography was as described in Section 1. Levels of geosmin and MIB present in different pond samples are presented in Figure 2.1. In one pond, the geosmin level is extraordinarily high in the slick sample while corresponding water and mud samples from the same pond showed very low and low levels respectively.
0
10
20
30
40
50
60
70
80
90
100
Mud Water Microcystis slick
Geo
smin
(µg/
L)
Pond A
Pond B
Pond C
Figure 2.1. Geosmin in mud, water and algal slick samples from 3 separate ponds. Further microscopic examination of the slick samples illustrated numerous dot-like structures clearly visible within the high geosmin sample, both free-swimming and bound within the mucilage surrounding the Microcystis. Microbiological investigation revealed these ‘structures’ to be bacteria belonging to the group actinomycetes. Further chemical investigation demonstrated that individual actinomycetes isolates contributed variously to total geosmin and MIB present (Figures 2.2 and 2.3).
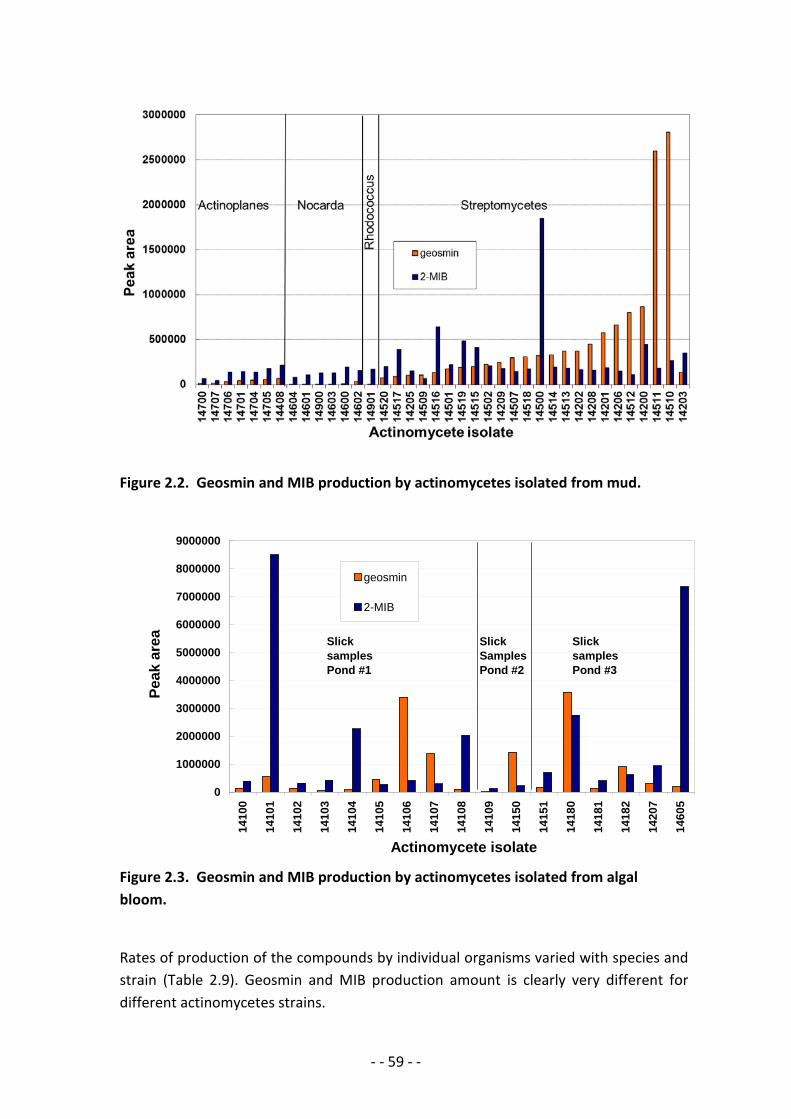
- - 59 - -
Figure 2.2. Geosmin and MIB production by actinomycetes isolated from mud.
0
1000000
2000000
3000000
4000000
5000000
6000000
7000000
8000000
9000000
1410
0
1410
1
1410
2
1410
3
1410
4
1410
5
1410
6
1410
7
1410
8
1410
9
1415
0
1415
1
1418
0
1418
1
1418
2
1420
7
1460
5
Actinomycete isolate
Peak
are
a
geosmin
2-MIB
Slick samples Pond #1
Slick SamplesPond #2
Slick samples Pond #3
Figure 2.3. Geosmin and MIB production by actinomycetes isolated from algal bloom.
Rates of production of the compounds by individual organisms varied with species and strain (Table 2.9). Geosmin and MIB production amount is clearly very different for different actinomycetes strains.
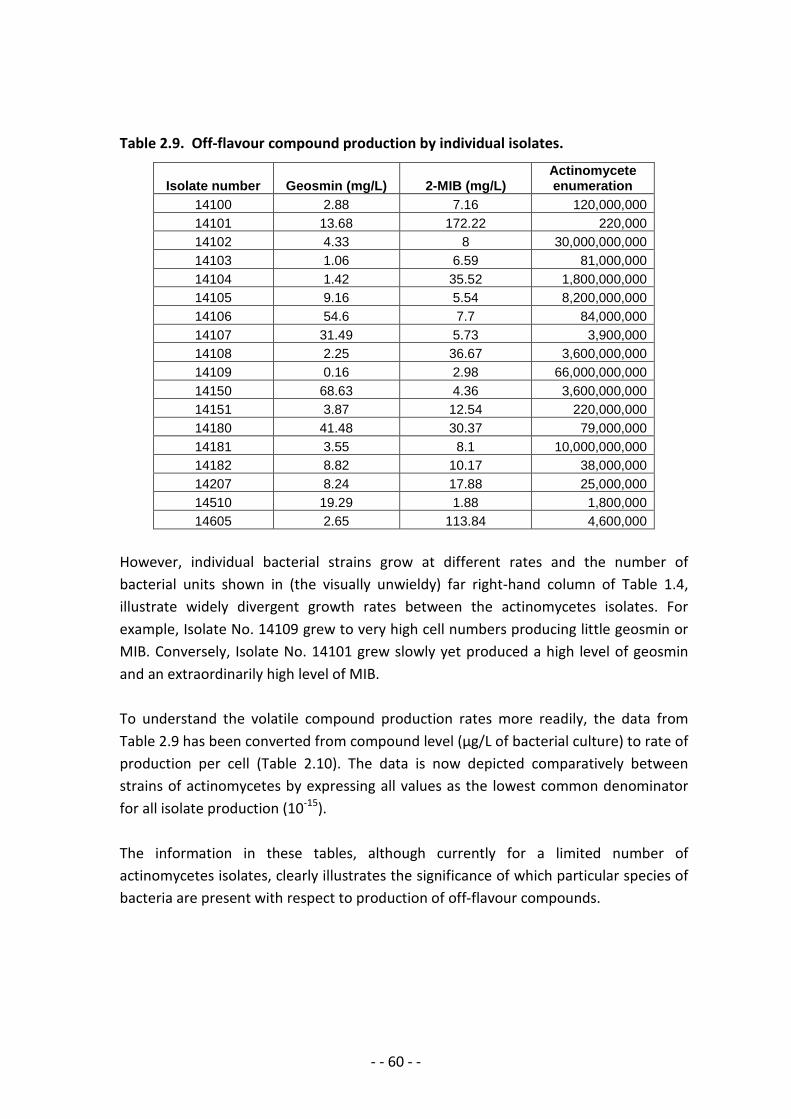
- - 60 - -
Table 2.9. Off-flavour compound production by individual isolates.
Isolate number Geosmin (mg/L) 2-MIB (mg/L) Actinomycete enumeration
14100 2.88 7.16 120,000,000 14101 13.68 172.22 220,000 14102 4.33 8 30,000,000,000 14103 1.06 6.59 81,000,000 14104 1.42 35.52 1,800,000,000 14105 9.16 5.54 8,200,000,000 14106 54.6 7.7 84,000,000 14107 31.49 5.73 3,900,000 14108 2.25 36.67 3,600,000,000 14109 0.16 2.98 66,000,000,000 14150 68.63 4.36 3,600,000,000 14151 3.87 12.54 220,000,000 14180 41.48 30.37 79,000,000 14181 3.55 8.1 10,000,000,000 14182 8.82 10.17 38,000,000 14207 8.24 17.88 25,000,000 14510 19.29 1.88 1,800,000 14605 2.65 113.84 4,600,000
However, individual bacterial strains grow at different rates and the number of bacterial units shown in (the visually unwieldy) far right-hand column of Table 1.4, illustrate widely divergent growth rates between the actinomycetes isolates. For example, Isolate No. 14109 grew to very high cell numbers producing little geosmin or MIB. Conversely, Isolate No. 14101 grew slowly yet produced a high level of geosmin and an extraordinarily high level of MIB. To understand the volatile compound production rates more readily, the data from Table 2.9 has been converted from compound level (µg/L of bacterial culture) to rate of production per cell (Table 2.10). The data is now depicted comparatively between strains of actinomycetes by expressing all values as the lowest common denominator for all isolate production (10-15). The information in these tables, although currently for a limited number of actinomycetes isolates, clearly illustrates the significance of which particular species of bacteria are present with respect to production of off-flavour compounds.
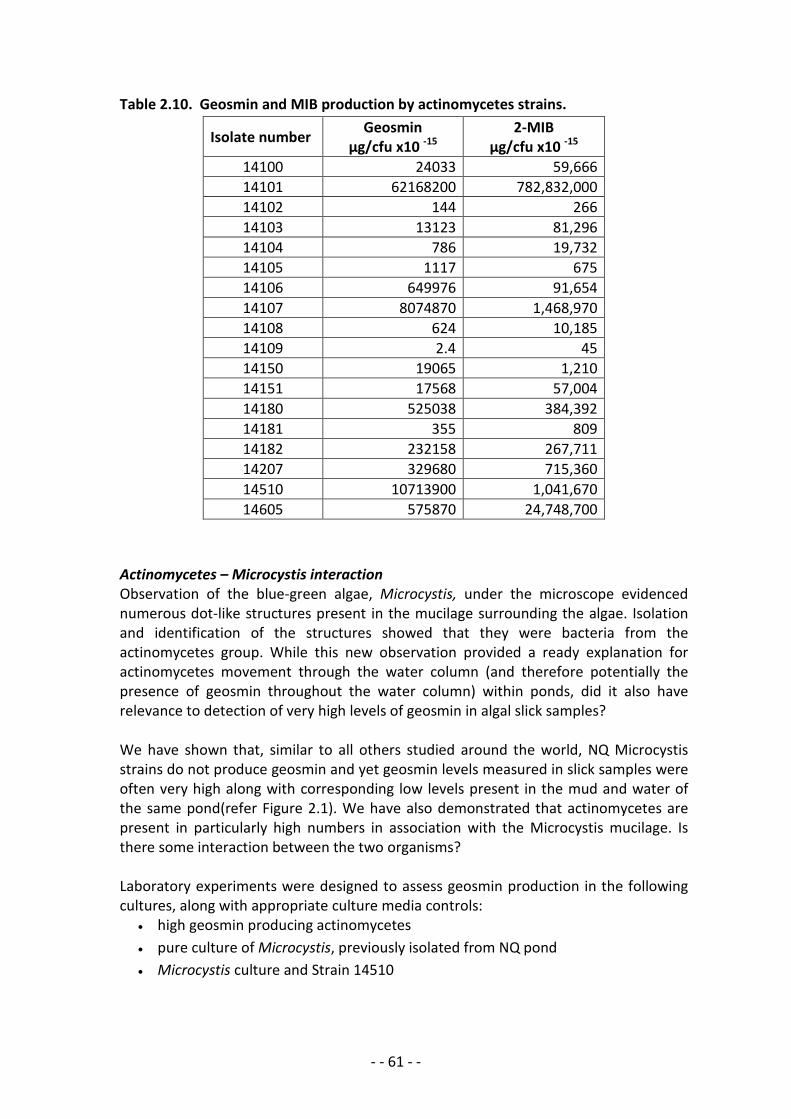
- - 61 - -
Table 2.10. Geosmin and MIB production by actinomycetes strains.
Isolate number Geosmin µg/cfu x10 -15
2-MIB µg/cfu x10 -15
14100 24033 59,666 14101 62168200 782,832,000 14102 144 266 14103 13123 81,296 14104 786 19,732 14105 1117 675 14106 649976 91,654 14107 8074870 1,468,970 14108 624 10,185 14109 2.4 45 14150 19065 1,210 14151 17568 57,004 14180 525038 384,392 14181 355 809 14182 232158 267,711 14207 329680 715,360 14510 10713900 1,041,670 14605 575870 24,748,700
Actinomycetes – Microcystis interaction Observation of the blue-green algae, Microcystis, under the microscope evidenced numerous dot-like structures present in the mucilage surrounding the algae. Isolation and identification of the structures showed that they were bacteria from the actinomycetes group. While this new observation provided a ready explanation for actinomycetes movement through the water column (and therefore potentially the presence of geosmin throughout the water column) within ponds, did it also have relevance to detection of very high levels of geosmin in algal slick samples? We have shown that, similar to all others studied around the world, NQ Microcystis strains do not produce geosmin and yet geosmin levels measured in slick samples were often very high along with corresponding low levels present in the mud and water of the same pond(refer Figure 2.1). We have also demonstrated that actinomycetes are present in particularly high numbers in association with the Microcystis mucilage. Is there some interaction between the two organisms? Laboratory experiments were designed to assess geosmin production in the following cultures, along with appropriate culture media controls:
• high geosmin producing actinomycetes • pure culture of Microcystis, previously isolated from NQ pond • Microcystis culture and Strain 14510

- - 62 - -
Actinomycetes culture: Isolate 14510 is a Streptomycetes that was isolated from a North Queensland farm pond mud sample and selected for further investigation as a high geosmin and 2-MIB producer. It was purified at Sunshine Coast University (Dr. Ipek Kurtboke) before being stored as a working culture at 4°C on 15mm diameter oatmeal agar discs cut directly from the agar culture plate (agar disks stored in 50ml plastic sample jars). One 15mm agar disk of actinomycetes 14510 was added to 11ml of GYM broth and allowed to incubate overnight at 28°C. After 24hours incubation, 1ml of broth culture (containing 1.2 x10⁸ cfu/ml) was added to 100ml of sterile GYM broth. Microcystis culture: Microcystis aeruginosa was an isolate from a North Queensland farm pond, purified to a parent culture in the Queensland Health phycology laboratories using MLA medium (Bolch and Blackburn, 1996). Working cultures were grown in 125ml MLA to a concentration of 1.9x10⁶ cells/ml. Actinomycetes + Microcystis culture: Actinomycetes + Microcystis combined culture was prepared by aseptically adding 50ml of Microcystis culture to 50ml of sterile GYM broth. 1 ml from the overnight actinomycetes culture with a concentration of 1.2 x10⁸ cells/ml was aseptically added. Final Microcystis concentration in the mix was 9.4x10⁵ cells/ml. All cultures containing algae were incubated at room temperature under florescent lights. Cultures were sampled for geosmin/MIB production each week day by transferring 10ml into a 20ml GCMS headspace vial. 2g of NaCl was added before vortexing for 30 seconds and freezing. Samples were held frozen at -20°C until experiment was complete so testing for geosmin/MIB production could be conducted as one run on the GCMS using the same internal standards. Levels of geosmin production for each of the cultures are given in Figure 2.4. This result was a complete surprise and very exciting. In combination with Microcystis, the actinomycetes strain produces geosmin at a rate almost 8 times that when growing in pure culture. This was so surprising, we repeated the experiment several times at different intervals with the result that production was often much greater when the organisms were grown together. Additionally, it was observed that the rate of production consistently showed the same pattern over time. Interestingly, the shape of the curve of geosmin production within the mixed culture mirrors exactly the curves obtained over a similar timeframe in previous investigations while monitoring pond water when a Microcystis bloom was occurring.
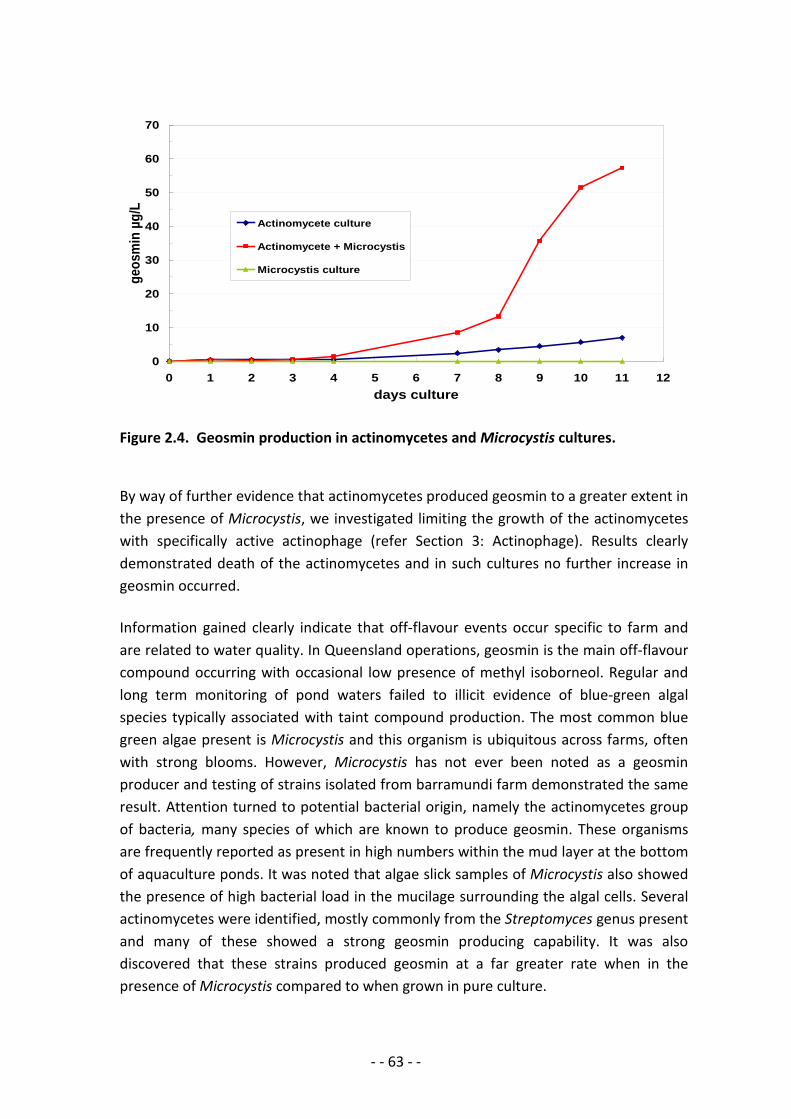
- - 63 - -
0
10
20
30
40
50
60
70
0 1 2 3 4 5 6 7 8 9 10 11 12days culture
geos
min
µg/
L
Actinomycete culture
Actinomycete + Microcystis
Microcystis culture
Figure 2.4. Geosmin production in actinomycetes and Microcystis cultures. By way of further evidence that actinomycetes produced geosmin to a greater extent in the presence of Microcystis, we investigated limiting the growth of the actinomycetes with specifically active actinophage (refer Section 3: Actinophage). Results clearly demonstrated death of the actinomycetes and in such cultures no further increase in geosmin occurred. Information gained clearly indicate that off-flavour events occur specific to farm and are related to water quality. In Queensland operations, geosmin is the main off-flavour compound occurring with occasional low presence of methyl isoborneol. Regular and long term monitoring of pond waters failed to illicit evidence of blue-green algal species typically associated with taint compound production. The most common blue green algae present is Microcystis and this organism is ubiquitous across farms, often with strong blooms. However, Microcystis has not ever been noted as a geosmin producer and testing of strains isolated from barramundi farm demonstrated the same result. Attention turned to potential bacterial origin, namely the actinomycetes group of bacteria, many species of which are known to produce geosmin. These organisms are frequently reported as present in high numbers within the mud layer at the bottom of aquaculture ponds. It was noted that algae slick samples of Microcystis also showed the presence of high bacterial load in the mucilage surrounding the algal cells. Several actinomycetes were identified, mostly commonly from the Streptomyces genus present and many of these showed a strong geosmin producing capability. It was also discovered that these strains produced geosmin at a far greater rate when in the presence of Microcystis compared to when grown in pure culture.

- - 64 - -
Section 3. Taint management tools Algal blooms have been noted in writings since biblical times but it is in the last few decades with the man-made eutrophication of water bodies, both freshwater and marine, that large effort has been directed towards mitigating their occurrence. Taint occurrence is mainly associated with species of blue-green algae: Anabaena, Aphanizomenon, Oscillatoria, Phormidium, Planktothrix, Pseudoanabaena and the taint compounds they produce have caused severe issues in many industries, especially drinking water and freshwater aquaculture. In open pond aquaculture systems, the pond mesocosm is complex and the phytoplankton community is exceedingly dynamic, continuously responding to environmental conditions with inter- and intra-specific interactions. The unpredictable nature of phytoplankton communities is evidenced by the high variability in community structure often observed among neighbouring ponds that have been similarly treated (Dionigi et al., 1998). Consequently off-flavour problems may not be consistently experienced on a farm among similar ponds nor over time (van der Ploeg & Tucker, 1994). The eutrophic conditions that inherently exist in open ponds used for aquaculture, are known to promote the dominance of blue-green algae in the phytoplankton (Tucker, 2000 ; Davis, 2010 ; Sevrin-Reyssac & Pletikosic, 1990 ; Parinet et al., 2010). Certain environmental and pond conditions favour the blooming of cyanobacterial species that produce geosmin and MIB. Unfortunately for the Australian barramundi industry, warm weather and high pond loadings are two such conditions, both of which tend to occur during periods of peak fish harvest. Indeed, open-pond systems for growing barramundi provide the almost ‘perfect’ environmental conditions for blue-green algal blooms to flourish (Table 3.1).
Table 3.1. Conditions favouring blue-green algae dominance.
Condition Barra pond occurrence
High nutrient load, particularly N and P Low nitrogen : phosphorous ratio (N : P <15) Low salinity (0 – 5 ppt) High temperature - summer conditions Low flushing rate - long water retention times Low secchi depth - reduced light penetration High pH and low CO2 - high algal turbidity Stability of water column - stratification
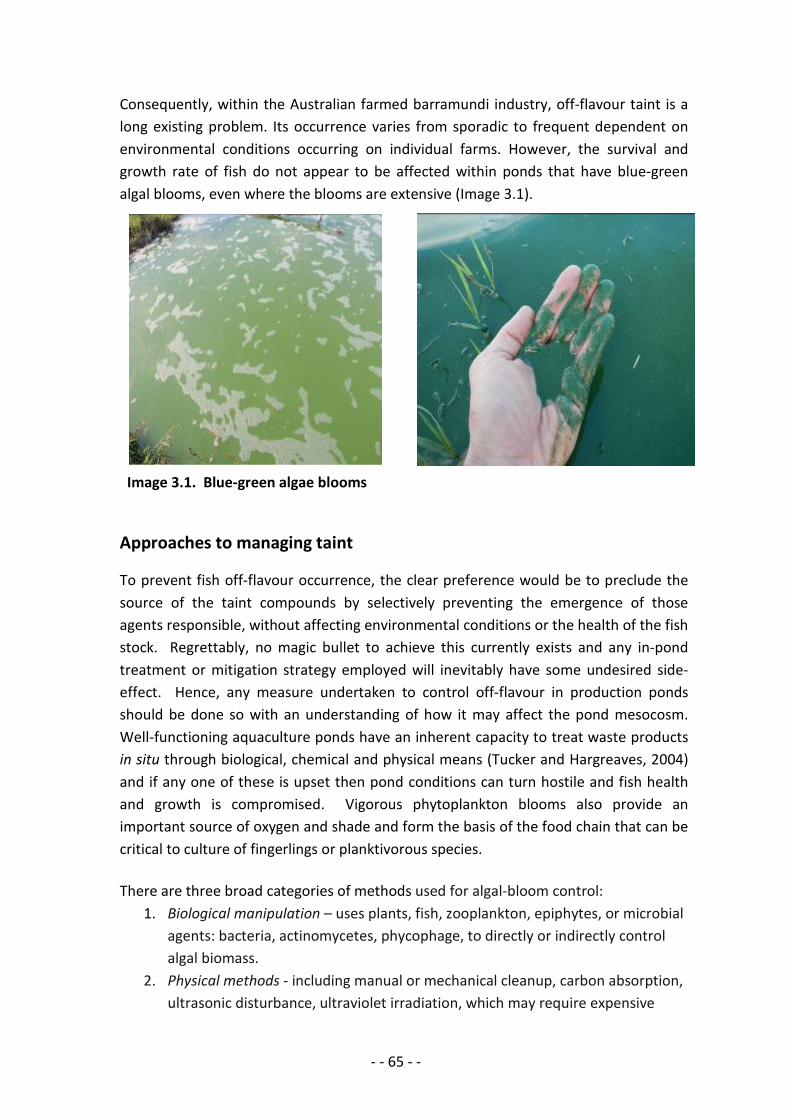
- - 65 - -
Consequently, within the Australian farmed barramundi industry, off-flavour taint is a long existing problem. Its occurrence varies from sporadic to frequent dependent on environmental conditions occurring on individual farms. However, the survival and growth rate of fish do not appear to be affected within ponds that have blue-green algal blooms, even where the blooms are extensive (Image 3.1).
Image 3.1. Blue-green algae blooms Approaches to managing taint
To prevent fish off-flavour occurrence, the clear preference would be to preclude the source of the taint compounds by selectively preventing the emergence of those agents responsible, without affecting environmental conditions or the health of the fish stock. Regrettably, no magic bullet to achieve this currently exists and any in-pond treatment or mitigation strategy employed will inevitably have some undesired side-effect. Hence, any measure undertaken to control off-flavour in production ponds should be done so with an understanding of how it may affect the pond mesocosm. Well-functioning aquaculture ponds have an inherent capacity to treat waste products in situ through biological, chemical and physical means (Tucker and Hargreaves, 2004) and if any one of these is upset then pond conditions can turn hostile and fish health and growth is compromised. Vigorous phytoplankton blooms also provide an important source of oxygen and shade and form the basis of the food chain that can be critical to culture of fingerlings or planktivorous species. There are three broad categories of methods used for algal-bloom control:
1. Biological manipulation – uses plants, fish, zooplankton, epiphytes, or microbial agents: bacteria, actinomycetes, phycophage, to directly or indirectly control algal biomass.
2. Physical methods - including manual or mechanical cleanup, carbon absorption, ultrasonic disturbance, ultraviolet irradiation, which may require expensive
- - 66 - -
apparatus, are time-consuming and often only applicable to small-scale water bodies
3. Chemical treatments - algaecides used include heavy metal compounds, pro-oxidants, and organic amines, which can readily employed and cost-effective but often have broad-spectrum toxicity within the ecosystem
ABFA members are interested in treatments that can be used as tools to clean up the pond prior to harvest. By reducing off-flavour compounds in the water, the fish will likely self-purge in the pond, given an appropriate time period. This negates the need for transference of fishing to separate purge tanks, thus reducing the labour necessitated by double-handling labour and the risk of injury and death to the fish as a result of the stresses of handling and crowding. The off-flavour prevention or mitigation methods considered for evaluation on Australian barramundi farms cover a broad range of approaches. The range included methods with expected low effectiveness but ready on-farm implementation, to those with expected high effectiveness but less practical for on-farm use. Project work encompassed design and instigation of remedial trials using treatments and methods suggested by industry members and based on various control measures identified around the world. Specific trials were selected according to appropriateness for farm and operations. Farm conditions relevant to mitigation strategies
Farming of barramundi in Australian occurs in diverse locations and environments. The major proportion of production occurs in northern climes and is cultured in both freshwater (65%) and estuarine environments (35%). As off-flavour taint in barramundi grown in saltwater environments seldom occurs in Australia, focus was centred on freshwater environments. Pond management practices are specific to farm and dictated by many factors, the most critical being intake water quality and soil type within ponds. Five separate barramundi farms were selected for conduction of different mitigation trials: four were located in North Queensland and one in the Northern Territory, along with one recirculation system farm located in South Australia. Among these farms, it was clearly evident that taint issues were variable and specific to each individual farm design, geographic location, water quality and management protocols. It was also clear that one universal solution would not be identified that would solve the taint issue for all farms, but rather a ‘tool-set’ was needed from which a particular farm can select actions appropriate to their specific farm and operation.
- - 67 - -
Open pond systems The variation in all factors was enormous between farms. Farms ranged in production size from 2 ponds up to 40 and the ponds themselves ranged in size from 0.1 hectare up to 1.5 hectares. There were two main concepts behind ponds size. One model was to keep the ponds small, therefore readily manageable, using small equipment, minimal staff and with fast turn-over of stock, hence should a bloom occur in a specific pond, fewer fish were at risk of taint compound uptake. Complete water exchange could be measured in hours in small ponds rather than days in larger ponds. Low stocking densities and a 12 month grow-out cycle meant less waste to be removed from the pond bottom. Another model of farm design was based around economy of scale. Ponds were designed on the basis of best use of land, with pond-size around 1 to 1.5 hectare size dug to fit the shape and contour of the land. This model was based on a 2 year grow-out, with less handling required and maximising the use of aeration and pumping ability to keep stock densities to an optimum level. With ponds of this size it takes longer for water conditions to deteriorate but it also takes longer to exchange to improve water quality. Both have there own merits as far as management of blue-green algae outbreaks is concerned. Quality of intake water is critical. Water quality across all the farms played a major role in presence or absence of blue-green algae. This varied from farms being able to exchange into ponds at such a high rate and with drinking quality water, that they could dilute any algae outbreaks faster than they could build up. In contrast, the quality of intake water was affected by seasonal rainfall. During the wet season, nutrient loads within the intake water are extremely high resulting in severe difficulties in managing bloom outbreaks through water exchange. It was noted that water exchange within a pond was one of the simplest ways to control pond water quality, therefore the greater the exchange on a regular timeframe, the better. However, high water exchange also will negate any chemical or compound treatments that may be added to the pond water to limit algal growth. This was mentioned by several farmers as a major hurdle. Recirculation system Recirculation system operations differ from those of ponds. Operations are generally as follows: Fingerlings are either produced using an on-site hatchery or brought in from commercial hatcheries elsewhere. They are raised inside in large fibreglass tanks (up to 120,000 l), at up to 40kg/m3 for eight to thirteen months, growing from around 0.5g to 1kg if for live or whole chilled; larger and therefore longer for fillets. At-size fish are graded; then purged unfed for 5 to 7 days in isolated recirculation tanks containing clean water circulated through sand filters. After purging fish are netted out of the tank and processed, either sent live to market in tank trucks or processed for the fresh chilled market. Fish are sent live to Sydney and Melbourne or fresh chilled to Adelaide and Melbourne with a small amount of the latter (about 50kg/week) sent to Hong
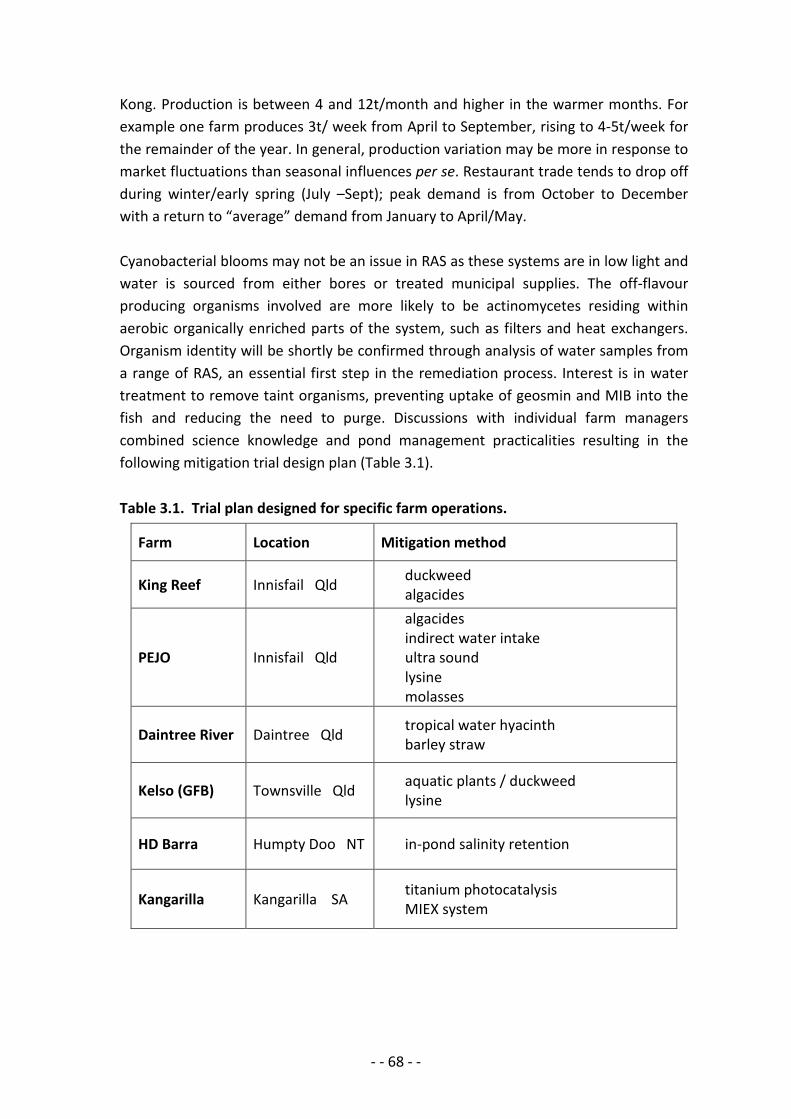
- - 68 - -
Kong. Production is between 4 and 12t/month and higher in the warmer months. For example one farm produces 3t/ week from April to September, rising to 4-5t/week for the remainder of the year. In general, production variation may be more in response to market fluctuations than seasonal influences per se. Restaurant trade tends to drop off during winter/early spring (July –Sept); peak demand is from October to December with a return to “average” demand from January to April/May. Cyanobacterial blooms may not be an issue in RAS as these systems are in low light and water is sourced from either bores or treated municipal supplies. The off-flavour producing organisms involved are more likely to be actinomycetes residing within aerobic organically enriched parts of the system, such as filters and heat exchangers. Organism identity will be shortly be confirmed through analysis of water samples from a range of RAS, an essential first step in the remediation process. Interest is in water treatment to remove taint organisms, preventing uptake of geosmin and MIB into the fish and reducing the need to purge. Discussions with individual farm managers combined science knowledge and pond management practicalities resulting in the following mitigation trial design plan (Table 3.1).
Table 3.1. Trial plan designed for specific farm operations.
Farm Location Mitigation method
King Reef Innisfail Qld duckweed algacides
PEJO Innisfail Qld
algacides indirect water intake ultra sound lysine molasses
Daintree River Daintree Qld tropical water hyacinth barley straw
Kelso (GFB) Townsville Qld aquatic plants / duckweed lysine
HD Barra Humpty Doo NT in-pond salinity retention
Kangarilla Kangarilla SA titanium photocatalysis MIEX system
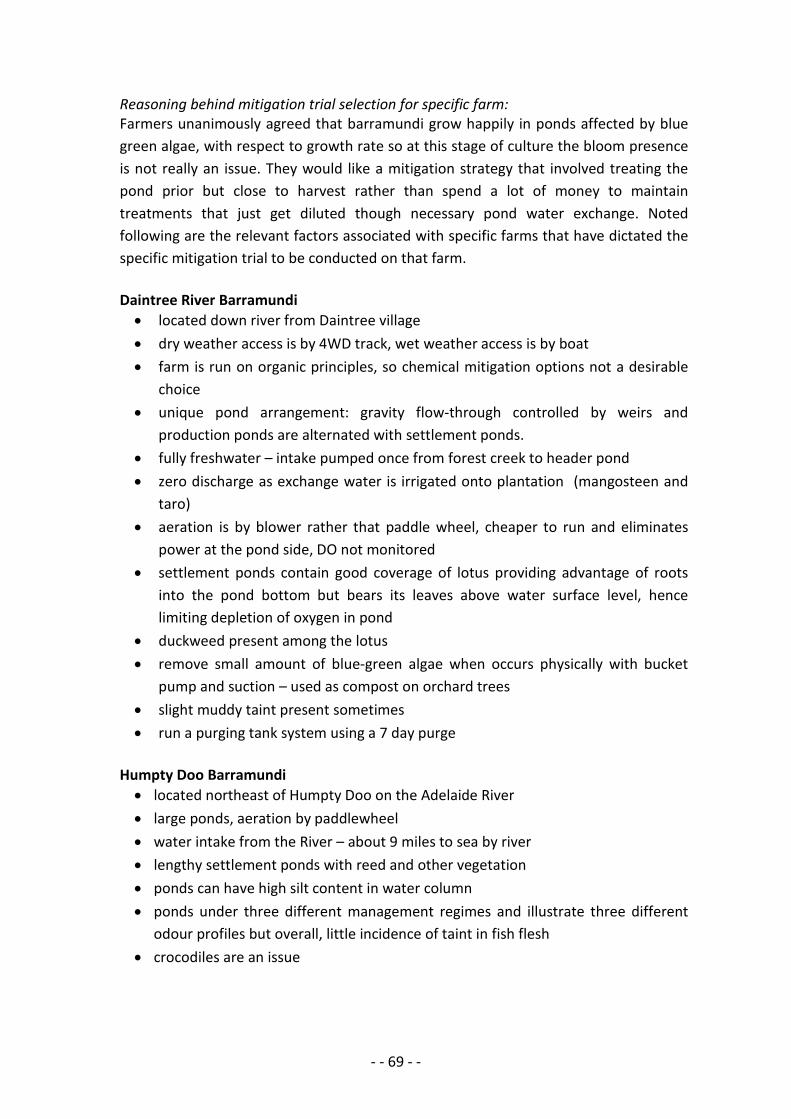
- - 69 - -
Reasoning behind mitigation trial selection for specific farm: Farmers unanimously agreed that barramundi grow happily in ponds affected by blue green algae, with respect to growth rate so at this stage of culture the bloom presence is not really an issue. They would like a mitigation strategy that involved treating the pond prior but close to harvest rather than spend a lot of money to maintain treatments that just get diluted though necessary pond water exchange. Noted following are the relevant factors associated with specific farms that have dictated the specific mitigation trial to be conducted on that farm. Daintree River Barramundi • located down river from Daintree village • dry weather access is by 4WD track, wet weather access is by boat • farm is run on organic principles, so chemical mitigation options not a desirable
choice • unique pond arrangement: gravity flow-through controlled by weirs and
production ponds are alternated with settlement ponds. • fully freshwater – intake pumped once from forest creek to header pond • zero discharge as exchange water is irrigated onto plantation (mangosteen and
taro) • aeration is by blower rather that paddle wheel, cheaper to run and eliminates
power at the pond side, DO not monitored • settlement ponds contain good coverage of lotus providing advantage of roots
into the pond bottom but bears its leaves above water surface level, hence limiting depletion of oxygen in pond
• duckweed present among the lotus • remove small amount of blue-green algae when occurs physically with bucket
pump and suction – used as compost on orchard trees • slight muddy taint present sometimes • run a purging tank system using a 7 day purge
Humpty Doo Barramundi • located northeast of Humpty Doo on the Adelaide River • large ponds, aeration by paddlewheel • water intake from the River – about 9 miles to sea by river • lengthy settlement ponds with reed and other vegetation • ponds can have high silt content in water column • ponds under three different management regimes and illustrate three different
odour profiles but overall, little incidence of taint in fish flesh • crocodiles are an issue
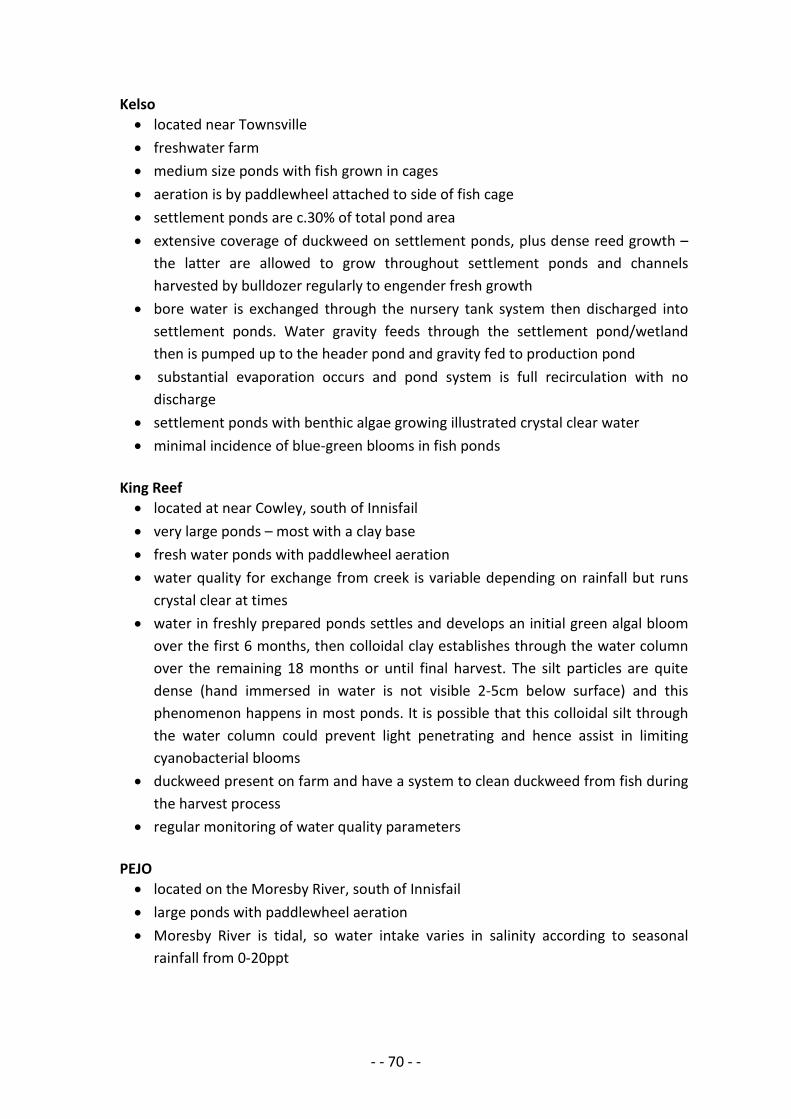
- - 70 - -
Kelso • located near Townsville • freshwater farm • medium size ponds with fish grown in cages • aeration is by paddlewheel attached to side of fish cage • settlement ponds are c.30% of total pond area • extensive coverage of duckweed on settlement ponds, plus dense reed growth –
the latter are allowed to grow throughout settlement ponds and channels harvested by bulldozer regularly to engender fresh growth
• bore water is exchanged through the nursery tank system then discharged into settlement ponds. Water gravity feeds through the settlement pond/wetland then is pumped up to the header pond and gravity fed to production pond
• substantial evaporation occurs and pond system is full recirculation with no discharge
• settlement ponds with benthic algae growing illustrated crystal clear water • minimal incidence of blue-green blooms in fish ponds
King Reef • located at near Cowley, south of Innisfail • very large ponds – most with a clay base • fresh water ponds with paddlewheel aeration • water quality for exchange from creek is variable depending on rainfall but runs
crystal clear at times • water in freshly prepared ponds settles and develops an initial green algal bloom
over the first 6 months, then colloidal clay establishes through the water column over the remaining 18 months or until final harvest. The silt particles are quite dense (hand immersed in water is not visible 2-5cm below surface) and this phenomenon happens in most ponds. It is possible that this colloidal silt through the water column could prevent light penetrating and hence assist in limiting cyanobacterial blooms
• duckweed present on farm and have a system to clean duckweed from fish during the harvest process
• regular monitoring of water quality parameters PEJO • located on the Moresby River, south of Innisfail • large ponds with paddlewheel aeration • Moresby River is tidal, so water intake varies in salinity according to seasonal
rainfall from 0-20ppt
- - 71 - -
• quality of intake water is strongly affected by seasonal rainfall and during the wet, nutrient loads are extremely high resulting in severe difficulties in managing bloom outbreaks through water exchange
• extensive settlement pond with diverse range of herbaceous species maximising nutrient uptake
• Microcystis blooms can be frequent Southern Barramundi • located at Kangarilla, 33km southeast of Adelaide • four sheds with 2 120,000L production tanks per shed • each tank contains four production basins holding 3300 barramundi/basin • bore water heated to 28oC, used at 50-60,000L per day; 5-10% exchange per day • mechanical filtration 60 micron, entire tank volume passes every 2 hours
minimum, • biological filtration 8,000 litres per minute passes over submerged biofilter. • taint a significant issue. • at size, fish are graded; then purged unfed for 5 to 7 days in isolated recirculation
tanks containing clean water circulated through sand filters. • tanks periodically dosed with CuSO4 and cleaned with Chloramine T.
- - 72 - -
Actinophage Within this research project we have clearly shown that actinomycetes associated with Microcystis blooms are responsible for high levels of geosmin production within NQ pond environments. A range of actinomycetes species were identified with the predominant genus being Streptomyces (refer Section 2). In aquatic environments, the presence of actinomycetes is ubiquitous, along with associated actinophages, bacterial viruses with specific activity against actinomycetes (Willoughby et al, 1972; Willoughby, 1976; Kurtboke, 2005) and this area has been much studied for a range of purposes, both ecological studies and bioprospecting. However, the targeted use of actinophages in remedial use for the selective reduction of specific actinomycetes is not abundantly reported. The concept has promise as a remedial tool within aquaculture environments as the active agent is inherently within the same pond water environment as fish are growing in and there is an ability to select active actinophage with very limited bacterial-host specificity or a broader host activity. The fact that the remedial agent is taken from the fish pond and then reintroduced, albeit at a much higher concentration, may well find acceptance with respect to food product in the consumer mind. Additionally, despite the high re-inoculation level that would occur in bioremediation, there is a powerful phage self limiting factor due to the need for the host for survival of the virus. A review exploring the risks of phage application in the environment (Meaden and Koskella, 2013) raised concern of possible evolution of bacterial resistance to phage infection occurring but also suggested basic precautions to preclude such events. The benefit in following this pathway was the possibility of creating a defined ‘treatment’ solution of phage(s) that would act only on those actinomycetes that exhibited high geosmin production and not affect the total actinomycetes population within the pond ecology. This latter was an important consideration as actinomycetes have a highly useful functional within ponds with respect to breaking down and metabolising detritus and uneaten feed, thereby helping maintain suitable water quality within the pond system. Treatments that wiped out all actinomycetes present across the board would likely cause rapid pond crash in water quality. Hence the need to opt for a treatment that would selectively target only those strains producing large quantities of geosmin. Within this project the potential of actinophages isolated from NQ fish ponds were investigated. For this work we have collaborated with Dr. Ipek Kurtboke (University of Sunshine Coast) who is an expert in actinophages and has very kindly contributed her time, knowledge and phage collection cultures to achieve the work presented here.
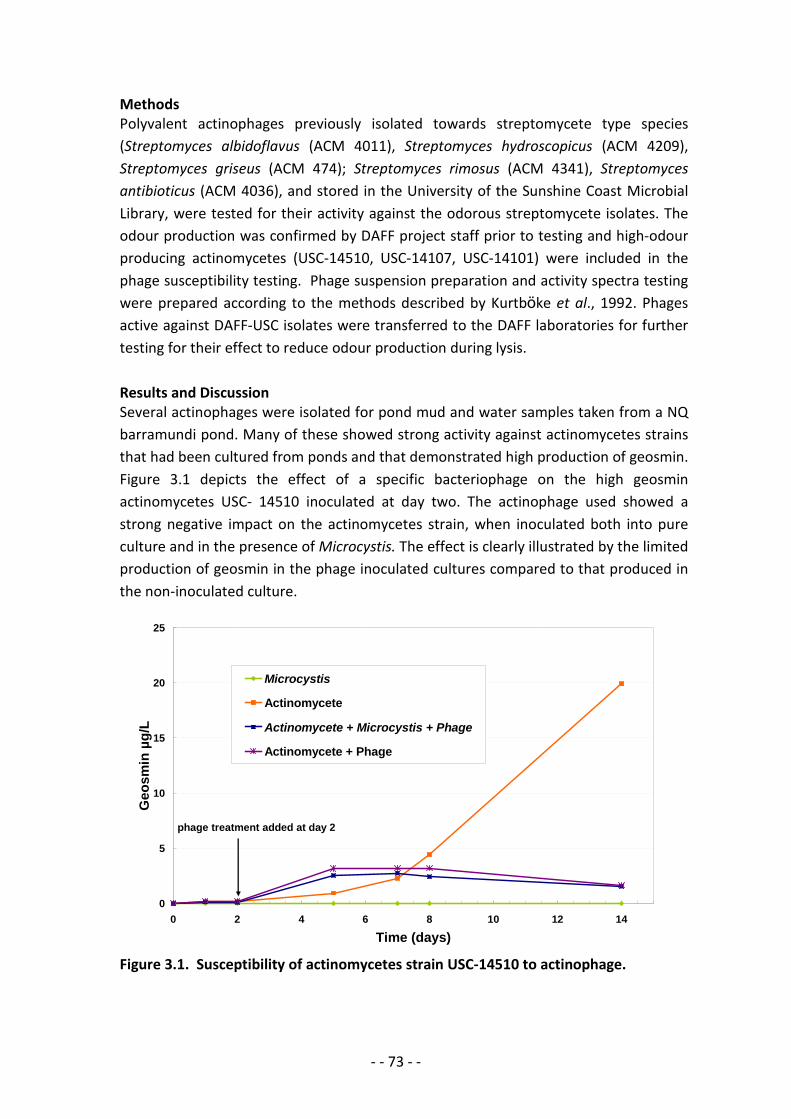
- - 73 - -
Methods Polyvalent actinophages previously isolated towards streptomycete type species (Streptomyces albidoflavus (ACM 4011), Streptomyces hydroscopicus (ACM 4209), Streptomyces griseus (ACM 474); Streptomyces rimosus (ACM 4341), Streptomyces antibioticus (ACM 4036), and stored in the University of the Sunshine Coast Microbial Library, were tested for their activity against the odorous streptomycete isolates. The odour production was confirmed by DAFF project staff prior to testing and high-odour producing actinomycetes (USC-14510, USC-14107, USC-14101) were included in the phage susceptibility testing. Phage suspension preparation and activity spectra testing were prepared according to the methods described by Kurtbӧke et al., 1992. Phages active against DAFF-USC isolates were transferred to the DAFF laboratories for further testing for their effect to reduce odour production during lysis. Results and Discussion Several actinophages were isolated for pond mud and water samples taken from a NQ barramundi pond. Many of these showed strong activity against actinomycetes strains that had been cultured from ponds and that demonstrated high production of geosmin. Figure 3.1 depicts the effect of a specific bacteriophage on the high geosmin actinomycetes USC- 14510 inoculated at day two. The actinophage used showed a strong negative impact on the actinomycetes strain, when inoculated both into pure culture and in the presence of Microcystis. The effect is clearly illustrated by the limited production of geosmin in the phage inoculated cultures compared to that produced in the non-inoculated culture. Figure 3.1. Susceptibility of actinomycetes strain USC-14510 to actinophage.
0
5
10
15
20
25
0 2 4 6 8 10 12 14
Time (days)
Geo
smin
µg/
L
Microcystis
Actinomycete
Actinomycete + Microcystis + Phage
Actinomycete + Phage
phage treatment added at day 2
- - 74 - -
The results suggest that actinomycetes strain 14510 is very susceptible to infection by the specific actinophage used and further, that the action of the phage was lytic, rather than merely lysogenic, due to the small rise in measurable geosmin immediately after phage inoculation. This actinophage also demonstrated lytic activity against other actinomycetes strains tested as did many other phage isolated from the pond water and muds.
All results gained in this work demonstrate the strong potential of using actinophages for controlling of geosmin-producing actinomycetes populations within freshwater ponds and that it could be a highly effective mitigation strategy for reducing geosmin off-flavour in barramundi. However, the amount of research required to achieve such a solution is very large. A ‘treatment’ solution of actinophage needs to be relevant and appropriate to those actinomycetes present in the pond water at any application time. As evidenced within this project, the range of actinomycetes present in pond water is both numerous and variable (see Section 2). Prior to being able to develop an effective phage treatment solution, a complete understanding of which actinomycetes are present in which pond at what time of year is required. This was beyond the scope of this current project. Summary conclusions Actinophage are highly effective in depleting high-geosmin producing actinomycetes and therefore demonstrate great potential for developing a natural treatment solution for the mitigation of geosmin taint in barramundi ponds. However, a large amount of information is first required on the most common and significant actinomycetes species within the ponds for an effective treatment solution to be developed.
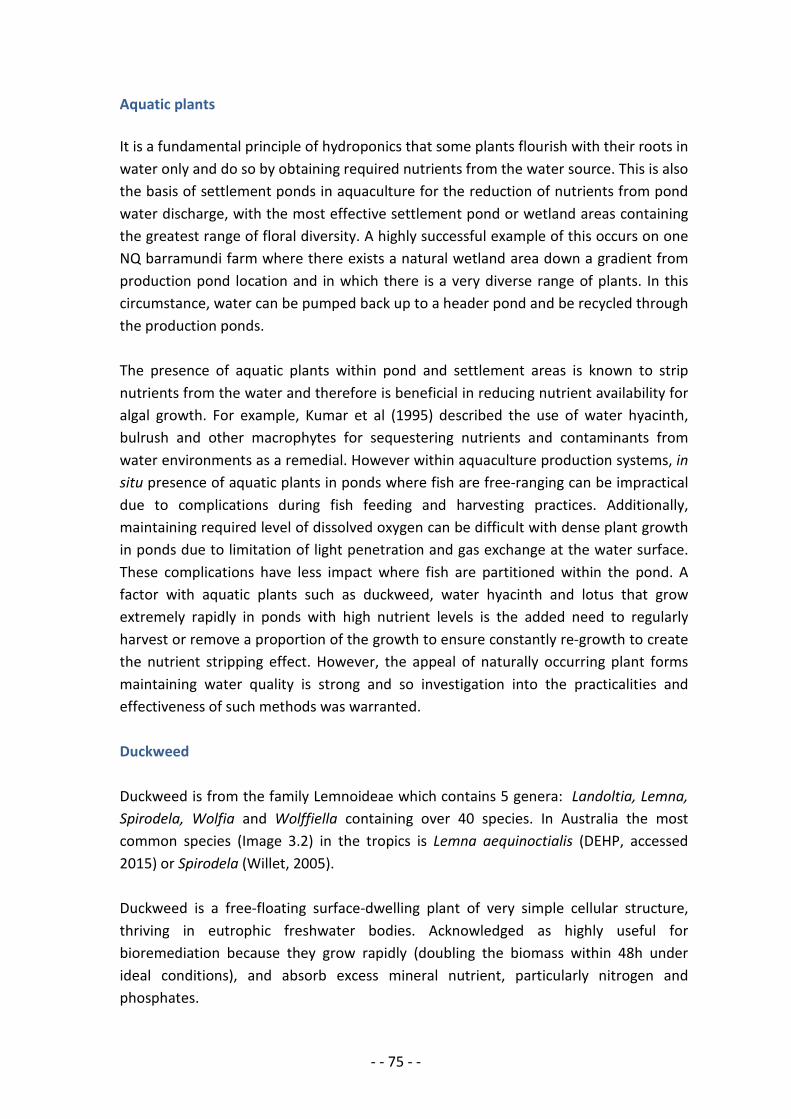
- - 75 - -
Aquatic plants It is a fundamental principle of hydroponics that some plants flourish with their roots in water only and do so by obtaining required nutrients from the water source. This is also the basis of settlement ponds in aquaculture for the reduction of nutrients from pond water discharge, with the most effective settlement pond or wetland areas containing the greatest range of floral diversity. A highly successful example of this occurs on one NQ barramundi farm where there exists a natural wetland area down a gradient from production pond location and in which there is a very diverse range of plants. In this circumstance, water can be pumped back up to a header pond and be recycled through the production ponds. The presence of aquatic plants within pond and settlement areas is known to strip nutrients from the water and therefore is beneficial in reducing nutrient availability for algal growth. For example, Kumar et al (1995) described the use of water hyacinth, bulrush and other macrophytes for sequestering nutrients and contaminants from water environments as a remedial. However within aquaculture production systems, in situ presence of aquatic plants in ponds where fish are free-ranging can be impractical due to complications during fish feeding and harvesting practices. Additionally, maintaining required level of dissolved oxygen can be difficult with dense plant growth in ponds due to limitation of light penetration and gas exchange at the water surface. These complications have less impact where fish are partitioned within the pond. A factor with aquatic plants such as duckweed, water hyacinth and lotus that grow extremely rapidly in ponds with high nutrient levels is the added need to regularly harvest or remove a proportion of the growth to ensure constantly re-growth to create the nutrient stripping effect. However, the appeal of naturally occurring plant forms maintaining water quality is strong and so investigation into the practicalities and effectiveness of such methods was warranted. Duckweed Duckweed is from the family Lemnoideae which contains 5 genera: Landoltia, Lemna, Spirodela, Wolfia and Wolffiella containing over 40 species. In Australia the most common species (Image 3.2) in the tropics is Lemna aequinoctialis (DEHP, accessed 2015) or Spirodela (Willet, 2005). Duckweed is a free-floating surface-dwelling plant of very simple cellular structure, thriving in eutrophic freshwater bodies. Acknowledged as highly useful for bioremediation because they grow rapidly (doubling the biomass within 48h under ideal conditions), and absorb excess mineral nutrient, particularly nitrogen and phosphates.
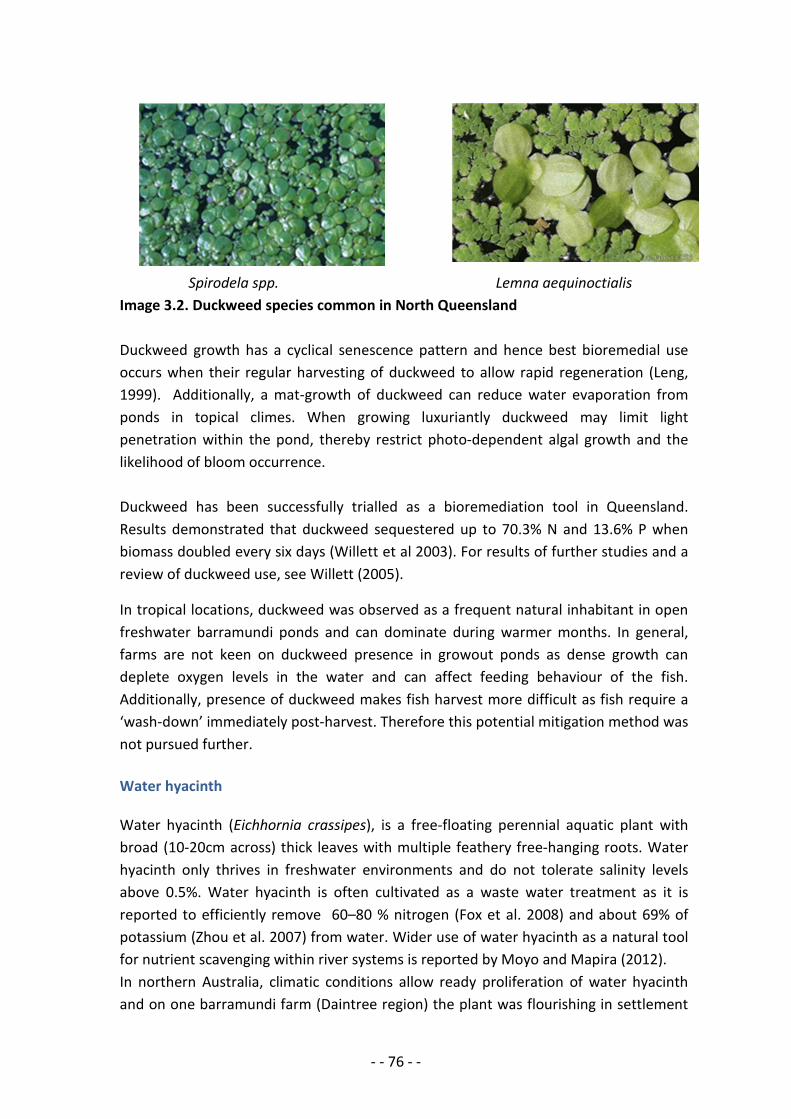
- - 76 - -
Spirodela spp. Lemna aequinoctialis Image 3.2. Duckweed species common in North Queensland Duckweed growth has a cyclical senescence pattern and hence best bioremedial use occurs when their regular harvesting of duckweed to allow rapid regeneration (Leng, 1999). Additionally, a mat-growth of duckweed can reduce water evaporation from ponds in topical climes. When growing luxuriantly duckweed may limit light penetration within the pond, thereby restrict photo-dependent algal growth and the likelihood of bloom occurrence. Duckweed has been successfully trialled as a bioremediation tool in Queensland. Results demonstrated that duckweed sequestered up to 70.3% N and 13.6% P when biomass doubled every six days (Willett et al 2003). For results of further studies and a review of duckweed use, see Willett (2005).
In tropical locations, duckweed was observed as a frequent natural inhabitant in open freshwater barramundi ponds and can dominate during warmer months. In general, farms are not keen on duckweed presence in growout ponds as dense growth can deplete oxygen levels in the water and can affect feeding behaviour of the fish. Additionally, presence of duckweed makes fish harvest more difficult as fish require a ‘wash-down’ immediately post-harvest. Therefore this potential mitigation method was not pursued further. Water hyacinth Water hyacinth (Eichhornia crassipes), is a free-floating perennial aquatic plant with broad (10-20cm across) thick leaves with multiple feathery free-hanging roots. Water hyacinth only thrives in freshwater environments and do not tolerate salinity levels above 0.5%. Water hyacinth is often cultivated as a waste water treatment as it is reported to efficiently remove 60–80 % nitrogen (Fox et al. 2008) and about 69% of potassium (Zhou et al. 2007) from water. Wider use of water hyacinth as a natural tool for nutrient scavenging within river systems is reported by Moyo and Mapira (2012). In northern Australia, climatic conditions allow ready proliferation of water hyacinth and on one barramundi farm (Daintree region) the plant was flourishing in settlement
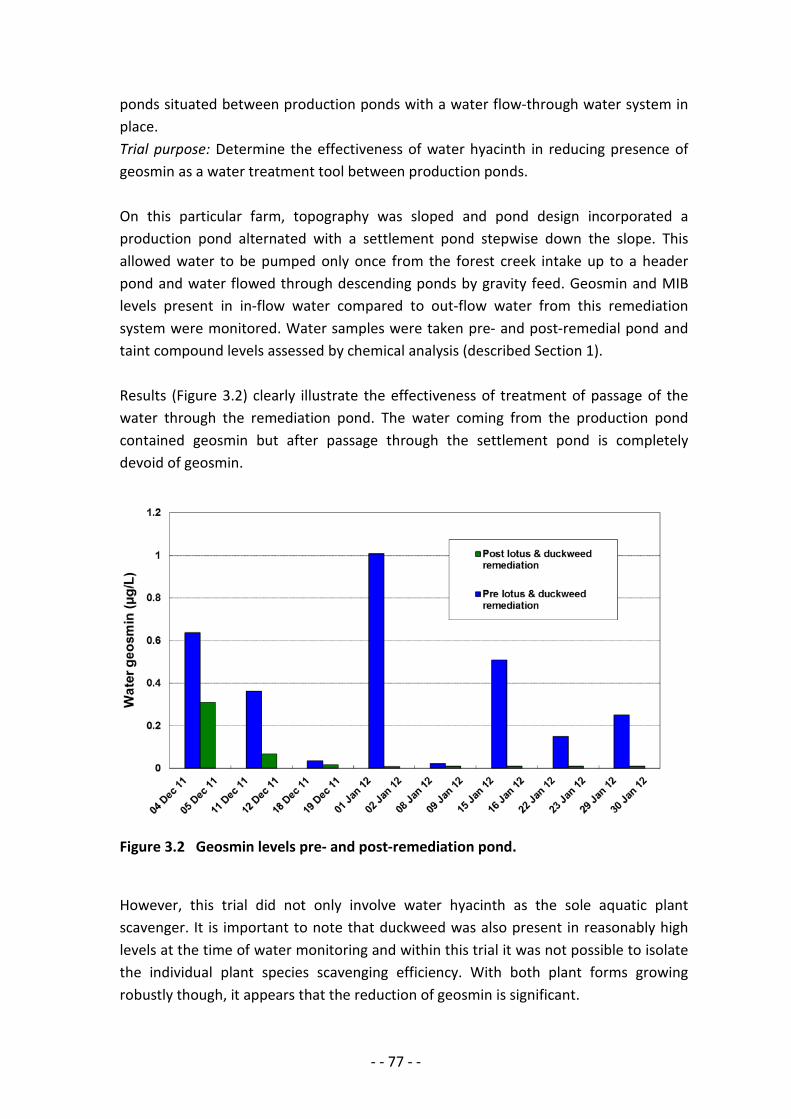
- - 77 - -
ponds situated between production ponds with a water flow-through water system in place. Trial purpose: Determine the effectiveness of water hyacinth in reducing presence of geosmin as a water treatment tool between production ponds. On this particular farm, topography was sloped and pond design incorporated a production pond alternated with a settlement pond stepwise down the slope. This allowed water to be pumped only once from the forest creek intake up to a header pond and water flowed through descending ponds by gravity feed. Geosmin and MIB levels present in in-flow water compared to out-flow water from this remediation system were monitored. Water samples were taken pre- and post-remedial pond and taint compound levels assessed by chemical analysis (described Section 1). Results (Figure 3.2) clearly illustrate the effectiveness of treatment of passage of the water through the remediation pond. The water coming from the production pond contained geosmin but after passage through the settlement pond is completely devoid of geosmin.
Figure 3.2 Geosmin levels pre- and post-remediation pond. However, this trial did not only involve water hyacinth as the sole aquatic plant scavenger. It is important to note that duckweed was also present in reasonably high levels at the time of water monitoring and within this trial it was not possible to isolate the individual plant species scavenging efficiency. With both plant forms growing robustly though, it appears that the reduction of geosmin is significant.
- - 78 - -
The presence of both water hyacinth and duckweed provides a good method for reducing geosmin levels in water. This method will only be an appropriate tool for barramundi farms that can design physical pond placement and water flow through allowing a settlement or remedial pond between each production pond. Barley straw There is some opinion that inclusion of fresh barley straw in freshwater bodies has a beneficial effect in preventing algal blooms occurring. The use of barley to control algal was anecdotally an accident (Butler et al, 2001) from observations that a bale of straw falling in a pond with a strong algal bloom resulted in the gradual disappearance of the algae and it did not return that season. Barrett et al (1999) reported a drop in algal numbers soon after straw was introduced into potable water supply reservoir and that algal growth remained 75% less than that prior to treatment, along with consequent reduction in taint and odour problems. It is not certain what the mechanism of this effect is but two possibilities are have touted. It is suggested that physical adherence of algal cells to the straw occur and this limits algae proliferation. Some reports suggest that release of secondary metabolites during decomposition might be the inhibitory mode of action (Cooper and Zika, 1983; Pillinger et al, 1992; Fverall and Lees, 1997; Ball et al, 2001). There is even a proposition that geosmin or MIB compounds present in the pond water may themselves adhere to the straw fibres reducing availability for accumulation in fish. One barramundi farm was run according to organic principles and hence they were very keen to try this option for restricting the occurrence of algal blooms. The barley straw was sourced fresh from southern Queensland and packed into open-weave onion bags. These were strapped to the paddlewheel aerators in the production pond, 1 bag per aerator, on the premise that maximum water-flow through the straw would occur when in this location. A limited laboratory experiment was conducted on the basis of work conducted by Gibson et al (1990) and Welch et al (1990) to see if any inhibitory effect of barley on Microcystis or actinomycetes could be observed. Results indicated that there was no effect and indeed cultures appeared to thrive in the presence of barley straw. In the pond environment, visual observations indicated that there was little algal bloom (including Microcystis) present in the pond when the barley straw was introduced and through the trial period. However, over the time of monitoring, there was a noted increase in geosmin levels in the pond water.
- - 79 - -
Both these trials, while acknowledged as very limited, indicate the same effect – that barley straw presence has no restrictive effect on algal survival and proliferation, nor any apparent absorption effect with geosmin compound in water solution. However, there are strong qualifications with respect to conclusion from these limited experiments. Suggestions related to the nil-effect include: algal cultures could well have been contaminated with bacteria naturally present on
the straw
the growth environment (lab medium or pond water) may have been highly eutrophic with such nutritious mediums over-riding an inhibitory effect of the straw
if straw needs to degrade to some extent to release inhibitory compounds the period of the trials were not long enough for significant decomposition of the straw to have occurred from fresh as was introduced
It is likely this a very complex system with a multitude of inter-relating factors for any beneficial effect to be evident, hence it was considered not to be within the ambit of this project to pursue further. Additionally, there remains some controversy on the usefulness of barley straw as it is not necessarily effective in all circumstances (Barkoh et al, 2008; Butler et al, 2001). In this limited trial, barley straw appeared to have no beneficial effect on limiting algal growth or in limiting geosmin presence. However, it is valid to state that so little work was conducted that the use of barley straw as remedial tool remains inconclusive from our work. Actively growing aquatic plants, particularly duckweed and water hyacinth, do act to reduce nutrient level in pond waters and can be an applicable useful tool where pond design and farming production system is appropriate for implementation.
- - 80 - -
Copper sulphate Copper is very toxic algaecide causing increased permeability of the cell membrane and leakage of the cell contents. When used at prescribed dosages there is no risk to freshwater vascular plants or estuarine/marine plants. It is one of only two federally-approved algaecides in the United States, and, in the form of copper sulphate, is the most widely used algaecide in the channel catfish farming industry (Zhao et al., 2005). Indeed, Tucker and Hargreaves stated “Management of off-flavours in catfish aquaculture is difficult and algaecides are the only management tool that yields relatively dependable results” (Tucker & Hargreaves, 2003). However while effective in crashing dominant blooms in ponds, the algaecidal effect of copper is not selective in action but is broadly toxic to all phytoplankton groups. Some variation in sensitivity to copper has been determined among species but these differences are not great (Schrader et al., 1998) making it difficult to achieve practical selective inhibition against undesired cyanobacteria species. From the widespread use of cooper sulphate as an algaecide, it seems that aquaculturists are willing to accept the non-targeted activity of the compound to achieve reduction of cyanobacterial presence and the potential improvement to fish flavour. It should be noted that development of resistance to copper has been found in cyanobacteria exposed to repeated low doses of copper (García-Villada et al., 2004). When using copper compounds to prevent cyanobacteria blooms it is typically applied once per week at low concentrations, around 0.12 to 0.2 mg/L (Tucker & van der Ploeg, 1999 ; Tucker & Hargreaves, 2003). Treatment of existing blooms required higher initial doses. Copper is also toxic to fish particularly under low alkalinity and low pH conditions. With high alkalinity and pH conditions, greater amounts of copper sulphate need to be added to achieve the desired affect due to its higher rate of precipitation under these conditions. Chelated forms of copper are considered to be more stable in pond waters (Masuda & Boyd, (1993) but this comes at a higher cost. Monitoring of ponds receiving regular doses of copper sulphate reveals that the majority of copper binds to suspended sediment particles within minutes and after 2 days almost all copper is retained within the bottom sediments (Liu & Barnett, 2006). There is no evidence that copper can accumulate in fish from treated ponds sufficiently to be of health concerns to consumers (Liu & Barnett, 2006). A form of copper marketed for algae control has recently become available in Australia where it appears to be permitted for use in fish ponds to control undesired algae. This
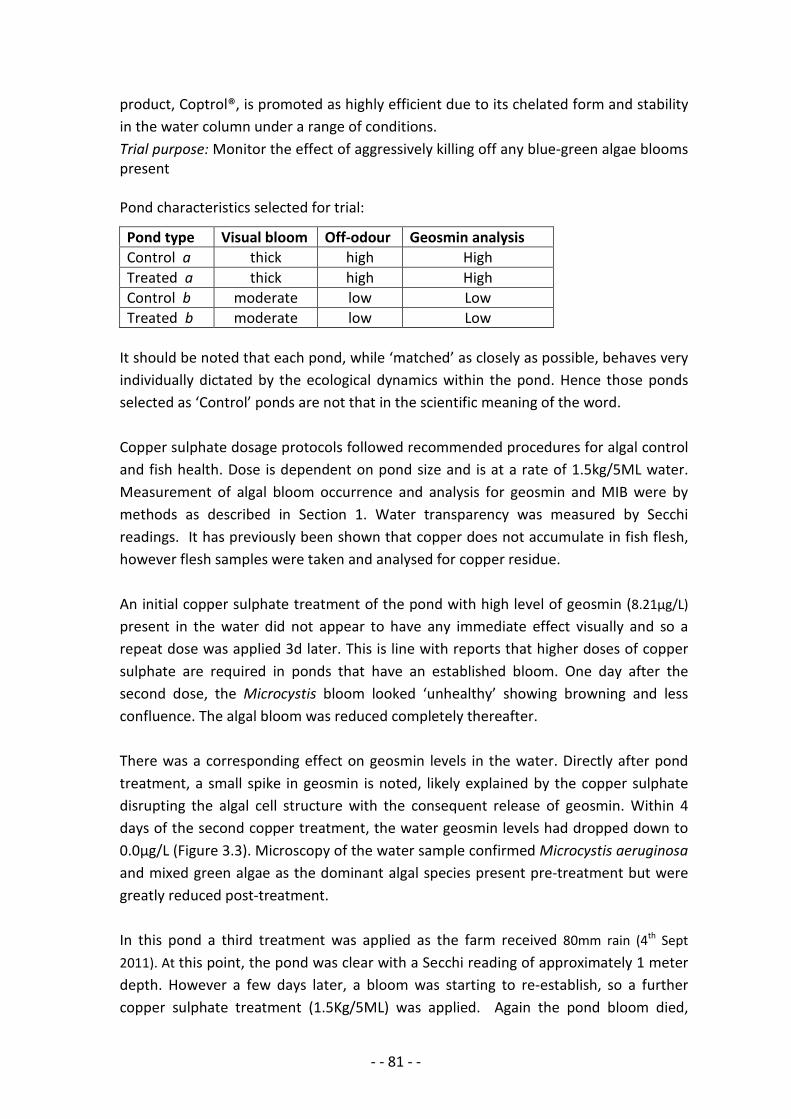
- - 81 - -
product, Coptrol®, is promoted as highly efficient due to its chelated form and stability in the water column under a range of conditions. Trial purpose: Monitor the effect of aggressively killing off any blue-green algae blooms present Pond characteristics selected for trial:
Pond type Visual bloom Off-odour Geosmin analysis Control a thick high High Treated a thick high High Control b moderate low Low
Treated b moderate low Low It should be noted that each pond, while ‘matched’ as closely as possible, behaves very individually dictated by the ecological dynamics within the pond. Hence those ponds selected as ‘Control’ ponds are not that in the scientific meaning of the word. Copper sulphate dosage protocols followed recommended procedures for algal control and fish health. Dose is dependent on pond size and is at a rate of 1.5kg/5ML water. Measurement of algal bloom occurrence and analysis for geosmin and MIB were by methods as described in Section 1. Water transparency was measured by Secchi readings. It has previously been shown that copper does not accumulate in fish flesh, however flesh samples were taken and analysed for copper residue. An initial copper sulphate treatment of the pond with high level of geosmin (8.21µg/L) present in the water did not appear to have any immediate effect visually and so a repeat dose was applied 3d later. This is line with reports that higher doses of copper sulphate are required in ponds that have an established bloom. One day after the second dose, the Microcystis bloom looked ‘unhealthy’ showing browning and less confluence. The algal bloom was reduced completely thereafter. There was a corresponding effect on geosmin levels in the water. Directly after pond treatment, a small spike in geosmin is noted, likely explained by the copper sulphate disrupting the algal cell structure with the consequent release of geosmin. Within 4 days of the second copper treatment, the water geosmin levels had dropped down to 0.0µg/L (Figure 3.3). Microscopy of the water sample confirmed Microcystis aeruginosa and mixed green algae as the dominant algal species present pre-treatment but were greatly reduced post-treatment. In this pond a third treatment was applied as the farm received 80mm rain (4th Sept 2011). At this point, the pond was clear with a Secchi reading of approximately 1 meter depth. However a few days later, a bloom was starting to re-establish, so a further copper sulphate treatment (1.5Kg/5ML) was applied. Again the pond bloom died,
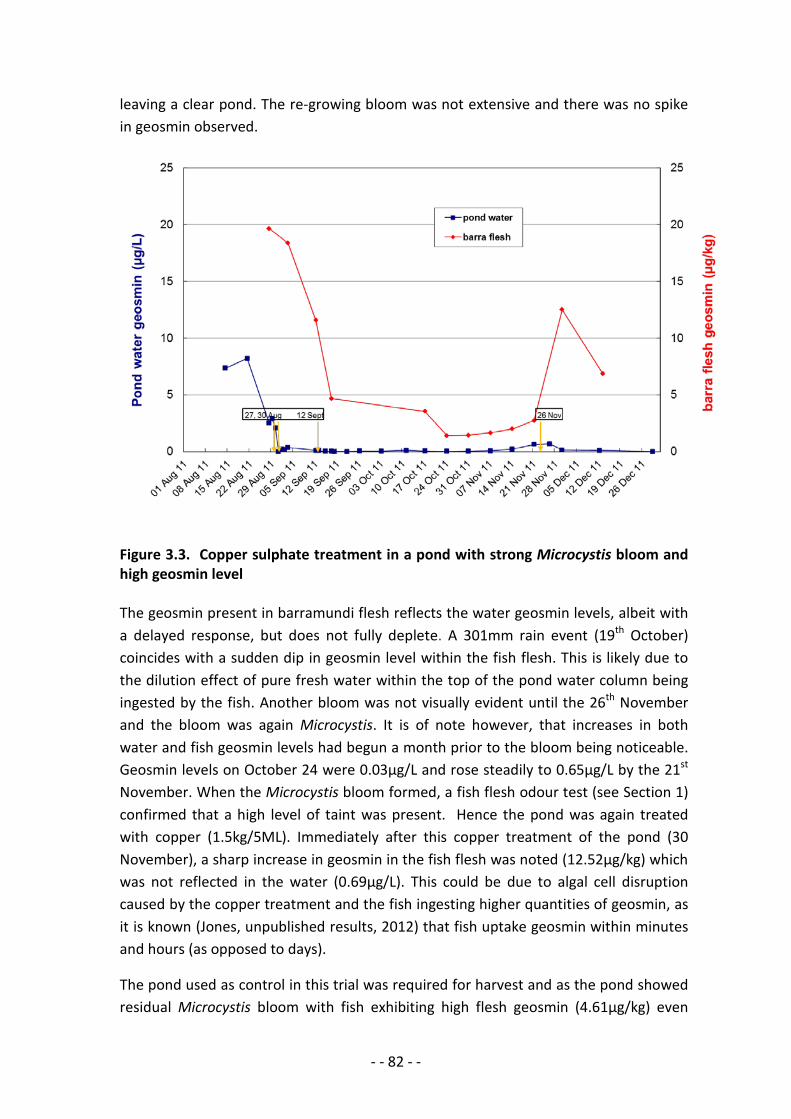
- - 82 - -
leaving a clear pond. The re-growing bloom was not extensive and there was no spike in geosmin observed.
Figure 3.3. Copper sulphate treatment in a pond with strong Microcystis bloom and high geosmin level The geosmin present in barramundi flesh reflects the water geosmin levels, albeit with a delayed response, but does not fully deplete. A 301mm rain event (19th October) coincides with a sudden dip in geosmin level within the fish flesh. This is likely due to the dilution effect of pure fresh water within the top of the pond water column being ingested by the fish. Another bloom was not visually evident until the 26th November and the bloom was again Microcystis. It is of note however, that increases in both water and fish geosmin levels had begun a month prior to the bloom being noticeable. Geosmin levels on October 24 were 0.03µg/L and rose steadily to 0.65µg/L by the 21st November. When the Microcystis bloom formed, a fish flesh odour test (see Section 1) confirmed that a high level of taint was present. Hence the pond was again treated with copper (1.5kg/5ML). Immediately after this copper treatment of the pond (30 November), a sharp increase in geosmin in the fish flesh was noted (12.52µg/kg) which was not reflected in the water (0.69µg/L). This could be due to algal cell disruption caused by the copper treatment and the fish ingesting higher quantities of geosmin, as it is known (Jones, unpublished results, 2012) that fish uptake geosmin within minutes and hours (as opposed to days).
The pond used as control in this trial was required for harvest and as the pond showed residual Microcystis bloom with fish exhibiting high flesh geosmin (4.61µg/kg) even
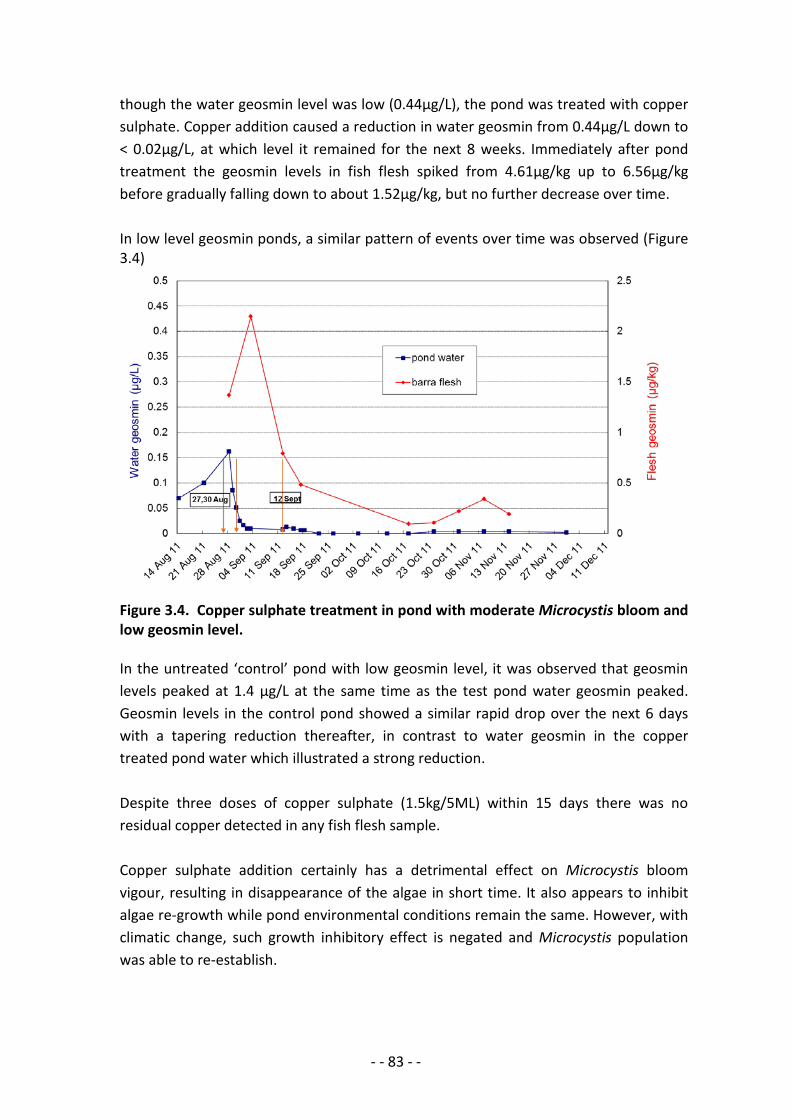
- - 83 - -
though the water geosmin level was low (0.44µg/L), the pond was treated with copper sulphate. Copper addition caused a reduction in water geosmin from 0.44µg/L down to < 0.02µg/L, at which level it remained for the next 8 weeks. Immediately after pond treatment the geosmin levels in fish flesh spiked from 4.61µg/kg up to 6.56µg/kg before gradually falling down to about 1.52µg/kg, but no further decrease over time. In low level geosmin ponds, a similar pattern of events over time was observed (Figure 3.4)
Figure 3.4. Copper sulphate treatment in pond with moderate Microcystis bloom and low geosmin level. In the untreated ‘control’ pond with low geosmin level, it was observed that geosmin levels peaked at 1.4 µg/L at the same time as the test pond water geosmin peaked. Geosmin levels in the control pond showed a similar rapid drop over the next 6 days with a tapering reduction thereafter, in contrast to water geosmin in the copper treated pond water which illustrated a strong reduction. Despite three doses of copper sulphate (1.5kg/5ML) within 15 days there was no residual copper detected in any fish flesh sample. Copper sulphate addition certainly has a detrimental effect on Microcystis bloom vigour, resulting in disappearance of the algae in short time. It also appears to inhibit algae re-growth while pond environmental conditions remain the same. However, with climatic change, such growth inhibitory effect is negated and Microcystis population was able to re-establish.

- - 84 - -
As the algal bloom crashes, there is a corresponding small spike in free geosmin in the water column which then depletes quickly. The geosmin presence in fish reflects that in the water, but with a rather delayed response. This is important where copper sulphate maybe used to ‘clean’ a pond of taint compounds prior to harvest indicating that copper sulphate application must be sufficiently ahead of harvest time to allow fish to reduce levels of geosmin in their flesh. Also careful attention to D.O levels when using any chemical that results in a bloom crash. This can cause sudden drop in D.O. levels that can be detrimental to fish. Regular monitoring during application is essential.
Copper sulphate could be a useful tool with the above considerations, along with careful monitoring of application and overall pond water health.

- - 85 - -
Cyanophage Cyanophage are virus-like entities capable of infecting algal cells and replicating themselves along with the algal DNA. They can have lysogenic or lytic activity against algal cells with the latter causing cell death. Cyanophage are often host specific similar to other bacteriophage and are frequently present in concentrations of greater than 10 million per millilitre of water (Paerl and Otten, 2013). Interest in cyanophages as a bloom-control mechanism is widespread and engendered many investigations for particular applications in both fresh water and marine environments (Hu et al, 2008; Paerl and Otten, 2013, Wilhelm et al, 2006). Similar to actinophages, cyanophages naturally occur in freshwater ponds where cyanobacteria are flourishing and hence can be regarding as a ‘natural’ component of the pond environment. Cyanophages have been suggested as a bioremedial option for controlling phytoplankton in the catfish industry back in 1988 (Smith (1988) and many studies have investigated the use of specific cyanophages active against Microcystis species (Deng and Hayes, 2008; Kim et al, 2007; Stewart and Daft, 1977; Tucker and Pollard, 2005; Yoshida et al 2006, 2008). In open pond barramundi operations in Queensland, we have demonstrated that geosmin is the main off-flavour compound that occurs, with occasional low presence of 2-methyl isoborneol. It is well-documented that the compounds are commonly produced by a range of blue-green algae (frequent colonisers of freshwater systems, for example Anabaena circinalis ). However, none of the blue-green algae commonly associated with geosmin production have been observed NQ barramundi ponds in sufficiently high numbers to be a likely source of the compound. The most common blue-green algae present is Microcystis and this organism is ubiquitous across farms, occasionally with strong blooms. However, Microcystis has not ever been recorded as a geosmin-producer and we demonstrated the same for the species isolated from NQ farms. Research within this project has discovered these compounds originate from actinomycete bacteria present and not the typically reported sources of blue-green algae. In addition however, it was also noted that Microcystis is frequently present when odour and flavour issues occur. Further investigation identified that the taint-producing actinomycetes flourished in association with the Microcystis blooms. In fact, laboratory experiments showed that production of geosmin was far greater when actinomycetes strains were grown in the presence of Microcystis than when grown in monoculture (refer Section 2).
- - 86 - -
As we have clearly shown that actinomycetes associated with Microcystis blooms are responsible for high levels of geosmin production within the pond environments, it was considered that an indirect approach to reducing geosmin production could potentially be employed. If the Microcystis could be removed (bloom crash) then the actinomycetes which appear to be using the algae as an environmental platform to gain optimum growth conditions, would crash with the algae. The actinomycetes will fall to the pond floor along with the dead Microcystis cells and so suffer reduced light and oxygen conditions limiting their proliferation. Several treatments already investigated in this research project (for example: copper sulphate and potassium manganate) are successful in short term crash of Microcystis blooms. However, these treatments are chemical and there is a preference for a “natural” control or mitigation method. One option is to determine whether cyanophage specific to the cyanobacterium Microcystis could be successful. A major benefit with this option is that of the mitigation agent is already present in the pond and therefore not an introduced foreign compound. Trial aim To isolate cyanophage active against Microcystis from the same pond water in which the algae is growing; establish its lytic activity against Microcystis isolated from different farms; increase the phage concentration (titre) under ideal growth conditions and return the solution to the pond as a treatment. The established method for determining phage activity against specific organisms is to grow the host organism under ideal conditions within or on a solid agar medium so as to attain a confluent lawn of growth across the agar plate surface, then inoculate with the test phage. This is highly successful with most bacterial species as target hosts and the assay allows multiple phage to be tested on the one plate of host lawn with clear identifiers of application location. This method has also been used in literature reports for cyanophage studies (Phillips, Monegue and Aldridge, 1990; Tucker and Pollard, 2004). After consultation with the phycology experts at Queensland Health we chose to use MLA broth medium with the inclusion of 15g/L agar to solidify. MLA medium is the standard media QHealth Algal Laboratory uses, as does the Institute for Marine and Antarctic Studies, to isolate and grow all their freshwater algae samples for enumeration and identification. It is a refined medium based on that (BG11) commonly used by many blue-green algal researchers (CCAP, Dunstaffnage Marine Laboratory, UK; Deng and Hayes, 2008; Hargraves 2013; Sangolkar et al, 2009; Tucker and Pollard, 2005).

- - 87 - -
General inoculation method for Microcystis isolates From refrigerated storage, four plates were warmed to room temperature in a laminar flow cabinet. Using a sterile pipette, 0.1ml of a thick Microcystis aeruginosa (IP25) culture was transferred onto the MLA plate and immediately spread over entire surface with sterile glass rod, previously dipped in 70% ethanol, flamed and cooled. Plates were left in the laminar flow to air dry 15min and were sealed with parafilm to avoid dehydration and stored upside down so that condensation could not drip onto the agar surface and cause possible contamination issues. Plates were also sealed in plastic bags with 2 plates placed on a shelf under standard fluorescent light on an 11h daylight setting. The other 2 plates were transferred to QHealth laboratory and incubated in their algae growth cabinet at 23°C with a 12h daylight setting. The QHealth growth cabinet has high intensity growth lights. Plates were observed and opened in the laminar flow cabinet each week to allow oxygen into the plate, then resealed with parafilm. Ten Microcystis cultures from 3 individual NQ farms were isolated and purified to use as ‘bait’ hosts for cyanophage isolation from pond water samples. The next step was to establish a reliable assay for assessment of phage activity. However, despite an abundance of experimental conditions explored we were unsuccessful in this. The hurdle experienced is in obtaining suitable growth of Microcystis strains on solid media. Inoculated plates were observed after 2 weeks incubation and showed visible green colonies on the agar but there was only sparse coverage at this time. After 4 weeks incubation, algal growth was strong but certainly not confluent (Image 3.3). These observations were of the plates held and incubated within the DAFF lab.
Image 3.3. Microcystis growth after 4 weeks incubation at 22oC under fluorescent light (11h/d). Interestingly, the 2 equivalently inoculated MLA plates that were transferred to the Queensland Health algal growth cabinet illustrated a lesser level of colony growth
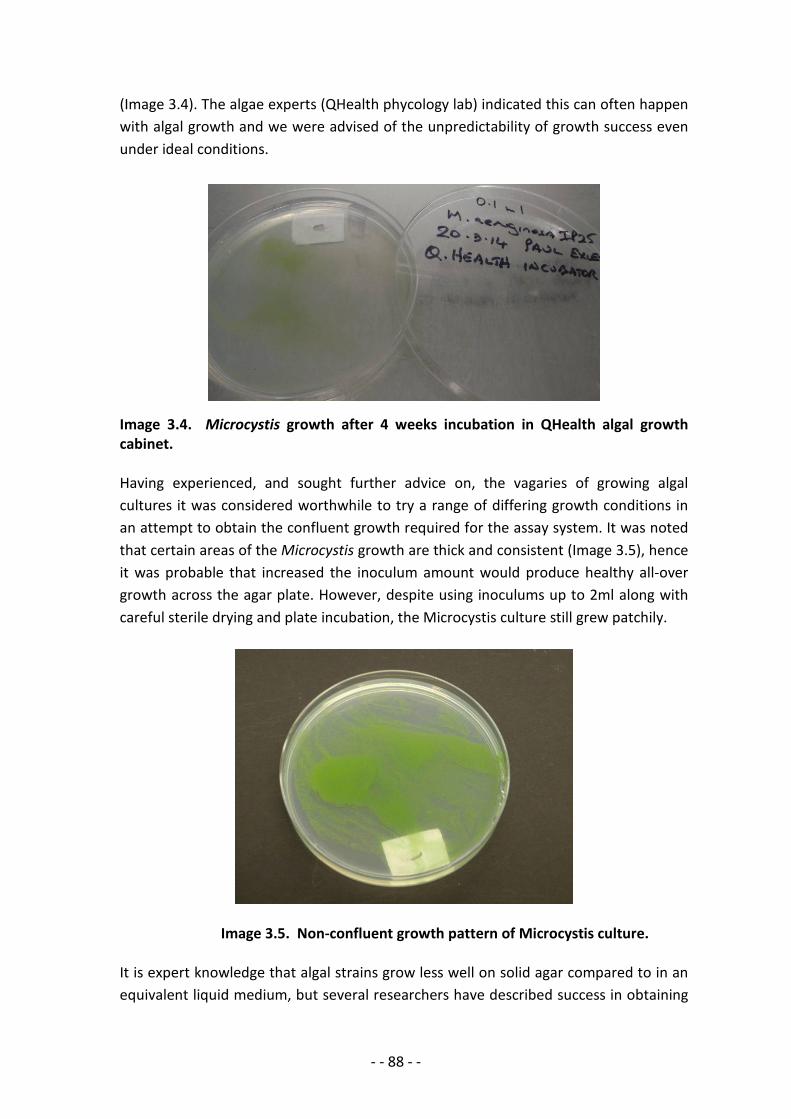
- - 88 - -
(Image 3.4). The algae experts (QHealth phycology lab) indicated this can often happen with algal growth and we were advised of the unpredictability of growth success even under ideal conditions.
Image 3.4. Microcystis growth after 4 weeks incubation in QHealth algal growth cabinet. Having experienced, and sought further advice on, the vagaries of growing algal cultures it was considered worthwhile to try a range of differing growth conditions in an attempt to obtain the confluent growth required for the assay system. It was noted that certain areas of the Microcystis growth are thick and consistent (Image 3.5), hence it was probable that increased the inoculum amount would produce healthy all-over growth across the agar plate. However, despite using inoculums up to 2ml along with careful sterile drying and plate incubation, the Microcystis culture still grew patchily.
Image 3.5. Non-confluent growth pattern of Microcystis culture. It is expert knowledge that algal strains grow less well on solid agar compared to in an equivalent liquid medium, but several researchers have described success in obtaining
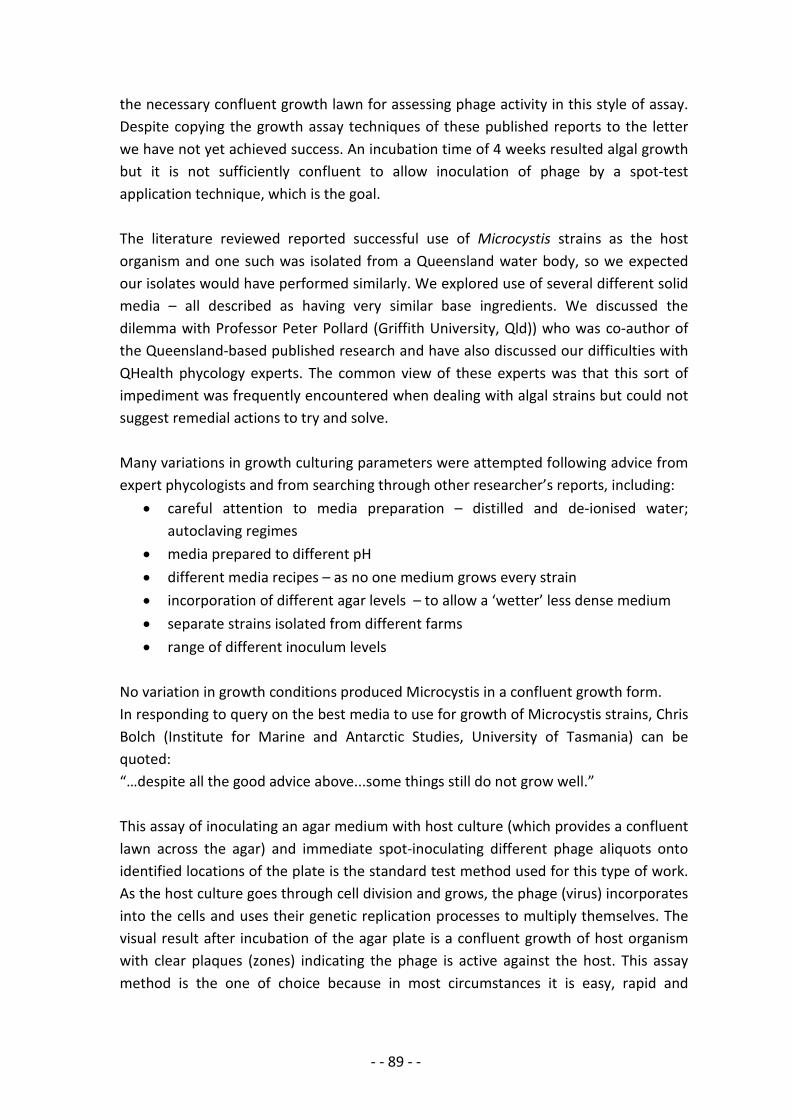
- - 89 - -
the necessary confluent growth lawn for assessing phage activity in this style of assay. Despite copying the growth assay techniques of these published reports to the letter we have not yet achieved success. An incubation time of 4 weeks resulted algal growth but it is not sufficiently confluent to allow inoculation of phage by a spot-test application technique, which is the goal. The literature reviewed reported successful use of Microcystis strains as the host organism and one such was isolated from a Queensland water body, so we expected our isolates would have performed similarly. We explored use of several different solid media – all described as having very similar base ingredients. We discussed the dilemma with Professor Peter Pollard (Griffith University, Qld)) who was co-author of the Queensland-based published research and have also discussed our difficulties with QHealth phycology experts. The common view of these experts was that this sort of impediment was frequently encountered when dealing with algal strains but could not suggest remedial actions to try and solve. Many variations in growth culturing parameters were attempted following advice from expert phycologists and from searching through other researcher’s reports, including:
• careful attention to media preparation – distilled and de-ionised water; autoclaving regimes
• media prepared to different pH • different media recipes – as no one medium grows every strain • incorporation of different agar levels – to allow a ‘wetter’ less dense medium • separate strains isolated from different farms • range of different inoculum levels
No variation in growth conditions produced Microcystis in a confluent growth form. In responding to query on the best media to use for growth of Microcystis strains, Chris Bolch (Institute for Marine and Antarctic Studies, University of Tasmania) can be quoted: “…despite all the good advice above...some things still do not grow well.” This assay of inoculating an agar medium with host culture (which provides a confluent lawn across the agar) and immediate spot-inoculating different phage aliquots onto identified locations of the plate is the standard test method used for this type of work. As the host culture goes through cell division and grows, the phage (virus) incorporates into the cells and uses their genetic replication processes to multiply themselves. The visual result after incubation of the agar plate is a confluent growth of host organism with clear plaques (zones) indicating the phage is active against the host. This assay method is the one of choice because in most circumstances it is easy, rapid and

- - 90 - -
provides clear results. Therefore, being unable to attain acceptable growth with the host culture was very frustrating. To circumvent the hurdle of unsuccessful and slow growth of Microcystis on solid media, an alternative liquid assay system was considered. This involved growing the host Microcystis in small aliquots of MLA broth medium, inoculating with test phage and monitoring algal cell multiplication (or inhibition) by spectrophotometric optical density. Another alternative was to develop a microtitre plate method also based on liquid media. However, the nature of growth habit of Microcystis cultures is flocculate and form clumps which inherently negates the accuracy of spectrophotometry for measuring cell proliferation. Again we were thwarted. Currently, the only way we have to identify phage activity against Microcystis is a somewhat subjective unsophisticated method of inoculating actively-growing Microcystis cultures with test phage and monitoring for visible signs of whole culture death illustrated by change of colour of the culture from vibrant green to yellow to brown, with final fall-out of solution as bottom detritus. While this method is suitable for a few limited purposes, there is no ability to isolate separate phage inoculated nor determine specific activity of phage. Hence it is not a method that can be used to develop cyanophage treatment solution. To progress research with cyanophage as a remedial treatment against Microcystis blooms in ponds, an essential first step is to have an accurate effective assay method to determine phage activity. As yet we have not been able to achieve this. However should an assay method be developed, the concept of using cyanophage as a mitigation tool is worth pursuing. Efforts to develop and refine an assay system for the area of research are continuing at USC, with the kind assistance if Dr Kurtboke and her students.
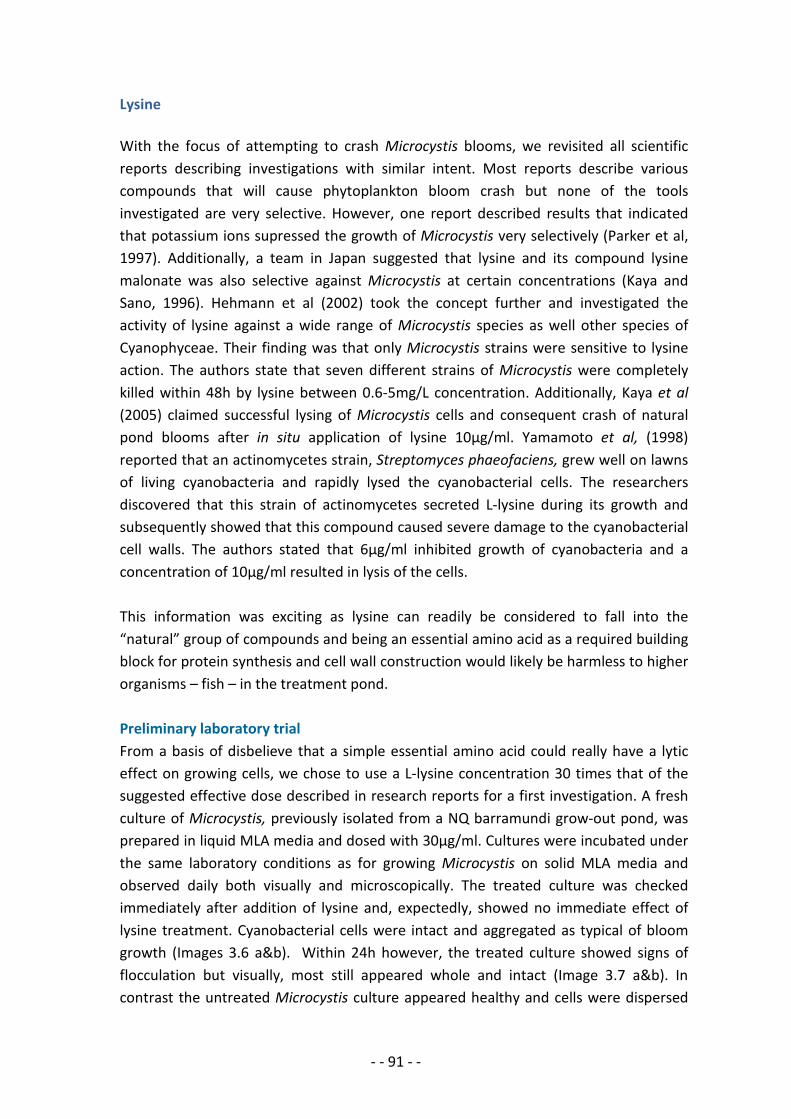
- - 91 - -
Lysine With the focus of attempting to crash Microcystis blooms, we revisited all scientific reports describing investigations with similar intent. Most reports describe various compounds that will cause phytoplankton bloom crash but none of the tools investigated are very selective. However, one report described results that indicated that potassium ions supressed the growth of Microcystis very selectively (Parker et al, 1997). Additionally, a team in Japan suggested that lysine and its compound lysine malonate was also selective against Microcystis at certain concentrations (Kaya and Sano, 1996). Hehmann et al (2002) took the concept further and investigated the activity of lysine against a wide range of Microcystis species as well other species of Cyanophyceae. Their finding was that only Microcystis strains were sensitive to lysine action. The authors state that seven different strains of Microcystis were completely killed within 48h by lysine between 0.6-5mg/L concentration. Additionally, Kaya et al (2005) claimed successful lysing of Microcystis cells and consequent crash of natural pond blooms after in situ application of lysine 10µg/ml. Yamamoto et al, (1998) reported that an actinomycetes strain, Streptomyces phaeofaciens, grew well on lawns of living cyanobacteria and rapidly lysed the cyanobacterial cells. The researchers discovered that this strain of actinomycetes secreted L-lysine during its growth and subsequently showed that this compound caused severe damage to the cyanobacterial cell walls. The authors stated that 6µg/ml inhibited growth of cyanobacteria and a concentration of 10µg/ml resulted in lysis of the cells. This information was exciting as lysine can readily be considered to fall into the “natural” group of compounds and being an essential amino acid as a required building block for protein synthesis and cell wall construction would likely be harmless to higher organisms – fish – in the treatment pond. Preliminary laboratory trial From a basis of disbelieve that a simple essential amino acid could really have a lytic effect on growing cells, we chose to use a L-lysine concentration 30 times that of the suggested effective dose described in research reports for a first investigation. A fresh culture of Microcystis, previously isolated from a NQ barramundi grow-out pond, was prepared in liquid MLA media and dosed with 30µg/ml. Cultures were incubated under the same laboratory conditions as for growing Microcystis on solid MLA media and observed daily both visually and microscopically. The treated culture was checked immediately after addition of lysine and, expectedly, showed no immediate effect of lysine treatment. Cyanobacterial cells were intact and aggregated as typical of bloom growth (Images 3.6 a&b). Within 24h however, the treated culture showed signs of flocculation but visually, most still appeared whole and intact (Image 3.7 a&b). In contrast the untreated Microcystis culture appeared healthy and cells were dispersed

- - 92 - -
throughout the liquid growth medium, typical of a happily growing culture. After 48h incubation differences between the culture bottles were obvious with lysine clearly having an effect (Images 3.8 a&b).
Image 3.6a. Microcystis cultures Plate 3.6b. Microcystis cell culture
Image 3.7b. Treated Microcystis culture
Day 0
Day 1
Day 2
Plate 3.7a. Microcystis cultures
Plate 3.8a. Microcystis cultures
Plate 3.8b. Treated Microcystis culture
Day 5
Image 3.9a. Microcystis cultures Plate 3.9b. Treated Microcystis culture (x400)
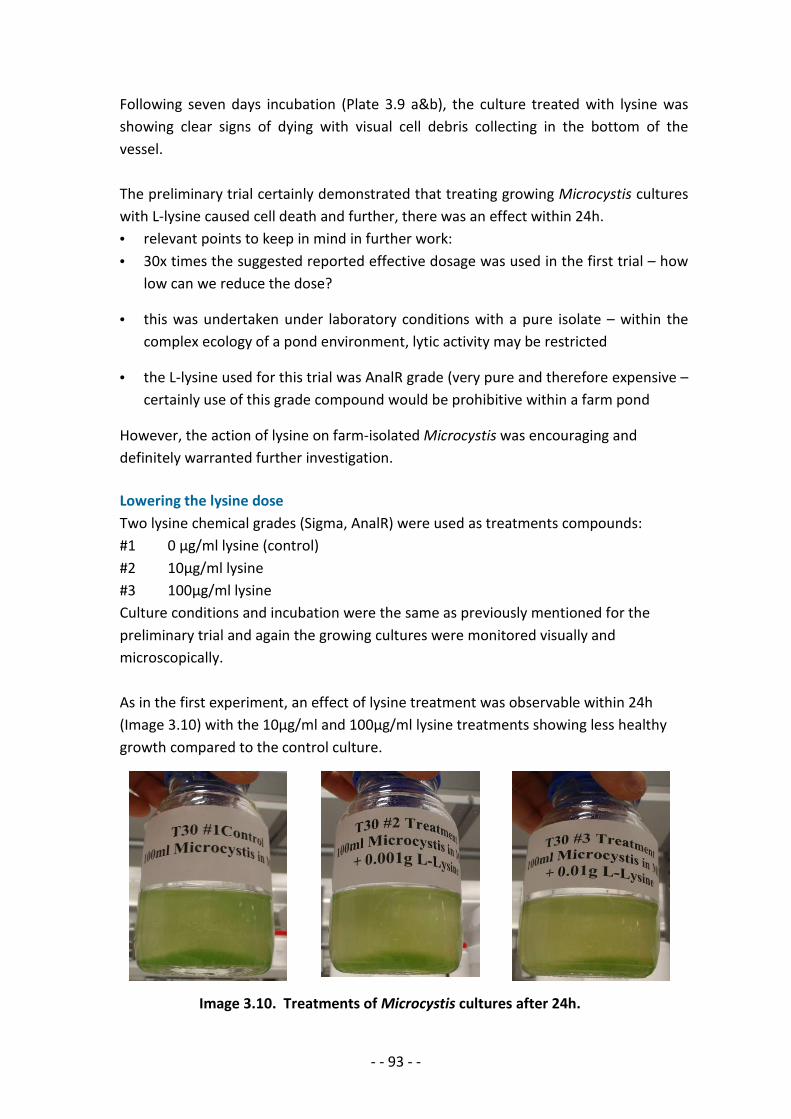
- - 93 - -
Following seven days incubation (Plate 3.9 a&b), the culture treated with lysine was showing clear signs of dying with visual cell debris collecting in the bottom of the vessel. The preliminary trial certainly demonstrated that treating growing Microcystis cultures with L-lysine caused cell death and further, there was an effect within 24h. • relevant points to keep in mind in further work: • 30x times the suggested reported effective dosage was used in the first trial – how
low can we reduce the dose?
• this was undertaken under laboratory conditions with a pure isolate – within the complex ecology of a pond environment, lytic activity may be restricted
• the L-lysine used for this trial was AnalR grade (very pure and therefore expensive – certainly use of this grade compound would be prohibitive within a farm pond
However, the action of lysine on farm-isolated Microcystis was encouraging and definitely warranted further investigation. Lowering the lysine dose Two lysine chemical grades (Sigma, AnalR) were used as treatments compounds: #1 0 µg/ml lysine (control) #2 10µg/ml lysine #3 100µg/ml lysine Culture conditions and incubation were the same as previously mentioned for the preliminary trial and again the growing cultures were monitored visually and microscopically. As in the first experiment, an effect of lysine treatment was observable within 24h (Image 3.10) with the 10µg/ml and 100µg/ml lysine treatments showing less healthy growth compared to the control culture. Image 3.10. Treatments of Microcystis cultures after 24h.
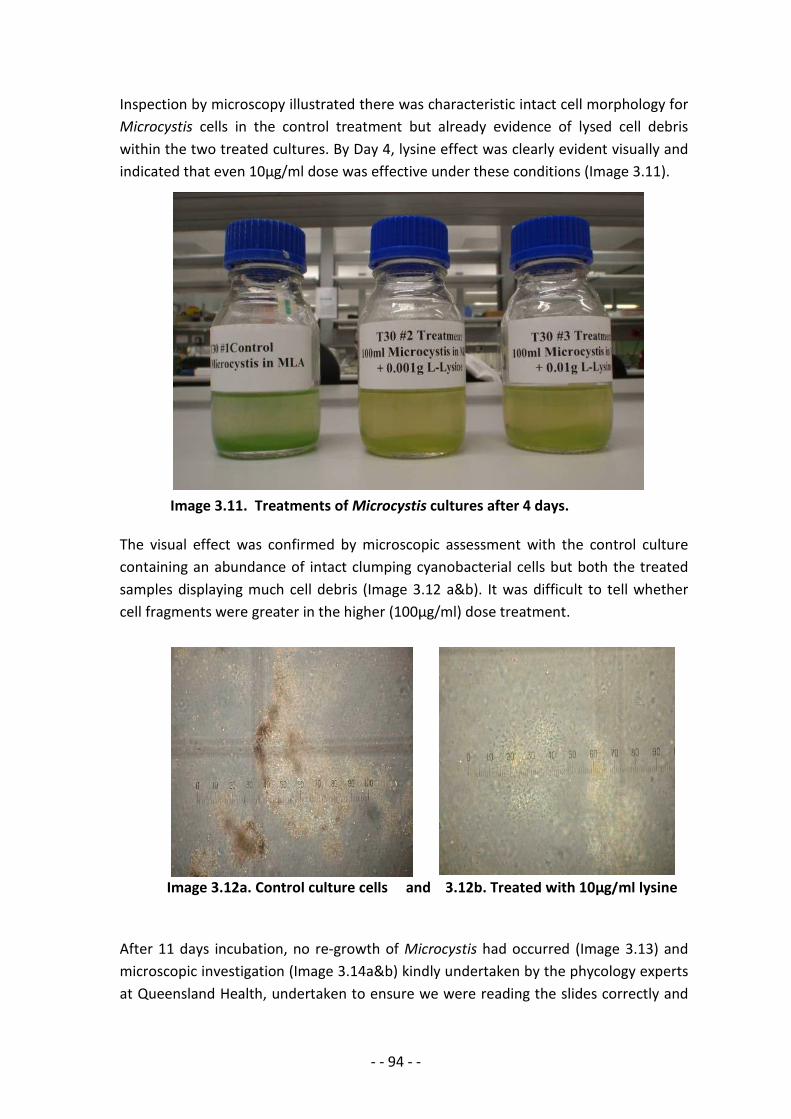
- - 94 - -
Inspection by microscopy illustrated there was characteristic intact cell morphology for Microcystis cells in the control treatment but already evidence of lysed cell debris within the two treated cultures. By Day 4, lysine effect was clearly evident visually and indicated that even 10µg/ml dose was effective under these conditions (Image 3.11). Image 3.11. Treatments of Microcystis cultures after 4 days. The visual effect was confirmed by microscopic assessment with the control culture containing an abundance of intact clumping cyanobacterial cells but both the treated samples displaying much cell debris (Image 3.12 a&b). It was difficult to tell whether cell fragments were greater in the higher (100µg/ml) dose treatment. Image 3.12a. Control culture cells and 3.12b. Treated with 10µg/ml lysine After 11 days incubation, no re-growth of Microcystis had occurred (Image 3.13) and microscopic investigation (Image 3.14a&b) kindly undertaken by the phycology experts at Queensland Health, undertaken to ensure we were reading the slides correctly and
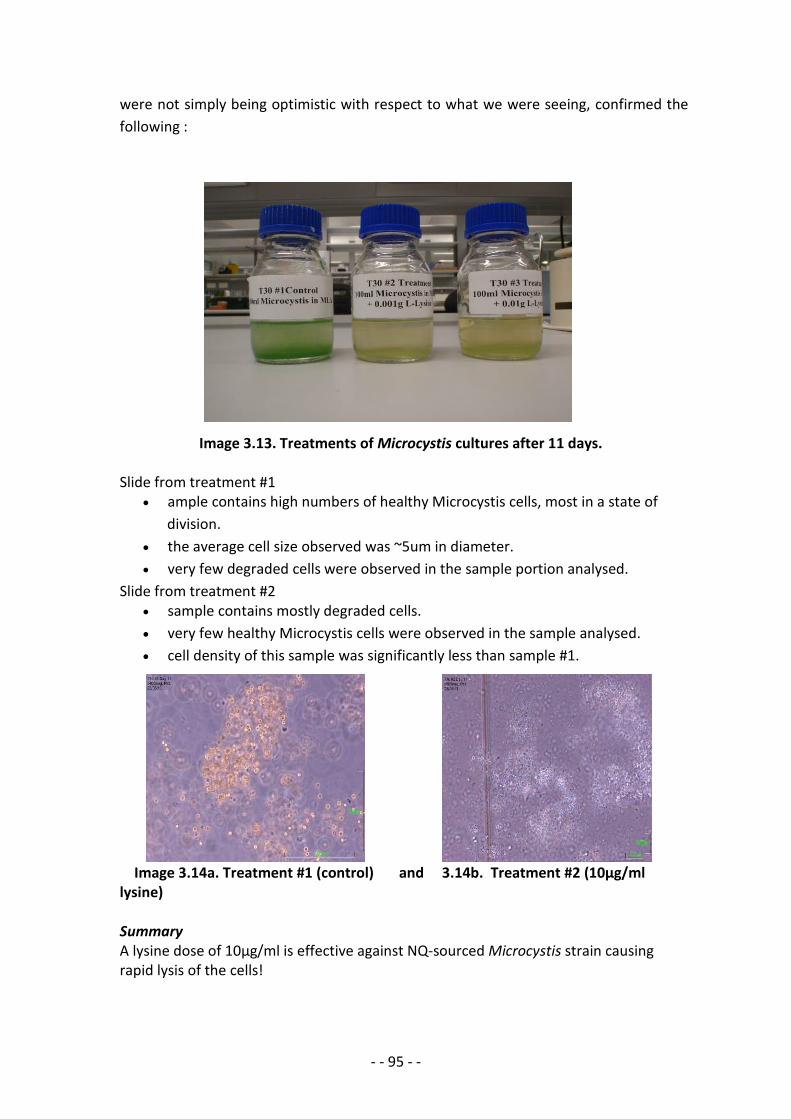
- - 95 - -
were not simply being optimistic with respect to what we were seeing, confirmed the following : Image 3.13. Treatments of Microcystis cultures after 11 days. Slide from treatment #1
• ample contains high numbers of healthy Microcystis cells, most in a state of division.
• the average cell size observed was ~5um in diameter. • very few degraded cells were observed in the sample portion analysed.
Slide from treatment #2 • sample contains mostly degraded cells. • very few healthy Microcystis cells were observed in the sample analysed. • cell density of this sample was significantly less than sample #1.
Image 3.14a. Treatment #1 (control) and 3.14b. Treatment #2 (10µg/ml lysine) Summary A lysine dose of 10µg/ml is effective against NQ-sourced Microcystis strain causing rapid lysis of the cells!
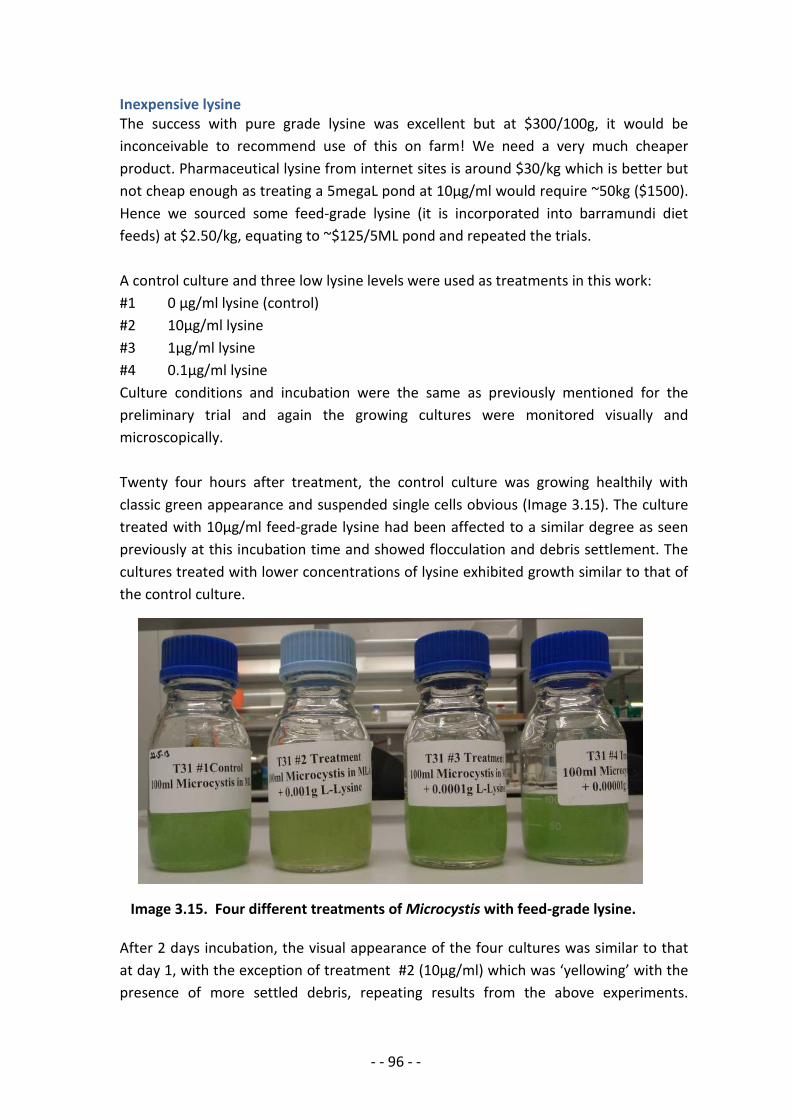
- - 96 - -
Inexpensive lysine The success with pure grade lysine was excellent but at $300/100g, it would be inconceivable to recommend use of this on farm! We need a very much cheaper product. Pharmaceutical lysine from internet sites is around $30/kg which is better but not cheap enough as treating a 5megaL pond at 10µg/ml would require ~50kg ($1500). Hence we sourced some feed-grade lysine (it is incorporated into barramundi diet feeds) at $2.50/kg, equating to ~$125/5ML pond and repeated the trials. A control culture and three low lysine levels were used as treatments in this work: #1 0 µg/ml lysine (control) #2 10µg/ml lysine #3 1µg/ml lysine #4 0.1µg/ml lysine Culture conditions and incubation were the same as previously mentioned for the preliminary trial and again the growing cultures were monitored visually and microscopically. Twenty four hours after treatment, the control culture was growing healthily with classic green appearance and suspended single cells obvious (Image 3.15). The culture treated with 10µg/ml feed-grade lysine had been affected to a similar degree as seen previously at this incubation time and showed flocculation and debris settlement. The cultures treated with lower concentrations of lysine exhibited growth similar to that of the control culture. Image 3.15. Four different treatments of Microcystis with feed-grade lysine. After 2 days incubation, the visual appearance of the four cultures was similar to that at day 1, with the exception of treatment #2 (10µg/ml) which was ‘yellowing’ with the presence of more settled debris, repeating results from the above experiments.
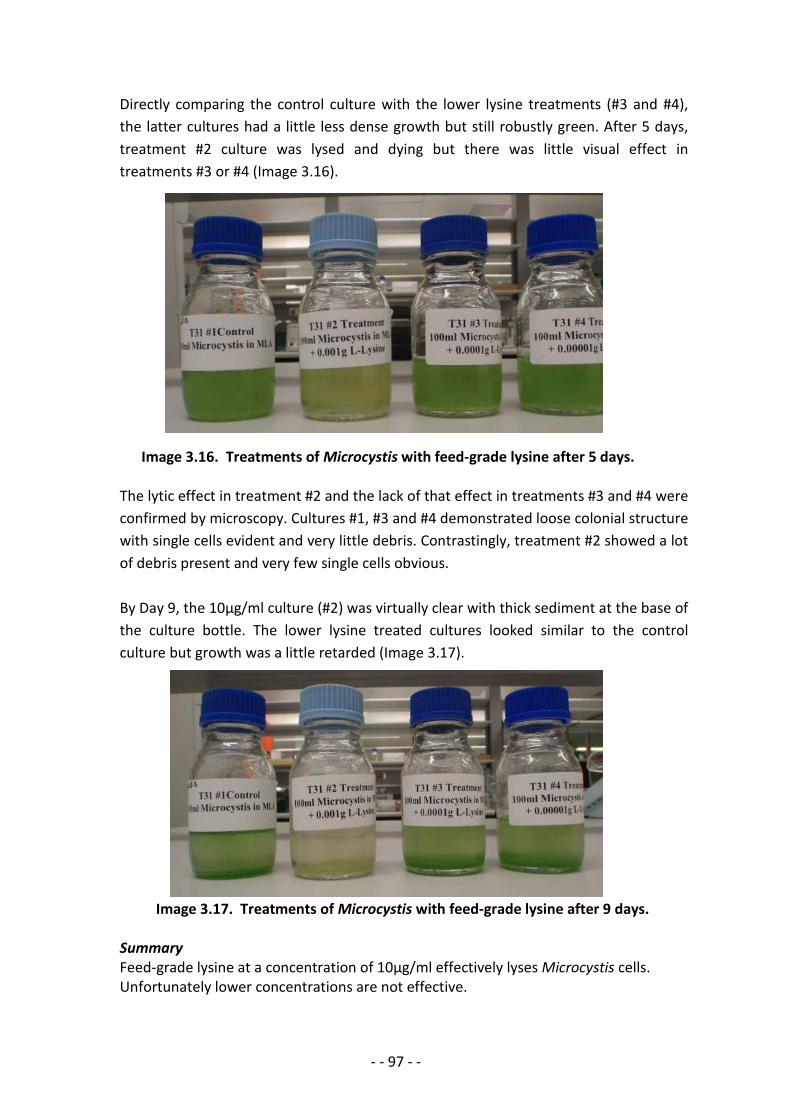
- - 97 - -
Directly comparing the control culture with the lower lysine treatments (#3 and #4), the latter cultures had a little less dense growth but still robustly green. After 5 days, treatment #2 culture was lysed and dying but there was little visual effect in treatments #3 or #4 (Image 3.16).
Image 3.16. Treatments of Microcystis with feed-grade lysine after 5 days. The lytic effect in treatment #2 and the lack of that effect in treatments #3 and #4 were confirmed by microscopy. Cultures #1, #3 and #4 demonstrated loose colonial structure with single cells evident and very little debris. Contrastingly, treatment #2 showed a lot of debris present and very few single cells obvious. By Day 9, the 10µg/ml culture (#2) was virtually clear with thick sediment at the base of the culture bottle. The lower lysine treated cultures looked similar to the control culture but growth was a little retarded (Image 3.17). Image 3.17. Treatments of Microcystis with feed-grade lysine after 9 days. Summary Feed-grade lysine at a concentration of 10µg/ml effectively lyses Microcystis cells. Unfortunately lower concentrations are not effective.

- - 98 - -
Lysine treatment in situ All investigations had demonstrated that lysine is an effective agent capable of lysing Microcystis cells and therefore likely to be able to crash a natural bloom. However, there is large difference between a laboratory experiment carried with pure cultures and treatment a water body that has a complex ecology present. We had the opportunity to trial L-Lysine against Microcystis in a dam at Crows Nest, southeast Queensland. The property owner gave permission for the treatment and commented that the dam has had sporadic Microcystis blooms (visual observation only) since it was built approximately 12 months previously. The owner noticed that odour taints similar to geosmin and methyl isoborneol were evident at times. The dam holds no known live animals and is not used for human or stock drinking water. There is only natural farm run off into the dam and no other chemicals have been added to attempt to treat the dam. The dam was dosed at 10µg/ml by manual pouring of solution into the water. The dam has no aeration or mechanical mixing other than from natural wind movement and the occasional dog jumping in. Observations included: Microcystis presence; geosmin or taint odour; water pH; water samples taken for taint compound analysis. At the time of trial (Day 0), the dam water had no visual Microcystis slick (Image 3.18) and no detectable odour. Water pH was 8.6. Image 3.18. Dam at Crows Nest, Queensland Microscopy showed Microcystis was indeed present but in very low level. Cells exhibited thick mucilage and a large amount of either debris or bacteria within and around the mucilage, similar to samples obtained from NQ barramundi farms. Post-treatment (Day 1), water pH was 8.2, no visual Microcystis, no detectable geosmin odour and treatment had not changed the turbidity of the dam water. The sample under the microscope had on Microcystis present but background debris appeared much lighter. After 48h, water pH had dropped to 7.75 with other parameters remaining the same. Microscopy did not show Microcystis present but did illuminate Anabaena species.
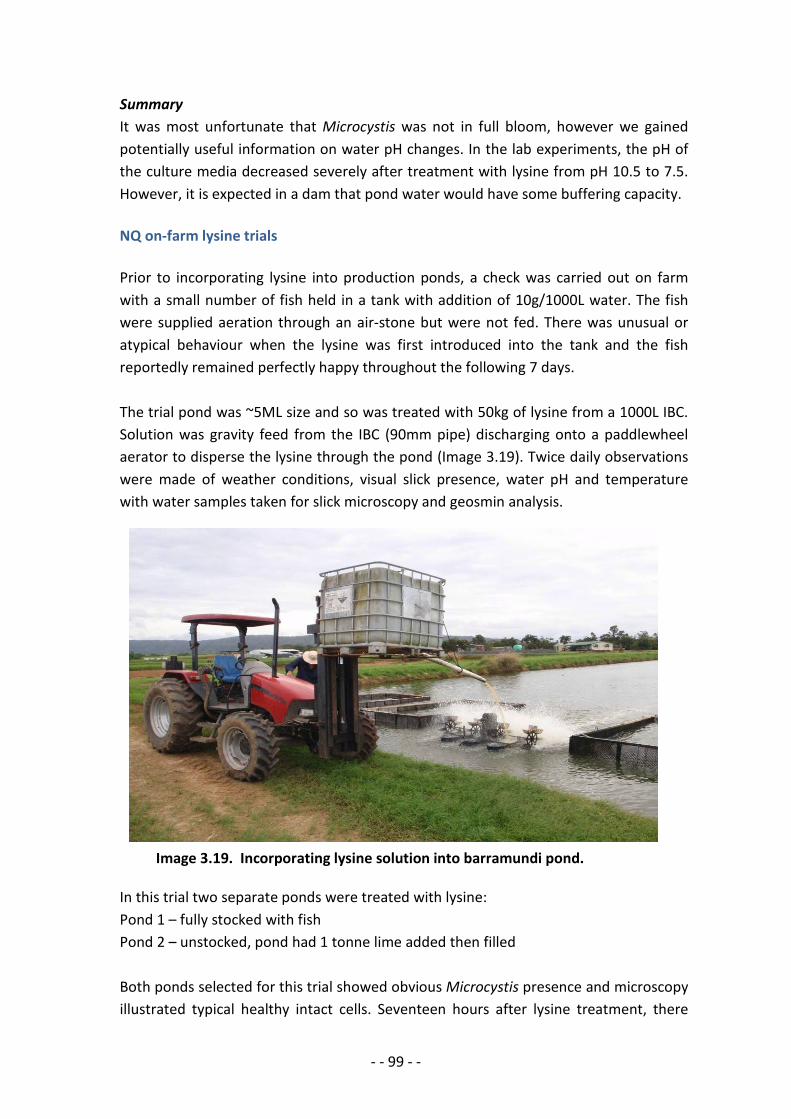
- - 99 - -
Summary It was most unfortunate that Microcystis was not in full bloom, however we gained potentially useful information on water pH changes. In the lab experiments, the pH of the culture media decreased severely after treatment with lysine from pH 10.5 to 7.5. However, it is expected in a dam that pond water would have some buffering capacity. NQ on-farm lysine trials Prior to incorporating lysine into production ponds, a check was carried out on farm with a small number of fish held in a tank with addition of 10g/1000L water. The fish were supplied aeration through an air-stone but were not fed. There was unusual or atypical behaviour when the lysine was first introduced into the tank and the fish reportedly remained perfectly happy throughout the following 7 days. The trial pond was ~5ML size and so was treated with 50kg of lysine from a 1000L IBC. Solution was gravity feed from the IBC (90mm pipe) discharging onto a paddlewheel aerator to disperse the lysine through the pond (Image 3.19). Twice daily observations were made of weather conditions, visual slick presence, water pH and temperature with water samples taken for slick microscopy and geosmin analysis. Image 3.19. Incorporating lysine solution into barramundi pond. In this trial two separate ponds were treated with lysine: Pond 1 – fully stocked with fish Pond 2 – unstocked, pond had 1 tonne lime added then filled Both ponds selected for this trial showed obvious Microcystis presence and microscopy illustrated typical healthy intact cells. Seventeen hours after lysine treatment, there
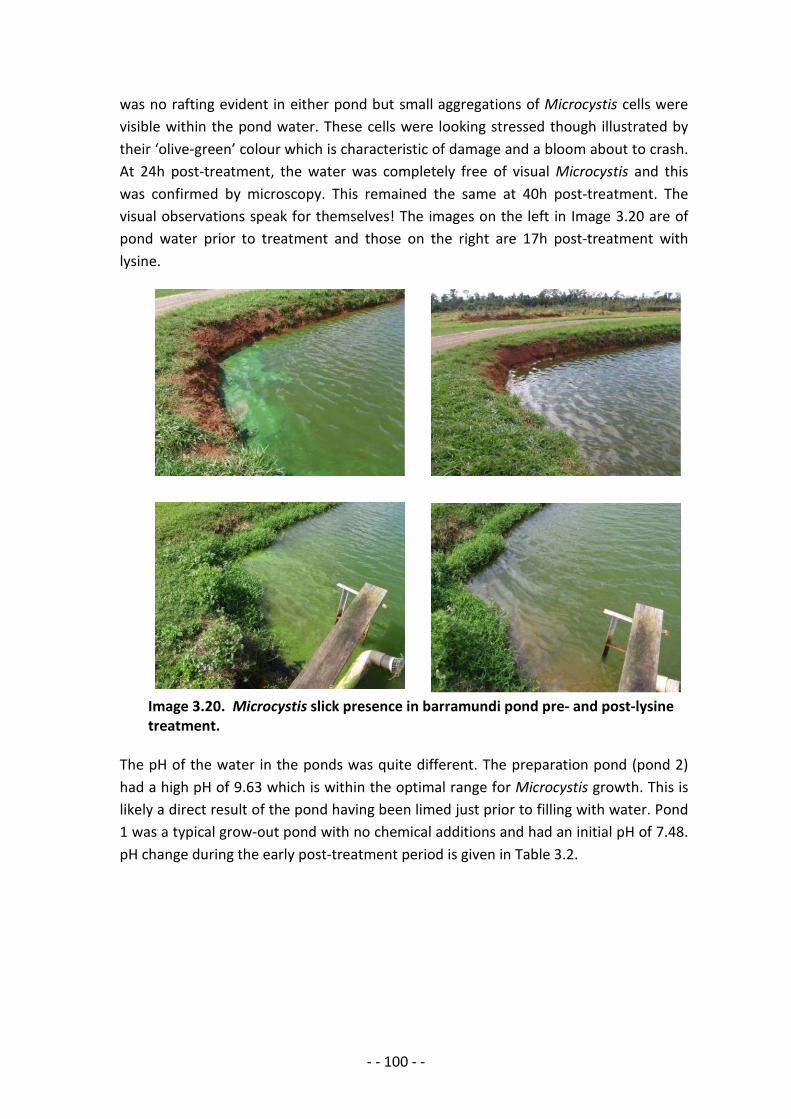
- - 100 - -
was no rafting evident in either pond but small aggregations of Microcystis cells were visible within the pond water. These cells were looking stressed though illustrated by their ‘olive-green’ colour which is characteristic of damage and a bloom about to crash. At 24h post-treatment, the water was completely free of visual Microcystis and this was confirmed by microscopy. This remained the same at 40h post-treatment. The visual observations speak for themselves! The images on the left in Image 3.20 are of pond water prior to treatment and those on the right are 17h post-treatment with lysine.
Image 3.20. Microcystis slick presence in barramundi pond pre- and post-lysine treatment.
The pH of the water in the ponds was quite different. The preparation pond (pond 2) had a high pH of 9.63 which is within the optimal range for Microcystis growth. This is likely a direct result of the pond having been limed just prior to filling with water. Pond 1 was a typical grow-out pond with no chemical additions and had an initial pH of 7.48. pH change during the early post-treatment period is given in Table 3.2.
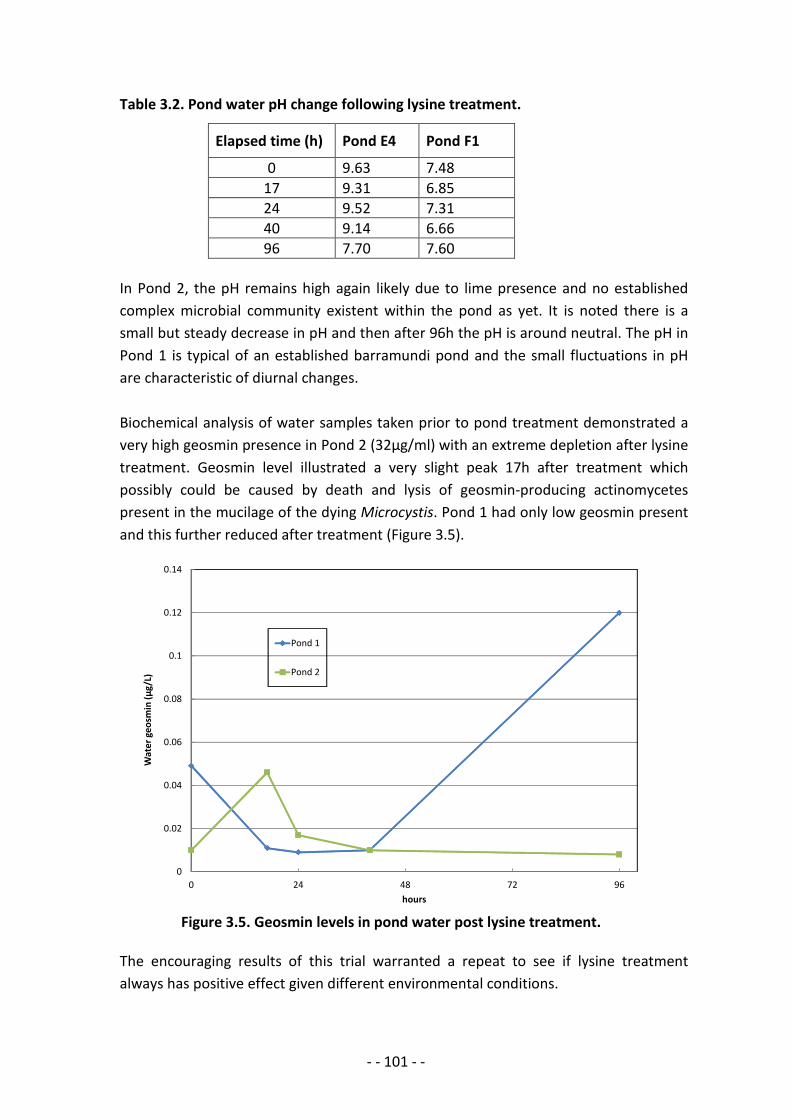
- - 101 - -
Table 3.2. Pond water pH change following lysine treatment.
Elapsed time (h) Pond E4 Pond F1
0 9.63 7.48 17 9.31 6.85 24 9.52 7.31 40 9.14 6.66 96 7.70 7.60
In Pond 2, the pH remains high again likely due to lime presence and no established complex microbial community existent within the pond as yet. It is noted there is a small but steady decrease in pH and then after 96h the pH is around neutral. The pH in Pond 1 is typical of an established barramundi pond and the small fluctuations in pH are characteristic of diurnal changes. Biochemical analysis of water samples taken prior to pond treatment demonstrated a very high geosmin presence in Pond 2 (32µg/ml) with an extreme depletion after lysine treatment. Geosmin level illustrated a very slight peak 17h after treatment which possibly could be caused by death and lysis of geosmin-producing actinomycetes present in the mucilage of the dying Microcystis. Pond 1 had only low geosmin present and this further reduced after treatment (Figure 3.5).
Figure 3.5. Geosmin levels in pond water post lysine treatment. The encouraging results of this trial warranted a repeat to see if lysine treatment always has positive effect given different environmental conditions.
0
0.02
0.04
0.06
0.08
0.1
0.12
0.14
0 24 48 72 96
Wat
er g
eosm
in (µ
g/L)
hours
Pond 1
Pond 2
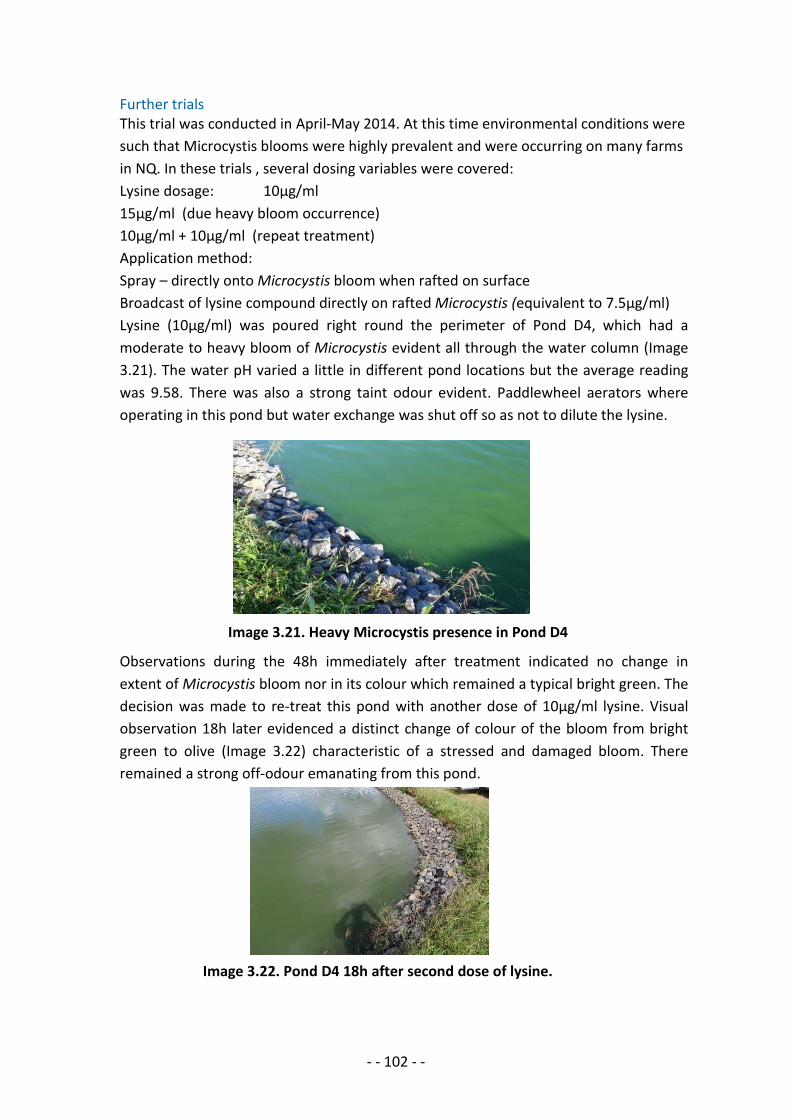
- - 102 - -
Further trials This trial was conducted in April-May 2014. At this time environmental conditions were such that Microcystis blooms were highly prevalent and were occurring on many farms in NQ. In these trials , several dosing variables were covered: Lysine dosage: 10µg/ml 15µg/ml (due heavy bloom occurrence) 10µg/ml + 10µg/ml (repeat treatment) Application method: Spray – directly onto Microcystis bloom when rafted on surface Broadcast of lysine compound directly on rafted Microcystis (equivalent to 7.5µg/ml) Lysine (10µg/ml) was poured right round the perimeter of Pond D4, which had a moderate to heavy bloom of Microcystis evident all through the water column (Image 3.21). The water pH varied a little in different pond locations but the average reading was 9.58. There was also a strong taint odour evident. Paddlewheel aerators where operating in this pond but water exchange was shut off so as not to dilute the lysine. Image 3.21. Heavy Microcystis presence in Pond D4
Observations during the 48h immediately after treatment indicated no change in extent of Microcystis bloom nor in its colour which remained a typical bright green. The decision was made to re-treat this pond with another dose of 10µg/ml lysine. Visual observation 18h later evidenced a distinct change of colour of the bloom from bright green to olive (Image 3.22) characteristic of a stressed and damaged bloom. There remained a strong off-odour emanating from this pond. Image 3.22. Pond D4 18h after second dose of lysine.
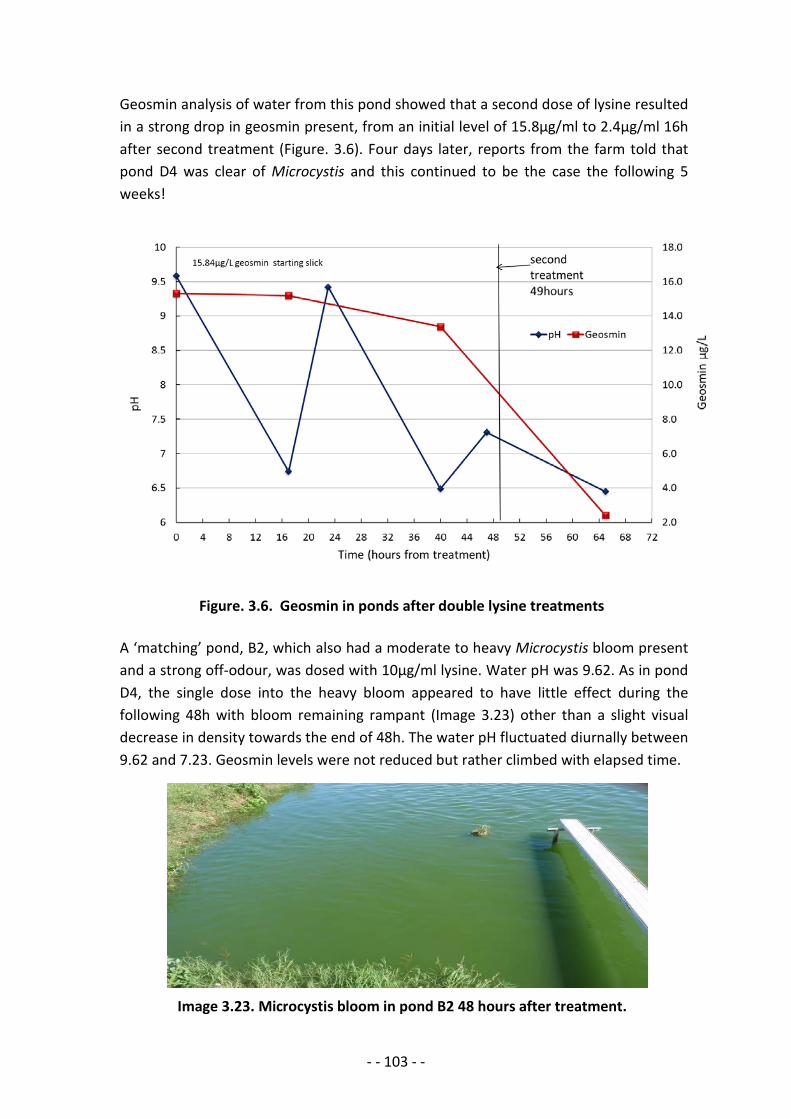
- - 103 - -
Geosmin analysis of water from this pond showed that a second dose of lysine resulted in a strong drop in geosmin present, from an initial level of 15.8µg/ml to 2.4µg/ml 16h after second treatment (Figure. 3.6). Four days later, reports from the farm told that pond D4 was clear of Microcystis and this continued to be the case the following 5 weeks!
Figure. 3.6. Geosmin in ponds after double lysine treatments A ‘matching’ pond, B2, which also had a moderate to heavy Microcystis bloom present and a strong off-odour, was dosed with 10µg/ml lysine. Water pH was 9.62. As in pond D4, the single dose into the heavy bloom appeared to have little effect during the following 48h with bloom remaining rampant (Image 3.23) other than a slight visual decrease in density towards the end of 48h. The water pH fluctuated diurnally between 9.62 and 7.23. Geosmin levels were not reduced but rather climbed with elapsed time.
Image 3.23. Microcystis bloom in pond B2 48 hours after treatment.
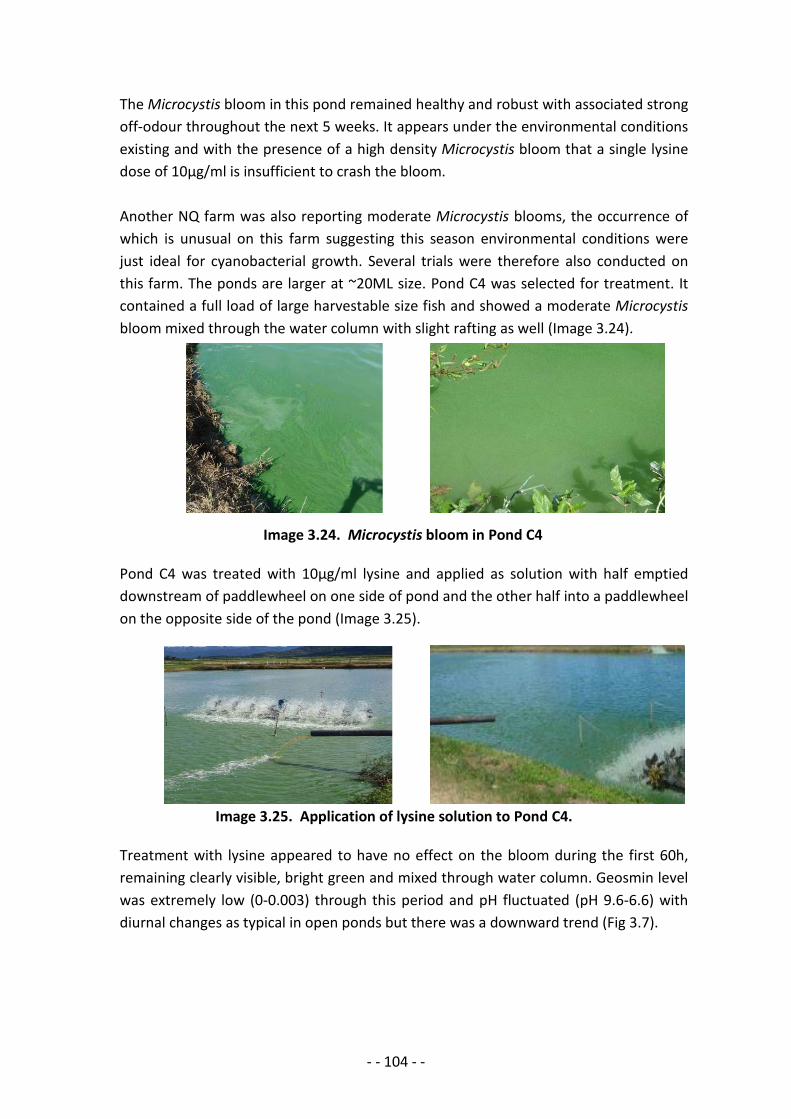
- - 104 - -
The Microcystis bloom in this pond remained healthy and robust with associated strong off-odour throughout the next 5 weeks. It appears under the environmental conditions existing and with the presence of a high density Microcystis bloom that a single lysine dose of 10µg/ml is insufficient to crash the bloom. Another NQ farm was also reporting moderate Microcystis blooms, the occurrence of which is unusual on this farm suggesting this season environmental conditions were just ideal for cyanobacterial growth. Several trials were therefore also conducted on this farm. The ponds are larger at ~20ML size. Pond C4 was selected for treatment. It contained a full load of large harvestable size fish and showed a moderate Microcystis bloom mixed through the water column with slight rafting as well (Image 3.24).
Image 3.24. Microcystis bloom in Pond C4 Pond C4 was treated with 10µg/ml lysine and applied as solution with half emptied downstream of paddlewheel on one side of pond and the other half into a paddlewheel on the opposite side of the pond (Image 3.25).
Image 3.25. Application of lysine solution to Pond C4. Treatment with lysine appeared to have no effect on the bloom during the first 60h, remaining clearly visible, bright green and mixed through water column. Geosmin level was extremely low (0-0.003) through this period and pH fluctuated (pH 9.6-6.6) with diurnal changes as typical in open ponds but there was a downward trend (Fig 3.7).
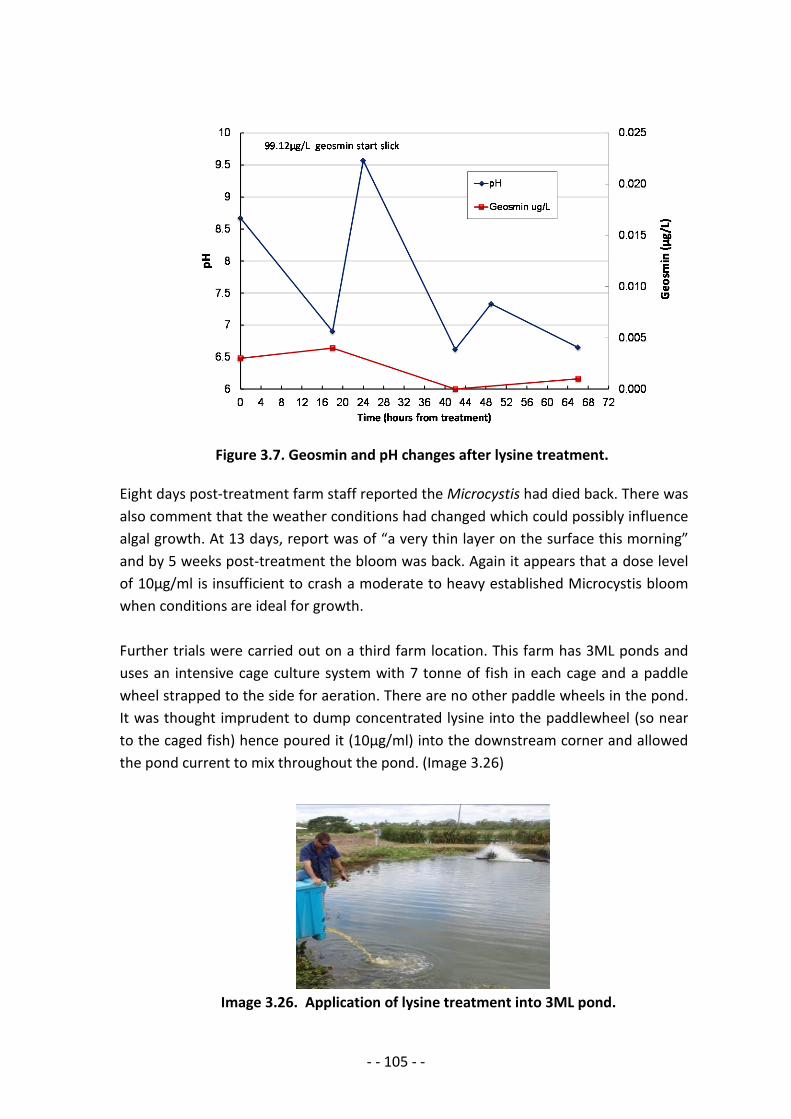
- - 105 - -
Figure 3.7. Geosmin and pH changes after lysine treatment. Eight days post-treatment farm staff reported the Microcystis had died back. There was also comment that the weather conditions had changed which could possibly influence algal growth. At 13 days, report was of “a very thin layer on the surface this morning” and by 5 weeks post-treatment the bloom was back. Again it appears that a dose level of 10µg/ml is insufficient to crash a moderate to heavy established Microcystis bloom when conditions are ideal for growth. Further trials were carried out on a third farm location. This farm has 3ML ponds and uses an intensive cage culture system with 7 tonne of fish in each cage and a paddle wheel strapped to the side for aeration. There are no other paddle wheels in the pond. It was thought imprudent to dump concentrated lysine into the paddlewheel (so near to the caged fish) hence poured it (10µg/ml) into the downstream corner and allowed the pond current to mix throughout the pond. (Image 3.26) Image 3.26. Application of lysine treatment into 3ML pond.
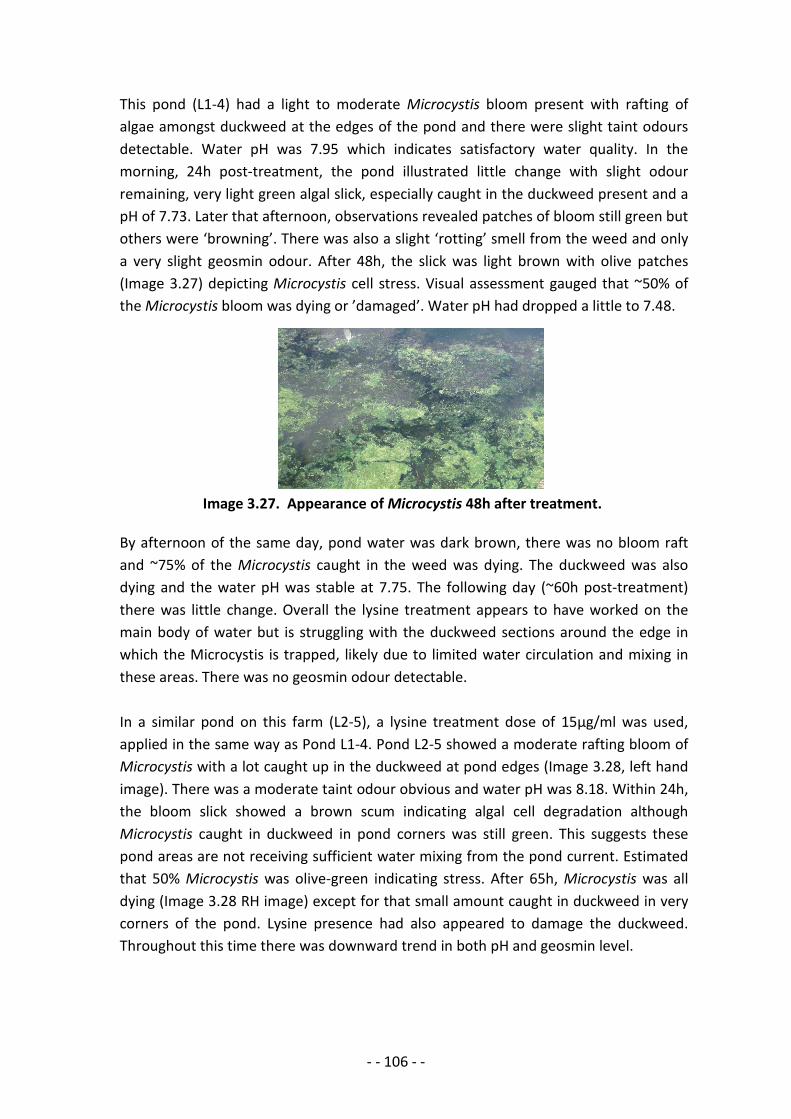
- - 106 - -
This pond (L1-4) had a light to moderate Microcystis bloom present with rafting of algae amongst duckweed at the edges of the pond and there were slight taint odours detectable. Water pH was 7.95 which indicates satisfactory water quality. In the morning, 24h post-treatment, the pond illustrated little change with slight odour remaining, very light green algal slick, especially caught in the duckweed present and a pH of 7.73. Later that afternoon, observations revealed patches of bloom still green but others were ‘browning’. There was also a slight ‘rotting’ smell from the weed and only a very slight geosmin odour. After 48h, the slick was light brown with olive patches (Image 3.27) depicting Microcystis cell stress. Visual assessment gauged that ~50% of the Microcystis bloom was dying or ’damaged’. Water pH had dropped a little to 7.48. Image 3.27. Appearance of Microcystis 48h after treatment. By afternoon of the same day, pond water was dark brown, there was no bloom raft and ~75% of the Microcystis caught in the weed was dying. The duckweed was also dying and the water pH was stable at 7.75. The following day (~60h post-treatment) there was little change. Overall the lysine treatment appears to have worked on the main body of water but is struggling with the duckweed sections around the edge in which the Microcystis is trapped, likely due to limited water circulation and mixing in these areas. There was no geosmin odour detectable. In a similar pond on this farm (L2-5), a lysine treatment dose of 15µg/ml was used, applied in the same way as Pond L1-4. Pond L2-5 showed a moderate rafting bloom of Microcystis with a lot caught up in the duckweed at pond edges (Image 3.28, left hand image). There was a moderate taint odour obvious and water pH was 8.18. Within 24h, the bloom slick showed a brown scum indicating algal cell degradation although Microcystis caught in duckweed in pond corners was still green. This suggests these pond areas are not receiving sufficient water mixing from the pond current. Estimated that 50% Microcystis was olive-green indicating stress. After 65h, Microcystis was all dying (Image 3.28 RH image) except for that small amount caught in duckweed in very corners of the pond. Lysine presence had also appeared to damage the duckweed. Throughout this time there was downward trend in both pH and geosmin level.
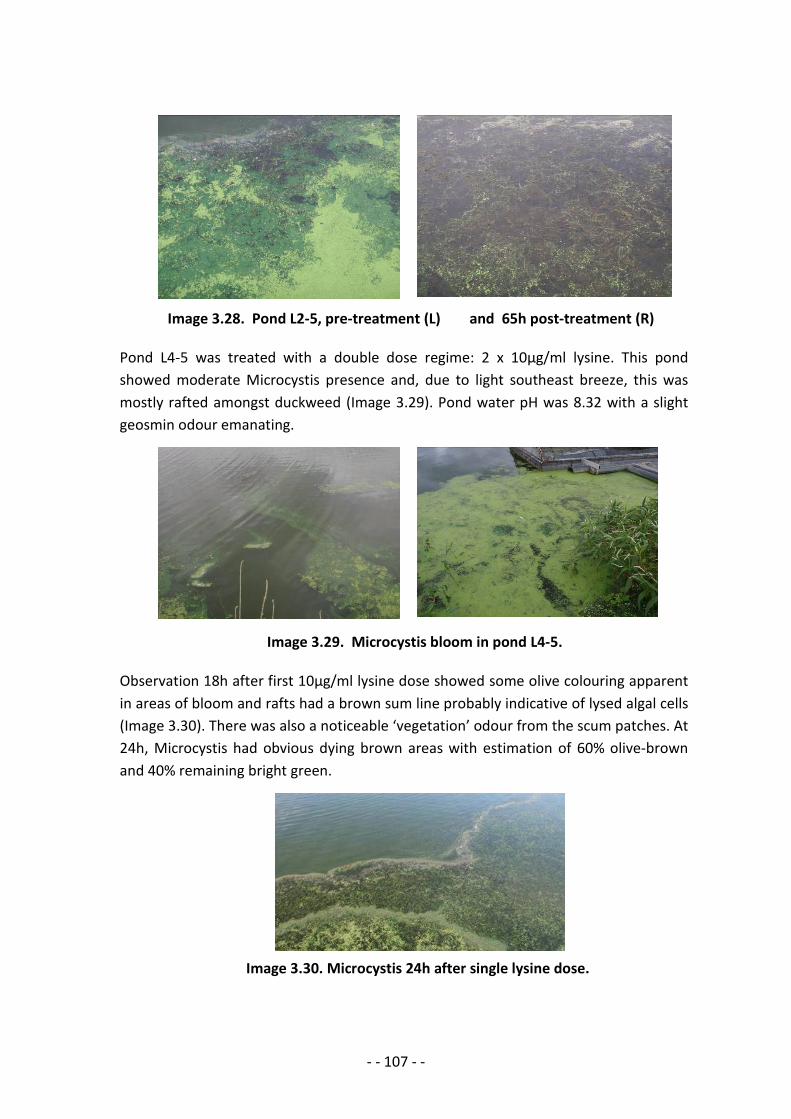
- - 107 - -
Image 3.28. Pond L2-5, pre-treatment (L) and 65h post-treatment (R) Pond L4-5 was treated with a double dose regime: 2 x 10µg/ml lysine. This pond showed moderate Microcystis presence and, due to light southeast breeze, this was mostly rafted amongst duckweed (Image 3.29). Pond water pH was 8.32 with a slight geosmin odour emanating. Image 3.29. Microcystis bloom in pond L4-5. Observation 18h after first 10µg/ml lysine dose showed some olive colouring apparent in areas of bloom and rafts had a brown sum line probably indicative of lysed algal cells (Image 3.30). There was also a noticeable ‘vegetation’ odour from the scum patches. At 24h, Microcystis had obvious dying brown areas with estimation of 60% olive-brown and 40% remaining bright green. Image 3.30. Microcystis 24h after single lysine dose.
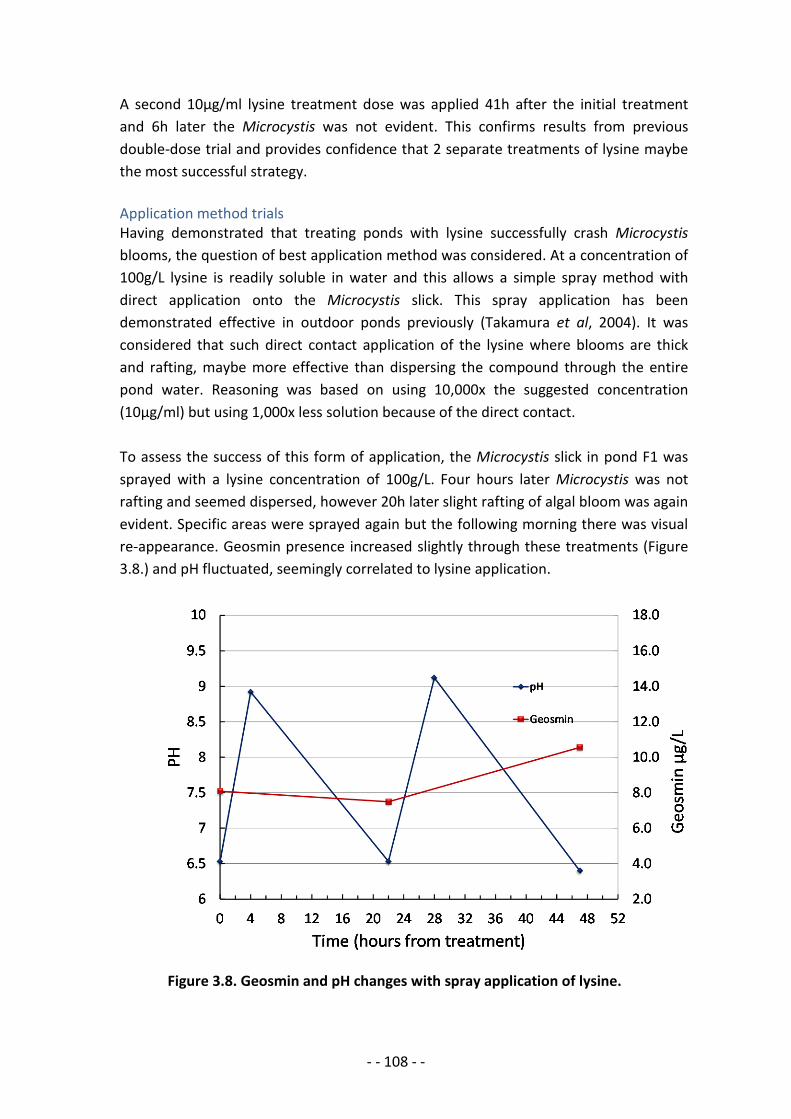
- - 108 - -
A second 10µg/ml lysine treatment dose was applied 41h after the initial treatment and 6h later the Microcystis was not evident. This confirms results from previous double-dose trial and provides confidence that 2 separate treatments of lysine maybe the most successful strategy. Application method trials Having demonstrated that treating ponds with lysine successfully crash Microcystis blooms, the question of best application method was considered. At a concentration of 100g/L lysine is readily soluble in water and this allows a simple spray method with direct application onto the Microcystis slick. This spray application has been demonstrated effective in outdoor ponds previously (Takamura et al, 2004). It was considered that such direct contact application of the lysine where blooms are thick and rafting, maybe more effective than dispersing the compound through the entire pond water. Reasoning was based on using 10,000x the suggested concentration (10µg/ml) but using 1,000x less solution because of the direct contact. To assess the success of this form of application, the Microcystis slick in pond F1 was sprayed with a lysine concentration of 100g/L. Four hours later Microcystis was not rafting and seemed dispersed, however 20h later slight rafting of algal bloom was again evident. Specific areas were sprayed again but the following morning there was visual re-appearance. Geosmin presence increased slightly through these treatments (Figure 3.8.) and pH fluctuated, seemingly correlated to lysine application.
Figure 3.8. Geosmin and pH changes with spray application of lysine.
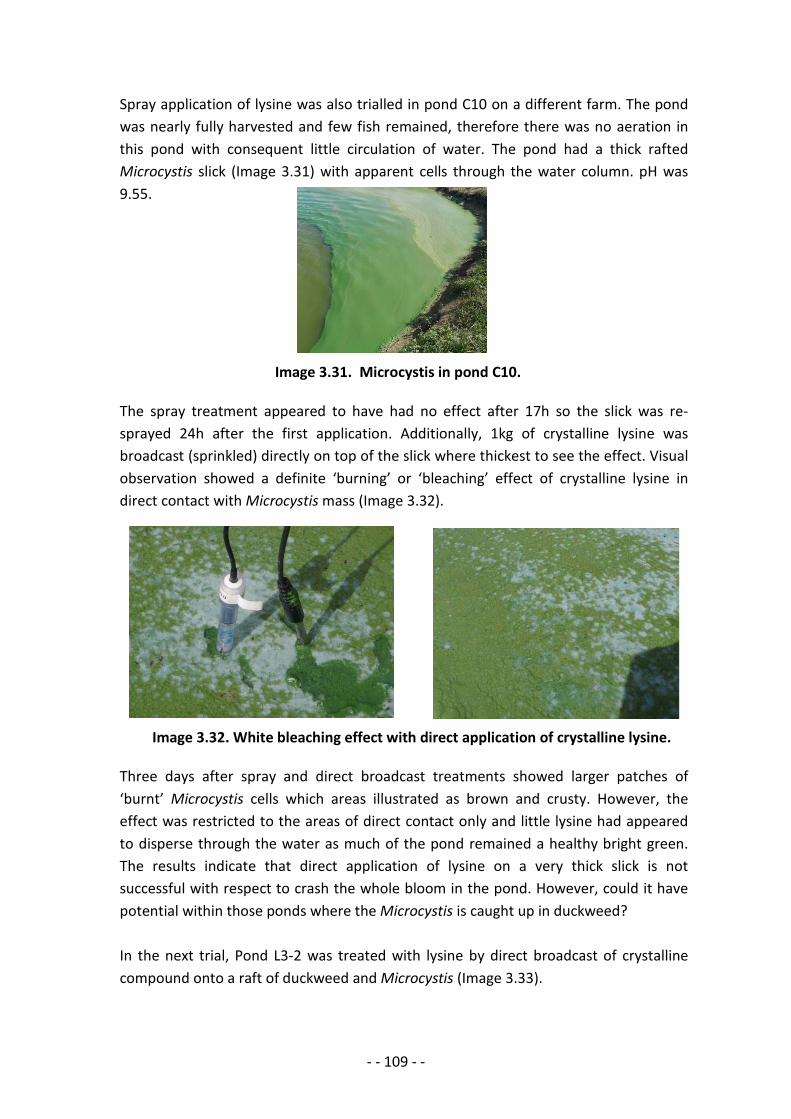
- - 109 - -
Spray application of lysine was also trialled in pond C10 on a different farm. The pond was nearly fully harvested and few fish remained, therefore there was no aeration in this pond with consequent little circulation of water. The pond had a thick rafted Microcystis slick (Image 3.31) with apparent cells through the water column. pH was 9.55. Image 3.31. Microcystis in pond C10. The spray treatment appeared to have had no effect after 17h so the slick was re-sprayed 24h after the first application. Additionally, 1kg of crystalline lysine was broadcast (sprinkled) directly on top of the slick where thickest to see the effect. Visual observation showed a definite ‘burning’ or ‘bleaching’ effect of crystalline lysine in direct contact with Microcystis mass (Image 3.32). Image 3.32. White bleaching effect with direct application of crystalline lysine. Three days after spray and direct broadcast treatments showed larger patches of ‘burnt’ Microcystis cells which areas illustrated as brown and crusty. However, the effect was restricted to the areas of direct contact only and little lysine had appeared to disperse through the water as much of the pond remained a healthy bright green. The results indicate that direct application of lysine on a very thick slick is not successful with respect to crash the whole bloom in the pond. However, could it have potential within those ponds where the Microcystis is caught up in duckweed? In the next trial, Pond L3-2 was treated with lysine by direct broadcast of crystalline compound onto a raft of duckweed and Microcystis (Image 3.33).
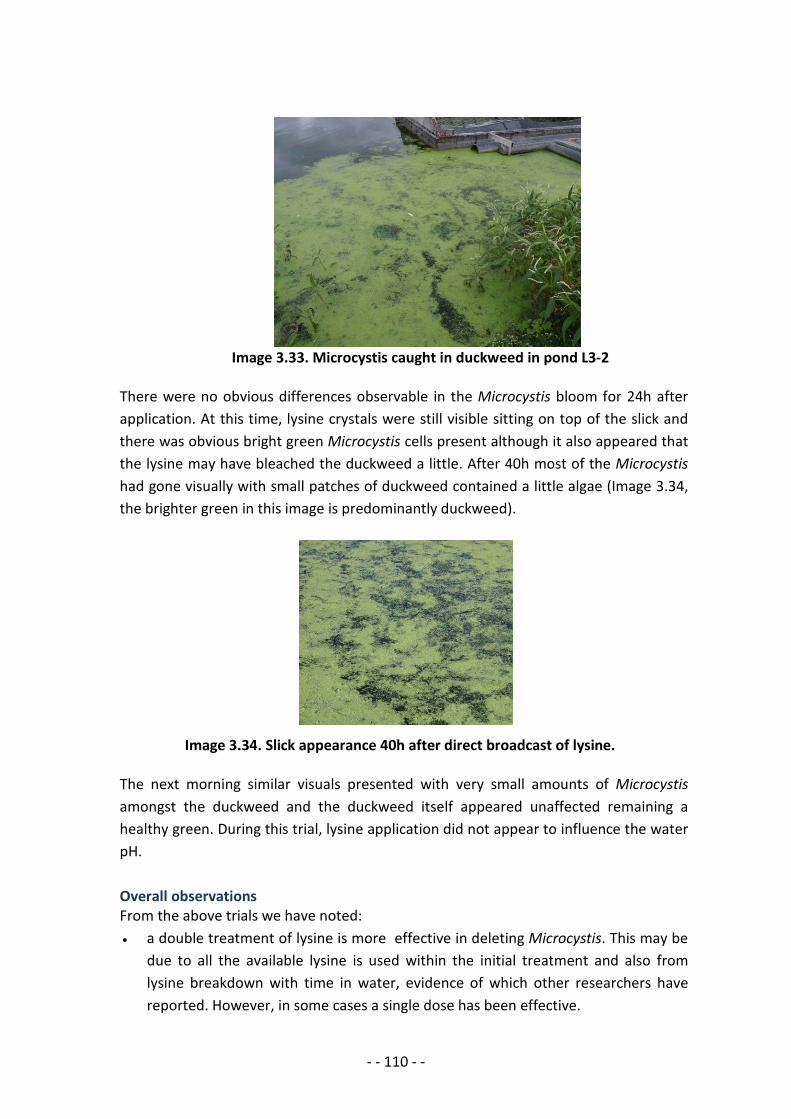
- - 110 - -
Image 3.33. Microcystis caught in duckweed in pond L3-2 There were no obvious differences observable in the Microcystis bloom for 24h after application. At this time, lysine crystals were still visible sitting on top of the slick and there was obvious bright green Microcystis cells present although it also appeared that the lysine may have bleached the duckweed a little. After 40h most of the Microcystis had gone visually with small patches of duckweed contained a little algae (Image 3.34, the brighter green in this image is predominantly duckweed). Image 3.34. Slick appearance 40h after direct broadcast of lysine. The next morning similar visuals presented with very small amounts of Microcystis amongst the duckweed and the duckweed itself appeared unaffected remaining a healthy green. During this trial, lysine application did not appear to influence the water pH. Overall observations From the above trials we have noted: • a double treatment of lysine is more effective in deleting Microcystis. This may be
due to all the available lysine is used within the initial treatment and also from lysine breakdown with time in water, evidence of which other researchers have reported. However, in some cases a single dose has been effective.

- - 111 - -
• ponds that had duckweed as well as filamentous type algae in the water, may or may not have added demand on the available lysine within the system.
• the water pH in a pond that has been successfully treated with lysine becomes much more stable between morning and afternoon pH readings. Ponds with heavy Microcystis slicks present have pH between 9 and 10 by mid afternoon, whereas a pond treated with lysine shows a pH within the 7 to 8 range.
• when there is successful depletion of Microcystis in a pond by lysine treatment, there is a reduction in geosmin levels. In ponds that were not treated with enough lysine showed a slight increase in geosmin levels. This may illustrate damage or stress to a proportion of the algal cells therefore the release of geosmin from lysed cells without the full removal of the bloom.
Further similar trials were undertaken during September-November, 2014 as bloom events occurred in the ponds on two separate farms. Ponds were selected for having an obvious rafting Microcystis bloom present and were treated with lysine doses of 10g/1000L pond water volume and a second dose was applied 24h later. Effect of lysine treatment was evaluated by visual observation of change if appearance of algal bloom and pH was monitored (Image 3.35), along with water samples collected for geosmin analysis. Image 3.35. Microcystis bloom and constant pH monitoring On one farm three ponds were selected, all with ‘healthy’ blooms which were rafting and mixed through the water column due the wind conditions disturbing the surface water of the ponds. All ponds had noticeable geosmin odour emanating from them, pH >8.0 and salinities between 5.2 and 6.8 ppt. Skies were overcast. In all three ponds, the initial dose of lysine seemed to have little effect of the state of the Microcystis bloom and this remained the situation 24h after the second lysine dose was applied. pH fluctuated diurnally but mid-afternoon pH reduced by 1 pH unit in 2 of the 3 ponds in response to the first lysine dose (Table 3.3), with a small further reduction following the second dose of lysine. In only one of the ponds was there a
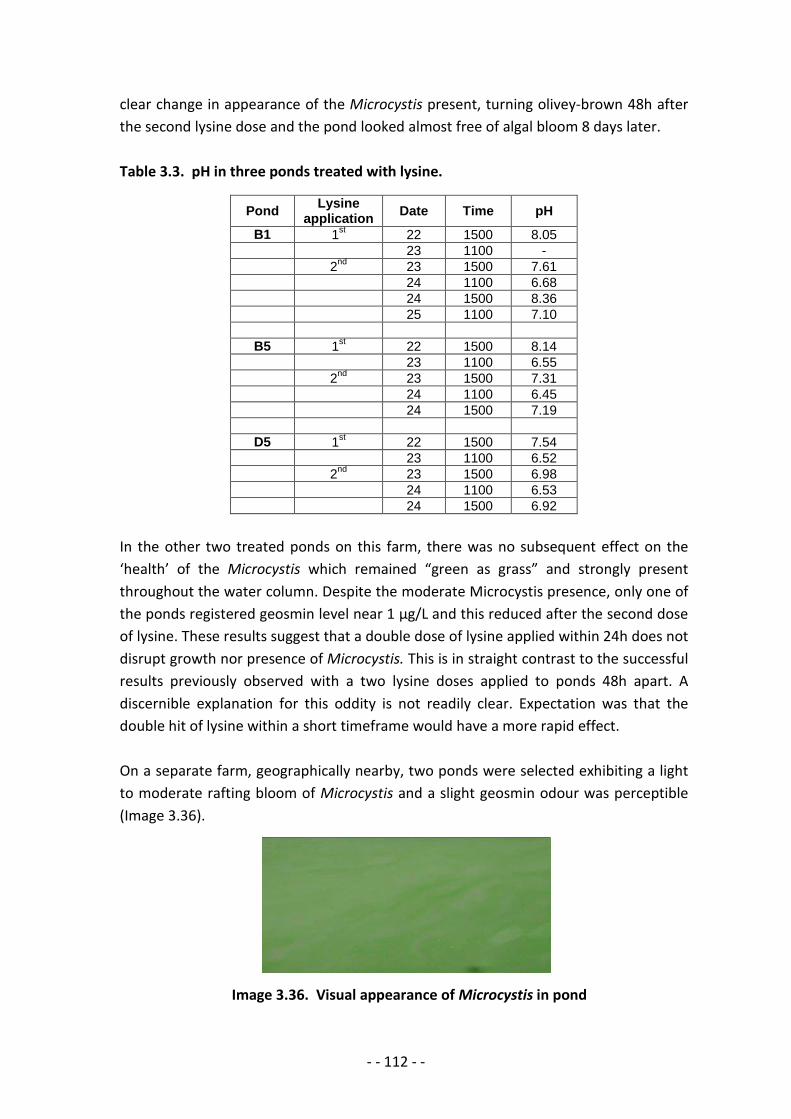
- - 112 - -
clear change in appearance of the Microcystis present, turning olivey-brown 48h after the second lysine dose and the pond looked almost free of algal bloom 8 days later. Table 3.3. pH in three ponds treated with lysine.
Pond Lysine application Date Time pH
B1 1st 22 1500 8.05 23 1100 - 2nd 23 1500 7.61 24 1100 6.68 24 1500 8.36 25 1100 7.10
B5 1st 22 1500 8.14 23 1100 6.55 2nd 23 1500 7.31 24 1100 6.45 24 1500 7.19
D5 1st 22 1500 7.54 23 1100 6.52
2nd 23 1500 6.98 24 1100 6.53 24 1500 6.92
In the other two treated ponds on this farm, there was no subsequent effect on the ‘health’ of the Microcystis which remained “green as grass” and strongly present throughout the water column. Despite the moderate Microcystis presence, only one of the ponds registered geosmin level near 1 µg/L and this reduced after the second dose of lysine. These results suggest that a double dose of lysine applied within 24h does not disrupt growth nor presence of Microcystis. This is in straight contrast to the successful results previously observed with a two lysine doses applied to ponds 48h apart. A discernible explanation for this oddity is not readily clear. Expectation was that the double hit of lysine within a short timeframe would have a more rapid effect. On a separate farm, geographically nearby, two ponds were selected exhibiting a light to moderate rafting bloom of Microcystis and a slight geosmin odour was perceptible (Image 3.36). Image 3.36. Visual appearance of Microcystis in pond
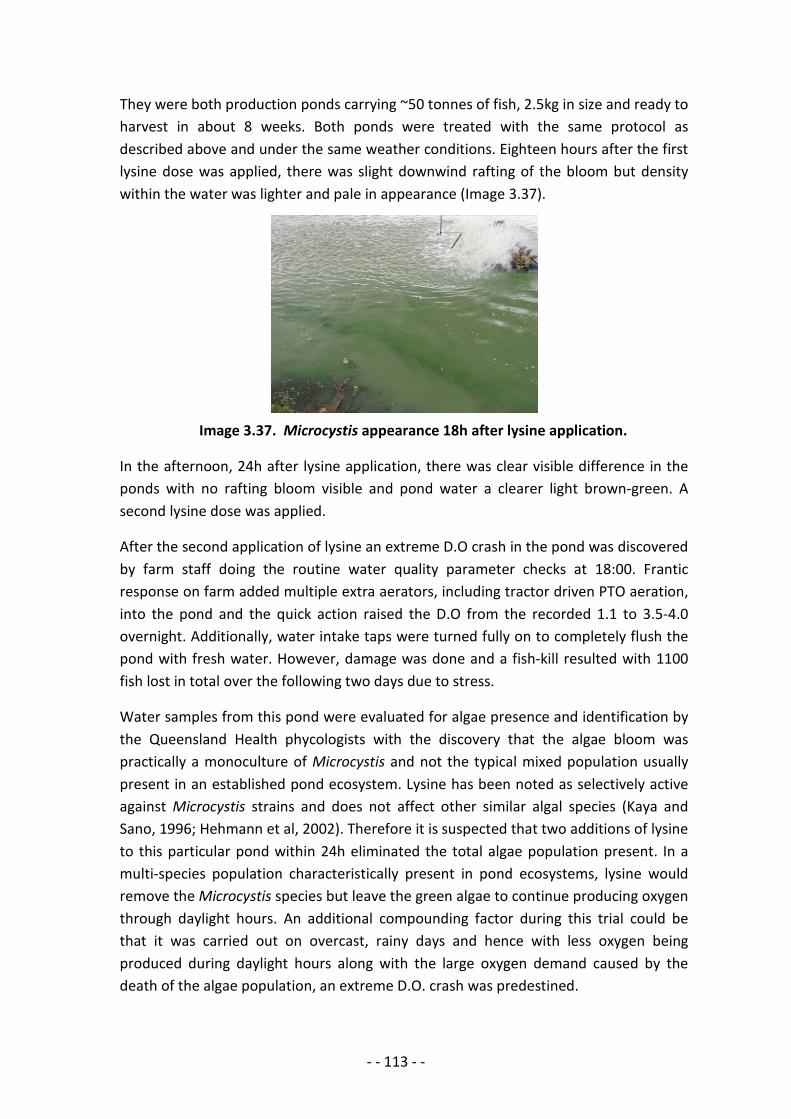
- - 113 - -
They were both production ponds carrying ~50 tonnes of fish, 2.5kg in size and ready to harvest in about 8 weeks. Both ponds were treated with the same protocol as described above and under the same weather conditions. Eighteen hours after the first lysine dose was applied, there was slight downwind rafting of the bloom but density within the water was lighter and pale in appearance (Image 3.37).
Image 3.37. Microcystis appearance 18h after lysine application.
In the afternoon, 24h after lysine application, there was clear visible difference in the ponds with no rafting bloom visible and pond water a clearer light brown-green. A second lysine dose was applied.
After the second application of lysine an extreme D.O crash in the pond was discovered by farm staff doing the routine water quality parameter checks at 18:00. Frantic response on farm added multiple extra aerators, including tractor driven PTO aeration, into the pond and the quick action raised the D.O from the recorded 1.1 to 3.5-4.0 overnight. Additionally, water intake taps were turned fully on to completely flush the pond with fresh water. However, damage was done and a fish-kill resulted with 1100 fish lost in total over the following two days due to stress.
Water samples from this pond were evaluated for algae presence and identification by the Queensland Health phycologists with the discovery that the algae bloom was practically a monoculture of Microcystis and not the typical mixed population usually present in an established pond ecosystem. Lysine has been noted as selectively active against Microcystis strains and does not affect other similar algal species (Kaya and Sano, 1996; Hehmann et al, 2002). Therefore it is suspected that two additions of lysine to this particular pond within 24h eliminated the total algae population present. In a multi-species population characteristically present in pond ecosystems, lysine would remove the Microcystis species but leave the green algae to continue producing oxygen through daylight hours. An additional compounding factor during this trial could be that it was carried out on overcast, rainy days and hence with less oxygen being produced during daylight hours along with the large oxygen demand caused by the death of the algae population, an extreme D.O. crash was predestined.
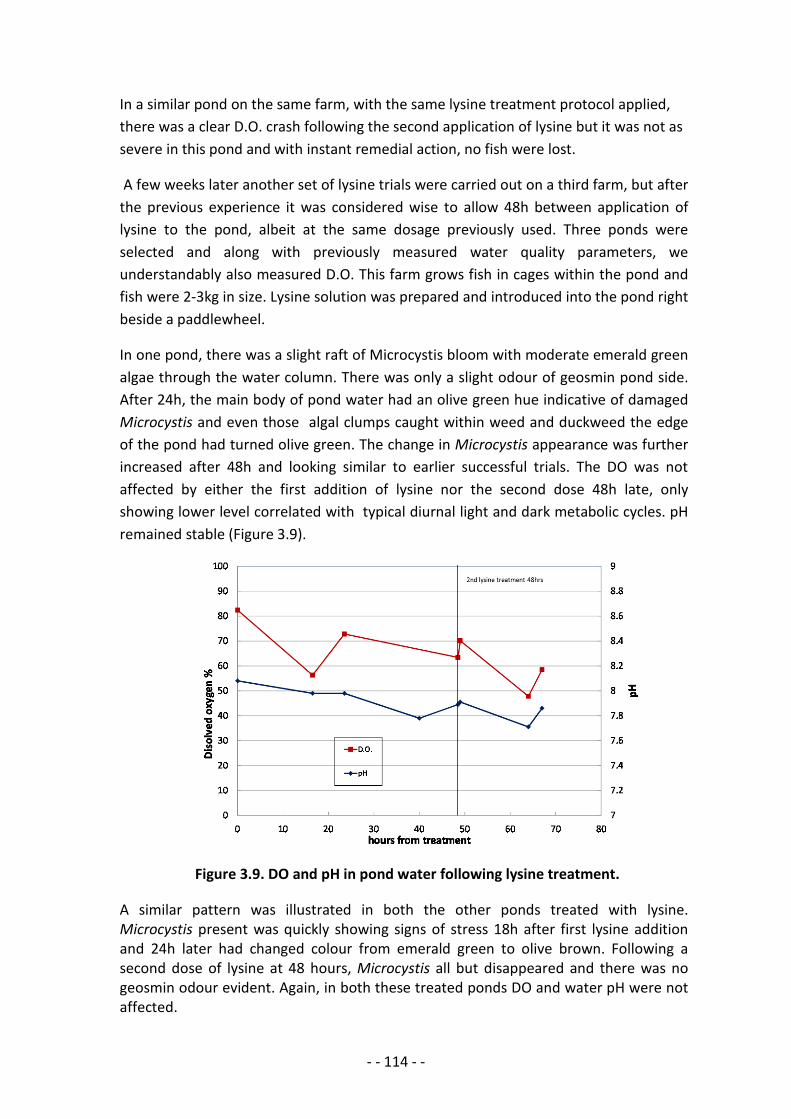
- - 114 - -
In a similar pond on the same farm, with the same lysine treatment protocol applied, there was a clear D.O. crash following the second application of lysine but it was not as severe in this pond and with instant remedial action, no fish were lost.
A few weeks later another set of lysine trials were carried out on a third farm, but after the previous experience it was considered wise to allow 48h between application of lysine to the pond, albeit at the same dosage previously used. Three ponds were selected and along with previously measured water quality parameters, we understandably also measured D.O. This farm grows fish in cages within the pond and fish were 2-3kg in size. Lysine solution was prepared and introduced into the pond right beside a paddlewheel.
In one pond, there was a slight raft of Microcystis bloom with moderate emerald green algae through the water column. There was only a slight odour of geosmin pond side. After 24h, the main body of pond water had an olive green hue indicative of damaged Microcystis and even those algal clumps caught within weed and duckweed the edge of the pond had turned olive green. The change in Microcystis appearance was further increased after 48h and looking similar to earlier successful trials. The DO was not affected by either the first addition of lysine nor the second dose 48h late, only showing lower level correlated with typical diurnal light and dark metabolic cycles. pH remained stable (Figure 3.9).
Figure 3.9. DO and pH in pond water following lysine treatment.
A similar pattern was illustrated in both the other ponds treated with lysine. Microcystis present was quickly showing signs of stress 18h after first lysine addition and 24h later had changed colour from emerald green to olive brown. Following a second dose of lysine at 48 hours, Microcystis all but disappeared and there was no geosmin odour evident. Again, in both these treated ponds DO and water pH were not affected.
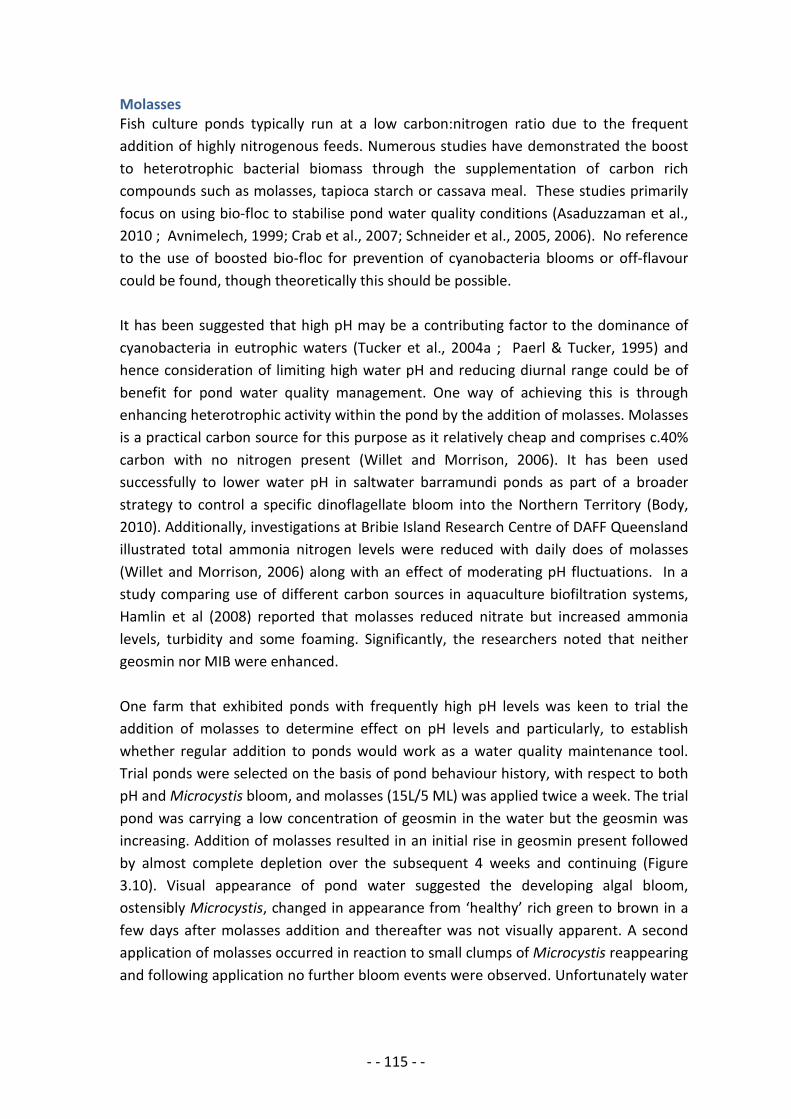
- - 115 - -
Molasses Fish culture ponds typically run at a low carbon:nitrogen ratio due to the frequent addition of highly nitrogenous feeds. Numerous studies have demonstrated the boost to heterotrophic bacterial biomass through the supplementation of carbon rich compounds such as molasses, tapioca starch or cassava meal. These studies primarily focus on using bio-floc to stabilise pond water quality conditions (Asaduzzaman et al., 2010 ; Avnimelech, 1999; Crab et al., 2007; Schneider et al., 2005, 2006). No reference to the use of boosted bio-floc for prevention of cyanobacteria blooms or off-flavour could be found, though theoretically this should be possible. It has been suggested that high pH may be a contributing factor to the dominance of cyanobacteria in eutrophic waters (Tucker et al., 2004a ; Paerl & Tucker, 1995) and hence consideration of limiting high water pH and reducing diurnal range could be of benefit for pond water quality management. One way of achieving this is through enhancing heterotrophic activity within the pond by the addition of molasses. Molasses is a practical carbon source for this purpose as it relatively cheap and comprises c.40% carbon with no nitrogen present (Willet and Morrison, 2006). It has been used successfully to lower water pH in saltwater barramundi ponds as part of a broader strategy to control a specific dinoflagellate bloom into the Northern Territory (Body, 2010). Additionally, investigations at Bribie Island Research Centre of DAFF Queensland illustrated total ammonia nitrogen levels were reduced with daily does of molasses (Willet and Morrison, 2006) along with an effect of moderating pH fluctuations. In a study comparing use of different carbon sources in aquaculture biofiltration systems, Hamlin et al (2008) reported that molasses reduced nitrate but increased ammonia levels, turbidity and some foaming. Significantly, the researchers noted that neither geosmin nor MIB were enhanced. One farm that exhibited ponds with frequently high pH levels was keen to trial the addition of molasses to determine effect on pH levels and particularly, to establish whether regular addition to ponds would work as a water quality maintenance tool. Trial ponds were selected on the basis of pond behaviour history, with respect to both pH and Microcystis bloom, and molasses (15L/5 ML) was applied twice a week. The trial pond was carrying a low concentration of geosmin in the water but the geosmin was increasing. Addition of molasses resulted in an initial rise in geosmin present followed by almost complete depletion over the subsequent 4 weeks and continuing (Figure 3.10). Visual appearance of pond water suggested the developing algal bloom, ostensibly Microcystis, changed in appearance from ‘healthy’ rich green to brown in a few days after molasses addition and thereafter was not visually apparent. A second application of molasses occurred in reaction to small clumps of Microcystis reappearing and following application no further bloom events were observed. Unfortunately water
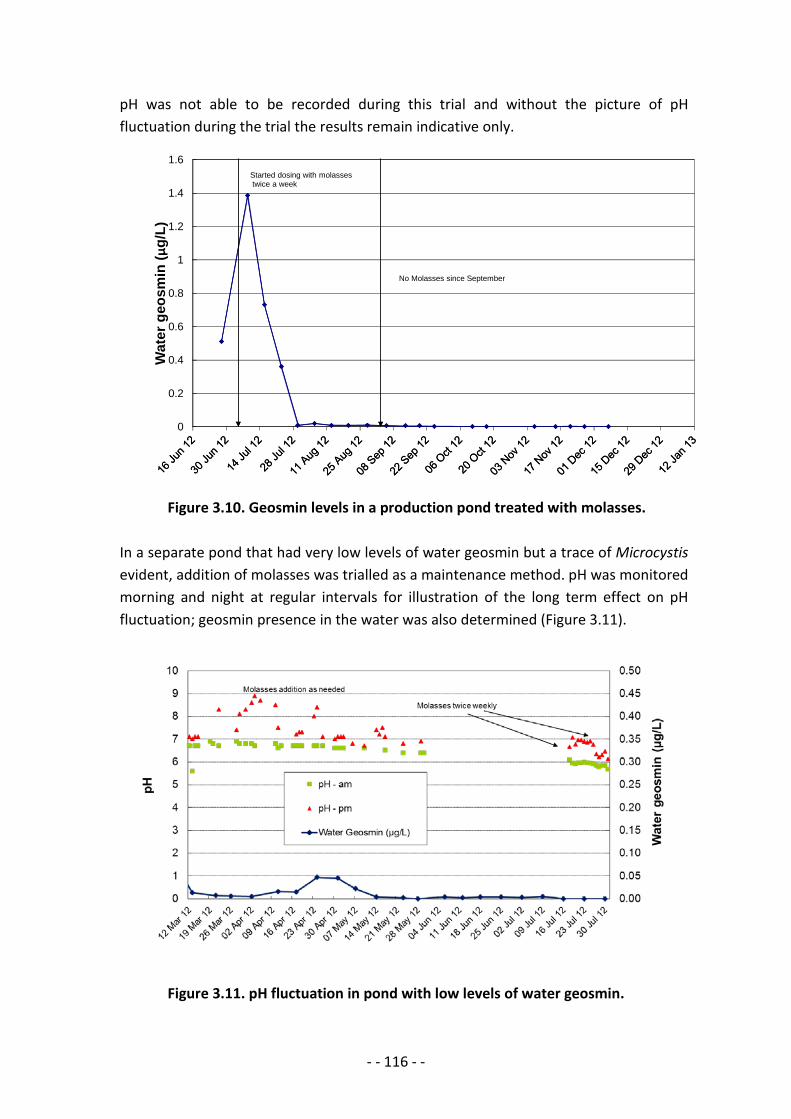
- - 116 - -
pH was not able to be recorded during this trial and without the picture of pH fluctuation during the trial the results remain indicative only.
Figure 3.10. Geosmin levels in a production pond treated with molasses. In a separate pond that had very low levels of water geosmin but a trace of Microcystis evident, addition of molasses was trialled as a maintenance method. pH was monitored morning and night at regular intervals for illustration of the long term effect on pH fluctuation; geosmin presence in the water was also determined (Figure 3.11).
Figure 3.11. pH fluctuation in pond with low levels of water geosmin.
0
0.2
0.4
0.6
0.8
1
1.2
1.4
1.6W
ater
geo
smin
(µg/
L)Started dosing with molassestwice a week
No Molasses since September
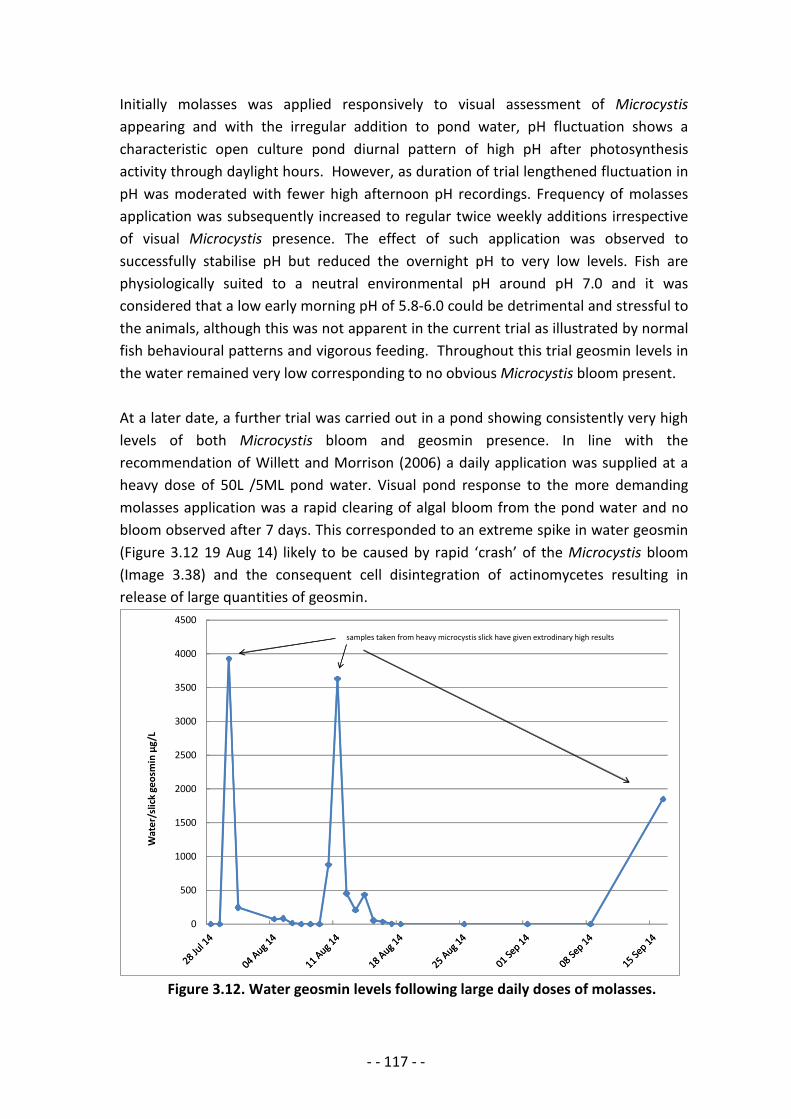
- - 117 - -
Initially molasses was applied responsively to visual assessment of Microcystis appearing and with the irregular addition to pond water, pH fluctuation shows a characteristic open culture pond diurnal pattern of high pH after photosynthesis activity through daylight hours. However, as duration of trial lengthened fluctuation in pH was moderated with fewer high afternoon pH recordings. Frequency of molasses application was subsequently increased to regular twice weekly additions irrespective of visual Microcystis presence. The effect of such application was observed to successfully stabilise pH but reduced the overnight pH to very low levels. Fish are physiologically suited to a neutral environmental pH around pH 7.0 and it was considered that a low early morning pH of 5.8-6.0 could be detrimental and stressful to the animals, although this was not apparent in the current trial as illustrated by normal fish behavioural patterns and vigorous feeding. Throughout this trial geosmin levels in the water remained very low corresponding to no obvious Microcystis bloom present. At a later date, a further trial was carried out in a pond showing consistently very high levels of both Microcystis bloom and geosmin presence. In line with the recommendation of Willett and Morrison (2006) a daily application was supplied at a heavy dose of 50L /5ML pond water. Visual pond response to the more demanding molasses application was a rapid clearing of algal bloom from the pond water and no bloom observed after 7 days. This corresponded to an extreme spike in water geosmin (Figure 3.12 19 Aug 14) likely to be caused by rapid ‘crash’ of the Microcystis bloom (Image 3.38) and the consequent cell disintegration of actinomycetes resulting in release of large quantities of geosmin.
0
500
1000
1500
2000
2500
3000
3500
4000
4500
Wat
er/s
lick
geos
min
µg/
L
samples taken from heavy microcystis slick have given extrodinary high results
Figure 3.12. Water geosmin levels following large daily doses of molasses.
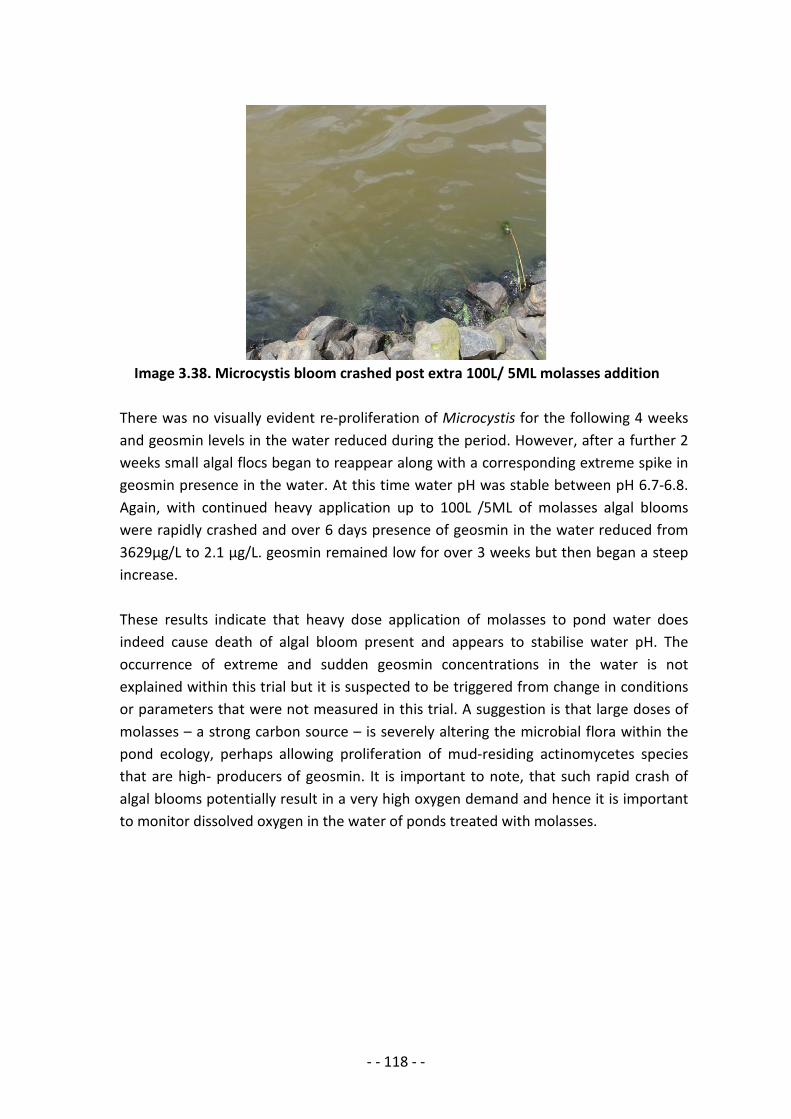
- - 118 - -
Image 3.38. Microcystis bloom crashed post extra 100L/ 5ML molasses addition There was no visually evident re-proliferation of Microcystis for the following 4 weeks and geosmin levels in the water reduced during the period. However, after a further 2 weeks small algal flocs began to reappear along with a corresponding extreme spike in geosmin presence in the water. At this time water pH was stable between pH 6.7-6.8. Again, with continued heavy application up to 100L /5ML of molasses algal blooms were rapidly crashed and over 6 days presence of geosmin in the water reduced from 3629µg/L to 2.1 µg/L. geosmin remained low for over 3 weeks but then began a steep increase. These results indicate that heavy dose application of molasses to pond water does indeed cause death of algal bloom present and appears to stabilise water pH. The occurrence of extreme and sudden geosmin concentrations in the water is not explained within this trial but it is suspected to be triggered from change in conditions or parameters that were not measured in this trial. A suggestion is that large doses of molasses – a strong carbon source – is severely altering the microbial flora within the pond ecology, perhaps allowing proliferation of mud-residing actinomycetes species that are high- producers of geosmin. It is important to note, that such rapid crash of algal blooms potentially result in a very high oxygen demand and hence it is important to monitor dissolved oxygen in the water of ponds treated with molasses.
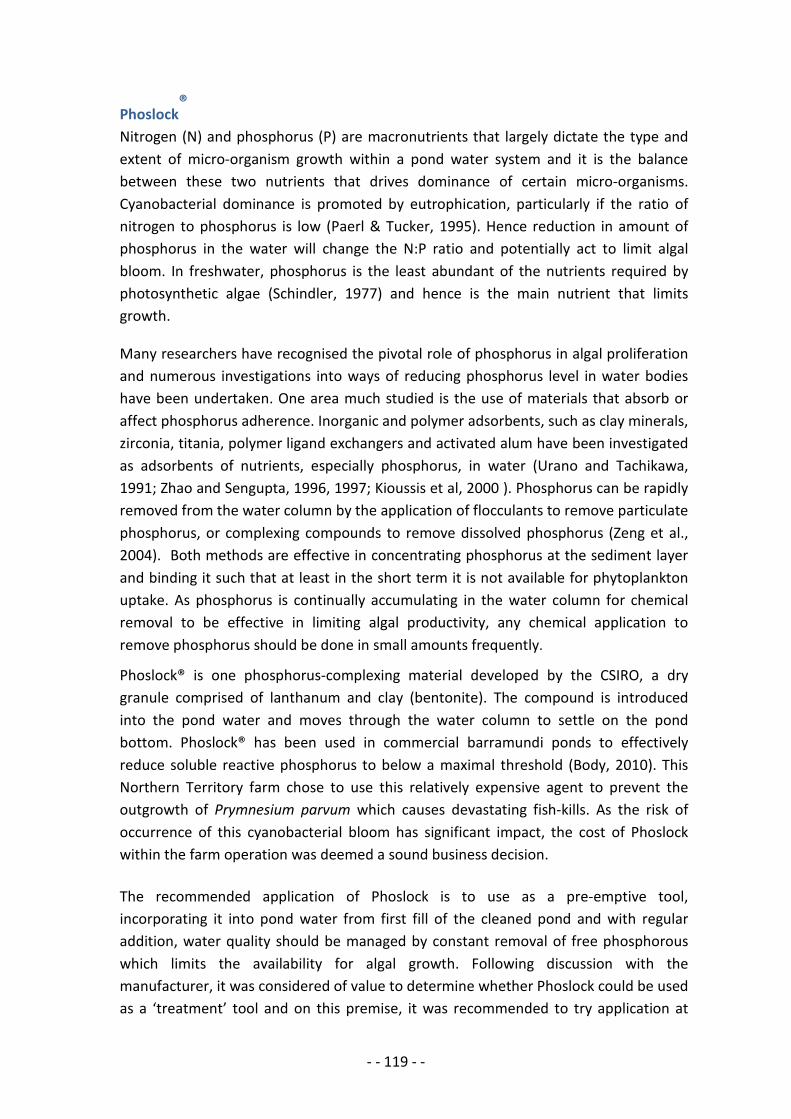
- - 119 - -
Phoslock®
Nitrogen (N) and phosphorus (P) are macronutrients that largely dictate the type and extent of micro-organism growth within a pond water system and it is the balance between these two nutrients that drives dominance of certain micro-organisms. Cyanobacterial dominance is promoted by eutrophication, particularly if the ratio of nitrogen to phosphorus is low (Paerl & Tucker, 1995). Hence reduction in amount of phosphorus in the water will change the N:P ratio and potentially act to limit algal bloom. In freshwater, phosphorus is the least abundant of the nutrients required by photosynthetic algae (Schindler, 1977) and hence is the main nutrient that limits growth. Many researchers have recognised the pivotal role of phosphorus in algal proliferation and numerous investigations into ways of reducing phosphorus level in water bodies have been undertaken. One area much studied is the use of materials that absorb or affect phosphorus adherence. Inorganic and polymer adsorbents, such as clay minerals, zirconia, titania, polymer ligand exchangers and activated alum have been investigated as adsorbents of nutrients, especially phosphorus, in water (Urano and Tachikawa, 1991; Zhao and Sengupta, 1996, 1997; Kioussis et al, 2000 ). Phosphorus can be rapidly removed from the water column by the application of flocculants to remove particulate phosphorus, or complexing compounds to remove dissolved phosphorus (Zeng et al., 2004). Both methods are effective in concentrating phosphorus at the sediment layer and binding it such that at least in the short term it is not available for phytoplankton uptake. As phosphorus is continually accumulating in the water column for chemical removal to be effective in limiting algal productivity, any chemical application to remove phosphorus should be done in small amounts frequently.
Phoslock® is one phosphorus-complexing material developed by the CSIRO, a dry granule comprised of lanthanum and clay (bentonite). The compound is introduced into the pond water and moves through the water column to settle on the pond bottom. Phoslock® has been used in commercial barramundi ponds to effectively reduce soluble reactive phosphorus to below a maximal threshold (Body, 2010). This Northern Territory farm chose to use this relatively expensive agent to prevent the outgrowth of Prymnesium parvum which causes devastating fish-kills. As the risk of occurrence of this cyanobacterial bloom has significant impact, the cost of Phoslock within the farm operation was deemed a sound business decision. The recommended application of Phoslock is to use as a pre-emptive tool, incorporating it into pond water from first fill of the cleaned pond and with regular addition, water quality should be managed by constant removal of free phosphorous which limits the availability for algal growth. Following discussion with the manufacturer, it was considered of value to determine whether Phoslock could be used as a ‘treatment’ tool and on this premise, it was recommended to try application at
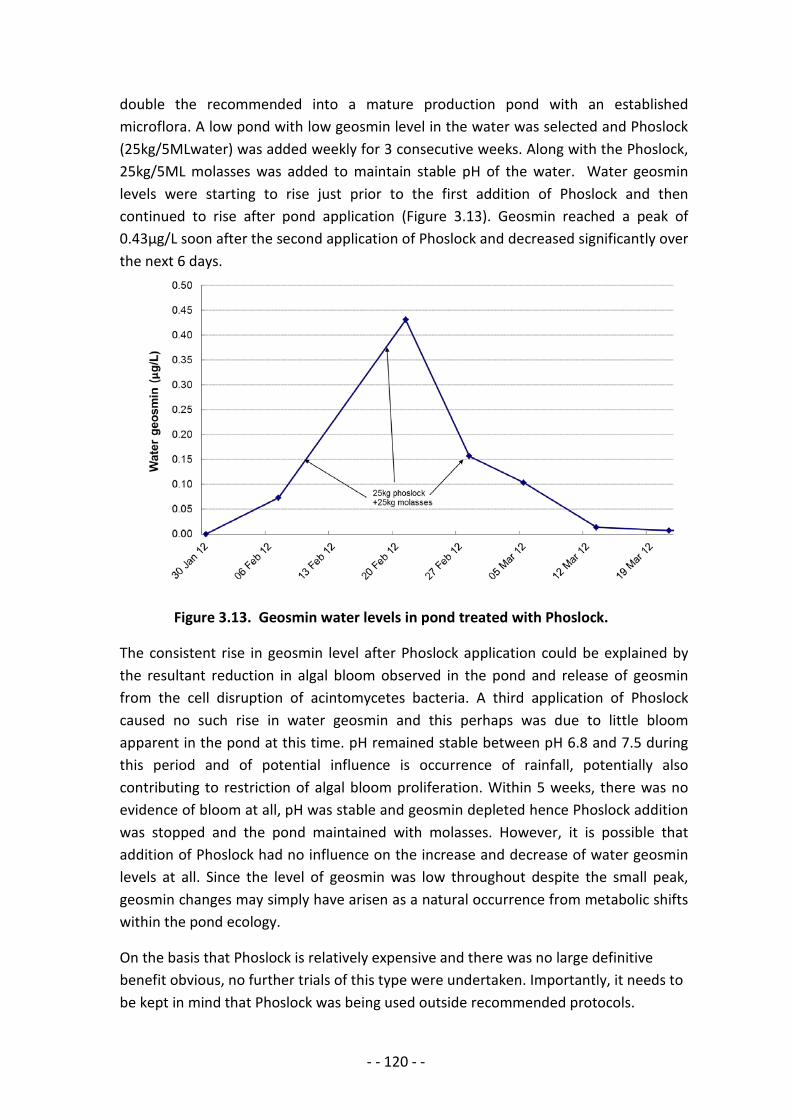
- - 120 - -
double the recommended into a mature production pond with an established microflora. A low pond with low geosmin level in the water was selected and Phoslock (25kg/5MLwater) was added weekly for 3 consecutive weeks. Along with the Phoslock, 25kg/5ML molasses was added to maintain stable pH of the water. Water geosmin levels were starting to rise just prior to the first addition of Phoslock and then continued to rise after pond application (Figure 3.13). Geosmin reached a peak of 0.43µg/L soon after the second application of Phoslock and decreased significantly over the next 6 days.
Figure 3.13. Geosmin water levels in pond treated with Phoslock.
The consistent rise in geosmin level after Phoslock application could be explained by the resultant reduction in algal bloom observed in the pond and release of geosmin from the cell disruption of acintomycetes bacteria. A third application of Phoslock caused no such rise in water geosmin and this perhaps was due to little bloom apparent in the pond at this time. pH remained stable between pH 6.8 and 7.5 during this period and of potential influence is occurrence of rainfall, potentially also contributing to restriction of algal bloom proliferation. Within 5 weeks, there was no evidence of bloom at all, pH was stable and geosmin depleted hence Phoslock addition was stopped and the pond maintained with molasses. However, it is possible that addition of Phoslock had no influence on the increase and decrease of water geosmin levels at all. Since the level of geosmin was low throughout despite the small peak, geosmin changes may simply have arisen as a natural occurrence from metabolic shifts within the pond ecology.
On the basis that Phoslock is relatively expensive and there was no large definitive benefit obvious, no further trials of this type were undertaken. Importantly, it needs to be kept in mind that Phoslock was being used outside recommended protocols.
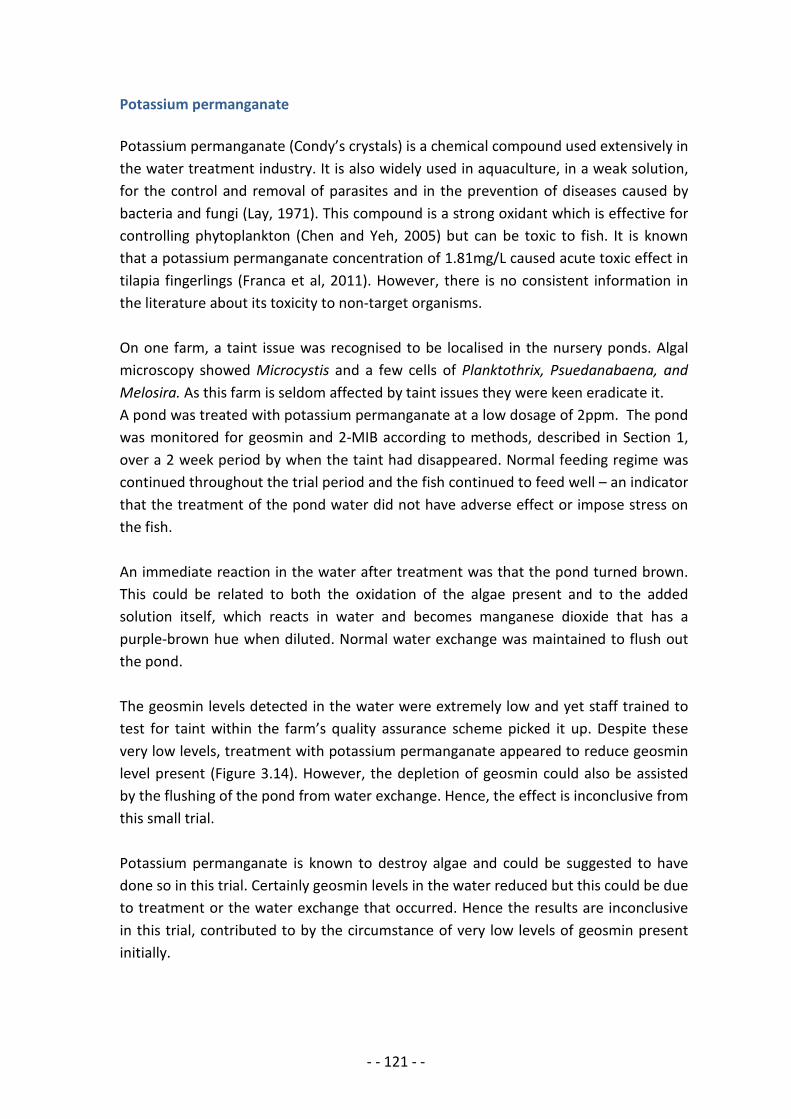
- - 121 - -
Potassium permanganate Potassium permanganate (Condy’s crystals) is a chemical compound used extensively in the water treatment industry. It is also widely used in aquaculture, in a weak solution, for the control and removal of parasites and in the prevention of diseases caused by bacteria and fungi (Lay, 1971). This compound is a strong oxidant which is effective for controlling phytoplankton (Chen and Yeh, 2005) but can be toxic to fish. It is known that a potassium permanganate concentration of 1.81mg/L caused acute toxic effect in tilapia fingerlings (Franca et al, 2011). However, there is no consistent information in the literature about its toxicity to non-target organisms. On one farm, a taint issue was recognised to be localised in the nursery ponds. Algal microscopy showed Microcystis and a few cells of Planktothrix, Psuedanabaena, and Melosira. As this farm is seldom affected by taint issues they were keen eradicate it. A pond was treated with potassium permanganate at a low dosage of 2ppm. The pond was monitored for geosmin and 2-MIB according to methods, described in Section 1, over a 2 week period by when the taint had disappeared. Normal feeding regime was continued throughout the trial period and the fish continued to feed well – an indicator that the treatment of the pond water did not have adverse effect or impose stress on the fish. An immediate reaction in the water after treatment was that the pond turned brown. This could be related to both the oxidation of the algae present and to the added solution itself, which reacts in water and becomes manganese dioxide that has a purple-brown hue when diluted. Normal water exchange was maintained to flush out the pond. The geosmin levels detected in the water were extremely low and yet staff trained to test for taint within the farm’s quality assurance scheme picked it up. Despite these very low levels, treatment with potassium permanganate appeared to reduce geosmin level present (Figure 3.14). However, the depletion of geosmin could also be assisted by the flushing of the pond from water exchange. Hence, the effect is inconclusive from this small trial. Potassium permanganate is known to destroy algae and could be suggested to have done so in this trial. Certainly geosmin levels in the water reduced but this could be due to treatment or the water exchange that occurred. Hence the results are inconclusive in this trial, contributed to by the circumstance of very low levels of geosmin present initially.
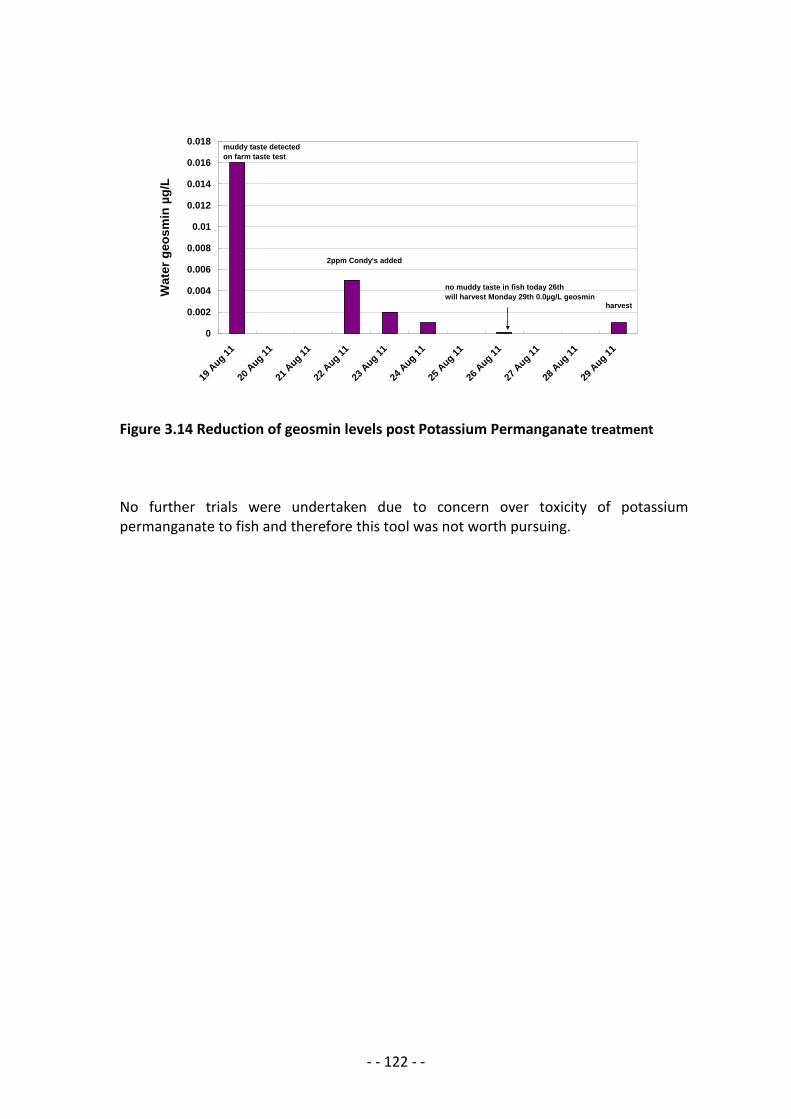
- - 122 - -
Figure 3.14 Reduction of geosmin levels post Potassium Permanganate treatment No further trials were undertaken due to concern over toxicity of potassium permanganate to fish and therefore this tool was not worth pursuing.
0
0.002
0.004
0.006
0.008
0.01
0.012
0.014
0.016
0.018
19 A
ug 11
20 A
ug 11
21 A
ug 11
22 A
ug 11
23 A
ug 11
24 A
ug 11
25 A
ug 11
26 A
ug 11
27 A
ug 11
28 A
ug 11
29 A
ug 11
Wat
er g
eosm
in µ
g/L
2ppm Condy's added
muddy taste detectedon farm taste test
no muddy taste in fish today 26thwill harvest Monday 29th 0.0µg/L geosmin
harvest
- - 123 - -
Probiotic - ProW Ideally, the control of off-flavour occurrence would be by ongoing control of the growth of organisms that produce off-flavour compounds, including the prevention of algal blooms. Due to the complexity of ecological dynamics within aquaculture ponds, this is not an easy task. However, there are several potential options by which to approach this goal. Probiotics have been used in the aquaculture industry for a long time to promote rapid decomposition of waste in ponds thus providing cleaner, healthier ponds and maximising aquaculture growth rates. An open pond environment has a very complex ecology which can unbalance easily with slight changes in conditions. It is widely recognised that controlling the microbial community present in aquaculture ponds through the introduction of specific bacteria or algal species has benefits in stabilising microbial population flora shifts and can assist in prevention of disease by not allowing pathogenic bacteria to gain a foothold. The benefits of probiotic addition has been studied and discussed extensively in aquaculture systems (see reviews by Ninawe and Selvin, 2009; Zhou et al, 2009) and specifically in fish culture (Dawah, 2007; Barkoh et al, 2009). Whilst reportedly effective in small pond facilities, the use in large pond systems and farms can become cost prohibitive, particularly when the farm is a flow through design requiring even higher daily/weekly dosage. The probiotic trialled was Sanolife® ProW from Primo Aquaculture. ProW has been used successfully in a brackish water barramundi system for the specific prevention of Prymnesium parvum). It was suggested by the company providing ProW that there may be scope to trial higher dosage rates in a pond which uses the probiotic as a ‘pond finishing tool’ to help bring blue-green algae blooms under control and ‘clean up’ a pond prior to harvest. This is an alternative to using it as a weekly maintenance treatment dose for continual pond water quality control. Sanolife® ProW is specifically formulated to rapidly breakdown pond bottom waste material stabilise phytoplankton blooms assists in maintaining water quality optimal reduces ability of pathogenic bacteria to establish be useable in freshwater and marine environments places on extra oxygen demand within the pond
- - 124 - -
All these suggested attributes are highly relevant for barramundi production ponds and if successful in action, will work to reduce taint compound levels in pond water. Trial aim: Investigate the probiotic ProW as a short term tool to help reduce organisms affecting geosmin and MIB production in ponds. The pond selected for treatment had a low intensity of Microcystis bloom. Pond water was analysed for off-flavour compounds and 0.54ug/L of geosmin was detected with no 2-MIB present. This geosmin level is categorised as low presence. Another pond with consistently low level geosmin was selected as a comparison pond to allow determination of differences in levels of geosmin producing organisms. There are very specific and clear instructions for use of ProW in aquaculture ponds involving application (100-200g/hectare) prior to filling the pond, followed by another equal dosage/hectare/metre of depth after filling the pond. During fish culture, it is recommended to apply the same dose of ProW per hectare/metre depth on a weekly or fortnightly basis according to conditions prevailing in the pond. With thorough consultation with the company, a different dosage application rate was planned for the attempt in using ProW as a ‘clean up tool in ponds with established algal blooms. ProW was added to the treatment pond on a weekly basis at double that of the manufacturer’s recommendation. Water monitoring methods are as described in previous sections: geosmin: Section 1; algal growth: Section 2. As part of this trial, the effect on actinomycetes populations present in the pond was also noted, methods of enumeration were as described in Section 2. Trial pond was treated with double-dose Pro W on 24 August 2011. After 6 weeks of weekly dosing the pond still showed a light Microcystis bloom hence no visual effect was observed in the pond. Sludge samples were taken for enumeration of actinomycetes 6 and 8 weeks after trial initiated (30 October & 12 November, 2011) from both the treatment pond and comparison pond. This was to assess population levels in both ponds and to determine whether there was a correlation with amount of geosmin in the water. The comparison pond had a consistently low geosmin level over several previous months. Geosmin levels in the treatment pond have been steadily increasing since October with report (11 Jan 2012) that the previously treated pond is visually very thick with algal bloom, Microcystis being dominant. Corresponding water geosmin levels show that it

- - 125 - -
has not made a difference to controlling the ecological dynamics in the pond and geosmin level peaked at 10.12ug/L (Table 3.4). Table 3.4. Geosmin and actinomycetes levels in treated and untreated ponds.
Pro W treatment pond Comparison pond
Date Geosmin (µg/L)
Actinomycetes (log10 cfu/ml)
Geosmin (µg/L)
Actinomycetes (log10 cfu /ml)
24/10/11 0.54 0.0 31/10/11 1.78 0.0
7/11/11 4.16 0.0 14/11/11 4.14 0.0 30/11/11 5.08 5.1 x 10⁻⁴ 0.0 6.9 x 10⁻⁴ 12/12/11 10.12 6.9 x 10⁻⁴ 0.0 5.0 x 10⁻⁴
The actinomycetes population is similar between ponds indicating that ProW has not had a probiotic effect in changing the types of organisms present in the pond bottom sludge. This limited trial does not provide any information on types/ species of actinomycetes present, hence we can not conclude whether there are population shifts to or from geosmin-producing organisms within the actinomycetes count achieved 12 December. The sharp increase in geosmin in the water indicates that geosmin-producing organisms are flourishing. It should be noted that most probiotics are applied preventatively and in this experiment we were attempting to use the ProW differently from how it was designed to act. It is acknowledged that the appropriate time to control a harmful algal bloom is before the bloom develops and hence failure of ProW to deplete algal presence in our trial situation is not surprising. However, it was worth a try! ProW has demonstrated to be very useful in helping to maintain water quality and stabilise healthy algal blooms within aquaculture ponds when used according to application instructions. The attempt to use ProW as a ‘clean up’ tool was not successful and this is not unexpected.
- - 126 - -
Mitigation Trials for Barramundi Recirculating Aquaculture Systems (RAS) Trials were undertaken by SARDI colleague, Dr. Richard Musgrove and are presented as reported to the date of his leaving the SARDI Institute. The RAS aspects of taint in barramundi were then taken up by Priyantha Hathurusingha Arachchige, a PhD candidate at University of Adelaide under the supervision of Dr Ken Davey and with a Seafood CRC scholarship. The PI of project 2009-775 has contributed co-supervision with respect to Priyantha’s investigations.
Trials were initiated with the collaboration of the Australian Water Quality Centre (AWQC, Adelaide, South Australia) to facilitate mitigation of taint in recirculating aquaculture systems (RAS). The AWQC were interested in finding an appropriate treatment for geosmin and MIB in domestic water supply storage reservoirs, and responded positively to the suggestion that a RAS system could be used as a test bed for such work.
Two water treatment options were proposed and investigations initiated with respect to their effects on taint and odour compounds and on the micro-organisms responsible. The treatments are N-Doped, natural light-catalysed titanium dioxide (TiO2), and hydrogen peroxide (H2O2). Cyanobacteria (Anabaena and Microcystis) were used as a model for AWQC’s purposes and because they have been reported from the RAS system involved in investigation so may be contributing to the T&O issue, although DAF have not found any taint compounds produced by Microcystis. N-doped TiO2 as an algal control method Experiments were carried out by Dr Dewei Chang and Dr Peter Hobson (AWQC) to determine the effect of contact time with N-doped TiO2 with respect to algacidal activity. Methods N-doped TiO2 was produced by combining 20mL of Tetrabutyl Ortho-titanted from (Fluka Analytical 97% min assay) and 10mL of triethylamine (Unilab, 99% min assay) and dissolving in 50ml of absolute ethanol (Labserve 99.5% min assay) and stirred for 30 minutes. 30mls of absolute ethanol and 10mL of mili-Q water were mixed and also added dropwise into this mixture and stirred for 2hours until a transparent sol-gel is observed. This gel is further added dropwise into a 10% clay suspension and stirred for 2 hours. The gel-clay mixture was allowed to settle 16 hours for further colloidation before the clay-gel mixture was dried in an oven at 70oC and further heated at 400oC for 5 hours. Cell integrity was determined using flow cytometry in conjunction with the fluorescent probe SYTOX Green. SYTOX Green penetrates cells with compromised plasma membranes and combines with nucleic acid. The cell will then fluoresce green when

- - 127 - -
exposed to blue light. Hence those cells that show strong green fluorescence are considered non-viable. The flow cytometer allows measurement of this fluorescence in many cells (approximately 1000) in a short space of time (approximately 1 – 2 mins).
Cell integrity is presented as a ratio:
cells with intact membranes after Time (mins) = C total number of cells at time 0 C0
Results Results show that Anabaena is more resistant to TiO2 than Microcystis (Figure 3.15, using: Species: Microcystis and Anabaena; 50,000 cell/mL; cultures in exponential growth phase; TiO2 levels: 0, 5, 10, 20, 40 mg/L; Sampling time: 10, 20, 40, 60 and 120 min.).
0
0.2
0.4
0.6
0.8
1
0 20 40 60 80 100 120 140
Anabaena, 50000 cells/mL
40 mg/L no light40 mg/L20 mg/L10 mg/L5 mg/L2 mg/L0 mg/L
Cel
l int
egrit
y, C
/C0
Time, mins
0
0.2
0.4
0.6
0.8
1
0 20 40 60 80 100 120 140
Microcystis, 50000 cells/mL
40 mg/L no light40 mg/L20 mg/L10 mg/L5 mg/L2 mg/L0 mg/L
Cell
inte
grity
, C/C
0
Time, mins Figure 3.15. Effect of TiO2 concentration and contact time on algae. When cultures were exposed to 20 and 40 mg TiO2/L the percentage of cells with intact cell membranes was reduced to less than 20% after 120 min for Anabaena compared to 40 min for Microcystis. Reduced algaecidal activity was observed at lower concentrations, 10, 5 and 2 mg/L. N/Ti % is another factor that can affect the efficiency
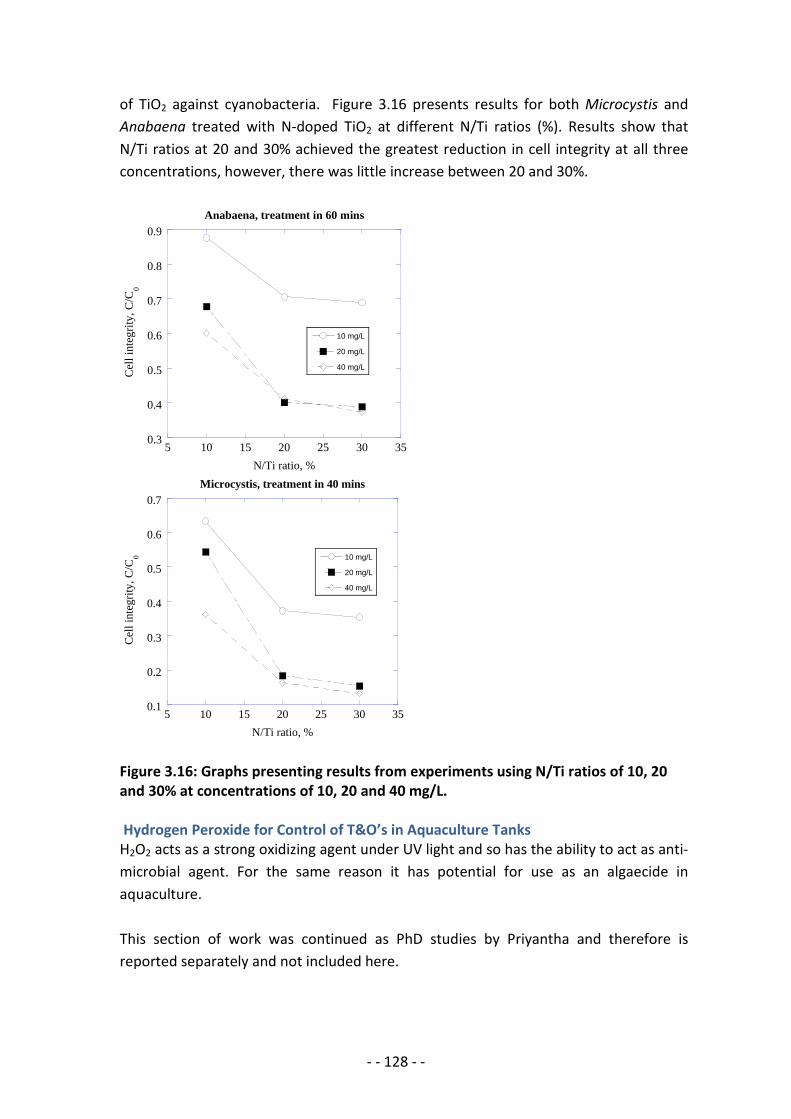
- - 128 - -
of TiO2 against cyanobacteria. Figure 3.16 presents results for both Microcystis and Anabaena treated with N-doped TiO2 at different N/Ti ratios (%). Results show that N/Ti ratios at 20 and 30% achieved the greatest reduction in cell integrity at all three concentrations, however, there was little increase between 20 and 30%.
0.3
0.4
0.5
0.6
0.7
0.8
0.9
5 10 15 20 25 30 35
Anabaena, treatment in 60 mins
10 mg/L
20 mg/L
40 mg/LCel
l int
egrit
y, C
/C0
N/Ti ratio, %
0.1
0.2
0.3
0.4
0.5
0.6
0.7
5 10 15 20 25 30 35
Microcystis, treatment in 40 mins
10 mg/L
20 mg/L
40 mg/L
Cel
l int
egrit
y, C
/C0
N/Ti ratio, % Figure 3.16: Graphs presenting results from experiments using N/Ti ratios of 10, 20 and 30% at concentrations of 10, 20 and 40 mg/L. Hydrogen Peroxide for Control of T&O’s in Aquaculture Tanks H2O2 acts as a strong oxidizing agent under UV light and so has the ability to act as anti-microbial agent. For the same reason it has potential for use as an algaecide in aquaculture. This section of work was continued as PhD studies by Priyantha and therefore is reported separately and not included here.
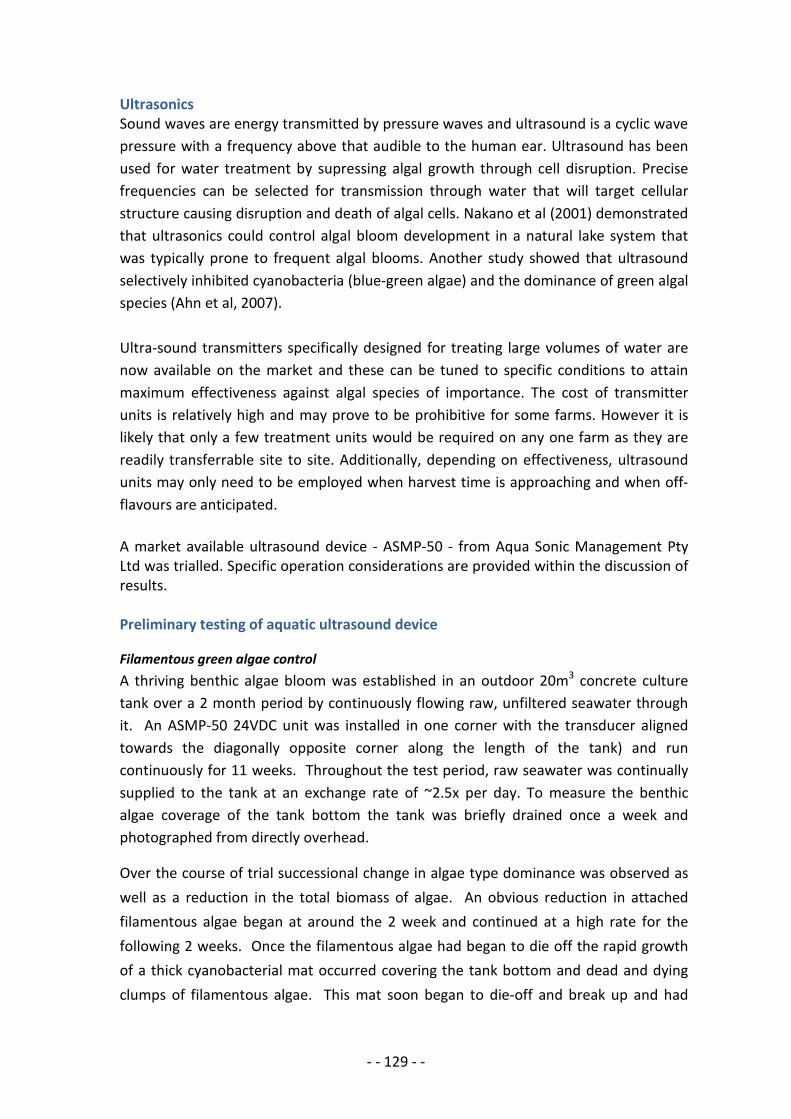
- - 129 - -
Ultrasonics Sound waves are energy transmitted by pressure waves and ultrasound is a cyclic wave pressure with a frequency above that audible to the human ear. Ultrasound has been used for water treatment by supressing algal growth through cell disruption. Precise frequencies can be selected for transmission through water that will target cellular structure causing disruption and death of algal cells. Nakano et al (2001) demonstrated that ultrasonics could control algal bloom development in a natural lake system that was typically prone to frequent algal blooms. Another study showed that ultrasound selectively inhibited cyanobacteria (blue-green algae) and the dominance of green algal species (Ahn et al, 2007). Ultra-sound transmitters specifically designed for treating large volumes of water are now available on the market and these can be tuned to specific conditions to attain maximum effectiveness against algal species of importance. The cost of transmitter units is relatively high and may prove to be prohibitive for some farms. However it is likely that only a few treatment units would be required on any one farm as they are readily transferrable site to site. Additionally, depending on effectiveness, ultrasound units may only need to be employed when harvest time is approaching and when off-flavours are anticipated. A market available ultrasound device - ASMP-50 - from Aqua Sonic Management Pty Ltd was trialled. Specific operation considerations are provided within the discussion of results. Preliminary testing of aquatic ultrasound device
Filamentous green algae control A thriving benthic algae bloom was established in an outdoor 20m3 concrete culture tank over a 2 month period by continuously flowing raw, unfiltered seawater through it. An ASMP-50 24VDC unit was installed in one corner with the transducer aligned towards the diagonally opposite corner along the length of the tank) and run continuously for 11 weeks. Throughout the test period, raw seawater was continually supplied to the tank at an exchange rate of ~2.5x per day. To measure the benthic algae coverage of the tank bottom the tank was briefly drained once a week and photographed from directly overhead.
Over the course of trial successional change in algae type dominance was observed as well as a reduction in the total biomass of algae. An obvious reduction in attached filamentous algae began at around the 2 week and continued at a high rate for the following 2 weeks. Once the filamentous algae had began to die off the rapid growth of a thick cyanobacterial mat occurred covering the tank bottom and dead and dying clumps of filamentous algae. This mat soon began to die-off and break up and had
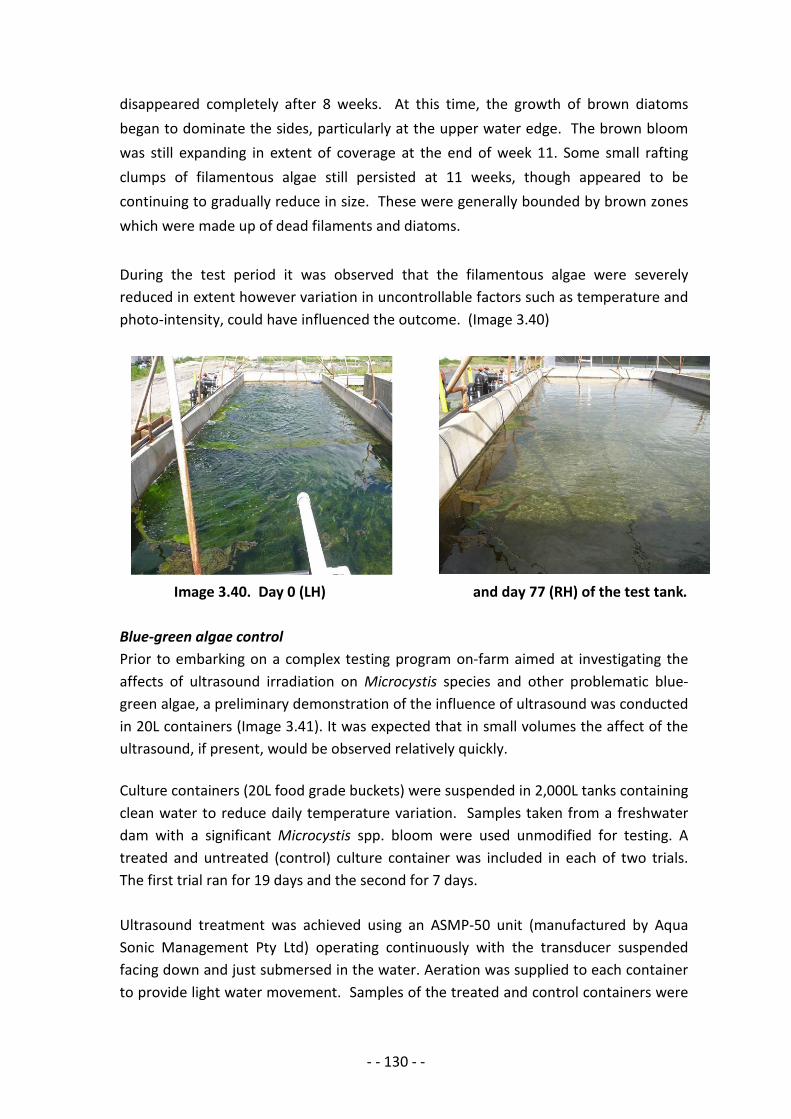
- - 130 - -
disappeared completely after 8 weeks. At this time, the growth of brown diatoms began to dominate the sides, particularly at the upper water edge. The brown bloom was still expanding in extent of coverage at the end of week 11. Some small rafting clumps of filamentous algae still persisted at 11 weeks, though appeared to be continuing to gradually reduce in size. These were generally bounded by brown zones which were made up of dead filaments and diatoms. During the test period it was observed that the filamentous algae were severely reduced in extent however variation in uncontrollable factors such as temperature and photo-intensity, could have influenced the outcome. (Image 3.40)
Image 3.40. Day 0 (LH) and day 77 (RH) of the test tank. Blue-green algae control Prior to embarking on a complex testing program on-farm aimed at investigating the affects of ultrasound irradiation on Microcystis species and other problematic blue-green algae, a preliminary demonstration of the influence of ultrasound was conducted in 20L containers (Image 3.41). It was expected that in small volumes the affect of the ultrasound, if present, would be observed relatively quickly. Culture containers (20L food grade buckets) were suspended in 2,000L tanks containing clean water to reduce daily temperature variation. Samples taken from a freshwater dam with a significant Microcystis spp. bloom were used unmodified for testing. A treated and untreated (control) culture container was included in each of two trials. The first trial ran for 19 days and the second for 7 days. Ultrasound treatment was achieved using an ASMP-50 unit (manufactured by Aqua Sonic Management Pty Ltd) operating continuously with the transducer suspended facing down and just submersed in the water. Aeration was supplied to each container to provide light water movement. Samples of the treated and control containers were
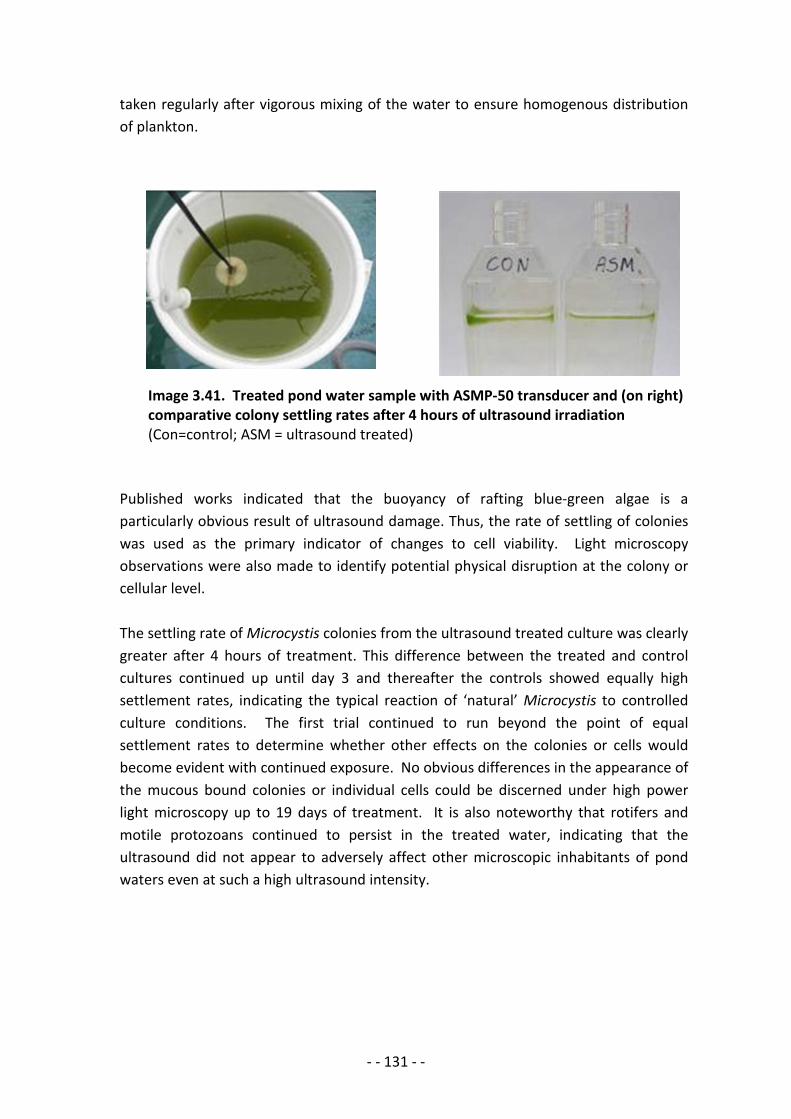
- - 131 - -
taken regularly after vigorous mixing of the water to ensure homogenous distribution of plankton.
Image 3.41. Treated pond water sample with ASMP-50 transducer and (on right) comparative colony settling rates after 4 hours of ultrasound irradiation (Con=control; ASM = ultrasound treated)
Published works indicated that the buoyancy of rafting blue-green algae is a particularly obvious result of ultrasound damage. Thus, the rate of settling of colonies was used as the primary indicator of changes to cell viability. Light microscopy observations were also made to identify potential physical disruption at the colony or cellular level. The settling rate of Microcystis colonies from the ultrasound treated culture was clearly greater after 4 hours of treatment. This difference between the treated and control cultures continued up until day 3 and thereafter the controls showed equally high settlement rates, indicating the typical reaction of ‘natural’ Microcystis to controlled culture conditions. The first trial continued to run beyond the point of equal settlement rates to determine whether other effects on the colonies or cells would become evident with continued exposure. No obvious differences in the appearance of the mucous bound colonies or individual cells could be discerned under high power light microscopy up to 19 days of treatment. It is also noteworthy that rotifers and motile protozoans continued to persist in the treated water, indicating that the ultrasound did not appear to adversely affect other microscopic inhabitants of pond waters even at such a high ultrasound intensity.
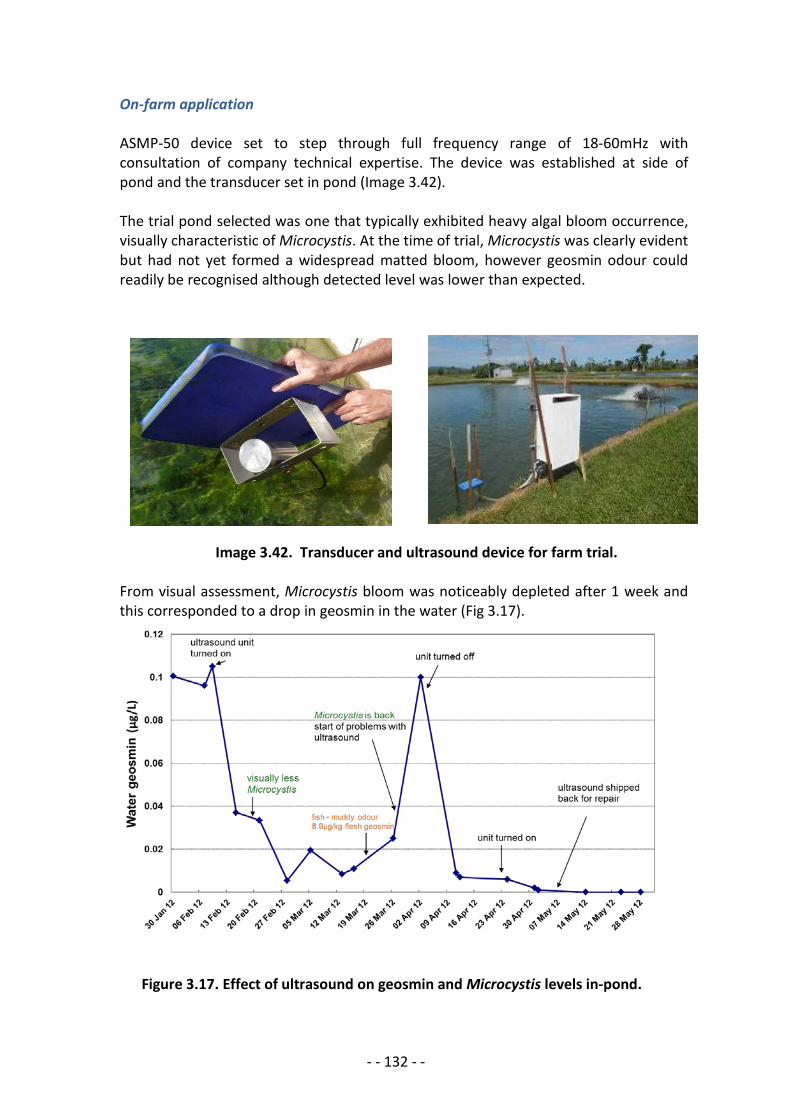
- - 132 - -
On-farm application ASMP-50 device set to step through full frequency range of 18-60mHz with consultation of company technical expertise. The device was established at side of pond and the transducer set in pond (Image 3.42). The trial pond selected was one that typically exhibited heavy algal bloom occurrence, visually characteristic of Microcystis. At the time of trial, Microcystis was clearly evident but had not yet formed a widespread matted bloom, however geosmin odour could readily be recognised although detected level was lower than expected.
Image 3.42. Transducer and ultrasound device for farm trial. From visual assessment, Microcystis bloom was noticeably depleted after 1 week and this corresponded to a drop in geosmin in the water (Fig 3.17).
Figure 3.17. Effect of ultrasound on geosmin and Microcystis levels in-pond.
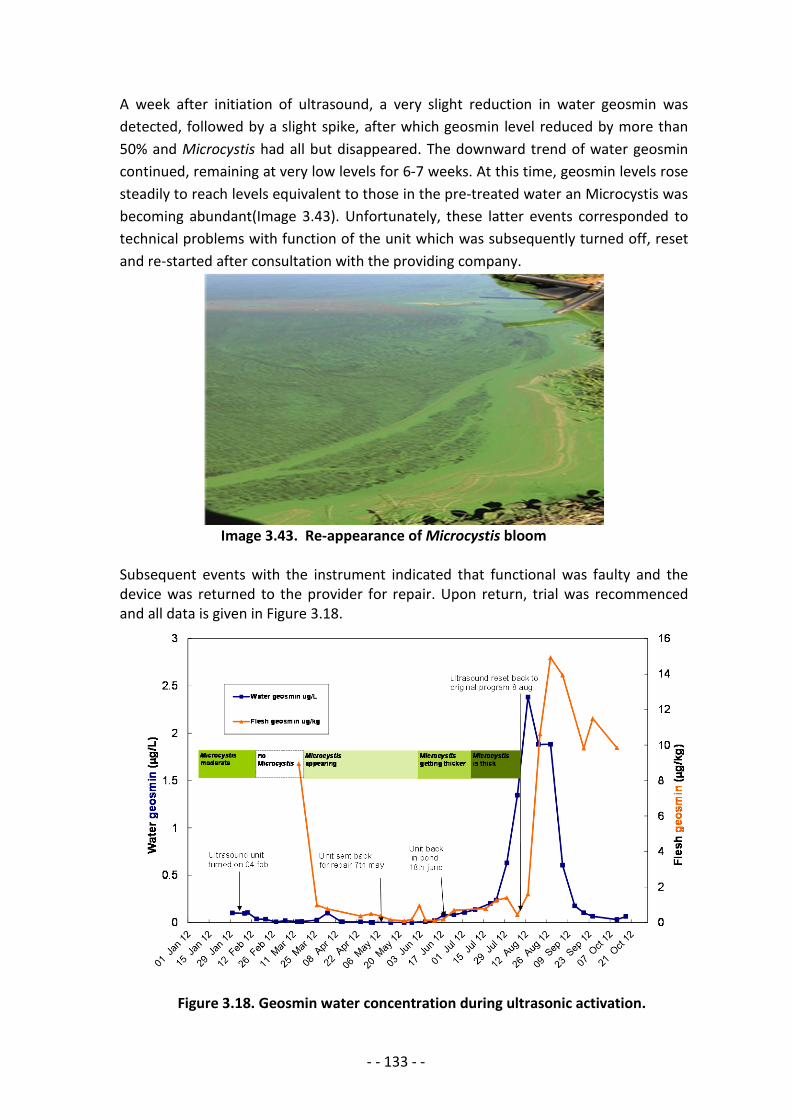
- - 133 - -
A week after initiation of ultrasound, a very slight reduction in water geosmin was detected, followed by a slight spike, after which geosmin level reduced by more than 50% and Microcystis had all but disappeared. The downward trend of water geosmin continued, remaining at very low levels for 6-7 weeks. At this time, geosmin levels rose steadily to reach levels equivalent to those in the pre-treated water an Microcystis was becoming abundant(Image 3.43). Unfortunately, these latter events corresponded to technical problems with function of the unit which was subsequently turned off, reset and re-started after consultation with the providing company.
Image 3.43. Re-appearance of Microcystis bloom Subsequent events with the instrument indicated that functional was faulty and the device was returned to the provider for repair. Upon return, trial was recommenced and all data is given in Figure 3.18. Figure 3.18. Geosmin water concentration during ultrasonic activation.
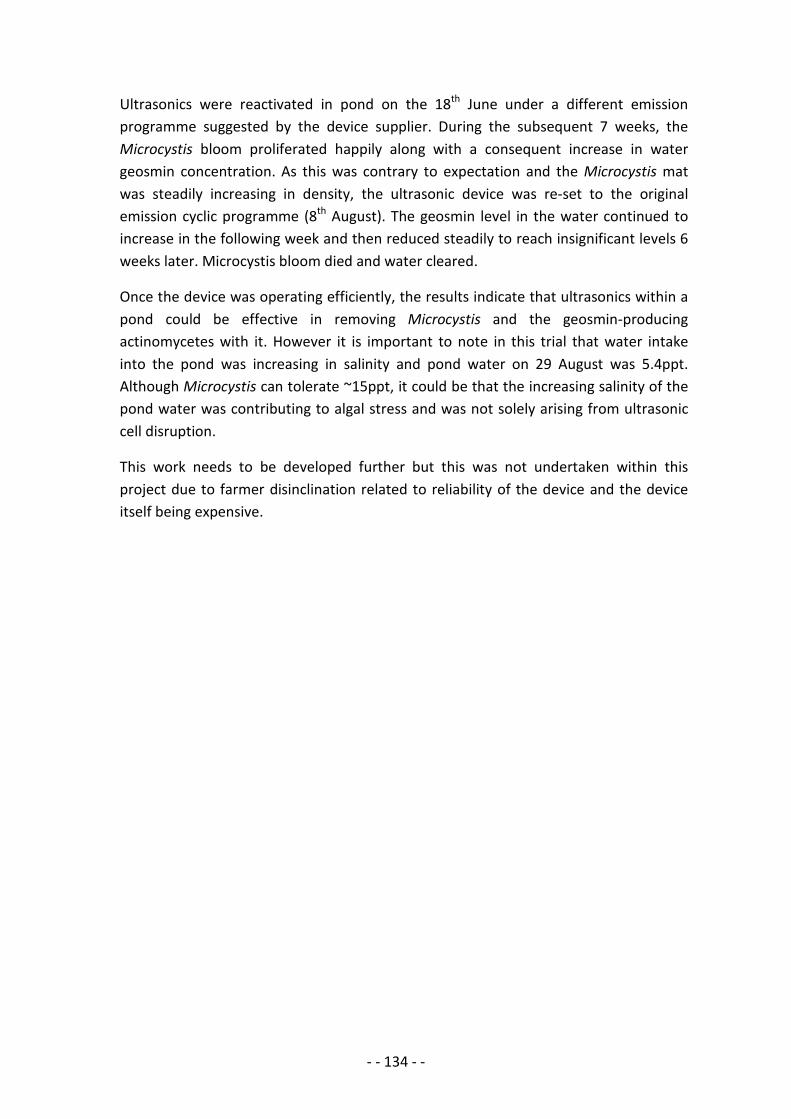
- - 134 - -
Ultrasonics were reactivated in pond on the 18th June under a different emission programme suggested by the device supplier. During the subsequent 7 weeks, the Microcystis bloom proliferated happily along with a consequent increase in water geosmin concentration. As this was contrary to expectation and the Microcystis mat was steadily increasing in density, the ultrasonic device was re-set to the original emission cyclic programme (8th August). The geosmin level in the water continued to increase in the following week and then reduced steadily to reach insignificant levels 6 weeks later. Microcystis bloom died and water cleared.
Once the device was operating efficiently, the results indicate that ultrasonics within a pond could be effective in removing Microcystis and the geosmin-producing actinomycetes with it. However it is important to note in this trial that water intake into the pond was increasing in salinity and pond water on 29 August was 5.4ppt. Although Microcystis can tolerate ~15ppt, it could be that the increasing salinity of the pond water was contributing to algal stress and was not solely arising from ultrasonic cell disruption.
This work needs to be developed further but this was not undertaken within this project due to farmer disinclination related to reliability of the device and the device itself being expensive.
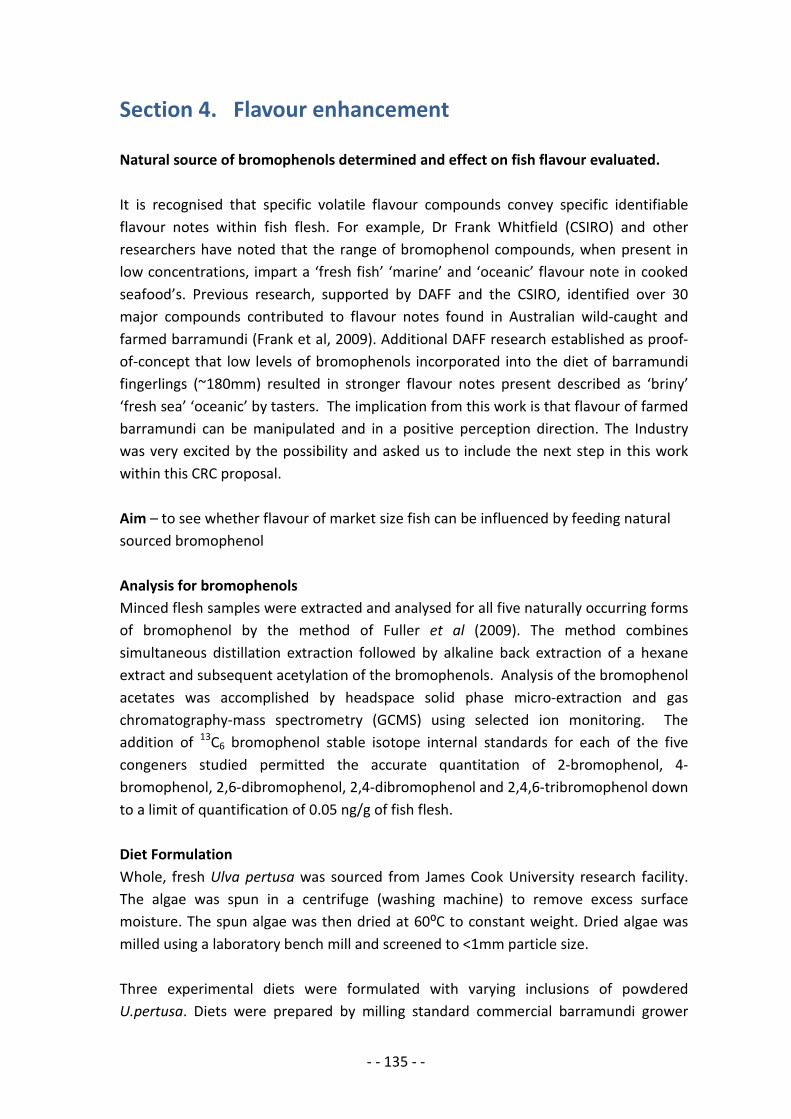
- - 135 - -
Section 4. Flavour enhancement Natural source of bromophenols determined and effect on fish flavour evaluated. It is recognised that specific volatile flavour compounds convey specific identifiable flavour notes within fish flesh. For example, Dr Frank Whitfield (CSIRO) and other researchers have noted that the range of bromophenol compounds, when present in low concentrations, impart a ‘fresh fish’ ‘marine’ and ‘oceanic’ flavour note in cooked seafood’s. Previous research, supported by DAFF and the CSIRO, identified over 30 major compounds contributed to flavour notes found in Australian wild-caught and farmed barramundi (Frank et al, 2009). Additional DAFF research established as proof-of-concept that low levels of bromophenols incorporated into the diet of barramundi fingerlings (~180mm) resulted in stronger flavour notes present described as ‘briny’ ‘fresh sea’ ‘oceanic’ by tasters. The implication from this work is that flavour of farmed barramundi can be manipulated and in a positive perception direction. The Industry was very excited by the possibility and asked us to include the next step in this work within this CRC proposal. Aim – to see whether flavour of market size fish can be influenced by feeding natural sourced bromophenol Analysis for bromophenols Minced flesh samples were extracted and analysed for all five naturally occurring forms of bromophenol by the method of Fuller et al (2009). The method combines simultaneous distillation extraction followed by alkaline back extraction of a hexane extract and subsequent acetylation of the bromophenols. Analysis of the bromophenol acetates was accomplished by headspace solid phase micro-extraction and gas chromatography-mass spectrometry (GCMS) using selected ion monitoring. The addition of 13C6 bromophenol stable isotope internal standards for each of the five congeners studied permitted the accurate quantitation of 2-bromophenol, 4-bromophenol, 2,6-dibromophenol, 2,4-dibromophenol and 2,4,6-tribromophenol down to a limit of quantification of 0.05 ng/g of fish flesh. Diet Formulation Whole, fresh Ulva pertusa was sourced from James Cook University research facility. The algae was spun in a centrifuge (washing machine) to remove excess surface moisture. The spun algae was then dried at 60⁰C to constant weight. Dried algae was milled using a laboratory bench mill and screened to <1mm particle size. Three experimental diets were formulated with varying inclusions of powdered U.pertusa. Diets were prepared by milling standard commercial barramundi grower

- - 136 - -
diet (Ridley Aquafeed, <1mm particle size) and reconstituting with dried U. pertusa powder and pre-gel maize starch as binder such that the final U. pertusa content equated to 0%, 30% and 50% of total dry ingredients for the three diets respectively. Water was added and the mixture forced through a 10mm die. The mixture was then cut into 10mm long pellets. The pellets were dried at 60⁰C for 24 hours. Feeding Trial Plate sized barramundi were obtained from a local farm and held in water devoid of off-flavour taint for a period of ~30 days and fed standard commercial diets. After ~30 days three fish were randomly allocated to each of 9500L tanks. The three tanks were allocated one to each experimental diet. One fish was removed from each tank, euthanized by ice emersion, filleted and the fillets frozen to -20⁰C after 10days, 20days, and 30days. Sensory assessment was carried out at James Cook University to determine if the use of diets containing U. Pertusa altered the flavour of farmed barramundi compared to fish reared on standard commercial diets. Additional sensory evaluation was carried out at DAFF sensory laboratories (Brisbane) to determine if the addition of U. pertusa produced barramundi fillets that were similar in flavour to marine fish. Sensory assessment (JCU) Triangle tests were carried out to determine the impacts of feeding farmed barramundi diets rich in the marine algae U. pertusa. Fish that had been fed a diet consisting of 30% U.pertusa (dry weight) (diet 1) for a period of 20 days were selected for use in sensory assessment and compared to fish that had been fed a diet containing no U.pertusa (diet 2). An untrained panel of 35 members (male and female) who identified themselves as regular seafood consumers was assembled to take part in the triangle tests. Initially, three raw portions were offered and the panellists asked to assess the aroma of the samples. Following the initial round of aroma testing, cooked portions of barramundi flesh were presented and the panellists asked to identify the different sample within each triangle test. Additionally, panellists were invited to comment on the most significant aromas and flavours present, including aftertaste of all samples. Sensory evaluation (DAFF) Sensory assessment of two fish flesh samples was by a paired comparison test, following Australian Standard Methods Sensory Analysis principles (AS 2542.2.1-2007). A directional difference test was selected as most appropriate to focus on a single characteristic attribute on the basis that it provides a specific outcome and requires minimal volume of product sample (the latter being the case within the feeding trial above). A directional difference test can be unilateral or bilateral and the method is used to specify how a particular sensory property differs between two samples. As there was a prior expectation that the treatment sample could be higher in ‘fresh
- - 137 - -
ocean fish’ intensity, a unilateral test was performed. The test requires little training of respondents; however panellists must fully comprehend the attribute being tested. For this reason a short orientation on the term ‘fresh ocean fish’ aroma was first explained to respondents prior testing by providing definitions from similar work published in the literature such as ‘fresh marine aroma’ ‘fresh seaweed’ and ‘fresh ocean breeze’. Participants were provided with a reference flesh sample which had been previously identified to be indicative of a ‘fresh ocean fish’ aroma and flavour by a trained seafood panel. The different flesh samples assessed were barramundi fed 30% U.pertusa for 30 days and fish fed on a standard barramundi diet (0% U.pertusa) from the above described feeding trial. A familiarisation sample of wild-caught Goldband snapper from NT waters was used as the marine fish reference standard for training the panellists prior to assessment of the barramundi samples.
Flesh samples were prepared from skinned, deboned fish fillets by taking anterior dorsal sections mid fillet under the dorsal fin area. Sections were then minced using a Kenwood KM201 mixer, operated at medium speed with mincing attachment of 4mm mesh size. Although not a usual product format for presentation to tasters, the mincing step for this test was essential to eliminate any distracting influence of textural differences between the fish species and hence aid focus on the aroma and flavour parameters being assessed. Cooked flesh samples were prepared with 10g of minced flesh placed in a plastic dish with lid and micro-waved (1500 watt) at full power for 20 seconds. These conditions provided an internal core temperature of the minced flesh to 72oC being achieved. Cooked samples were presented immediately to taste panellists to achieve greatest impact from aroma volatiles. Each sample was given a 3-digit random code identifier with panellists requested to taste samples in the order presented, which was randomly generated across the panel. Panellists (37) were asked to concentrate on aroma and flavour notes of “fresh ocean fish” only. The test is a forced choice test whereby participants must make a choice and note any ambivalence in a comments section provided. Responses were computerised using sensory evaluation software (Compusense V, version 4.0; Compusense Inc., Guelph, Ontario, Canada.) allowing rapid analysis of results. Data was collated and responses identifying a sample most frequently higher in ‘fresh ocean fish’ aroma and/or taste compared to a table giving significant numbers of correct responses according to a predetermined confidence level of P=0.05.
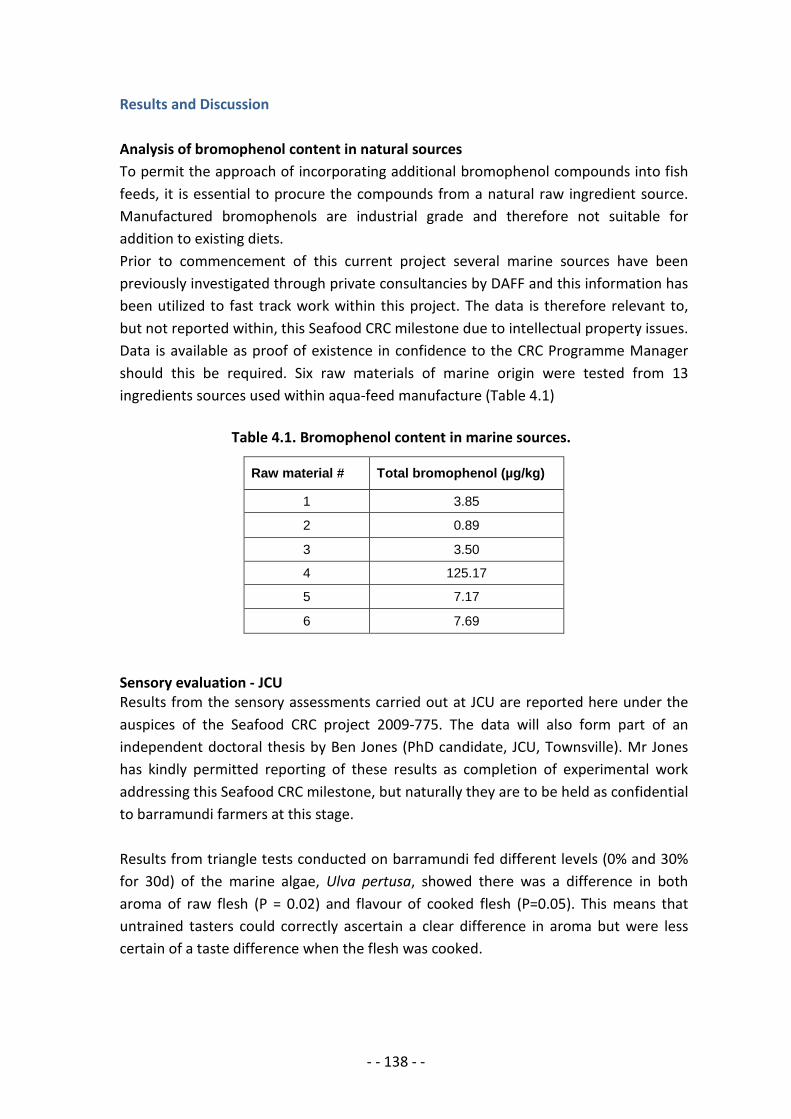
- - 138 - -
Results and Discussion Analysis of bromophenol content in natural sources To permit the approach of incorporating additional bromophenol compounds into fish feeds, it is essential to procure the compounds from a natural raw ingredient source. Manufactured bromophenols are industrial grade and therefore not suitable for addition to existing diets. Prior to commencement of this current project several marine sources have been previously investigated through private consultancies by DAFF and this information has been utilized to fast track work within this project. The data is therefore relevant to, but not reported within, this Seafood CRC milestone due to intellectual property issues. Data is available as proof of existence in confidence to the CRC Programme Manager should this be required. Six raw materials of marine origin were tested from 13 ingredients sources used within aqua-feed manufacture (Table 4.1) Table 4.1. Bromophenol content in marine sources.
Raw material # Total bromophenol (µg/kg)
1 3.85
2 0.89
3 3.50
4 125.17
5 7.17
6 7.69
Sensory evaluation - JCU Results from the sensory assessments carried out at JCU are reported here under the auspices of the Seafood CRC project 2009-775. The data will also form part of an independent doctoral thesis by Ben Jones (PhD candidate, JCU, Townsville). Mr Jones has kindly permitted reporting of these results as completion of experimental work addressing this Seafood CRC milestone, but naturally they are to be held as confidential to barramundi farmers at this stage. Results from triangle tests conducted on barramundi fed different levels (0% and 30% for 30d) of the marine algae, Ulva pertusa, showed there was a difference in both aroma of raw flesh (P = 0.02) and flavour of cooked flesh (P=0.05). This means that untrained tasters could correctly ascertain a clear difference in aroma but were less certain of a taste difference when the flesh was cooked.
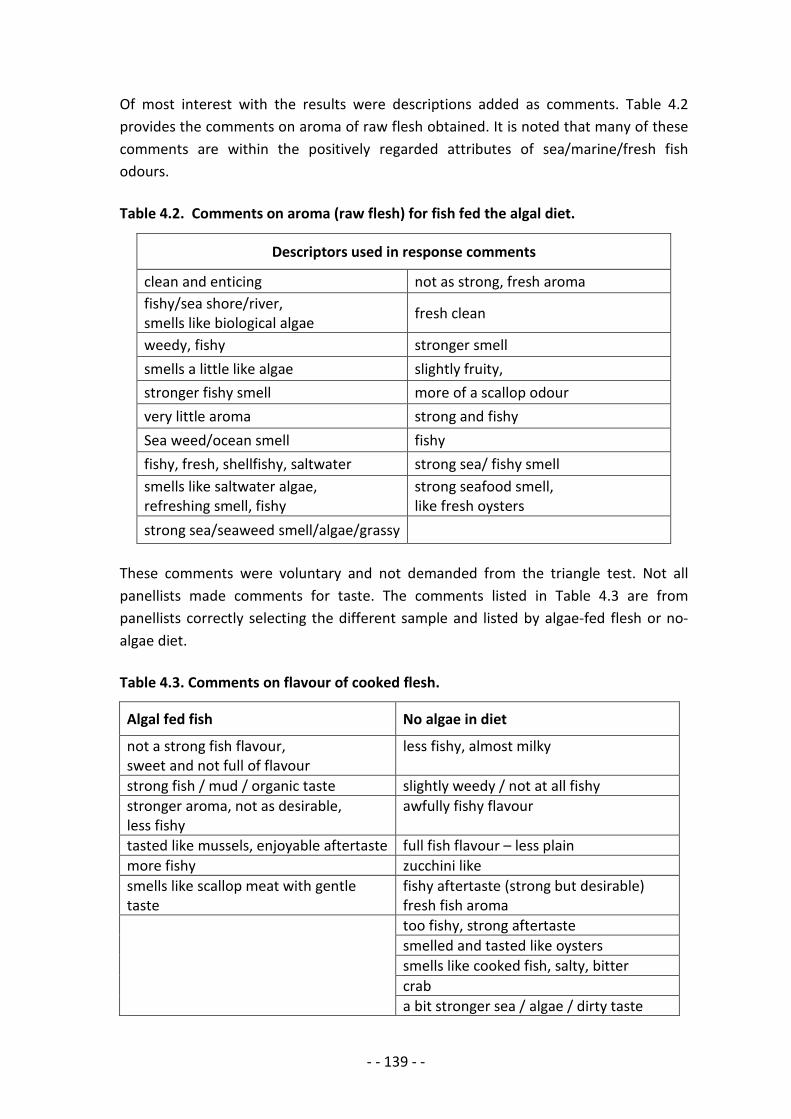
- - 139 - -
Of most interest with the results were descriptions added as comments. Table 4.2 provides the comments on aroma of raw flesh obtained. It is noted that many of these comments are within the positively regarded attributes of sea/marine/fresh fish odours. Table 4.2. Comments on aroma (raw flesh) for fish fed the algal diet.
These comments were voluntary and not demanded from the triangle test. Not all panellists made comments for taste. The comments listed in Table 4.3 are from panellists correctly selecting the different sample and listed by algae-fed flesh or no-algae diet. Table 4.3. Comments on flavour of cooked flesh.
Algal fed fish No algae in diet
not a strong fish flavour, sweet and not full of flavour
less fishy, almost milky
strong fish / mud / organic taste slightly weedy / not at all fishy stronger aroma, not as desirable, less fishy
awfully fishy flavour
tasted like mussels, enjoyable aftertaste full fish flavour – less plain more fishy zucchini like smells like scallop meat with gentle taste
fishy aftertaste (strong but desirable) fresh fish aroma
too fishy, strong aftertaste smelled and tasted like oysters smells like cooked fish, salty, bitter crab a bit stronger sea / algae / dirty taste
Descriptors used in response comments
clean and enticing not as strong, fresh aroma fishy/sea shore/river, smells like biological algae fresh clean
weedy, fishy stronger smell smells a little like algae slightly fruity, stronger fishy smell more of a scallop odour very little aroma strong and fishy Sea weed/ocean smell fishy fishy, fresh, shellfishy, saltwater strong sea/ fishy smell smells like saltwater algae, refreshing smell, fishy
strong seafood smell, like fresh oysters
strong sea/seaweed smell/algae/grassy
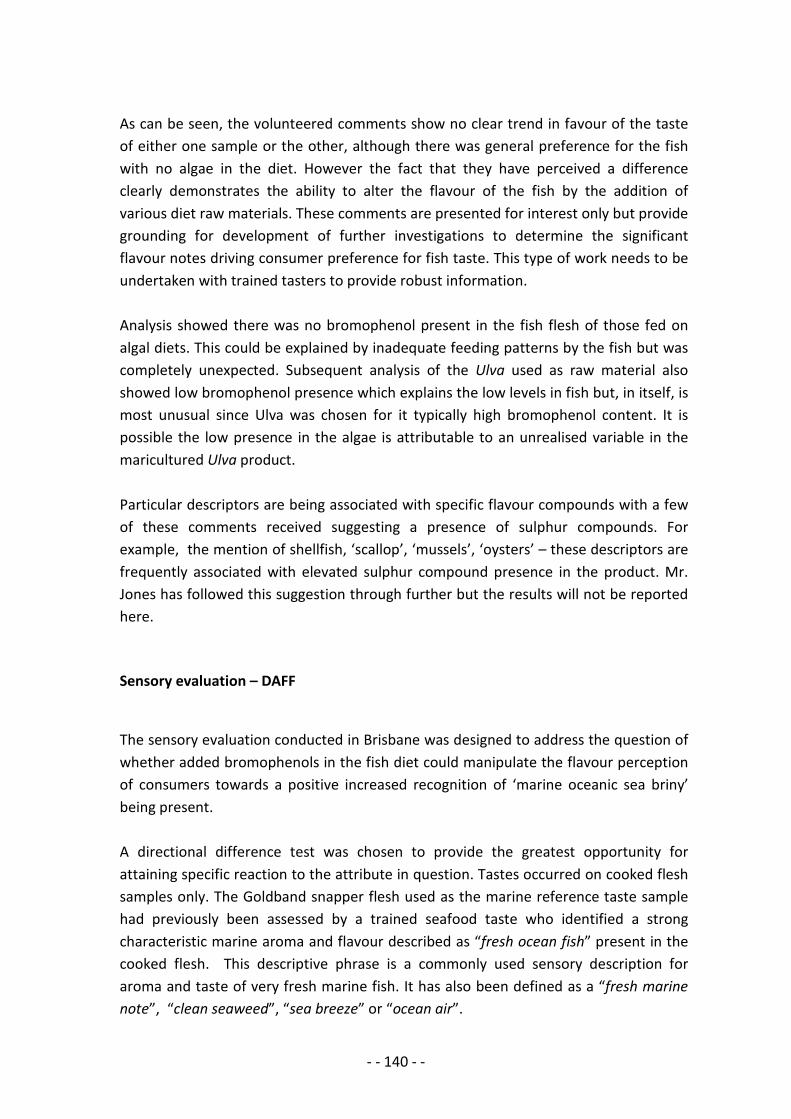
- - 140 - -
As can be seen, the volunteered comments show no clear trend in favour of the taste of either one sample or the other, although there was general preference for the fish with no algae in the diet. However the fact that they have perceived a difference clearly demonstrates the ability to alter the flavour of the fish by the addition of various diet raw materials. These comments are presented for interest only but provide grounding for development of further investigations to determine the significant flavour notes driving consumer preference for fish taste. This type of work needs to be undertaken with trained tasters to provide robust information. Analysis showed there was no bromophenol present in the fish flesh of those fed on algal diets. This could be explained by inadequate feeding patterns by the fish but was completely unexpected. Subsequent analysis of the Ulva used as raw material also showed low bromophenol presence which explains the low levels in fish but, in itself, is most unusual since Ulva was chosen for it typically high bromophenol content. It is possible the low presence in the algae is attributable to an unrealised variable in the maricultured Ulva product. Particular descriptors are being associated with specific flavour compounds with a few of these comments received suggesting a presence of sulphur compounds. For example, the mention of shellfish, ‘scallop’, ‘mussels’, ‘oysters’ – these descriptors are frequently associated with elevated sulphur compound presence in the product. Mr. Jones has followed this suggestion through further but the results will not be reported here. Sensory evaluation – DAFF
The sensory evaluation conducted in Brisbane was designed to address the question of whether added bromophenols in the fish diet could manipulate the flavour perception of consumers towards a positive increased recognition of ‘marine oceanic sea briny’ being present. A directional difference test was chosen to provide the greatest opportunity for attaining specific reaction to the attribute in question. Tastes occurred on cooked flesh samples only. The Goldband snapper flesh used as the marine reference taste sample had previously been assessed by a trained seafood taste who identified a strong characteristic marine aroma and flavour described as “fresh ocean fish” present in the cooked flesh. This descriptive phrase is a commonly used sensory description for aroma and taste of very fresh marine fish. It has also been defined as a “fresh marine note”, “clean seaweed”, “sea breeze” or “ocean air”.
- - 141 - -
Responses from the difference test to determine whether one flesh sample provided a stronger perception of “fresh ocean fish” showed:
Aroma - 18 people selected the control sample - 19 people selected the treatment sample Flavour - 22 people selected the control sample - 15 people selected the treatment sample
The directional difference test is a one-sided test, so from a total of 37 respondents 24 people were required to have chosen the same sample for the selection to be significant to the P=0.05 level. From the results this was not the case. It is noted in the above discussion that the bromophenol level in the algal-fed fish was low and so it is not unexpected that the barramundi flesh did not register with a strong “fresh ocean” aroma or flavour. For aroma, responses indicated there was no difference between the fish samples. With flavour assessments, while not quite significant to the P=0.05 level, tasters correctly selected the sample fed the standard diet more frequently. Given that the training was driven towards the presence of marine and oceanic notes, these responses suggest that the fish without Ulva in their diet gave stronger perceptions of these notes than the Ulva-fed fish. This was unexpected, however from comments received verbally from panellists, the Ulva-fed fish had strong “other’ notes present: comments of “scallop-like”; scallopy” “meaty” were used. On the basis of this, it is suggested that many other volatile compounds within the Ulva itself are contributing to overall flavour perception. As the particular batch of Ulva used to make the new diet was low in bromophenols, it is likely other compounds were predominating. The interesting implication from this work is that it clearly is possible to manipulate flavour through fish diet. This area of work needs more investigation and perhaps different trial design. It would be very relevant to assess algal-fed barramundi directly with blue-water wild caught barramundi. This was attempted for this taste test investigation. However, despite trying several sources of wild caught barramundi, none were free from geosmin/MIB taint. It was considered that this taint could readily interfere with any “fresh oceanic” aroma or flavour notes that may be present and hence the wild caught fish available were deemed inappropriate for use. Wild caught fish from a different seasonal period would be worth attaining for repeat sensory assessments of this nature.
- - 142 - -
Benefits and Adoption Benefits provided from the findings of this research are gained right along the farmed barramundi supply chain. In the first instance, barramundi farmers are the main beneficiaries as they now have greater understanding of taint occurrence and the environmental conditions that engender taint events. Knowledge that geosmin is the primary taint cause and that the source is specific actinomycetes species, allows targeted remedial methods directed at taint occurrence. The range of mitigation tools documented is varied, with effectiveness evaluated appropriate to different farm and event situations, providing industry with practical options. Unfortunately, there is no one solution fitting all. Additionally, the barramundi farmers now have a simple reference taste-testing protocol for use prior to fish harvest. This ensures that only fish with consistent flavour quality are presented to market and by this action, the retail sector and consumers benefit. It will inevitably take time for barramundi flavour quality to achieve full recognition amongst buyers. As awareness and consumer satisfaction grows, confidence in farmed product will strengthen creating additional demand and an increase in willingness to pay. Throughout project conduction an accompanying benefit was observed within the farmed barramundi industry – that of strengthened communication and co-operation across members. This was evidenced in greater openness in sharing information and in the unified approach to the issue that developed. It is likely that this will have continued effect with other industry issues. The farmed barramundi industry has strong commitment to actively addressing taint issues in product and this has driven willing participation throughout all trial investigations. From this commitment, the need to encourage adoption of methods that reduce taint incidence never arose. On the contrary, where a specific method showed a degree of success in reducing bloom occurrence, and hence taint, farm management operation persisted with application of the method long past trial completion. Moreover when a new occurrence occurred, farm management contacted the research team for advice to confirm that their choice of remedial method was suitable for the particular set of conditions. The nature of the issue this research was directed towards and the keenness from the industry to resolve the issue, dictated intrinsic adoption of new information from the project. Furthermore, the reference taste test protocol developed for use on-farm prior to harvest of fish has been adopted universally across all farms as standard practice. This
- - 143 - -
method has also been incorporated as a requirement for action within the Sustainably Farmed Barramundi Certification Programme recently developed and adopted by the ABFA as a quality branding differentiation of Australian farmed barramundi.
Further Development Research work within this project has generated a wealth of new information on muddy taints occurring in freshwater barramundi farmed in open-culture ponds in North Queensland. Importantly, we now know that the primary taint compound is geosmin and MIB only contributes occasionally on specific farms. Most significantly, we identified that the origin of geosmin was actinomycetes species and only occasional blue-green algae source which was unexpected. Additionally, we have demonstrated a synergistic relationship between actinomycetes and Microcystis, the interaction resulting in high geosmin production. Given these new findings, a world of further research has opened up, most of which was beyond the scope of this project. It is suggested that important areas for further work of most benefit to the Industry should focus on restricting proliferation of both high geosmin-producing actinomycetes and Microcystis blooms. Having shown the strong contributory role of actinomycetes in taint production in NQ ponds and also that geosmin production appears to be exacerbated when actinomycetes are in the presence of Microcystis blooms, we believe there needs to be a double-pronged approach for a mitigation control. It is envisaged that a ‘treatment’ solution consisting of actinophage(s) along with cyanophage(s) specific to Microcystis. Actinophage The attractiveness of using actinophage as a remedial tool for restricting geosmin production arises from their existence as part of the natural microbial flora of the pond ecosystem. This negates the perception of introducing ‘foreign’ matter into the pond. The ‘treatment’ would be merely using what is already present in the pond and re-introducing it at an increased level. Additionally, as part of the natural pond flora, inherent controls exist to limit the phage proliferation over time which therefore would retain microbial population balance within the pond water. Research work within this project explored the potential of using actinophage as a treatment solution to control and manage actinomycetes populations. Several actinophages were demonstrated to be highly active against actinomycetes isolated from pond waters. However, actinomycetes populations present in pond water at any
- - 144 - -
point in time, are extremely dynamic with respect to species composition. Population shifts are dictated by a plethora of environmental factors. These include those within the pond such as water quality parameters, soil type and aquatic vegetation, intake water quality and pond management practices, as well as feeding regimes. Additionally, external factors such as activities outside the pond, rainfall and even wind direction can have an effect as actinomycetes can be wind-borne. Given these multiple influences on actinomycetes presence, information is required on which species capable of producing high levels of geosmin are present most frequently throughout seasons. The amount of research required to achieve such knowledge is extensive as a ‘treatment’ solution of actinophage needs to be specifically relevant to those actinomycetes present in the pond water at application time. Additionally, to develop an actinophage solution suitable for use by Industry there is a range of practical considerations to be determined: • up-scaling aspects associated with commercial use • storage life of active actinophage solution • transport parameters • method of application to the pond • most effective application time – phase of bloom and time of day
Cyanophage Similar to actinophage, a cyanophage treatment holds attraction on the basis of being already present in the pond water as part of the natural microbial flora. Findings from this project illustrated that the predominant blue-green algae present in barramundi ponds was Microcystis and furthermore that the ubiquitous species was M.aeruginosa with only occasional occurrence of M.flos-aquae, a species very similar to M.aeruginosa. The is fortuitous with respect to developing a cyanophage treatment as mitigation tool because it can be based on cyanophage active against one species of Microcystis only for all farms. Within the current project timeframe and scope, there was limited ability to pursue this direction. Initial laboratory experiments demonstrated successful lysis of Microcystis strains isolated from pond waters by cyanophage and illustrated the effect was very rapid. However, attempts to undertake the next steps were hampered by failure to develop a successful cyanophage activity assay using Microcystis as host. This is the first essential requirement to be undertaken.
- - 145 - -
Once this has been achieved further work towards developing a cyanophage treatment should include similar aspects of commercial use mentioned for an actinophage treatment solution. Other considerations The research undertaken in this current project constitutes the first documented evaluation of different methods for mitigation of muddy taint in farmed barramundi. Each of the methods showed some degree of effectiveness dependent upon bloom event and environmental conditions occurring on the specific farm at the time. However, none of the methods was the “silver bullet”. On this basis, further investigation of each of the ‘treatment’ tools assessed is warranted. Two mitigation tools, regular addition of molasses and dosing pond water with lysine, showed the greatest promise with respect to cost-effectiveness and ease of application. Therefore, future research effort should focus in these areas as a priority. An area of potential merit not investigated within this current project, is that of employing specific bacteria capable of degrading the geosmin compound present in the water. There are some reports noting bacterial species that have this capability but further research is required to determine their effectiveness within a pond environment and to confirm that their incorporation does not adversely imbalance the established pond microflora.
Planned Outcomes
The priority outcome for the farmed barramundi industry is to deliver premium quality fish with characteristic flavour. To help achieve this, the planned outcomes of this research encompassed: Public benefit outcomes
• consistent flavour quality for farmed barramundi that meets consumer
expectations This was the primary focus of research in this project and the development of a simple on-farm taste assessment protocol, to be carried out prior to harvest of any fish, provides a standard method to enable achievement of this outcome.
• implementation of best practice measures will allow repositioning of farmed
barramundi in the marketplace

- - 146 - -
• increased viability of the barramundi farming industry Knowledge and tools provided from this research will strongly assist production of fish with consistent characteristic flavour and the increased confidence this will engender in the marketplace will contribute to both these outcomes. These are inherently long-term effects. • decision basis for pursuing commercially practical flavour enhancement through
incorporation of natural seaweed extracts into a finishing diet Further knowledge of the effect of specific algae incorporated into fish diets has provided a solid base for advancing development in this area. We have shown that such diets can successfully be extruded, that algae content can be relatively high and that they are acceptable to fish as feed. Barramundi flavour was influenced in a positive direction as assessed by taste assessment. These fundamental factors provide a good foundation from which to develop further research effort. Private benefit outcomes • reduced incidence of muddy taint in farmed barramundi by barramundi farms
implementing proven protocols that prevent taint occurring Increased knowledge of environmental conditions that influence taint presence and the source of taint raises awareness within the farming Industry for timely preventative action. The range of mitigation methods, shown suitable for different situations, provides selective options for each farm operation. From the choices available, business decisions around prevention of taint occurrence or short sharp treatment action can be made. • increased demand for farmed product and market expansion • improved revenue return to the production sector and through the barramundi
value chain Success in achieving both these outcomes is a long-term process. Knowledge and tools provided as outputs of this project allow production of fish with consistent quality flavour and consumer recognition will facilitate both these outcomes. Linkages with CRC Milestone outcomes Outputs from this project contribute to the Seafood CRC Milestone 2.7.2. Individually tailored approaches to overcoming barriers trialled and evaluated. Successful outcomes from this work also support the Seafood CRC project: Repositioning Australian farmed Barramundi in the domestic market. and outputs from this project underpin the quality section of the Sustainably Farmed Barramundi Gold Tick.
- - 147 - -
Conclusion Research work within this project has generated a wealth of new information on muddy taints occurring in freshwater barramundi farmed in open-culture ponds in North Queensland. Extensive monitoring of ponds for taint presence illustrated that taint events were highly farm specific and dependent on environmental conditions. It was clear that water quality is a critical factor and where intake water has a high nutrient load, algal blooms flourished usually with a concomitant taint event. There was a seasonal pattern of incidence showing a trend of low incidence during winter months, more frequent incidence as temperature increased with greater taint intensity. Heavy rainfall events did not appear to affect occurrence of taint. It was discovered that the primary compound contributing to muddy taint was geosmin and this held true across all farms. Within a pond, geosmin was present in both soil and water samples with highest concentrations occurring in pond bank mud, especially when there was a Microcystis bloom episode. Water geosmin levels were related to the geosmin concentration in the mud but not directly proportional, illustrated by geosmin presence in mud samples at times when it was undetectable in the water. Presence of geosmin in fish was correlated to geosmin presence in water, but again not directly. Geosmin in fish flesh was bioaccumulative and occurs very rapidly. Depletion from the fish flesh occurs slowly underpinning the importance of taste testing fish prior to harvest. Most significantly, actinomycetes species were identified as the origin of geosmin and not a blue-green algae source as was expected. There was a vast range of actinomycetes species present in ponds and many of these exhibited a strong capability for geosmin production. It was also repeatedly observed that muddy taint was noted whenever a Microcystis bloom occurred and a significant discovery was illustration of a synergistic relationship between actinomycetes and Microcystis, the interaction resulting in far greater geosmin production. A broad range of taint mitigation methods were evaluated:
biological – probiotic, duckweed, tropical water hyacinth, actinophage, cyanophage chemical – copper sulphate, potassium permanganate, lysine, molasses physical – barley straw, phoslock, ultrasonics, water exchange, fish starvation
All of these methods showed some beneficial effect in reducing geosmin levels but effect was very clearly directly related to pond, farm management practices and environmental conditions. The exception was phoslock, however this was due to this product being applied beyond the recommendations for use. Aquatic plants were
- - 148 - -
beneficial depending on farm pond design and water flow. The chemical agents were highly effective in crashing algal blooms but expensive and not appropriate for long-term use. Naturally-occurring pond viruses, actinophages and cyanophages, showed potential as treatment tools, however a good deal of further work is required before they can be used on a commercial basis. The most practical methods demonstrating effectiveness were lysine and molasses. Lysine application to the pond water was relatively inexpensive and crashed rafting Microcystis blooms within 48 hours. There was a subsequent decrease in geosmin concentration in the water for 8-14 days after application however after this period Microcystis re-established in the pond under the right environmental conditions. Molasses was successfully used as a pond maintenance tool for prevention of algal bloom, although this needed continual application which adds to the cost of the method. Regretfully, but not unexpectedly, there is no ‘silver bullet’ solution. Rather, the project research has demonstrated a range of tools that can be used within the Industry according to individual farm and taint event. The research objectives have been fully addressed. The barramundi farmers now have a simple reference taste-testing protocol for use prior to fish harvest. This protocol has also been incorporated into the recently developed Sustainably Farmed Barramundi Certification Programme. A review of current scientific knowledge on prevention of blue-green algal blooms has been prepared, provided to ABFA members and is available on the Association’s website. A range of taint mitigation methods have been evaluated in-situ in different barramundi ponds and findings provide a toolkit of potential methods for selection according to specific farm conditions and taint event. Brief information sheets for each method will be available on the ABFA website for ready access by the Industry. The priority outcome for the Australian farmed barramundi industry is to deliver premium quality barramundi with characteristic flavour. All the above mentioned outputs from the research constructively support achievement of this goal. Knowledge that the taint compound is typically geosmin in NQ open-culture ponds and that the source is specific actinomycetes bacteria permits selection of mitigation methods that target reduction of these organisms. Documented effectiveness for a range to mitigation methods provides a basis for sound business decision by individual farm operations that will most benefit their situation. Hence the farmed barramundi industry is now in a position to minimise taint occurrence and have a simple test protocol for decisions on pond harvest to ensure fish with consistent flavour quality enters the market.
- - 149 - -
References Ahn CY, Joung SH, Choi A, Kim HS, Jang KY, Oh HM. 2007. Selective control of
cyanobacteria in eutrophic pond by a combined device of ultrasonication and water pumps. Environmental Technology 28: 371-379.
Asaduzzaman M, Wahab MA, Verdegem MCJ, Verreth JAJ. 2010 C:N-controlled, periphyton system boosts production in stagnant ponds. Global Aquaculture Advocate, Nov/Dec, 76-79.
Avnimelech Y. 1999 Carbon/nitrogen ratio as a control element in aquaculture systems. Aquaculture 176: 227-235.
Baker PD, Fabbro LD. 2002 A guide to the identification of common blue-green algae (Cyanoprokaryotes) in Australian freshwaters, Cooperative Research Centre for Freshwater Ecology, Albury.
Ball AS, Williams M, Vincent D, Robinson J. 2001 Algal growth control by a barley straw extract. Bioresource Technologies 77: 177–181
Barkoh A, Paret JM, Lyon DD, Begley DC, Smith DG, Schlechte JW. 2008 Evaluation of Barley Straw and a Commercial Probiotic for Controlling Prymnesium parvum in Fish Production Ponds. North American Journal of Aquaculture 70: 80-91.
Barkoh A, Paret JM, Lyon DD, Schlechte JW. 2009 Can the Liquid Live Micro-Organisms System, a Commercial Probiotic, Affect Sediment, Water Quality, and Koi Carp Production in Fish Hatchery Ponds? North American Journal of Aquaculture 72: 50-56.
Barrett PRF, Littlejohn JW, Curnow J. 1999 Long-term algal control in a reservoir using barley straw. Hydrobiology 147: 309-313.
Body A. 2010 Phosphates, pH Management Control Algal Blooms In Barramundi Ponds. Global Aquaculture Advocate, Nov/Dec, 24-25.
Bolch CJS, Blackburn SI. 1996 Isolation and purification of Australian isoklates of the toxic cyanobacterium Microcystus aeruginosa Kutz. Journal of Applied Phycology 8 (1): 5-13.
Boyle JL, Lindsay RC, Stuiber DA. 1992 Contributions of bromophenols to marine-associated flavours of fish and seafood. Journal of Aquatic Food Production and Technology 1: 43–63.
Burr, GS, Wolters WR, Schrader KK, Summerfelt ST. 2012 Impact of depuration of earthy-musty off-flavors on fillet quality of Atlantic salmon, Salmo salar, cultured in a recirculating aquaculture system. Aquacultural Engineering 50: 28-36.
Butler B, Terlizzi D, Ferrier D. 2001 Barley Straw: A Potential Method of Algae Control in Ponds. Water Quality Workbook Series. Maryland Sea Grant Extension Program. University of Maryland College Park, Maryland, USA. 4 pp.
- - 150 - -
CCAP Culture Collection of Algae and Protozoa, Dunstaffnage Marine Laboratory, Oban, Argyll, PA371QA, UK. Media recipes – BG11 (Blue-Green Medium). www.ccap.ac.uk accessed Nov 2014.
Chen J-J, Yeh H-H. 2005 The mechanisms of potassium permanganate on algae removal. Water Research 39 (18): 4420-4428.
Conte D, Shen C, Miller DW. 1996 Microwave distillation – solid phase absorbent trapping device for the determination of off-flavours, geosmin and methyl iso-borneol, in catfish tissue below their rejection levels. Analytical Chemistry 68: 2713-2716.
Cooper WJ, Zika ARG. 1983 Photochemical formation of hydrogen peroxide in surface and ground water exposed to sunlight. Science 220: 711–712.
Crab R, Avnimelech Y, Defoirdt T, Bossier P, Verstraete W. 2007 Nitrogen removal techniques in aquaculture for a sustainable production. Aquaculture 270: 1-14.
Daft MJ, Stewart WDP. 1971 Bacterial pathogens of fresh water blue-green algae. New Phytologist 70: 819–829.
Daft MJ, Stewart WDP. 1973 Light and electron microscope observations on algal lysis by bacterium CP-1. New Phytologist 72: 799–808.
Dawah AM. 2007 Efficiency of inoculating the green algae Chlorella and Scenedesmus to prevent cyanobacteria growing in Nile tilapia culture. Egyptian Journal of Biology and Fish 11(3): 115-126.
Davis L. 2010 Cyanobacteria in Australia - Bloom management, research and future options. In: Cyanobacteria in Australia - Bloom Management, Research and Future Options 2-3 August 2010, Melbourne, Victoria.
DEHP 2015. Department of Environment and Heritage Protection, Queensland Government. http://wetlandinfo.ehp.qld.gov.au/wetlands/ecology/components/species/?lemna-aequinoctialis Accessed 14 Janurary, 2015.
Deng L, Hayes PK. 2008 Evidence for cyanophages active against bloom-forming freshwater cyanobacteria. Freshwater Biology, 53(6): 1240-1252.
Dionigi CP, Bett KL, Johnsen PB, McGillberry JH, Millie DF, Vinyard BT. 1998 Variation in channel catfish Ictalurus punctatus flavor quality and its quality control implications. Journal of the World Aquaculture Society 29: 140-154.
Dionigi CP, Johnsen PB, Vinyard BT. 2000 The recovery of flavor quality by channel catfish. North American Journal of Aquaculture 62(3): 189-194.
Drake SL, Drake MA, Sanderson R, Daniels HV, Yates MD 2010 The effect of purging time on the sensory properties of aquacultured southern flounder (Paralichthys lethostigma). Journal of Sensory Studies 25(2): 246-259.
Everall NC, Lees DR. 1997 The identification and significance of chemicals released from decomposing barley straw during reservoir algal control. Water Research 31(3): 614–620.
- - 151 - -
Fox LJ, Struik PC, Appleton BL, Rule JH. 2008 Nitrogen Phytoremediation by Water Hyacinth (Eichhornia crassipes (Mart.) Solms). Water, air and soil pollution 194 (1-4): 199-207.
França JG, Paiva MJTR, Carvalho S, Miashiro L, Lombardi JV. 2011 Toxicity of the therapeutic potassium permanganate to tilapia Oreochromis niloticusand to non-target organisms Ceriodaphnia dubia (microcrustacean cladocera) and Pseudokirchneriella subcapitata (green microalgae). Aquaculture 323(1): 249-254.
Frank D, Poole S, Kirchhoff S, Forde C. 2009 Investigation of Sensory Characteristics and Volatiles of Cooked Farmed and Wild Barramundi (Lates calcarifer) using Gas Chromatography-Olfactometry Mass-Spectrometry and a Trained Sensory Panel. Journal of.Agriculture and Food Chemistry 57(21): 10302-10312.
García-Villada L, Rico M, Altamirano MM, Sanchez-Martin L, Lopez-Rodas V, Costas E. 2004 Occurrence of copper resistant mutants in the toxic cyanobacteria Microcystis aeruginosa: characterisation and future implications in the use of copper sulphate as algaecide. Water Research 38: 2207-2213.
Gautier D, Boyd CE, Lovell RT. 2002 Sampling channel catfish ponds for pre-harvest off-flavor detection. Aquacultural engineering 26(3): 205-213.
Gerber NN. 1979 Volatile substances from actinomycetes: their role in the odor pollution of water. Critical Reviews in Microbiology 7(3): 191-214.
Gerber NN, Lechevalier HA 1965 Geosmin, an Earthy-Smelling Substance Isolated from Actinomycetes. Applied Microbiology 13(6): 935-938.
Gibson MT, Welch IM, Barrett PRF, Ridge I. 1990 Barley Straw as an Inhibitor of Algal Growth II : Laboratory Studies. Journal of Applied Phycology 2: 241-248.
Glencross BD, Percival S, Jones JB, Hughes J. 2007 Sustainable development of barramundi cage aquaculture at Lake Argyle. FRDC Final Report, Project No. 2004/026. Department of Fisheries, Hillarys, Australia. pp 229.
Grimm CC, Lloyd SW, Batista R, Zimba PW 2000 Using microwave distillation - solid phasemicroextraction--gas chromatography-- mass spectrometry for analysing fish tissue. Journal of Chromatographic Science July, 289-296.
Grimm CC, Lloyd SW, Zimba, PV. 2004 Instrumental versus sensory detection of off-flavours in farm-raised channel catfish. Aquaculture 236: 309-319.
Guttman L, van Rijn J. 2009 2-Methylisoborneol and geosmin uptake by organic sludge derived from a recirculating aquaculture system. Water Research 43: 474-480.
Hamlin HJ, Michaels JT, Beaulaton CM, Graham WF, Dutt W, Steinbach P, Losordo TM, Schrader KK, Main KL. 2008 Comparing denitrification rates and carbon sources in commercial scale upflow denitrification biological filters in aquaculture. Aquacultural Engineering 38(2): 79-92.
Hargreaves KR, Anderson NJ, Clokie MR. 2013 Recovery of viable cyanophages from the sediments of a eutrophic lake at decadal timescales. FEMS Microbiology Ecology 83(2): 450-456.
- - 152 - -
Hehmann A, Kaya K, Wtanabe MM. 2002 Selective control of Microcystis using and amino acid – a laboratory assay. Journal ofApplied Phycology 14: 85-89.
Houle S, Schrader KK, Le François NR, Comeau Y, Kharoune M, Summerfelt ST, Savoie A,Vanderberg GW. 2011 Geosmin causes off-flavour in arctic charr in recirculating aquaculture systems. Aquaculture Research 42(3): 360-365.
Howgate P. 2004 Tainting of farmed fish by geosmin and 2-methyl-isoborneol: a review of sensory aspects and of uptake/depuration. Aquaculture 234: 155-181.
Hu H, Hong Y. 2008 Algal bloom control by allelopathy of aquatic macrophytes – A review. Frontiers of Environmental Science and Engineering 2(4): 421-438.
Izaguirre G, Hwang CJ, Krasner SW, and McGuire M.J 1982 Geosmin and 2-Methylisoborneol from Cyanobacteria in Three Water Supply Systems. Applied and Environmental Microbiology 43(3): 708–714.
Izaguirre G, Taylor WD. 2004 A guide to geosmin- and MIB-producing cyanobacteria in the United States. Water Science & Technology 49: 19-24.
Jones B, Fuller S, Carton AG. 2013 Earthy-muddy tainting of cultured barramundi linked to geosmin in tropical northern Australia. Aquaculture Environment Interactions 3(2): 117-124.
Johnsen PB, Lloyd SW. 1992 Influence of fat content on uptake and depuration of the off-flavor 2-methylisoborneol by channel catfish, Ictalurus punctatus. Canandian Journal of Fisheries and Aquatic Science. 49: 2406–2411
Johnsen PB, Lloyd SW, Vinyard BT, Dionigi CP. 1996 Effects of temperature on the uptake and depuration of 2-methylisoborneol (MIB) in channel catfish Ictalurus punctatus. Journal of the World Aquaculture Society 27: 15–20
Jüttner F. 1995 Physiology and biochemistry of odorous compounds from freshwater cyanobacteria and algae. Water Science and Technology 31: 69-78.
Juttner F, Watson SB. 2007 Biochemical and Ecological Control of Geosmin and 2-Methyl isoborneol in Source Waters. Applied Environmental Microbiology 73: 4395-4406.
Kaya K, Liu YD, Shen YW, Xiao BD, Sano T. 2005. Selective control of toxic Microcystis water blooms using lysine and malonic acid an enclosure experiment. Environmental Toxicology 20 (2): 170-178.
Kim B, Hwang S, Kim Y, Hwang S, Takamura N, Han M. 2007. Effects of biological control agents on nuisance cyanobacterial and diatom blooms in freshwater systems. Microbes and Environments 22 (1): 52-58.
Kioussis DR, Wheaton FW, Kofinas P. 2000 Reactive nitrogen and phosphorus removal from aquaculture wastewater effluents using polymer hydrogels. Aquacultural Engineering, 23: 315-332.
Klausen C, Jorgensen NOG, Burford MA, O’Donohue M. 2004 Actinomycetes may also produce taste and odour. Water 31(5): 58-62.
- - 153 - -
Klausen C, Nicolaisen MH, Strobel BW, Warnecke F, Nielsen JL, Jørgensen NO. 2005 Abundance of actinobacteria and production of geosmin and 2-methylisoborneol in Danish streams and fish ponds. FEMS microbiology ecology 52(2): 265-278.
Kurtboke DI. 2005. Actinophages as indicators of actinomycete taxa in marine environments. Antonie van Leeuwenhoek 87 (1): 19-28.
Kurtböke DI, Chen C-F, Williams ST 1992 Use of polyvalent phage for reduction of Streptomycetes on soil dilution plates. Journal of Applied Bacteriology 72: 103-111.
Küster E, and Williams ST. 1964 Selection of media for isolation of Streptomycetes. Nature 202:928-929.
Lay BA. 1971 Applications of potassium permanganate in fish culture. Transactions of the. American Fisheries Society 100: 813–815.
Lee GC, Kim YS, Kim MJ, Oh SA, Choi I, Choi J, Park JG, Chong CK, Kim YY, Lee K, Lee CH. 2011 Presence, molecular characteristics and geosmin producing ability of Actinomycetes isolated from South Korean terrestrial and aquatic environments. Water Science & Technology 63(11): 2745-2751.
Leffingwell JC, “Chirality & Odour Perception”. www.leffingwell.com/chirality/geosmin.htm Accessed 06/12/2010.
Leng RA. 1999 Duckweed: A tiny aquatic plant with enormous potential for agriculture and environment. Food and Agriculture Organisation. (FAO). Rome, Italy. 1999.
Liu R, Barnett DZO. 2006 Fate and Transport of Copper Applied in Channel Catfish Ponds Water, Air, & Soil Pollution 176: 139-162.
Lloyd SW, Grimm CC. 1999 Analysis of 2-methylisoborneol and geosmin in catfish by microwave distillation-solid phase microextraction. Journal of Agriculture & Food Chemistry 47: 164-169.
Masuda K, Boyd CE. 1993 Comparative evaluation of the solubility and algal toxicity of copper sulfate and chelated copper. Aquaculture 117: 287-302.
Meaden S, Koskella B. 2013 Exploring the risks of phage application in the environment. Frontiers in Microbiology 4: article 358.
Moyo P, Mapira J. 2012 Bioremediation with the water hyacinth (Eichhornia crassipes): a panacea for river pollution in the city of Masvingo, Zimbabwe? Journal of Sustainable Development in Africa 14 (6): 115-131.
Nakano K, Lee TJ, Matsumura M. 2001 In Situ Algal Bloom Control by the Integration of Ultrasonic Radiation and Jet Circulation to Flushing. Environmental Science and Technology 35: 4941-4946.
Nanda Kumar PBA, Dushenkov V, Motto H, Raskin I. 1995 Phytoextraction: the use of plants to remove heavy metals from soils. Environmental Science and Technology 29: 1232-1238.
Ninawe AS, Selvin J. 2009 Probiotics in shrimp aquaculture: avenues and challenges. Critical Reviews in Microbiology 35 (1): 43-66.
- - 154 - -
Paerl HW, Otten TG. 2013 Harmful cyanobacterial blooms: causes, consequences and controls. Environmental Microbiology 65 (4): 995-1010.
Paerl HW, Tucker CS. 1995 Ecology of blue-green algae in aquaculture ponds. Journal of the World Aquaculture Society 26: 109-131.
Parinet J, Rodriguez MJ, Sérodes J. 2010 Influence of water quality on the presence of off-flavour compounds (geosmin and 2-methylisoborneol). Water Research 44: 5847-5856.
Parker DL, Kumar HD, Rai LC, Singh JB. 1997 Potassium salts inhibit growth of the cyanobacteria Microcystis spp. in pond water and defined media: Implications for control of microcystin-producing aquatic blooms. Applied Environmental Microbiology 63: 2324–2329.
Palmeri G, Turchini GM, Caprino F, Keast R, Moretti VM, De Silva SS. 2008 Biometric, nutritional and sensory changes in intensively farmed Murray cod (Maccullochella peelii peelii, Mitchell) following different purging times. Food Chemistry 107(4): 1605-1615.
Percival, S, Drabsch, P, Glencross, BD. 2008 Determining factors affecting muddy-flavour taint in farmed barramundi, Lates calcarifer. Aquaculture 284: 136-143.
Perkins EJ, Schlenk D. 1997 Comparisons of Uptake and Depuration of 2-Methylisoborneol in Male, Female, Juvenile, and 3MC-induced Channel Catfish Ictalurus punctatus. Journal of the World Aquaculture Society 28(2): 158-164.
Persson PE. 1984 Uptake and release of environmentally occurring odorous compounds by fish. A review. Water research 18(10): 1263-1271.
Philips EJ, Monegue RL, Aldridge FJ. 1990 Cynophages which impact bloom-forming cyanobacteria. Journal of Aquatic Plant Management 28:92–97
Pillinger JM, Cooper JA, Ridge I, Barrett PRF. 1992) Barley Straw as an Inhibitor of Algae Growth Ill: the role of fungal decomposition. Journal of Applied Phycology 4: 353-355.
Polak EH, Provasi J. 1992 Odour sensitivity to geosmin enantiomers. Chemical Senses 17 (1): 23-26.
Pollard P. 2007 How viruses control microbial ecosystems. Microbiology Australia 28 (3): 115-117.
Poole S, Frost S, Grauf S. 2000 Improving the quality of Australian aquacultured barramundi (Lates calcarifer) through modified harvesting, handling and processing techniques. Report, Queensland Department of Primary Industries, Australia. 2000.
Reynolds CS, Peterson AC. 2000 The distribution of planktonic cyanobacteria in Irish lakes in relation to their trophic states. Hydrobiologia 424: 91-99.
Robertson RF, Jauncey K, Beveridge MCM, Lawton LA. 2005 Depuration rates and the sensory threshold concentration of geosmin responsible for the earthy-musty taint in rainbow trout, Onchorhynchus mykiss. Aquaculture 245: 89-99
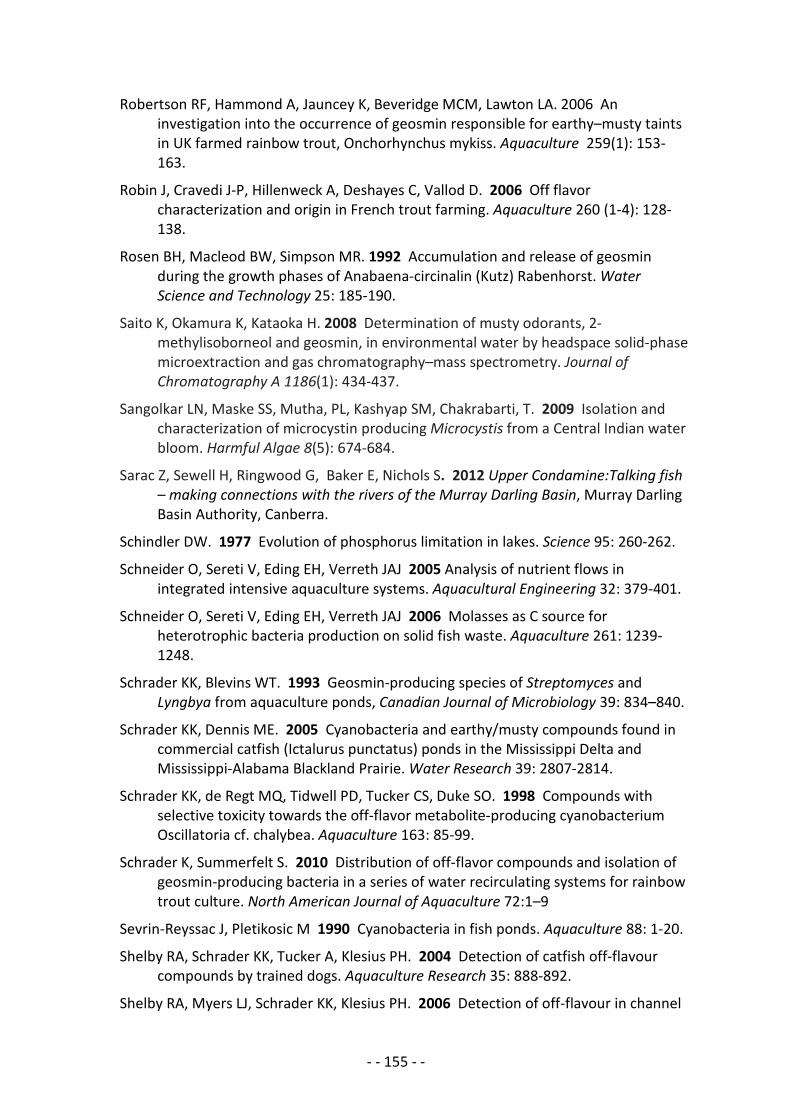
- - 155 - -
Robertson RF, Hammond A, Jauncey K, Beveridge MCM, Lawton LA. 2006 An investigation into the occurrence of geosmin responsible for earthy–musty taints in UK farmed rainbow trout, Onchorhynchus mykiss. Aquaculture 259(1): 153-163.
Robin J, Cravedi J-P, Hillenweck A, Deshayes C, Vallod D. 2006 Off flavor characterization and origin in French trout farming. Aquaculture 260 (1-4): 128-138.
Rosen BH, Macleod BW, Simpson MR. 1992 Accumulation and release of geosmin during the growth phases of Anabaena-circinalin (Kutz) Rabenhorst. Water Science and Technology 25: 185-190.
Saito K, Okamura K, Kataoka H. 2008 Determination of musty odorants, 2-methylisoborneol and geosmin, in environmental water by headspace solid-phase microextraction and gas chromatography–mass spectrometry. Journal of Chromatography A 1186(1): 434-437.
Sangolkar LN, Maske SS, Mutha, PL, Kashyap SM, Chakrabarti, T. 2009 Isolation and characterization of microcystin producing Microcystis from a Central Indian water bloom. Harmful Algae 8(5): 674-684.
Sarac Z, Sewell H, Ringwood G, Baker E, Nichols S. 2012 Upper Condamine:Talking fish – making connections with the rivers of the Murray Darling Basin, Murray Darling Basin Authority, Canberra.
Schindler DW. 1977 Evolution of phosphorus limitation in lakes. Science 95: 260-262.
Schneider O, Sereti V, Eding EH, Verreth JAJ 2005 Analysis of nutrient flows in integrated intensive aquaculture systems. Aquacultural Engineering 32: 379-401.
Schneider O, Sereti V, Eding EH, Verreth JAJ 2006 Molasses as C source for heterotrophic bacteria production on solid fish waste. Aquaculture 261: 1239-1248.
Schrader KK, Blevins WT. 1993 Geosmin-producing species of Streptomyces and Lyngbya from aquaculture ponds, Canadian Journal of Microbiology 39: 834–840.
Schrader KK, Dennis ME. 2005 Cyanobacteria and earthy/musty compounds found in commercial catfish (Ictalurus punctatus) ponds in the Mississippi Delta and Mississippi-Alabama Blackland Prairie. Water Research 39: 2807-2814.
Schrader KK, de Regt MQ, Tidwell PD, Tucker CS, Duke SO. 1998 Compounds with selective toxicity towards the off-flavor metabolite-producing cyanobacterium Oscillatoria cf. chalybea. Aquaculture 163: 85-99.
Schrader K, Summerfelt S. 2010 Distribution of off-flavor compounds and isolation of geosmin-producing bacteria in a series of water recirculating systems for rainbow trout culture. North American Journal of Aquaculture 72:1–9
Sevrin-Reyssac J, Pletikosic M 1990 Cyanobacteria in fish ponds. Aquaculture 88: 1-20.
Shelby RA, Schrader KK, Tucker A, Klesius PH. 2004 Detection of catfish off-flavour compounds by trained dogs. Aquaculture Research 35: 888-892.
Shelby RA, Myers LJ, Schrader KK, Klesius PH. 2006 Detection of off-flavour in channel
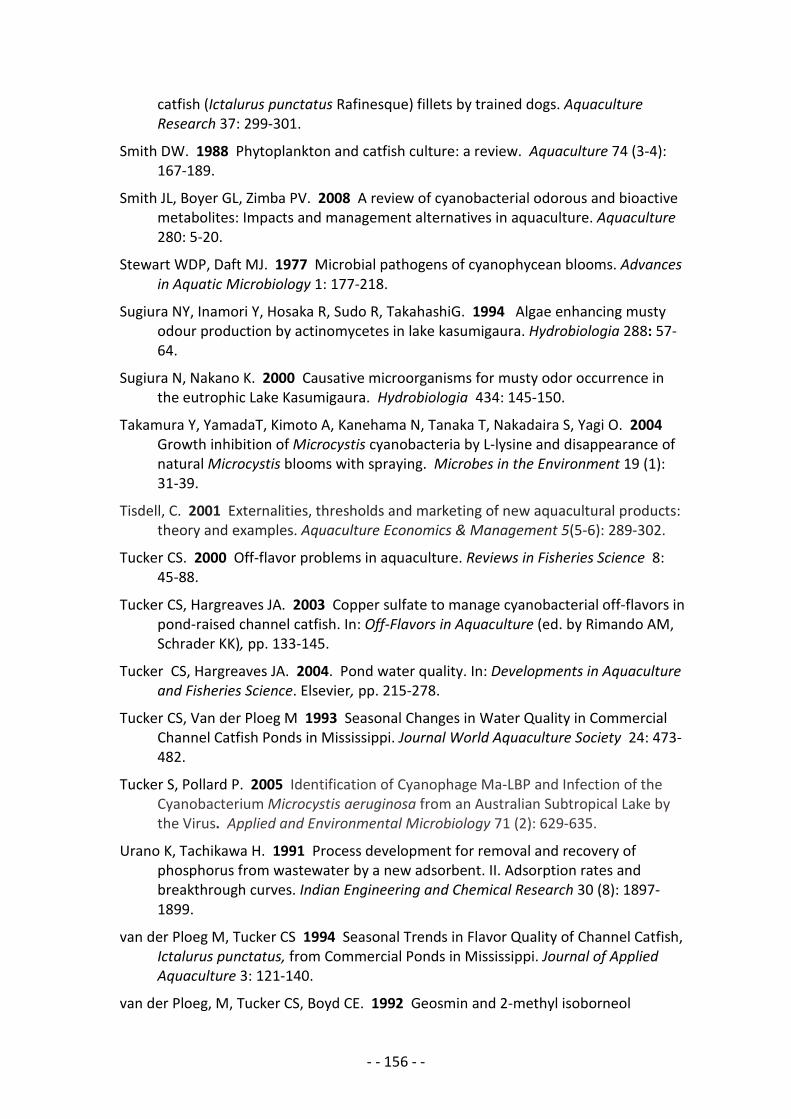
- - 156 - -
catfish (Ictalurus punctatus Rafinesque) fillets by trained dogs. Aquaculture Research 37: 299-301.
Smith DW. 1988 Phytoplankton and catfish culture: a review. Aquaculture 74 (3-4): 167-189.
Smith JL, Boyer GL, Zimba PV. 2008 A review of cyanobacterial odorous and bioactive metabolites: Impacts and management alternatives in aquaculture. Aquaculture 280: 5-20.
Stewart WDP, Daft MJ. 1977 Microbial pathogens of cyanophycean blooms. Advances in Aquatic Microbiology 1: 177-218.
Sugiura NY, Inamori Y, Hosaka R, Sudo R, TakahashiG. 1994 Algae enhancing musty odour production by actinomycetes in lake kasumigaura. Hydrobiologia 288: 57-64.
Sugiura N, Nakano K. 2000 Causative microorganisms for musty odor occurrence in the eutrophic Lake Kasumigaura. Hydrobiologia 434: 145-150.
Takamura Y, YamadaT, Kimoto A, Kanehama N, Tanaka T, Nakadaira S, Yagi O. 2004 Growth inhibition of Microcystis cyanobacteria by L-lysine and disappearance of natural Microcystis blooms with spraying. Microbes in the Environment 19 (1): 31-39.
Tisdell, C. 2001 Externalities, thresholds and marketing of new aquacultural products: theory and examples. Aquaculture Economics & Management 5(5-6): 289-302.
Tucker CS. 2000 Off-flavor problems in aquaculture. Reviews in Fisheries Science 8: 45-88.
Tucker CS, Hargreaves JA. 2003 Copper sulfate to manage cyanobacterial off-flavors in pond-raised channel catfish. In: Off-Flavors in Aquaculture (ed. by Rimando AM, Schrader KK), pp. 133-145.
Tucker CS, Hargreaves JA. 2004. Pond water quality. In: Developments in Aquaculture and Fisheries Science. Elsevier, pp. 215-278.
Tucker CS, Van der Ploeg M 1993 Seasonal Changes in Water Quality in Commercial Channel Catfish Ponds in Mississippi. Journal World Aquaculture Society 24: 473-482.
Tucker S, Pollard P. 2005 Identification of Cyanophage Ma-LBP and Infection of the Cyanobacterium Microcystis aeruginosa from an Australian Subtropical Lake by the Virus. Applied and Environmental Microbiology 71 (2): 629-635.
Urano K, Tachikawa H. 1991 Process development for removal and recovery of phosphorus from wastewater by a new adsorbent. II. Adsorption rates and breakthrough curves. Indian Engineering and Chemical Research 30 (8): 1897-1899.
van der Ploeg M, Tucker CS 1994 Seasonal Trends in Flavor Quality of Channel Catfish, Ictalurus punctatus, from Commercial Ponds in Mississippi. Journal of Applied Aquaculture 3: 121-140.
van der Ploeg, M, Tucker CS, Boyd CE. 1992 Geosmin and 2-methyl isoborneol
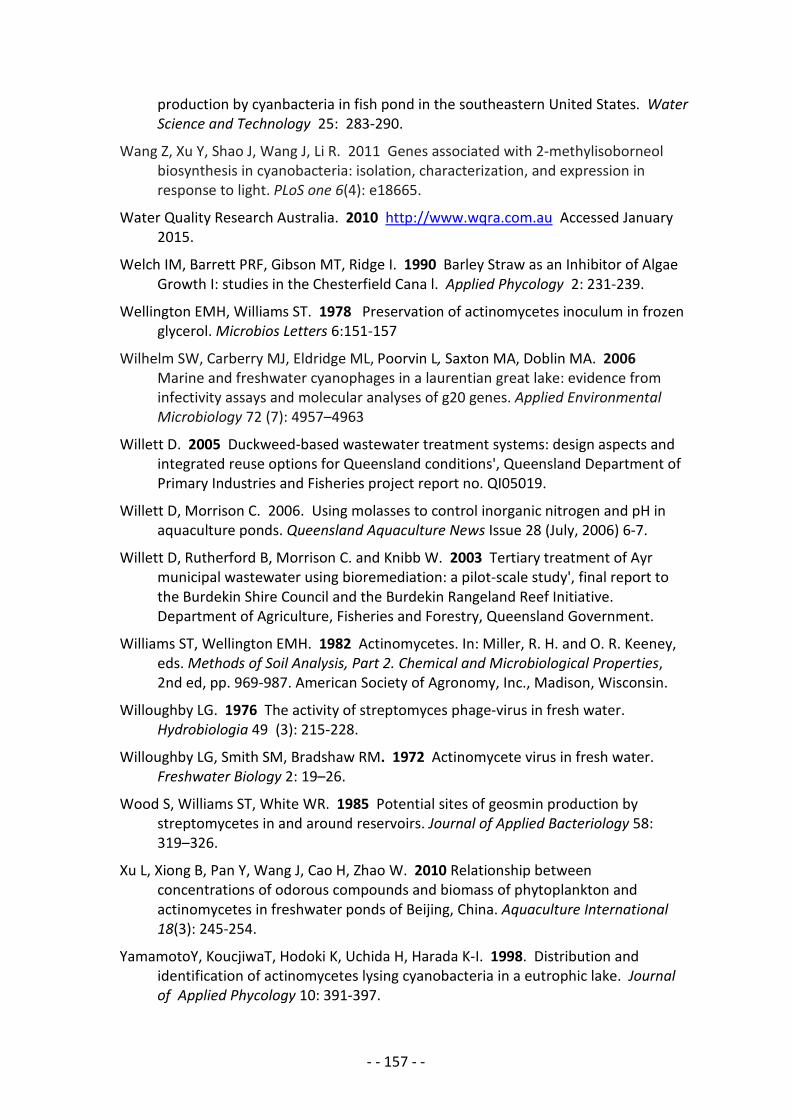
- - 157 - -
production by cyanbacteria in fish pond in the southeastern United States. Water Science and Technology 25: 283-290.
Wang Z, Xu Y, Shao J, Wang J, Li R. 2011 Genes associated with 2-methylisoborneol biosynthesis in cyanobacteria: isolation, characterization, and expression in response to light. PLoS one 6(4): e18665.
Water Quality Research Australia. 2010 http://www.wqra.com.au Accessed January 2015.
Welch IM, Barrett PRF, Gibson MT, Ridge I. 1990 Barley Straw as an Inhibitor of Algae Growth I: studies in the Chesterfield Cana l. Applied Phycology 2: 231-239.
Wellington EMH, Williams ST. 1978 Preservation of actinomycetes inoculum in frozen glycerol. Microbios Letters 6:151-157
Wilhelm SW, Carberry MJ, Eldridge ML, Poorvin L, Saxton MA, Doblin MA. 2006 Marine and freshwater cyanophages in a laurentian great lake: evidence from infectivity assays and molecular analyses of g20 genes. Applied Environmental Microbiology 72 (7): 4957–4963
Willett D. 2005 Duckweed-based wastewater treatment systems: design aspects and integrated reuse options for Queensland conditions', Queensland Department of Primary Industries and Fisheries project report no. QI05019.
Willett D, Morrison C. 2006. Using molasses to control inorganic nitrogen and pH in aquaculture ponds. Queensland Aquaculture News Issue 28 (July, 2006) 6-7.
Willett D, Rutherford B, Morrison C. and Knibb W. 2003 Tertiary treatment of Ayr municipal wastewater using bioremediation: a pilot-scale study', final report to the Burdekin Shire Council and the Burdekin Rangeland Reef Initiative. Department of Agriculture, Fisheries and Forestry, Queensland Government.
Williams ST, Wellington EMH. 1982 Actinomycetes. In: Miller, R. H. and O. R. Keeney, eds. Methods of Soil Analysis, Part 2. Chemical and Microbiological Properties, 2nd ed, pp. 969-987. American Society of Agronomy, Inc., Madison, Wisconsin.
Willoughby LG. 1976 The activity of streptomyces phage-virus in fresh water. Hydrobiologia 49 (3): 215-228.
Willoughby LG, Smith SM, Bradshaw RM. 1972 Actinomycete virus in fresh water. Freshwater Biology 2: 19–26.
Wood S, Williams ST, White WR. 1985 Potential sites of geosmin production by streptomycetes in and around reservoirs. Journal of Applied Bacteriology 58: 319–326.
Xu L, Xiong B, Pan Y, Wang J, Cao H, Zhao W. 2010 Relationship between concentrations of odorous compounds and biomass of phytoplankton and actinomycetes in freshwater ponds of Beijing, China. Aquaculture International 18(3): 245-254.
YamamotoY, KoucjiwaT, Hodoki K, Uchida H, Harada K-I. 1998. Distribution and identification of actinomycetes lysing cyanobacteria in a eutrophic lake. Journal of Applied Phycology 10: 391-397.
- - 158 - -
Yamprayoon J. and Noomhorm A. 2000. Effects of preservationmethod on geosmin content and off-flavour in Nile tilapia (Oreochromis niloticus). Journal of Aquatic Food Product Technology 9: 95-107
Yoshida T, Takashima Y, Tomaru Y, Shirai Y, Takao Y, Hiroishi S, Nagasaki K. 2006 Isolation and characterization of a cyanophage infecting the toxic cyanobacterium Microcystis aeruginosa. Applied and Environmental Microbiology 72(2): 1239-1247.
Yoshida M, Yoshida T, Kashima A, Takashima Y, Hosoda N, Nagasaki K, Hiroishi S 2008 Ecological dynamics of the toxic bloom-forming cyanobacterium Microcystis aeruginosa and its cyanophages in freshwater. Applied Environmental Microbiology 74: 3269–3273
Yurkowski M, Tabachek JAL. 1974 Identification, analysis, and removal of geosmin from muddy-flavored trout. Journal of the Fisheries Board of Canada 31(12): 1851-1858.
Yurkowski M, Tabachek, A.L. 1980 Geosmin and 2-methyl isoborneol implicated as a cause of muddy odor in commercial fish from Cedar Lake Manitoba. Canadian Journal of Fisheries and Aquatic Science 37: 1440-1450.
Zaitlin B, Watson SB. 2006 Actinomycetes in relation to taste and odour in drinking water: Myths, tenets and truths. Water Research 40: 1741-1753.
Zeng L, Li X, Liu J. 2004 Adsorptive removal of phosphate from aqueous solutions using iron oxide tailings. Water Research 38: 1318-1326.
Zhao D, Boyd C, Barnett M. 2005 Fate and transport of copper applied in channel carfish ponds: A pilot study. Auburn University Environmental Institute, pp. 41.
Zhang T, Li L, Chen W, Song L-R. 2009 Analysis of off-flavors in fish by microwave mediated distillation with headspace solid-phase microextraction and gas chromatography-mass spectrum. Acta Hydrobiologica Sinica 33(3): 449- 454.
Zhao D, Sengupta AK. 1996 Selective removal and recovery of phosphate in a novel fixed-bed process. Water Science and Technology 33 (10-11): 139-147.
Zhao D, Sengupta AK. 1997 Ultimate removal of phosphate from wastewater using a new class of polymeric ion exchangers. Water Research 32 (5): 1613–1625.
Zhou Q, Li K, Jun X, Bo L. 2009. Role and functions of beneficial microorganisms in sustainable aquaculture. Bioresource Technology 100 (16): 3780-3786.
Zhou W, Zhu D, Tan L, Liao S, Hu Z, Hamilton D. 2007 Extraction and retrieval of potassium from water hyacinth (Eichhornia crassipes). Bioresource Technology 98 (1): 226-231.
Zimba PV, Grimm CC. 2003 A synoptic survey of musty-muddy odour metabolites and microcystin toxin occurrence and concentration in southeastern USA channel catfish (ictalurus punctatus Ralfinesque) production ponds. Aquaculture 218: 81-87.

- - 159 - -
APPENDICES
- - 160 - -
Appendix 1. IP. There is no Intellectual Property arising from this research project. There was new information discovered about which taint compound was predominant in North Queensland open ponds and the source of this compound but importantly, this information was made widely known to the ABFA and the barramundi industry. It is the intention of the PI to publish this information in scientific journals.
Appendix 2. Research Project Staff Queensland Department of Agriculture and Fisheries Sue Poole – Principal Scientist (Seafood) Paul Exley – Senior Technician (Seafood) Dave Mann – Senior Scientist (Aquaculture) Steve Fuller - Senior Technician ( Chemistry) Reg Reeves – Senior Technician (Microbiology) Andrew Cusack – Technician (Microbiology) Margaret Currie - Technician (Microbiology) Queensland Alliance for Agriculture and Food Innovation Heather Smyth – Research Scientist (Flavour Chemistry) South Australian Research and Development Institute Richard Musgrove – Senior Scientist
- - 161 - -
Appendix 3. Mitigation of muddy flavour in farmed freshwater fish: a review of current knowledge This Review was prepared as a discussion document for 2011guiding the direction of the research. It was presented to the Industry and the Seafood CRC in 2011. The Review is available by contacting the Principal Investigator of this project.

- - 162 - -
Appendix 4.
4.1 Taste protocol reference method
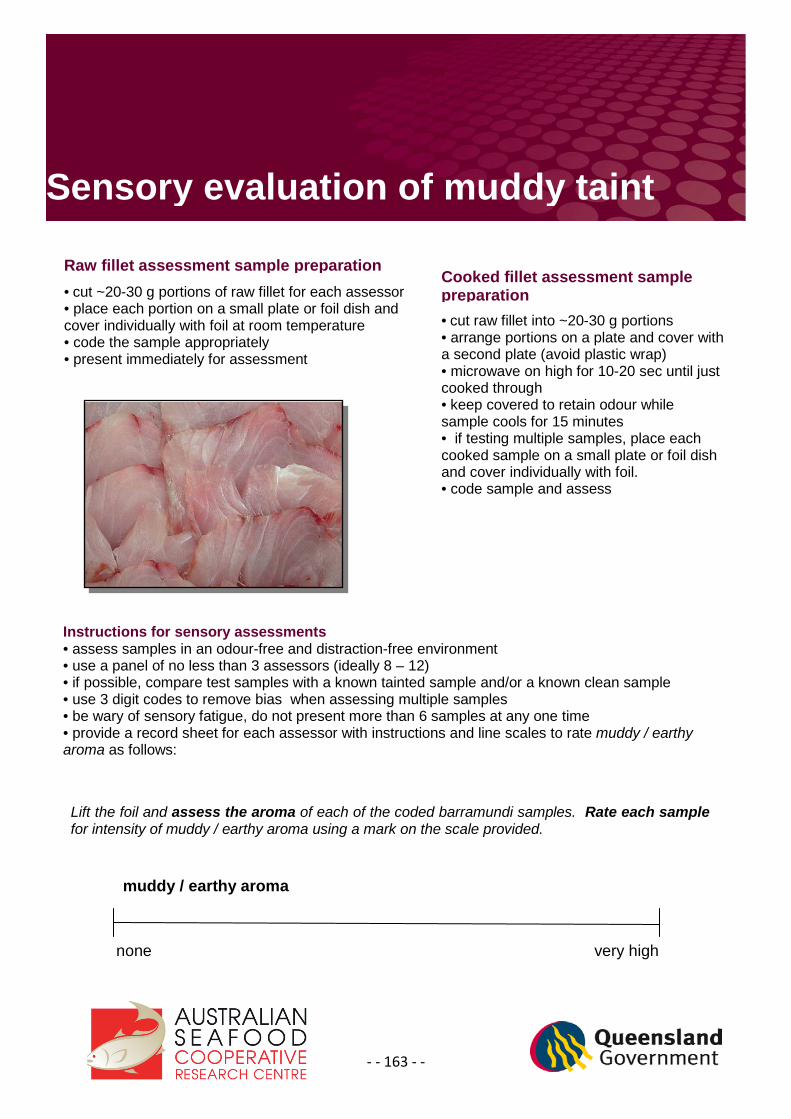
- - 163 - -
Sensory evaluation of muddy taint
• cut ~20-30 g portions of raw fillet for each assessor • place each portion on a small plate or foil dish and cover individually with foil at room temperature • code the sample appropriately • present immediately for assessment
Raw fillet assessment sample preparation
• cut raw fillet into ~20-30 g portions • arrange portions on a plate and cover with a second plate (avoid plastic wrap) • microwave on high for 10-20 sec until just cooked through • keep covered to retain odour while sample cools for 15 minutes • if testing multiple samples, place each cooked sample on a small plate or foil dish and cover individually with foil. • code sample and assess
Cooked fillet assessment sample preparation
Instructions for sensory assessments • assess samples in an odour-free and distraction-free environment • use a panel of no less than 3 assessors (ideally 8 – 12) • if possible, compare test samples with a known tainted sample and/or a known clean sample • use 3 digit codes to remove bias when assessing multiple samples • be wary of sensory fatigue, do not present more than 6 samples at any one time • provide a record sheet for each assessor with instructions and line scales to rate muddy / earthy aroma as follows:
Lift the foil and assess the aroma of each of the coded barramundi samples. Rate each sample for intensity of muddy / earthy aroma using a mark on the scale provided.
none very high
muddy / earthy aroma
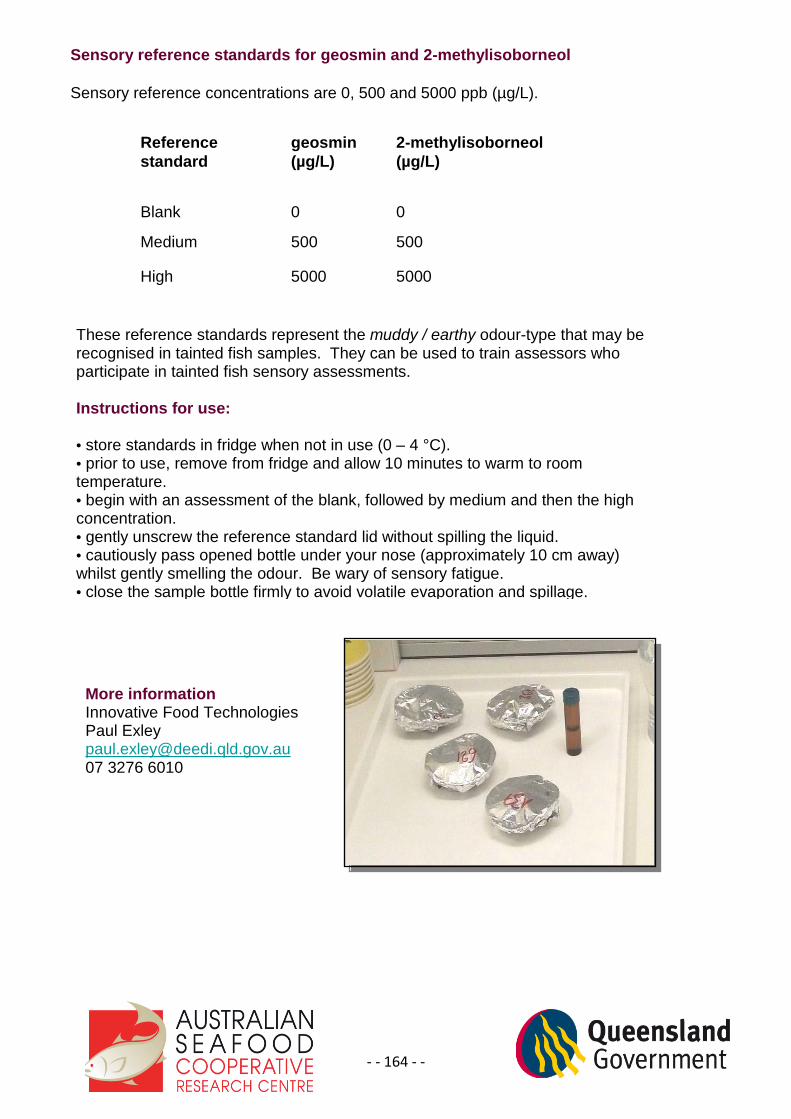
- - 164 - -
Sensory reference standards for geosmin and 2-methylisoborneol Sensory reference concentrations are 0, 500 and 5000 ppb (µg/L).
5000 5000 High 500 500 Medium 0 0 Blank
2-methylisoborneol (µg/L)
geosmin (µg/L)
Reference standard
These reference standards represent the muddy / earthy odour-type that may be recognised in tainted fish samples. They can be used to train assessors who participate in tainted fish sensory assessments. Instructions for use: • store standards in fridge when not in use (0 – 4 °C). • prior to use, remove from fridge and allow 10 minutes to warm to room temperature. • begin with an assessment of the blank, followed by medium and then the high concentration. • gently unscrew the reference standard lid without spilling the liquid. • cautiously pass opened bottle under your nose (approximately 10 cm away) whilst gently smelling the odour. Be wary of sensory fatigue. • close the sample bottle firmly to avoid volatile evaporation and spillage.
More information Innovative Food Technologies Paul Exley [email protected] 07 3276 6010

- - 165 - -
4.2 Farm Pond Monitoring Sheet
Date week beginning Time Temp °C pH D.O. Salinity
pond samples
taken Bloom appearance, comments
8-Aug-11
15-Aug-11
22-Aug-11
29-Aug-11
5-Sep-11
12-Sep-11
19-Sep-11
26-Sep-11
3-Oct-11
10-Oct-11
17-Oct-11
24-Oct-11
31-Oct-11
7-Nov-11
14-Nov-11
21-Nov-11
28-Nov-11
Farm: PEJO Pond number: Trial: Custom Crash Monitoring Please take early morning samples only (approximately the same time each sample day)

- - 166 - -
This data record sheet was developed to standardise the recording of trial pond informationamong participating farms.
• please take 4 water samples once a week (same day each week writing in actual date)
• please take samples first thing in the morning at the same time as pond observations where possible
1st sample (geosmin) from just under the water surface on the pond edge only 3/4 filled so the glass jar doesn't break when stored frozen 2nd sample (algae ID) from just under the water surface on the pond edge sample in a plastic bottle containing lugol's iodine solution to fix the samples. Store at room temperature 3rd sample (geosmin) from the BOTTOM of the pond sampling water just above the bottom sludge using pump only 3/4 filled so the glass jar doesn't break when stored frozen 4th sample (algae ID) from the BOTTOM of the pond sampling water just above the bottom sludge using pump sample in a plastic bottle containing lugol's iodine solution to fix the samples. Store at room temperature
• any additional sample that may be relevant can be added on the blank line
• The format should not be considered limiting as any information that you considerrelevant should be added to these sheets. If there is not sufficient room in the'Further Comments' box then please continue on the back of the sheet with a PTO inthe box.
• the more information collected the better for understanding pond dynamics.
• bloom appearance can be any brief descriptor such as filament, round, approximateparticle size, colour, %surface coverage. More descriptive explanation, including your own algae typeidentification can be included in the line below or if required then insert PTO andcontinue on the back of the sheet.
• Each sheet should be used for a single pond.
• If you have any suggestions for improving the recording sheet or sampling methods then please let us know.
Comments/additional samples:
Date Time Temp °C pH D.O. Salinity
pond samples
taken Bloom appearance, comments


