48
Preventive effects of vitamin D and herbal extracts on sarcopenia Sunmin Park Dept. of Food & Nutrition, Obesity/Diabetes Research Center, Hoseo University
| Date post: | 27-Dec-2015 |
| Category: |
Documents |
| Upload: | brittney-carson |
| View: | 218 times |
| Download: | 0 times |

Preventive effects of vitamin D and herbal extracts on sarcopenia
Sunmin Park
Dept. of Food & Nutrition, Obesity/Diabetes Research Center, Hoseo University

Quickly emerging into the aging, aged and super-aged society in Korea
• Korean currently in Aging society • Aging society (over 7% of ≥65
years old) - from 2000 (7.2%), 2004 (8.7%), 2005 (9.1%)
• Aged society (over 14% of ≥65 years old) – at 2018 (14.3%)
• Super-aged society (over 20% of ≥65 years old) – at 2026 (20.2%)
• Fastest movement into Super-Aged Society among OECD countries
France
USA
Germany
Japan
Korea
0 20 40 60 80 100 120 140
Aged to Super-Aged So-ciety
Aging to Aged So-ciety
Duration (years)

Avera
ge of O
ECD
Japan
England
France
Ger
man
yUSA
Korea
0
10
20
30
40
Nu
mb
er
of
dia
be
tic
pa
tie
nts
in 1
00
,00
0
pe
op
le
OECD health data, 2006
Increased prevalence of type 2 diabetes in the elderly
30-39 40-49 50-59 60-69 ≥65 ≥700
5
10
15
20
25
Age categories
Ty
pe
2 d
iab
ete
s (
%)

Remarkably elevated prevalence of dementia and stroke in people with older age
Health report of Dept. of Public Health & Welfare, 2010
60-64
65-69
70-74
75-79
80-84
85-89
>900
5
10
15
20
25
30
35
40
Age categories
De
me
nti
a p
rev
ale
nc
e
(%)
20-29 30-39 40-49 50-59 60-69 ≥700
10
20
30
40
50
60
70
Age categories
Str
ok
e p
rev
ale
nc
e (
pe
r 1
,00
0)
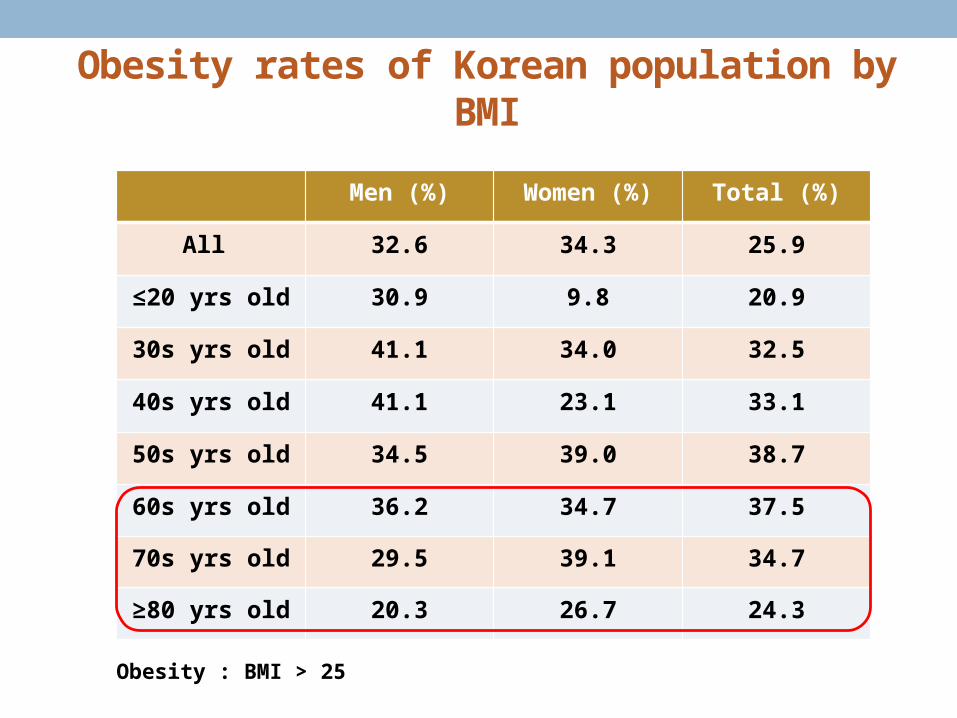
Obesity rates of Korean population by BMI
Men (%) Women (%) Total (%)
All 32.6 34.3 25.9
≤20 yrs old 30.9 9.8 20.9
30s yrs old 41.1 34.0 32.5
40s yrs old 41.1 23.1 33.1
50s yrs old 34.5 39.0 38.7
60s yrs old 36.2 34.7 37.5
70s yrs old 29.5 39.1 34.7
≥80 yrs old 20.3 26.7 24.3
Obesity : BMI > 25

Obesity paradox
Adjusted for age, gender, educational level, urban or rural residence, marital status, and status with respect to baseline illnesses; data from > 3 yr follow-up
Zheng et al. N Engl J Med, 2011

Correlation between BMI and %BF for men in 1994 NHANES
BMI represents not only body fat but also
lean body mass

Changes in muscle mass with aging
Lexell et al., 1988
Age (yrs)Age (yrs)
Mu
scle
ma
ss (
X48
) (m
m2)

Current definition of sarcopenia
Loss of skeletal muscle mass
CAUSES :Age, diet, activity, disease and their Combination
Loss of strength
CONSEQUENCES:Falls, functional decline, disability,
and mortality

Criteria of sarcopenia and sarcopenic obesity
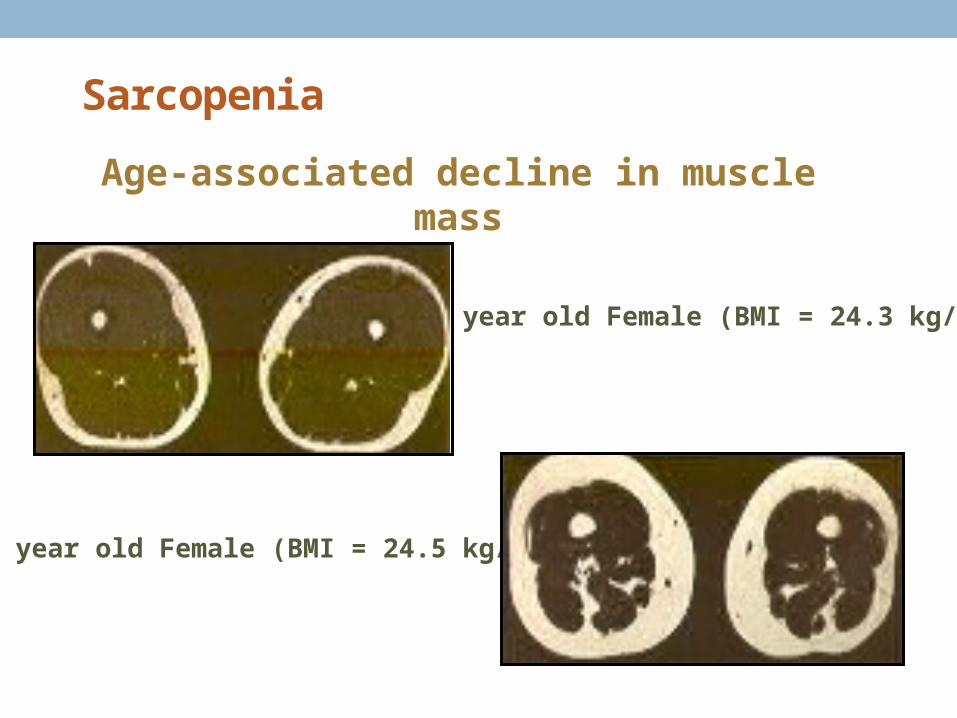
Sarcopenia
21 year old Female (BMI = 24.3 kg/m2)
73 year old Female (BMI = 24.5 kg/m2)
Age-associated decline in muscle mass

Increases fat infiltration in muscles without and with sarcopenic obesity
Rossi et al. Obesity, 2010

Diseases related to sarcopenia and obesity
Zamboni et al., 2008

Sarcopenia: What is driving the process?
• Chronic inflammation?• Food intake (protein, calorie)• Hypermetabolism• Pro-inflammatory cytokines (IL-1b, IL-6, TNF-α)
• Decline in anabolic hormones?• GH/IGF-1• Sex steroid hormones
• Free testosterone• DHEA
• Fading effectiveness of insulin
• Loss of innervation?

SARCOPENIA
NEED of Promising treatment options
Prevention or Reversibility ?Partially, yes

VITAMIN D AND SARCOPENIA
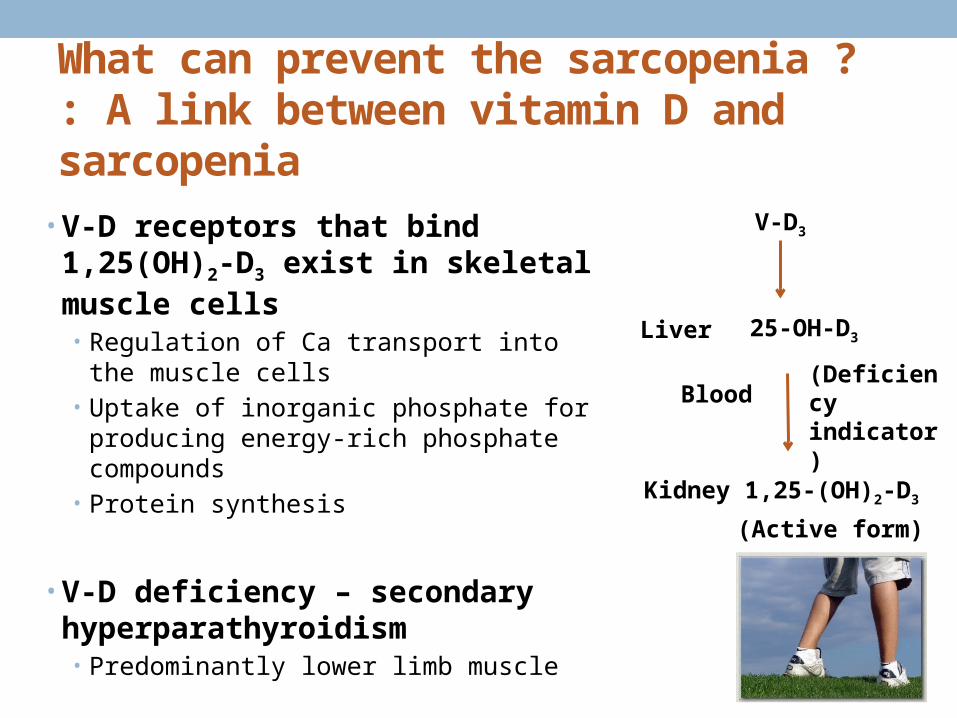
What can prevent the sarcopenia ? : A link between vitamin D and sarcopenia
• V-D receptors that bind 1,25(OH)2-D3 exist in skeletal muscle cells • Regulation of Ca transport into the muscle
cells• Uptake of inorganic phosphate for produc-
ing energy-rich phosphate compounds• Protein synthesis
• V-D deficiency – secondary hyper-parathyroidism • Predominantly lower limb muscle
V-D3
25-OH-D3Liver
Blood
Kidney 1,25-(OH)2-D3
(Active form)
(Deficiency indicator)

Results from KNHANES for vita-min D, sarcopenia, and metabolic diseases (CVD and diabetes)
Park S et al. J Nutr Health & Aging, 2014: Stroke risk and sar-copenia
Park S et al. Clin Nutri, 2014: Vitamin D deficiency and sarcope-nia
Park S et al. J Nutri Sci & Vitaminol, 2014 : Vitamin D and GDM
Lee BK et al. Asia Pac J Clin Nutri, 2012: Vitamin D and type 2 di-abetes
Park S & Lee BK, Nutr Res Prac, 2012: Vitamin D deficiency
and CVD
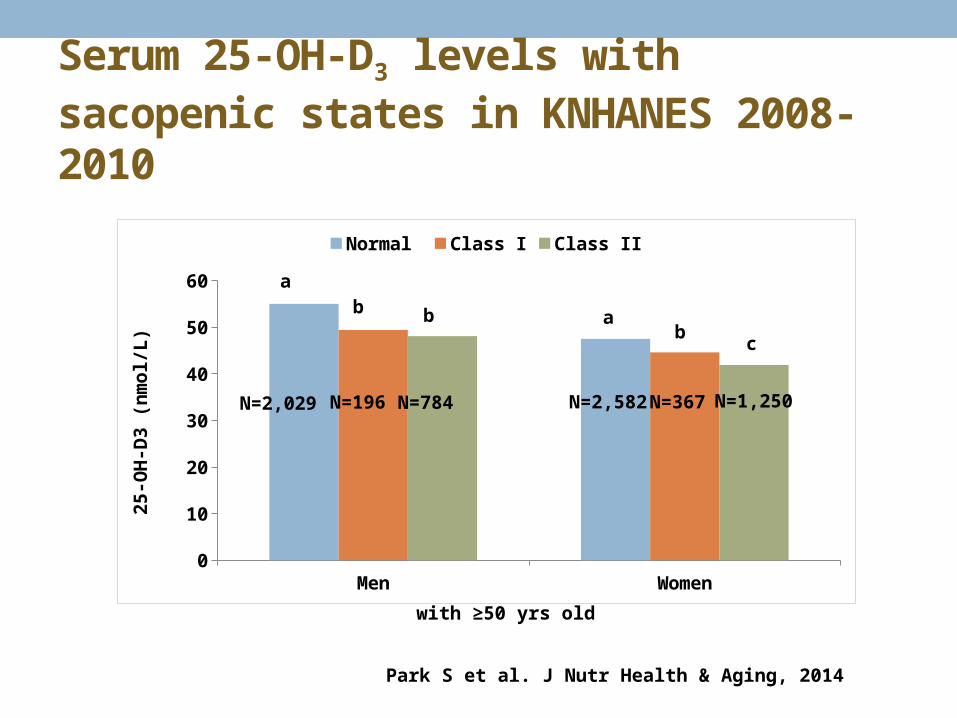
Serum 25-OH-D3 levels with sacopenic states in KNHANES 2008-2010
Men Women0
10
20
30
40
50
60
Normal Class I Class II
25
-OH
-D3
(n
mo
l/L)
N=2,029 N=196 N=784 N=2,582 N=367 N=1,250
Park S et al. J Nutr Health & Aging, 2014
with ≥50 yrs old
ab b a
bc

Daily nutrient intakes by sarcopenic status after covariate adjustment in KNHANES 2008-2010
Men with ≥50 yrs old (n=2,258) Women with ≥50 yrs old (n=3,005)
Normal (SMI>28.9%)
Sarcopenia (SMI≤28.9%)
Normal (SMI>22.6%)
Sarcopenia (SMI≤22.6%)
Total energy (Kcal)
2197 (2154~2240) 1965 (1746~2185)* 1591 (1560~1621) 1447 (1380~1513)**
Protein (g) 76.5 (74.4~78.5) 66.8 (58.4~75.2)* 53.3 (52.0~54.6) 48.3 (45.1~51.5)**
Carbohydrate (g)
358.3 (350.7~365.9) 315.7 (293.4~338.0)** 294.1 (287.9~300.2) 264.3 (252.1~276.6)**
Fat (energy %) 14.2 (13.9~14.6) 14.3 (12.4~16.3) 12.8 (12.5~13.2) 13.9 (12.9~14.9)*
Fiber (g) 9.0 (8.5~9.4) 8.0 (7.0~9.0) 7.3 (7.1~7.6) 6.5 (5.8~7.2)*
ª adjusted for age, residence area, body mass index, smoking and drinking status, education level, regular exercise and walking and use of estrogen and oral pill for women* p<0.05, ** p<0.01 compared with normal subjects
Park S et al. Clin Nutri, 2014

Odds ratio of sarcopenia prevalence by serum 25-OH-D3 levels in KNHANES 2008-2010
Odds ratio
Men (n=2,258) Women (n=3,005)
Model 1a
Continuous per 10 ng/ml lower 25-OH-D3 0.95 (0.59~1.51) 1.46 (1.01~2.12)
Categorized with25-OH-D3
Deficiency (< 15 ng/ml) 0.47 (0.16~1.38) 3.81 (1.61~9.03)
Borderline (15-29.9 ng/ml) 0.50 (0.21~1.20) 2.68 (1.11~6.47)
Normal (≥ 30 ng/ml) 1.00 (Ref) 1.00 (Ref)
Model 2b
Continuous per 10 ng/ml lower 25-OH-D3 1.01 (0.64~1.58) 1.46 (1.01~2.12)
Categorized with25-OH-D3
Deficiency (< 15 ng/ml) 0.50 (0.17~1.49) 3.64 (1.48~9.00)
Borderline (15-29.9 ng/ml) 0.587 (0.24~1.44) 2.54 (1.01~6.37)
Normal (≥ 30 ng/ml) 1.00 (Ref) 1.00 (Ref)
aadjusted for age, residence area, body mass index, smoking and drinking status, education level, regular ex-ercise and walking, daily nutrient intakes, body fat and use of estrogen and oral pill for women for model 1. badjusted for all covairates in model 1 plus selected blood tests (parathyroid hormone, cholesterol, TG, HDL, AST, and ALT, glucose, and HOMA-IR) for model 2.
Park S et al. Clin Nutri, 2014

HOMA-IR and total cholesterol with sarcopenia
HOMA-IR for men0
0.5
1
1.5
2
2.5
3
3.5Normal (SMI>25.4%) Class I (SMI 22.8-25.4%)
Class II (SMI<22.8%)
Total chol for women0
30
60
90
120
150
180
210
240
Park S et al. J Nutr Health & Aging, 2014
with ≥50 yrs old
a
b b
b ab a
a,b,cDifferent alphabets on the bars indicate significantly differences in each variable.

Odd ratios (95% CI) for cardiovascular diseases by sarcopenic status in KNHANES 2008-2010
Men with ≥50
yrs old
Normal
(SMI>32.0%)
(n=2,029)
Sarcopenia Class I
(SMI 29.0-32.0%) (n=196)
Sarcopenia Class II
(SMI<29.0%) (n=784)
Model 1 Model 2 Model 1 Model 2
Cardiovascular
Disease1.0 (Reference)
1.887
(1.306~2.727)
1.819
(1.242~2.666)
2.516
(1.318~4.800)
2.350
(1.255~4.399
)
Stroke 1.0 (Reference)1.714
(1.013~2.902)
1.656
(0.975~2.814)
3.777
(1.679~8.495)
3.686
(1.721~7.894
)
Miocardial
infarction1.0 (Reference)
1.644
(0.827~3.269)
1.626
(0.795~3.326)
1.240
(0.398~3.856)
1.162
(0.377~3.582
)
Angina
pectoris1.0 (Reference)
1.919
(1.079~3.413)
1.889
(1.065~3.352)
1.534
(0.561~4.192)
1.314
(0.450~3.838
)
# In model 1, adjusted for age, residence area, body mass index, waist circumferences, hypertension, smok-ing and drinking status, education level, regular exercise and walk, protein and carbohydrate intake and use of hormone and oral contraceptive pill for women. In model 2, all covairates in model 1 plus selected blood tests (25-OH-vitamin D, total cholesterol, TG, HDL, AST, and ALT, systolic blood pressure, diastolic blood pressure, blood glucose, and HOMA-IR).
Park S et al. J Nutr Health & Aging, 2014

Prevalence ratio of type 2 DM by serum 25-OH-D3 levels in young and old men in KNHANES
<25 nmol/L 50 nmol/L 75 nmol/L0
4
8
12
16
Young men Old menP
rev
ale
nc
e r
ati
o (
%) *
*
*†
*Significantly different from young men† Significantly different among different groups with serum 25-OH-D levels in old men
Lee BK et al., Asia Pac J Clin Nutri, 2012
Serum 25-OH-D3

Summary I
• Vitamin D deficiency is related to sarcopenia in Korean popula-tion, especially men.
• Vitamin D deficiency has a positive relation with sarcopenia.• Sarcopenia shows a positive association with stroke.• Vitamin D deficiency exhibits the increase of CVD and type 2 di-
abetes in the elderly men.

The effect of V-D supplementation on energy and glucose metabolism in GK male rats
Unpublished data
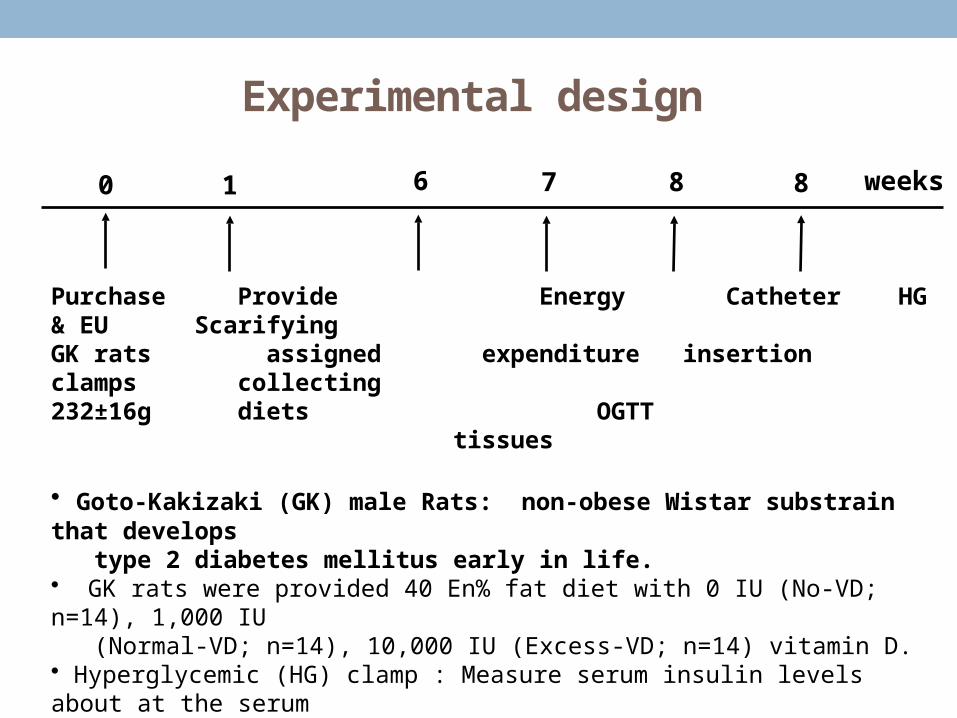
Experimental design
Purchase Provide Energy Catheter HG & EU ScarifyingGK rats assigned expenditure insertion clamps collecting 232±16g diets OGTT tissues
• Goto-Kakizaki (GK) male Rats: non-obese Wistar substrain that develops type 2 diabetes mellitus early in life.• GK rats were provided 40 En% fat diet with 0 IU (No-VD; n=14), 1,000 IU (Normal-VD; n=14), 10,000 IU (Excess-VD; n=14) vitamin D.• Hyperglycemic (HG) clamp : Measure serum insulin levels about at the serum glucose level of 5.6 mmol/L above baseline by glucose infusion.• Hyperinsulinemic euglycemic clamp: 3H-glucose was infused for 30 min for basal state. The mixture of 3H-glucose and insulin (12mU/kg BW/min) was continuously infused for approximately 2 hours. Serum insulin levels reached to 14 ng/mL, and the serum glucose levels were adjusted to 5.6 mM.
0 1 8 8 weeks76

Serum 25-OH-D3 levels and body weight
Series10
100
200
300
400
Bo
dy
we
igh
t (g
)
25-OH-D30
20
40
60
80
100
NO-VD Normal-VD Excess-VD
25
-OH
-D3
(n
mo
l/L)
c
b
a
a,b,cDifferent alphabets on the bars indicate significant differences in each variable.

Visceral fat and brown fat mass
Epididymal fat Retroperitoneum fat Brown fat (X10)0
2
4
6
8
10
12
14NO-VD Normal-VD Excess-VD
(g)
a,bDifferent alphabets on the bars indicate significant differences in each variable.
a
bb
aab
b
a
bb

Lean body mass measured by DEXA
Abdomen Leg0
2
4
6
8
10
12NO-VD Normal-VD Excess-VD
Le
an
bo
dy
ma
ss
(g
)
aa
b
aa
b
a,bDifferent alphabets on the bars indicate significant differences in each variable.

Fat mass measured by DEXA
Abdomen Leg0
1
2
3
4
5
6
NO-VD Normal-VD Excess-VD
Fa
t m
as
s (
g)
a
b b
a
b b
a,bDifferent alphabets on the bars indicate significant differences in each variable.

Daily energy expenditure and fuel usage
Series10
40
80
120
160
NO-VD Normal-VD Excess-VD
En
erg
y e
xp
en
dit
ure
(K
ca
l/da
y)
Carbohydrate Fat 0
1
2
3
4
5
6
7
8
Ox
ida
tio
n (
mg
/kg
0.7
5/m
in)
ab
a
b
aa
b
a,bDifferent alphabets on the bars indicate significant differences in each variable.

Changes of serum insulin levels during hy-perglycemic clamp
a,b,cDifferent alphabets on the bars indicate significant differences in each variable.* Significantly different among the groups.
0 2 5 10 60 900
1
2
3
4
5
6
7
NO-VD Normal-VD Excess-VD
Time (min)
Se
rum
ins
ulin
(n
g/m
L)
AUC of 1st phase AUC of 2nd phase0
1020304050607080
NO-VD Normal-VD Excess-VD
ng
ldL
*min
aa
babc
* *
**
Serum glucose level of 5.6 mmol/L above baseline by glucose infusion

Glucose disposal rates glucose uptake during euglycemic hyperinsulinemic clamp
a,bDifferent alphabets on the bars indicate significant differences in each variable.
Glucose infusion rate Glucose uptake0
5
10
15
20
25
NO-VD Normal-VD Excess-VD
mg
/kg
bw
/min
aa
b
ab
a
b
Insulin infusion (12mU/kg BW/min); Maintain serum glucose 90-100 mg/dL

Hepatic glucose output during euglycemic hyperinsulinemic clamp
Basal state Clamped state0
5
10
15
20
25
30
NO-VD Normal-VD Excess-VDm
g/k
g b
w/m
in
P=0.08

Gene related to fatty acid oxidation in gas-trocnemius muscles and BAT
a,bDifferent alphabets on the bars indicate significant differences in each variable.
PPAR-α CPT-1 UCP3 TNF-α0
0.5
1
1.5
2
2.5NO-VD Normal-VD Excess-VD
Re
lati
ve
inte
ns
ity
(A
U)
UCP10
0.2
0.4
0.6
0.8
1
1.2
1.4
1.6
1.8
2
Re
lati
ve
inte
ns
ity
(A
U) aa
b
aa
b
aa
b
aa
b
b
a
b
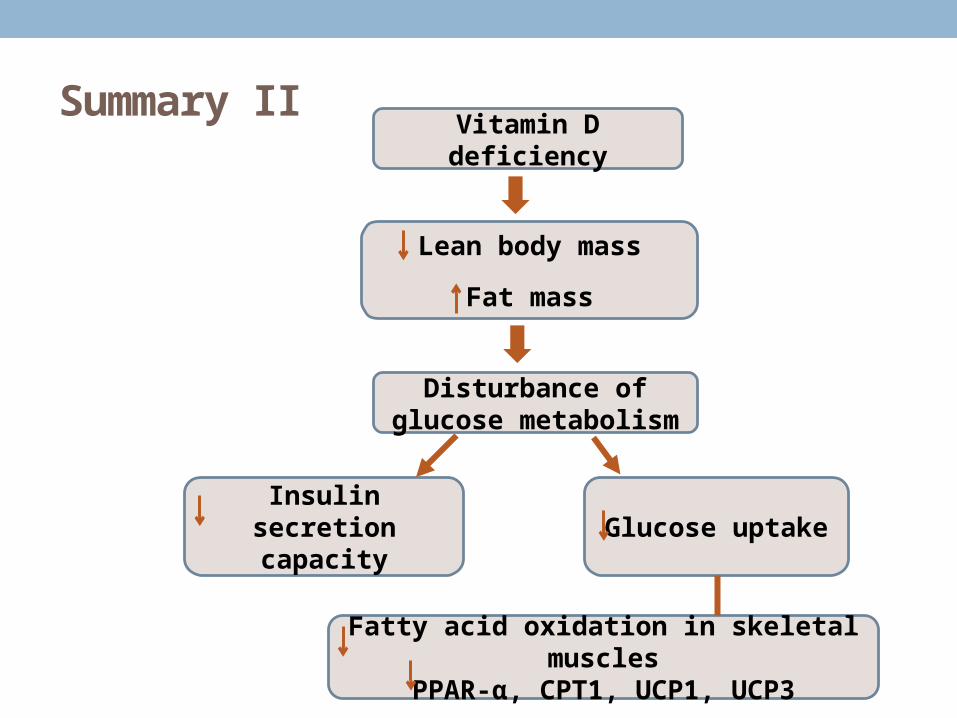
Summary IIVitamin D deficiency
Lean body mass
Fat mass
Insulin secretion capacity
Glucose uptake
Fatty acid oxidation in skeletal musclesPPAR-α, CPT1, UCP1, UCP3
Disturbance of glucose metabolism

Water extract of Korean mistletoe and body composition in ovariec-tomized rats
Kim et al., Exp Med Biol, 2014

Contents of phenolic compounds and flavonoids
Water extract of
Korean mistletoe
70% methanol extract of
Korean mistletoe
Polyphenols 3.53±0.54 5.86±0.63
Flavonoids 1.32±0.22 2.38±0.31
Betulinic acid ND 0.51 ± 0.00
Oleanolic acid ND 0.89 ± 0.01
Viscothionin 2.71±0.52 ND
Values are means±SD. ND, non-detectable.
(unit: mg/g dry weight)
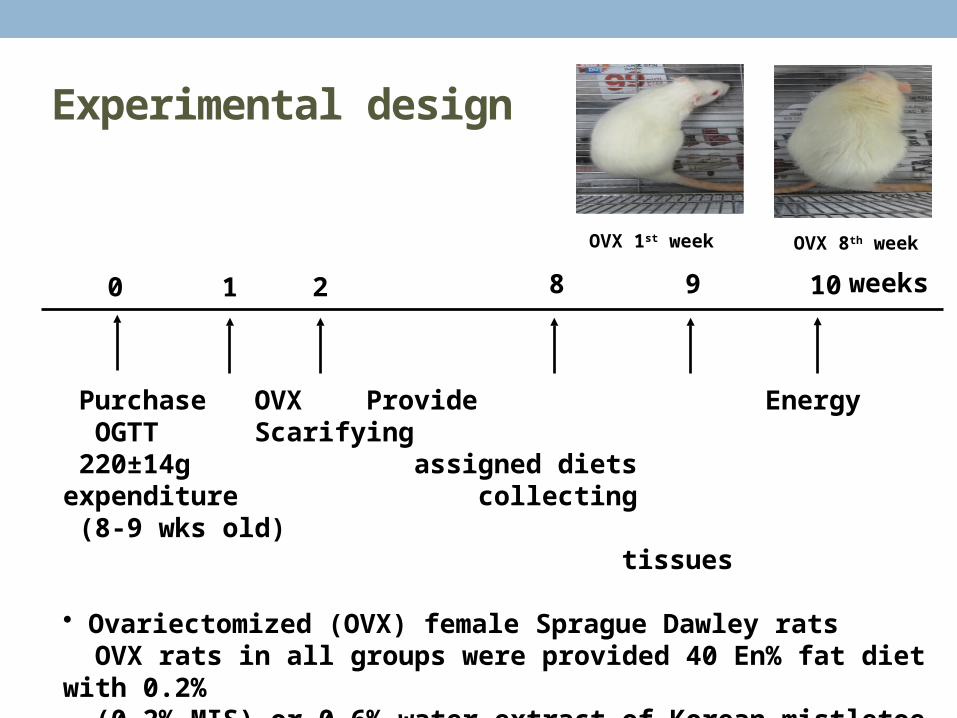
Experimental design
Purchase OVX Provide Energy OGTT Scarifying 220±14g assigned diets expenditure collecting (8-9 wks old) tissues
• Ovariectomized (OVX) female Sprague Dawley rats OVX rats in all groups were provided 40 En% fat diet with 0.2% (0.2% MIS) or 0.6% water extract of Korean mistletoe (0.6% MIS) or 0.6% dextrin for control. • Normal control : Sham (non-OVX) rats fed 40 En% fat diet with 0.6% dextrin
0 1 9 10 weeks82
OVX 1st week OVX 8th week

Changes of body weight and food in-take
†Significant difference between OVX rats (control) and Sham rats (normal control).
† †
1 2 3 4 5 6 7 80
50
100
150
200
250
300
350
400
450
Control 0.2% MIS0.6% MIS Normal control
Experimental periods (weeks)
Bo
dy
we
igh
t (g
)
† † †
Series10
2
4
6
8
10
12
14
16
Control 0.2% MIS 0.6% MISNormal control
Fo
od
inta
ke
(g
/da
y)

Daily energy expenditure
Con-trol
0.2% MIS
0.6% MIS
Normal control
0
20
40
60
80
100
120
140
Da
ily e
ne
rgy
ex
pe
nd
itu
re (
Kc
al/d
ay
)
CHO oxidation Fat oxidation0
1
2
3
4
5
6
7
8
9
10Control 0.2% MIS0.6% MIS Normal control
(m
g/ k
g0
.75
/min
)
†
†
†Significant difference between OVX rats (control) and Sham rats (normal control).
†

Lean body mass measured by DEXA
a,bDifferent alphabets on the bars indicate significantly differences in each variable.
†Significant difference between OVX rats (control) and Sham rats (normal-control).
Abdomen-4wk Leg-4wk Abdomen-8wk Leg-8wk0
2
4
6
8
10
12Control 0.2% MIS 0.6% MIS Normal-control
LB
M (
g)
aab
b
†
aab
b
†
aab
b
†
aab
b

Immunoblotting in gastrocnemius muscles
Control 0.2% MIS 0.6% MIS Normal
β-actin
p-mTOR
mTOR
p-4E-BP1
4E-BP1
pAMPK
AMPK
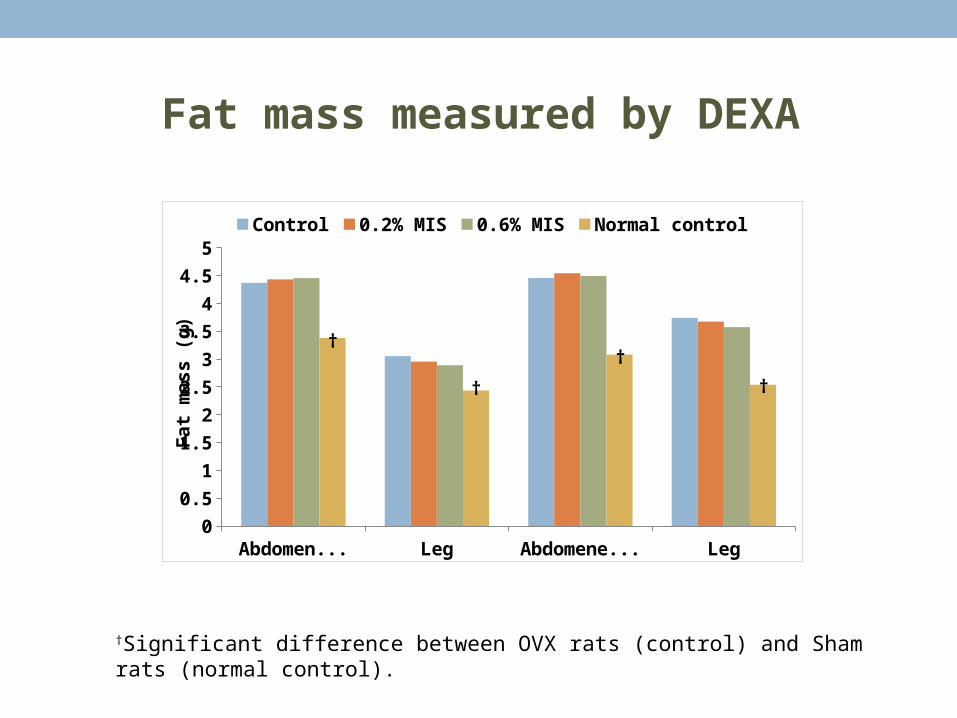
Fat mass measured by DEXA
Abdomen-4wk Leg-4wk Abdomene-8wk
Leg-8wk0
0.5
1
1.5
2
2.5
3
3.5
4
4.5
5Control 0.2% MIS 0.6% MIS Normal control
Fa
t m
as
s (
g)
†
†
†
†
†Significant difference between OVX rats (control) and Sham rats (normal control).

Genes related to fatty acid oxidation in gas-trocnemius muscles
aab
b
†a
abb
†a ab
b†
PPAR-α CPT-1 SREBP-1 FAS0
0.5
1
1.5
2
2.5
Control 0.2% MIS 0.6% MIS Normal-control
Re
lati
ve
inte
ns
ity
(A
U)
†a
abb
Series10
0.4
0.8
1.2
1.6
TG
(m
g/g
tis
su
e)
a
abb
†
a,bDifferent alphabets on the bars indicate significantly differences in each variable.
†Significant difference between OVX rats (control) and Sham rats (normal control).

Possible action mechanism of V-D and MIS in the skeletal muscles
ER-α
PPAR-α
CPT-1
SREBP-1c
FAS
MIS
MIS
Increase protein synthesis Increase fatty acid oxidation
V-D receptor
V-D
UCP
V-D receptor
V-D

Conclusion
Vitamin D, MIS
Type 2 diabetes CVD
Lean body mass
Fat mass
Improvement of energy and glucose metabolism


