• Root causes 4 and 5. Human-machine interface less than adequate. The labeling of the pipe was poor and confusing, the general ergonomics of the work situation was poor. • Root cause 6. The system was not error tolerant. The error made was not detectable. • Root cause 7. Personal performance. Attention may have been less than adequate. Causal Factor 2: Operator A Failed to Close 21A Blender Valve Root cause coding identified the following root causes: • Root causes 1,2, and 3. Procedures were not followed. Procedures were not written down and in practice were inconvenient to use. No audit was made to verify the usability of the procedures. • Root causes 4 and 5. There had been no supervision of the worker who should close the blender valves after completion of the job. No audit was made to verify that valves were routinely closed. • Root causes 6, 7, and 8. Human factors aspects were inadequately addressed. Specifically, ergonomics of the plant was poor, there were differences in layout among different areas and the labeling was poor. • Root causes 9 and 10. There may have been a communications problem in telling the worker to close the valve or the personal performance of the operator was less than adequate. Causal Factor 3: Management and Design Less Than Adequate This can apply to a number of areas in the sequence. Contributory root causes include: equipment design was poor with no human factors design for the vessel bank; supervision was poor; standards relating to design and training were poor with violations accepted as the norm. Communication among staff members was informal and unstructured. 7.4. CASE STUDY 3: DESIGN OF STANDARD OPERATING PROCEDURES FOR TASK IN CASE STUDY 2 7.4.1. Introduction Standard operating procedures (SOPs) are step-by-step job instructions which can help workers perform their jobs safely and efficiently. When the end users are involved in their design, SOPs can provide a basis for arriving at a method of work agreed-to by different shifts. In this sense, SOPs can be used to develop training programs and specify measures of competence. Because of the impor- tance of SOPs in the work situation, a systematic framework is needed to enable the design of reliable procedures which are acceptable by the workforce. Previous Page
Transcript
• Root causes 4 and 5. Human-machine interface less than adequate. Thelabeling of the pipe was poor and confusing, the general ergonomics ofthe work situation was poor.
• Root cause 6. The system was not error tolerant. The error made wasnot detectable.
• Root cause 7. Personal performance. Attention may have been less thanadequate.
Causal Factor 2: Operator A Failed to Close 21A Blender ValveRoot cause coding identified the following root causes:
• Root causes 1,2, and 3. Procedures were not followed. Procedures werenot written down and in practice were inconvenient to use. No auditwas made to verify the usability of the procedures.
• Root causes 4 and 5. There had been no supervision of the worker whoshould close the blender valves after completion of the job. No auditwas made to verify that valves were routinely closed.
• Root causes 6, 7, and 8. Human factors aspects were inadequatelyaddressed. Specifically, ergonomics of the plant was poor, there weredifferences in layout among different areas and the labeling was poor.
• Root causes 9 and 10. There may have been a communications problemin telling the worker to close the valve or the personal performance ofthe operator was less than adequate.
Causal Factor 3: Management and Design Less Than AdequateThis can apply to a number of areas in the sequence. Contributory root causesinclude: equipment design was poor with no human factors design for thevessel bank; supervision was poor; standards relating to design and trainingwere poor with violations accepted as the norm. Communication among staffmembers was informal and unstructured.
7.4. CASE STUDY 3: DESIGN OF STANDARD OPERATINGPROCEDURES FOR TASK IN CASE STUDY 2
7.4.1. Introduction
Standard operating procedures (SOPs) are step-by-step job instructions whichcan help workers perform their jobs safely and efficiently. When the end usersare involved in their design, SOPs can provide a basis for arriving at a methodof work agreed-to by different shifts. In this sense, SOPs can be used to developtraining programs and specify measures of competence. Because of the impor-tance of SOPs in the work situation, a systematic framework is needed to enablethe design of reliable procedures which are acceptable by the workforce.
Previous Page
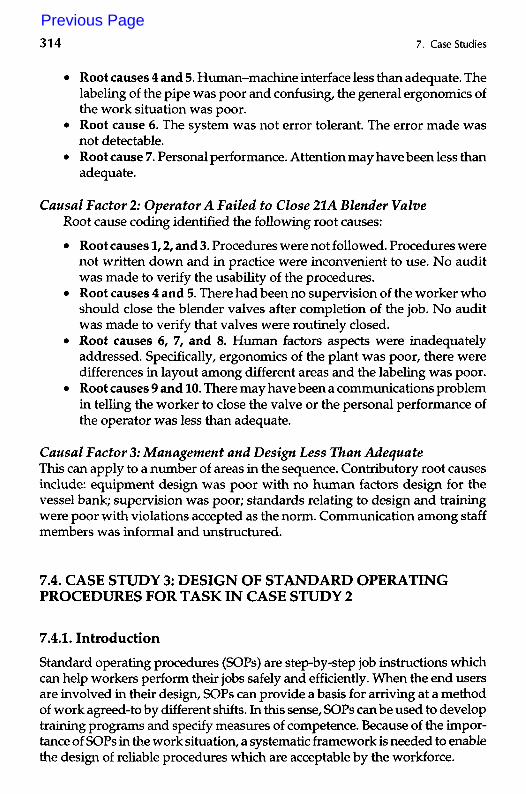
This section illustrates how the techniques described in Chapter 4 can beused to develop a procedure for the job of the top floor operator in the batchplant considered earlier. Two techniques are illustrated: (i) a hierarchical taskanalysis (HTA) of the job, and (ii) a predictive human error analysis (PHEA) ofthe operations involved. HTA provides a description of how the job is actuallydone while PHEA identifies critical errors which can have an impact on thesystem in terms of safety or quality. The basic structure of the procedure isderived from the HTA which specifies in increasing detail the goals to beachieved. To emphasize critical task steps, various warnings and cautions canbe issued based on the likely errors and recovery points generated by the PHEA.
The first step in the design of procedures is to identify the requiredinformation sources. These can include interviews with the workers andsupervisors, reviews of existing documentation (e.g., existing SOPs), actualobservation of the job, and reviews of past incidents.
7.4.2. Hierarchical Task Analysis
The main aspect of the job of the top floor person is to pump solvents or oil tovarious reactors and blenders. Instructions are issued on a job-card or byphone. The instructions are entered in a log book (which is kept by the topfloor worker) and on a record card which has to be returned to the laboratoryat the end of the shift. To prepare for pumping, protective clothing must beworn. After the required amount of solvent is set on the meter, the worker hasto connect the meter and the pipeline with a hose and then open the valve onthe pipeline (see Figure 7.10). Before starting the pump, the blender valve
VESSEL BANK SOLVENT BANK
Pipeline
Meter
DrainHose
AirEliminator
SOLVENTSTORAGETANK
BLENDERS,REACTORS
Pump
FIGURE 7.10. Diagram Showing the Flow of Solvents from the Storage Tanks to theBlenders and Reactors
4.1
Ensure meteris workingproperly
4.2
Check for airpockets in
air eliminator
4.3
Ensure pumphas stopped
Plan 4.2: DoI. Ifair flow large do 2.If OK then exit 4.2.1
Monitorair flow
4.12
Take remedialaction Plan 6: Do I
then do all inany order
6.1
Take off gloves
6.2
Mark checkbackon log book
6.3
Sign recordcard
6.4
Informchargehand
FIGURE 7.11. HTA of Pumping Solvent to Blender, Page 1 of 2.
Pump solventto blender i Plan O: Do I - 6 j
I in order :
Recieveinstructions
to pump
Start meteredpump
Resetsystem
Prepare forpumping
Completepumping
ConfirmoperationcompletePlan I:
Do I - 3in order
Accept card,paper, phoneinstructions
Enter onlog book
Enter onrecord card
: Plan 4: Do I & 2: in parallel until: required then do 3
Plan 2.2: DoI to 3 in order
Plan 2: Do I, then do 2& 3in any order, then do 4
Put on gloves Preparesolvent bank
Preparevessel bank
Go and openblender valve
Select correctpump
Connectup hose
Select correctpipeline
Open pipelinevalve at
vessel bank
Set pumpmeter
Plan 2.2.2: Do!I to 2 in order;
Plan 2.3.2: Do!I to 2 in order:
Connect pumpand pipeline
Plan 2.3: DoI to 3 in order
Zero meter Enter requiredamount
Ensure thecorrect hose
is selected
Operate thecoupling
Plan 5: Do I - 5 in orderthen if required do 6
Close pipelinevalve on
vessel bank
Disconnect hosefrom vessel bank
Disconnect hosefrom pump
Go and resetblender valve
Ensure allpipeline valves
are closed
Place hosein drain
FIGURE 7.11. HTA of Pumping Solvent to Blender, Page 2 of 2.
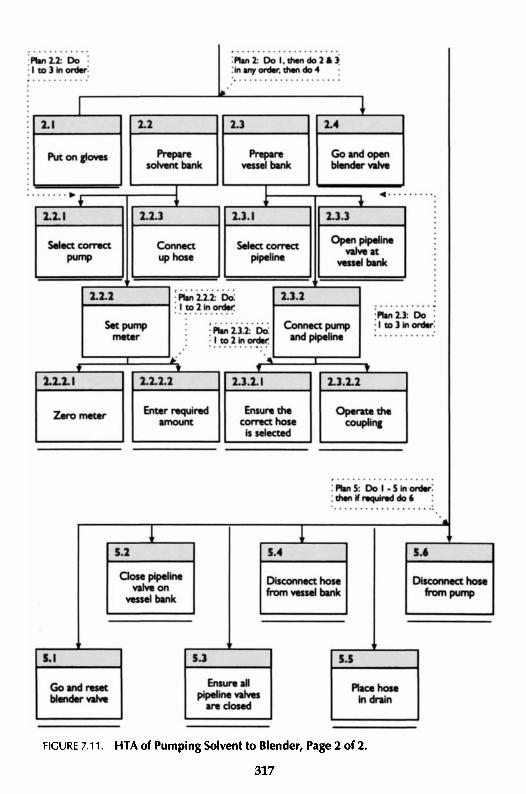
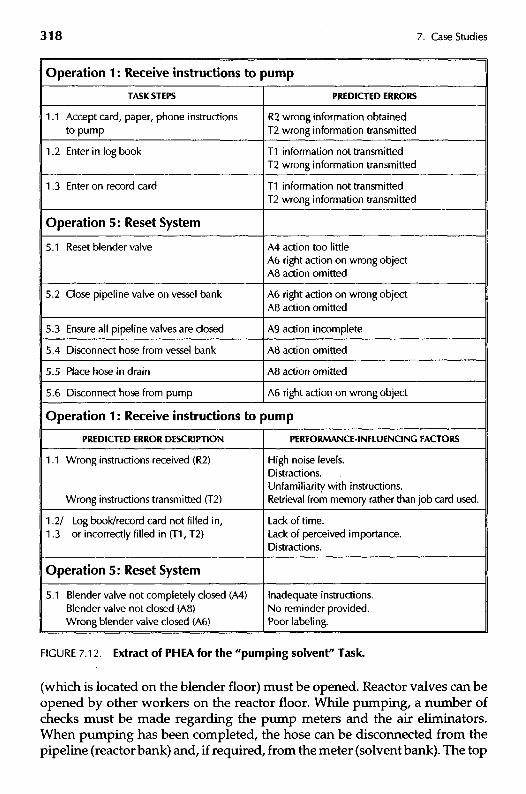
FIGURE 7.12. Extract of PHEA for the "pumping solvent" Task.
(which is located on the blender floor) must be opened. Reactor valves can beopened by other workers on the reactor floor. While pumping, a number ofchecks must be made regarding the pump meters and the air eliminators.When pumping has been completed, the hose can be disconnected from thepipeline (reactor bank) and, if required, from the meter (solvent bank). The top
Operation 1 : Receive Instructions to Pump
CONSEQUENCES
1.1 Solvent pumped to wrong blender —contaminated batch
1 .2 Laboratory may not have necessary detailsfor testing
REMEDlALACTlONS
Reduce noise levels.Reschedule operator tasks to reduce overload.Incorporate use of procedures in trainingscheme.
Ensure operators spend time in laboratory tounderstand implications of log book or recordcard being filled in incorrectly.
Operation 5: Reset System
5.1 Solvent that is incorrectly routed willcontaminate other batches
Clear indications that valve is fully closed.Checklist and training to emphasize importanceof closing valve.Improved labeling of valves.
FIGURE 7.12. Extract of PHEA for the "pumping solvent" Task (continued).
floor worker has to sign the log book and the record card and reset the blendervalve. The operator must also be informed that the operation is complete.
The HTA is shown in Figure 7.11. The overall job is broken down into sixsubtasks which must be carried out in sequence. The analyst can specify thesesubtasks as he or she wishes. For instance, "starting the metered pump" and"complete pumping" can be assigned to the same group if this is convenient.The job analysis has been taken to the level of operations where the workerinterfaces with the system. This is necessary in order for the PHEA to addresspossible errors associated with the job.
7.4.3. Predictive Human Error Analysis
During the PHEA stage, the analyst has to identify likely human errors andpossible ways of error detection and recovery. The PHEA prompts the analystto examine the main performance-influencing factors (PIFs) (see Chapter 3)which can contribute to critical errors. All the task steps at the bottom level ofthe HTA are analyzed in turn to identify likely error modes, their potential forrecovery, their safety or quality consequences, and the main performance-in-fluencing factors (PIFs) which can give rise to these errors. In this case study,credible errors were found for the majority of the task steps and each error hadmultiple causes. An analysis of two operations from the HTA is presented toillustrate the outputs of the PHEA. Figure 7.12 shows a PHEA of the twofollowing tasks: Receive instructions to pump and Reset system.
Instructions to pump might be received on a job card, by phone or on ascrap of paper. The main errors associated with this task are: wrong instruc-
tions obtained or wrong instructions transmitted. This can occur when thewrong information is passed on to the worker, or where he or she misreads ormishears instructions or forgets the instructions because of intervening events.Because of the criticality of this error, a task step "confirm back instructions"was introduced into the procedures developed from this analysis as a possibleerror detection point. Factors which could contribute to these errors would be:high level of noise at the top floor, inappropriate recording of information (e.g.,on a scrap of paper), many pumping tasks performed simultaneously by aninexperienced worker, etc. With respect to the task of recording the specifica-tions on the log book and record card, any omission or commission errorswould not have an impact on the actual operation but could cause problemswith the processing of information in the laboratory.
Resetting the system entails six operations which must be carried out insequence. Task step 5.1 is a safety barrier to prevent any mischarges to thewrong blender or reactor and any errors in closing these valves may cancelout this safety function. The PHEA has shown that the worker could fail toclose these valves fully (A4) or omit to close them at all (A8) or could close thewrong valve (A6). All these errors were very likely because of the followingperformance-influencing factors: procedures not followed (because of theabsence of a "procedures culture"), many simultaneous pumping tasks, dis-tractions, assumptions that someone else would close the valves etc. Othercritical errors were related to tasks 5.2 and 5.3. Omitting to close the pipelinevalves (A8, A9) could be seen as unsafe acts because high reactor pressurescould cause backflow of solvents or oils to the charging manifold. Also, closingthe wrong pipeline valve (A6) could have severe effects in cases where solventwas being pumped to that valve. With respect to task steps 5.4 and 5.5,omission errors were likely but would not have any severe consequences apartfrom adding to the confusion of pipework caused by a large number of hosesconnected to various meters and pipelines. Finally, disconnecting the wronghose (A6) would be a critical error to make since solvent might be passingthrough the hose.
All critical errors and recovery points for task steps are recorded inaccordance with the conventions of the PHEA and provide a valuable inputto the specification of warnings and cautions for the design of procedures. Inaddition, various performance-influencing factors which contribute to theoccurrence of critical errors can be identified which can provide input to thedevelopment of other error reduction measures such as training, and controlpanel design.
7.4.4. Input to the Design of SOPs
To ascertain the appropriate format of a procedure, the analyst must establishhow familiar the worker is likely to be with the task steps to be performed. If
he or she is very familiar with the task, such that it is usually executed frommemory, then the most appropriate form of procedure will be a checklist inwhich active responses are required at only critical points in the task. Forunfamiliar and/or infrequent tasks, a step-by-step form of procedure will bemost appropriate.
The top floor operators are usually highly skilled and experienced in manyof the steps within the process. Therefore, a checklist may suffice as a job aid.However, new staff members may be sent to the top floor as part of theirjob-rotation scheme and a step-by-step procedure may be of benefit to them.Detailed procedures can be used either as job aids or as training aids. It isworthwhile, therefore, to develop both a checklist and a step-by-step proce-dure for the top floor job.
Having established the content of SOPs from the HTA and PHEA, ergo-nomics guidelines for information presentation can be used to ensure thatworkers can quickly refer to the instructions and that the possibility of misin-terpretation is minimized. An example of such guidelines is United KingdomAtomic Energy Authority (1991). In this section, the focus will be on the inputsfrom the HTA and PHEA to the design of SOPs.
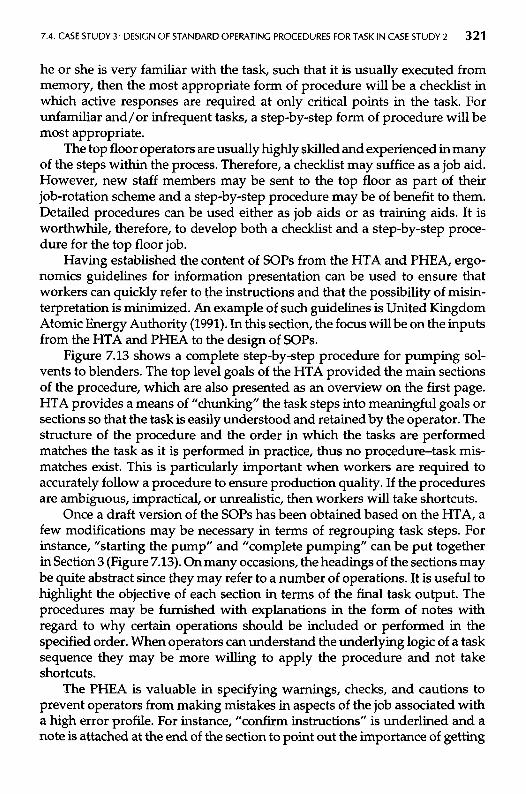
Figure 7.13 shows a complete step-by-step procedure for pumping sol-vents to blenders. The top level goals of the HTA provided the main sectionsof the procedure, which are also presented as an overview on the first page.HTA provides a means of "chunking" the task steps into meaningful goals orsections so that the task is easily understood and retained by the operator. Thestructure of the procedure and the order in which the tasks are performedmatches the task as it is performed in practice, thus no procedure-task mis-matches exist. This is particularly important when workers are required toaccurately follow a procedure to ensure production quality. If the proceduresare ambiguous, impractical, or unrealistic, then workers will take shortcuts.
Once a draft version of the SOPs has been obtained based on the HTA, afew modifications may be necessary in terms of regrouping task steps. Forinstance, "starting the pump" and "complete pumping" can be put togetherin Section 3 (Figure 7.13). On many occasions, the headings of the sections maybe quite abstract since they may refer to a number of operations. It is useful tohighlight the objective of each section in terms of the final task output. Theprocedures may be furnished with explanations in the form of notes withregard to why certain operations should be included or performed in thespecified order. When operators can understand the underlying logic of a tasksequence they may be more willing to apply the procedure and not takeshortcuts.
The PHEA is valuable in specifying warnings, checks, and cautions toprevent operators from making mistakes in aspects of the job associated witha high error profile. For instance, "confirm instructions" is underlined and anote is attached at the end of the section to point out the importance of getting
STANDARD OPERATING PROCEDURE m
PUMPING SOLVENTS TO BLENDER VESSELS
OBJECTIVE: To pump a specified solvent type to the required blender
PROCEDURE: The following steps are required for the pumping ofsolvents to blenders:
1 Receive instructions to pump2 Prepare for pumping3 Complete pumping4 Reset system5 Confirm operation complete
FOLLOW THE STEPS BELOW IN SEQUENCE
1 Receive instructions to pump
Receive instructions to pump on job card, paper, or phone. Confirm backinstructions and then enter specifications on log book and record card.
Note: It is essential that the correct instructions are received.
page 1 of3.
FIGURE 7.13 Example of Step-by-Step Procedure for Pumping Solvents, Page 1 of 3.
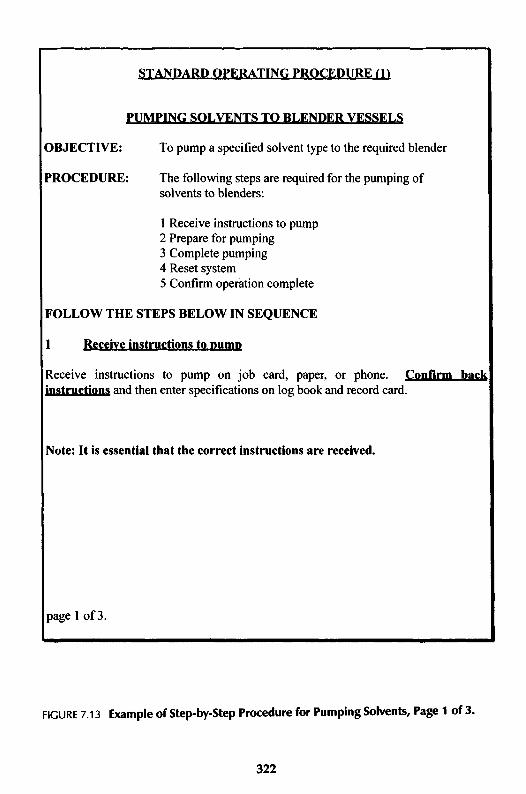
2 Prepare for pumping
Objective: To connect the correct pump to the required vessel
Procedure: Do steps 2.1 and 2.2 and then do 2.3.Correct protective clothing must be worn, i.e. visor, gloves, and
overalls.
Warning: Solvent can produce intense irritation if it reaches eyes or skin.
2.1 Prepare solvent bank by carrying out the steps below in sequence:2.1.1 Select correct pump2.1.2 Set pump meter to zero and enter the required amount ofsolvent2.1.3 Connect up hose
2.2 Prepare charging manifold by carrying out the steps below insequence:2.2.1 Select correct pipeline2.2.2 Connect pump and pipeline by selecting the correct hoseand making the coupling at the pipeline2.2.3 Open pipeline valve at vessel bank
2.3 Go to the blender floor and open blender valve
Warning: If the correct blender valve is not operated batches in otherblenders may be contaminated.
3 Initiate and complete pumping
Objective: To feed solvent to the blender, having performed the preparationchecks
Procedure: Start the pump and follow the steps in sequence:
3.1 Ensure meter is working properly throughout pumping3.2 Check for air pockets in air eliminator3.3 Ensure pump has stopped after specified amount of solvent hasbeen pumped3.4 Verify that air is completely eliminated by reading O pressure
in gauge.
Warning: If the air in the solvent line is not completely eliminated incorrectadditions may be made.
page 2 of 3.
FIGURE 7.13 Example of Step-by-Step Procedure for Pumping Solvents, Page 2 of 3.
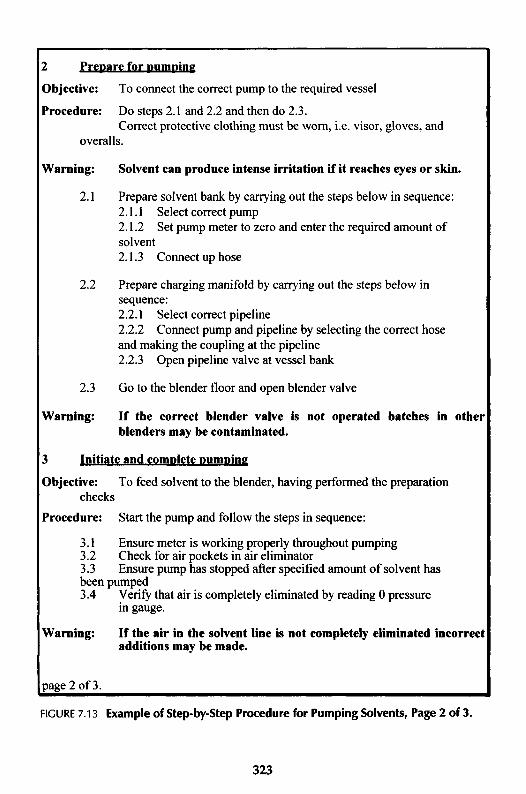
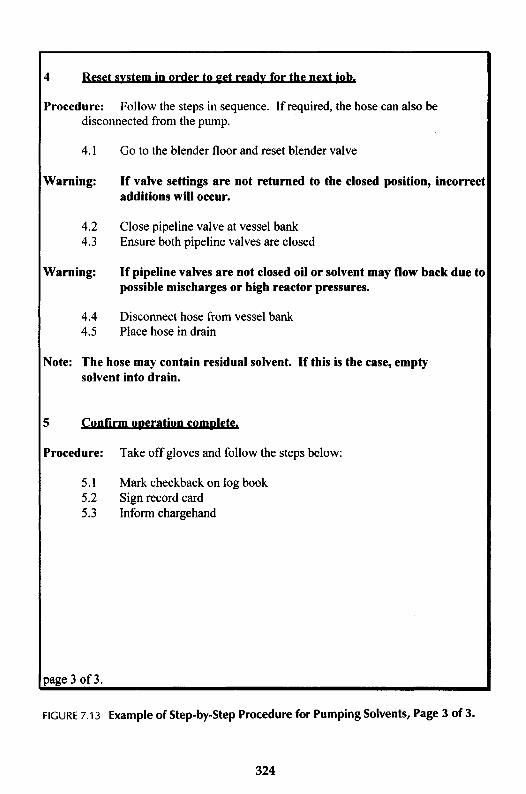
4 Reset system in order to get ready for the next job.
Procedure: Follow the steps in sequence. If required, the hose can also bedisconnected from the pump.
4.1 Go to the blender floor and reset blender valve
Warning: If valve settings are not returned to the closed position, incorrectadditions will occur.
4.2 Close pipeline valve at vessel bank4.3 Ensure both pipeline valves are closed
Warning: If pipeline valves are not closed oil or solvent may flow back due topossible mischarges or high reactor pressures.
4.4 Disconnect hose from vessel bank4.5 Place hose in drain
Note: The hose may contain residual solvent. If this is the case, emptysolvent into drain.
5 Confirm operation complete.
Procedure: Take off gloves and follow the steps below:
5.1 Mark checkback on log book5.2 Sign record card5.3 Inform chargehand
page 3 of3.
FIGURE 7.13 Example of Step-by-Step Procedure for Pumping Solvents, Page 3 of 3.
the instructions right from the start. In Section 3, a warning is added explainingwhy workers should monitor the functioning of the air eliminator (large airpockets may give rise to incorrect additions of solvent). Other warningsinclude reasons why blender valves should be reset after use (Section 4) orwhy all pipeline valves should be closed after completion of the job (Section4). All these warnings and notes are based on the errors predicted in the PHEA(Figure 7.12).
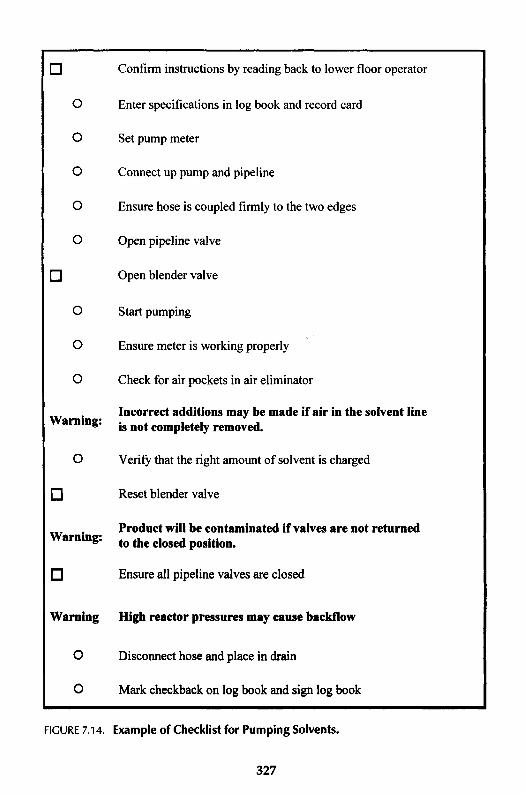
On the basis of the information contained in a step-by-step procedure, achecklist can be designed consisting of active checks for critical steps whichoperate as an "aide memoir." Experienced workers who normally carry out atask from memory may forget isolated acts or inadvertently not follow thecorrect sequence of steps in the procedure.
The function of the checklist is to reduce the likelihood of omission errorsand to facilitate recovery of these errors. For those steps which are likely to beomitted (e.g., because no immediate feedback exists to confirm they have beencarried out) or which have critical consequences, an active check is specifiedwhere the operator has to sign after the step has been executed. The purposeof these checks is to assist the worker in preventing errors rather than keepinga record so that he or she may be held responsible if actions are omitted. If thispoint is emphasized then it is less likely that personnel will "sign ahead."Other steps, associated with errors of low probability and cost, may beincluded in the checklist if this helps the operator maintain his or her placewithin the sequence of the task steps. Warnings play an important role as inthe design of step-by-step procedures. An example of a checklist for pumpingsolvents to blenders is shown in Figure 7.14.
7.5. CASE STUDY 4: DESIGN OF VISUAL DISPLAY UNITS FORCOMPUTER-CONTROLLED PLANT
7.5.1. Introduction
Control room operations in the process industries are notoriously productiveof human errors. Typically, this is due to the presence of error inducingconditions such as the presentation of information to the operators which doesnot allow effective monitoring of the process or diagnosis of abnormal condi-tions. Unfortunately, the trend of replacing pneumatic panel instrumentationwith computer controlled process systems and visual display units (VDUs)for reasons of increased hardware reliability, speed of response, quality, andlower maintenance costs etc., has not always achieved the correspondingbenefits for operability. Bellamy and Geyer (1988) analyzed a selection ofincidents in computer controlled process systems and concluded that humanerrors during operations were associated with 59% of the incidents. In a
breakdown of the causes of these errors, poor provision of information waspredominant. The purpose of this section is to demonstrate how the humanfactors methodologies discussed in previous chapters can be used to designdisplay systems which support the efficient and reliable performance ofprocess control tasks.
One of the most noticeable differences between pneumatic instrumenta-tion panels and computer-based displays is the way that information ispresented to the user. Instrumentation panels allow the workers to obtain aquick overview of the state of the process by simply scanning the panel whilecomputer-based displays present the information in a serial fashion. Theworker therefore has only a small "window" on all the data about the presentstate of the process. Navigating through numerous VDU pages is in itself asecondary task in addition to the primary task of controlling the process. It isapparent, therefore, that computerized displays can increase workload if theirconfiguration is not in accordance with human factors design principles.Application of these design principles can exploit the flexibility of computer-based displays to configure process data in a way that human informationprocessing is enhanced. It is important, therefore, to examine how the meth-odologies described in previous chapters can take advantage of the flexibilitythat computer-based displays can offer.
When discussing how to support a worker's task by interface design, it isuseful to have a simple framework for the types of task involved, becausedifferent design principles are relevant to different types of the overall task.The skill-rule-knowledge (SRK) framework of human performance (seeChapter 2) can be useful in classifying the types of tasks involved in navigatingthrough a computer-based display system and in controlling the chemicalprocess itself. These tasks can be classified as follows:
Skill-Based TasksThese include identification of process equipment and instruments, interpre-tation of the meaning of their values and trends, navigation through differentVDU pages by means of a selection menu, etc. The common feature of thesetasks is handling the display system to search and locate relevant process data.In this respect, "classical" ergonomics checklists (see Chapter 4) are very usefulin facilitating performance of such tasks.
Rule-Based TasksThese refer to the control of a chemical process and include planning for familiartasks (e.g., change type of fuel-firing in a furnace) or planning for familiar butinfrequent tasks (e.g., start-up or shutdown a furnace). Methods of task analysisand error analysis can be used to analyze well-established strategies thatoperators use to perform procedural tasks and identify the user's informationneeds. An implication for display design would be that all information needed
n Confirm instructions by reading back to lower floor operator
O Enter specifications in log book and record card
O Set pump meter
O Connect up pump and pipeline
O Ensure hose is coupled firmly to the two edges
O Open pipeline valve
[] Open blender valve
O Start pumping
O Ensure meter is working properly
O Check for air pockets in air eliminator
. Incorrect additions may be made if air in the solvent lineWarning: fa nof completdy remOved.
O Verity that the right amount of solvent is charged
n Reset blender valve
Product will be contaminated if valves are not returnedWarning: ^ ̂ do§cd positioih
n Ensure all pipeline valves are closed
Warning High reactor pressures may cause backflow
O Disconnect hose and place in drain
O Mark checkback on log book and sign log book
FIGURE 7.14. Example of Checklist for Pumping Solvents.
in any one decision should be available at the same time in one VDU page.Apart from deciding the content of each VDU page, these methods can be usedto design a hierarchical structure for the total display system.
Knowledge-Based TasksProcess transients and equipment failures may require workers to develop anew strategy to control the process. Detection, diagnosis, and fault-compen-sation are tasks in which workers may have little experience and the informa-tion needs may be different from those of familiar tasks. Again, methods oftask and error analyses, particularly those concerned with human cognitivefunctions, may be useful in deciding what information should be displayed tohelp workers detect process transients, diagnose their causes and develop newstrategies.
To illustrate how this framework can be realized in the design of computer-based displays, a case study is presented which was conducted for a refinery.
7.5.2. Process Details
The case study described here concerns a human factors audit of a computercontrolled process system which was being introduced in a distillation unit ofa chemical plant. The unit was in transition from replacing its pneumatic panelinstrumentation with the new system. However, control had not yet beentransferred and the staff were still using the panel instrumentation. The roleof the project was to evaluate a preliminary design of the computer-baseddisplay system and provide recommendations for future development.
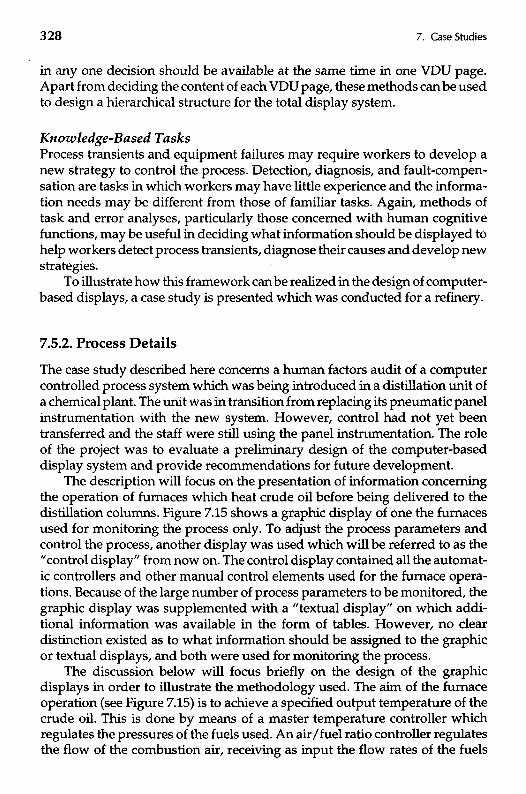
The description will focus on the presentation of information concerningthe operation of furnaces which heat crude oil before being delivered to thedistillation columns. Figure 7.15 shows a graphic display of one the furnacesused for monitoring the process only. To adjust the process parameters andcontrol the process, another display was used which will be referred to as the"control display" from now on. The control display contained all the automat-ic controllers and other manual control elements used for the furnace opera-tions. Because of the large number of process parameters to be monitored, thegraphic display was supplemented with a "textual display" on which addi-tional information was available in the form of tables. However, no cleardistinction existed as to what information should be assigned to the graphicor textual displays, and both were used for monitoring the process.
The discussion below will focus briefly on the design of the graphicdisplays in order to illustrate the methodology used. The aim of the furnaceoperation (see Figure 7.15) is to achieve a specified output temperature of thecrude oil. This is done by means of a master temperature controller whichregulates the pressures of the fuels used. An air/fuel ratio controller regulatesthe flow of the combustion air, receiving as input the flow rates of the fuels
FIGURE 7.15. Original Graphic Display for Furnace A.
and the combustion air. The process is on automatic control most of the time.However, there are tasks such as responding to burner failures, changing typesof firing or type of crude oil which require manual control of the furnace.Complex skills are required to carry out these operations safely. The SRKframework was used to evaluate the computer-based displays of this process.
7.5.3. Skill-Based Tasks
A highly desirable feature of display design is that skill-based tasks such asidentification of parameters, interpretation of their meaning, and navigationthrough various VDU pages should be executed at high speed and withouterrors. A limitation of the graphic display (Figure 7.15) is that the various flowand temperature parameters are not identified. The worker has to go to a textdisplay to identify the process parameters, an activity which can give rise toerrors if other tasks require attention as well. This also increases memory load.
Another limitation concerns the duplication of process information ondifferent VDU pages. Specifically, most of the data on the graphic displays werepresented again in a different format on the text displays. This increased thenumber of VDU pages used in total to perform a task. This secondary naviga-tion task undoubtedly increased the workload of the worker who had to controlthe process. Within the text displays themselves, information was not struc-tured in a functional manner. That is, information required by workers was
1955.11TONS/D
2000.72TONS/D
1999.29TONS/D
1941.66TONS/D
PREHEATER
A
266.58DEGC
267.31DEGC
264.67DEGC
264.96DEGC
0.00TONS/D
45.94TONS/D
50.29TONS/D
FURNACE
A
347.36DEGC
345.67DEGC
351.61DEGC
349.04DEGC
2058.69TONS/D
345.46DEGC
347.36DEGC
348.67DEGC
C4
Fuelgas
Fueloil
CRUDE
OIL
C5
COLUMN
AIR
embedded in data on productivity and quality analysis, the latter being mainlydisplayed for the benefit of technologists and production managers whoseinformation needs were essentially different from those of the workers.
7.5.4. Rule-Based Tasks
To determine the content of each VDU page, a number of furnace operationswere analyzed in terms of operator decisions and information needs. Specifi-cally, a hierarchical task analysis (HTA) was performed for the followingoperations: starting-up the furnace from cold, changing the type of fuel firing,changing the type of crude oil, and responding to burner failures. Figure 7.16shows part of an HTA of the task of manually increasing the furnace load tothe specified target. The task analysis shows that the oxygen content in the fluegases is functionally related to the output temperature of the crude, and theflow rates of the fuels and combustion air. It was concluded, therefore, thatthese parameters should be presented on the same graphic display. Erroranalysis was used to examine the errors made during a number of incidentsrecorded from other refinery plants. Errors associated with responding toburner failures, for instance, were made because workers did not set theautomatic controllers to the appropriate mode. It was decided, therefore, toincorporate data about the status of these controllers on the graphic displays.
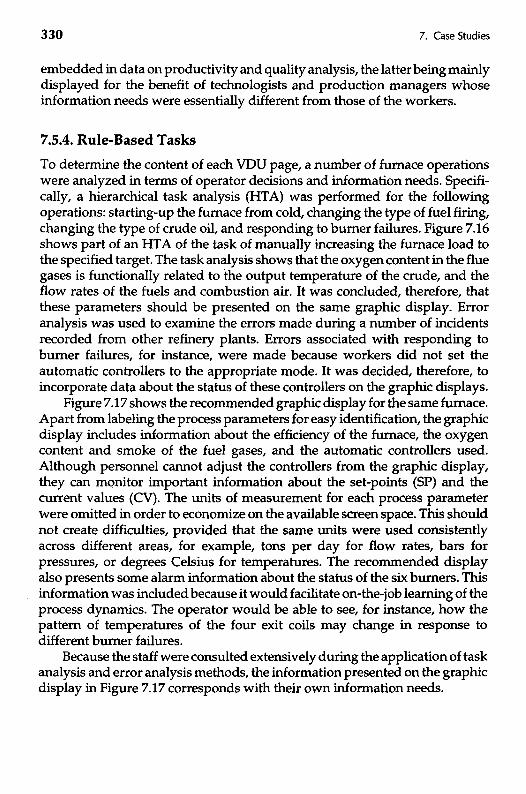
Figure 7.17 shows the recommended graphic display for the same furnace.Apart from labeling the process parameters for easy identification, the graphicdisplay includes information about the efficiency of the furnace, the oxygencontent and smoke of the fuel gases, and the automatic controllers used.Although personnel cannot adjust the controllers from the graphic display,they can monitor important information about the set-points (SP) and thecurrent values (CV). The units of measurement for each process parameterwere omitted in order to economize on the available screen space. This shouldnot create difficulties, provided that the same units were used consistentlyacross different areas, for example, tons per day for flow rates, bars forpressures, or degrees Celsius for temperatures. The recommended displayalso presents some alarm information about the status of the six burners. Thisinformation was included because it would facilitate on-the-job learning of theprocess dynamics. The operator would be able to see, for instance, how thepattern of temperatures of the four exit coils may change in response todifferent burner failures.
Because the staff were consulted extensively during the application of taskanalysis and error analysis methods, the information presented on the graphicdisplay in Figure 7.17 corresponds with their own information needs.
Plan 4.5.2: Do !,thenif oxygen is low do 2;if oxygen is high do 3;if oxygen is OK exit
Adjust flow ofcombustion air
Plan 4.5: Do 4.5.1. then 2,then if TRC is OK exit, elserepeat from I
Gradually increasefurnace load to
the desired target
Plan 4.5.1: Do !,then2, then if tips/plugs areOK exit, else do 3
Increase flow offuel supply
FIGURE 7.16. Hierarchical Task Analysis of the Task of Increasing Furnace Load.
Decrease air flowIncrease air flowMonitor oxygen
contentChange size oftips and plugs
Consult criteriontable of tips &
plugs
Increase positionof PIC control
valve
FIGURE 7.17 Recommended Graphic Display for Furnace A.
7.5.5. Knowledge-Based Tasks
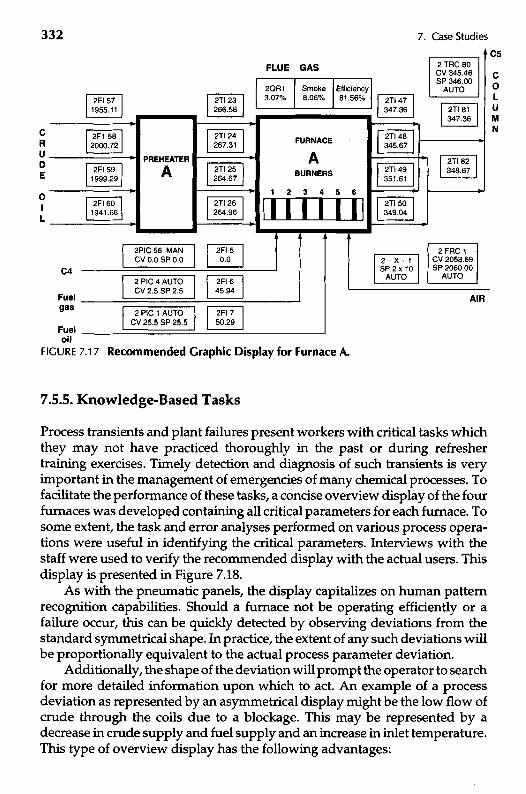
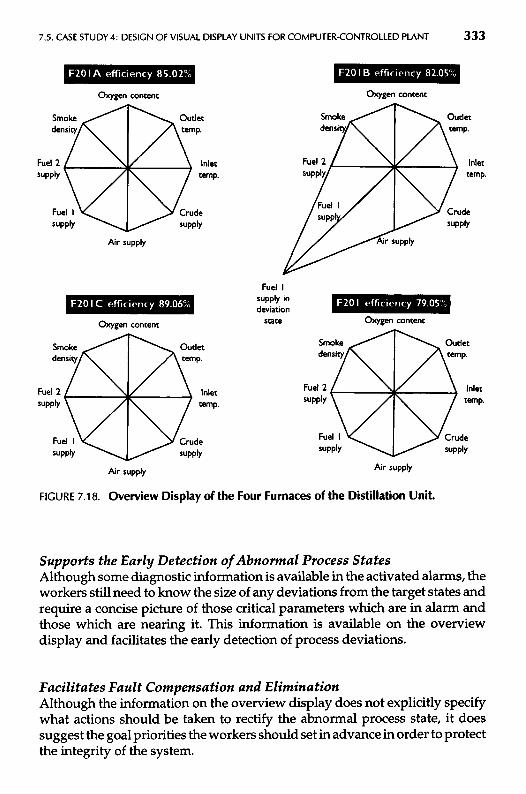
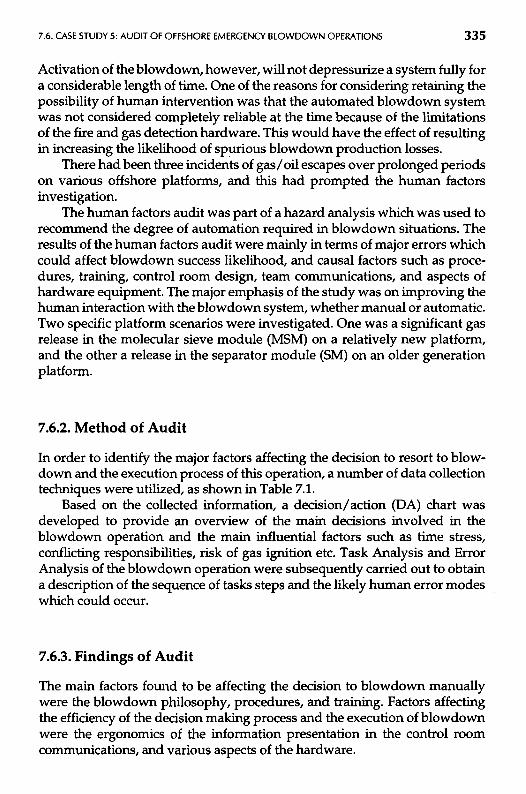
Process transients and plant failures present workers with critical tasks whichthey may not have practiced thoroughly in the past or during refreshertraining exercises. Timely detection and diagnosis of such transients is veryimportant in the management of emergencies of many chemical processes. Tofacilitate the performance of these tasks, a concise overview display of the fourfurnaces was developed containing all critical parameters for each furnace. Tosome extent, the task and error analyses performed on various process opera-tions were useful in identifying the critical parameters. Interviews with thestaff were used to verify the recommended display with the actual users. Thisdisplay is presented in Figure 7.18.
As with the pneumatic panels, the display capitalizes on human patternrecognition capabilities. Should a furnace not be operating efficiently or afailure occur, this can be quickly detected by observing deviations from thestandard symmetrical shape. In practice, the extent of any such deviations willbe proportionally equivalent to the actual process parameter deviation.
Additionally, the shape of the deviation will prompt the operator to searchfor more detailed information upon which to act. An example of a processdeviation as represented by an asymmetrical display might be the low flow ofcrude through the coils due to a blockage. This may be represented by adecrease in crude supply and fuel supply and an increase in inlet temperature.This type of overview display has the following advantages:
cRuDE
OIL
2Fl 571955.11
2F1 582000.72
2Fl 591999.29
2Fl 601941.66
PREHEATER
A
2Tl 23266.58
2Tl 24267.31
2Tl 25264.67
2Tl 26264.96
2Fl 50.0
2Fl 645.94
2Fl 750.29
2PIC 56 MANCV 0.0 SP 0.0
2 PIC 4 AUTOCV 2.5 SP 2.5
2 PIC 1 AUTOCV 25.5 SP 25.5
C4
Fuelgas
Fueloil
FURNACE
ABURNERS
FLUE
2QR13.07%
GAS
Smoke8.06%
Efficiency81.56% 2Tl 47
347.36
2Tl 48345.67
2Tl 49351.61
2Tl 50349.04
2 TRC 80CV 345.46SP 346.00
AUTO
2Tl 81347.36
2Tl 82348.67
C5
COLUMN
2-X-1SP2x10
AUTO
2FRC 1CV 2058.69SP 2060.00
AUTO
AIR
FIGURE 7.18. Overview Display of the Four Furnaces of the Distillation Unit.
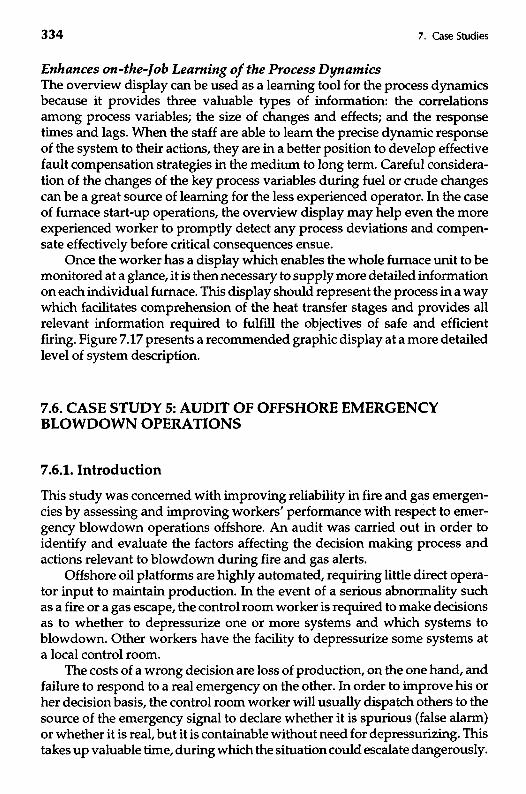
Supports the Early Detection of Abnormal Process StatesAlthough some diagnostic information is available in the activated alarms, theworkers still need to know the size of any deviations from the target states andrequire a concise picture of those critical parameters which are in alarm andthose which are nearing it. This information is available on the overviewdisplay and facilitates the early detection of process deviations.
Facilitates Fault Compensation and EliminationAlthough the information on the overview display does not explicitly specifywhat actions should be taken to rectify the abnormal process state, it doessuggest the goal priorities the workers should set in advance in order to protectthe integrity of the system.
Oxygen content Oxygen content
Smokedensity
Outlettemp.
Smokedensity
Outlettemp.
Fuel 2supply
Inlettemp.
Fuel!supply
Inlettemp.
Fuel Isupply
Crudesupply
Fuel Isupply, Crude
supply
Air supply Air supply
Fuel Isupply indeviation
stateOxygen content Oxygen content
Smokedensity
Outlettemp.
Smokedensity
Outlettemp.
Fuel 2supply
Inlettemp.
Fuel 2supply
Inlettemp.
Fuel Isupply
Crudesupply
Fuel Isupply
Crudesupply
Air supply Air supply
Enhances on-the-Job Learning of the Process DynamicsThe overview display can be used as a learning tool for the process dynamicsbecause it provides three valuable types of information: the correlationsamong process variables; the size of changes and effects; and the responsetimes and lags. When the staff are able to learn the precise dynamic responseof the system to their actions, they are in a better position to develop effectivefault compensation strategies in the medium to long term. Careful considera-tion of the changes of the key process variables during fuel or crude changescan be a great source of learning for the less experienced operator. In the caseof furnace start-up operations, the overview display may help even the moreexperienced worker to promptly detect any process deviations and compen-sate effectively before critical consequences ensue.
Once the worker has a display which enables the whole furnace unit to bemonitored at a glance, it is then necessary to supply more detailed informationon each individual furnace. This display should represent the process in a waywhich facilitates comprehension of the heat transfer stages and provides allrelevant information required to fulfill the objectives of safe and efficientfiring. Figure 7.17 presents a recommended graphic display at a more detailedlevel of system description.
7.6. CASE STUDY 5: AUDIT OF OFFSHORE EMERGENCYSLOWDOWN OPERATIONS
7.6.1. Introduction
This study was concerned with improving reliability in fire and gas emergen-cies by assessing and improving workers' performance with respect to emer-gency blowdown operations offshore. An audit was carried out in order toidentify and evaluate the factors affecting the decision making process andactions relevant to blowdown during fire and gas alerts.
Offshore oil platforms are highly automated, requiring little direct opera-tor input to maintain production. In the event of a serious abnormality suchas a fire or a gas escape, the control room worker is required to make decisionsas to whether to depressurize one or more systems and which systems toblowdown. Other workers have the facility to depressurize some systems ata local control room.
The costs of a wrong decision are loss of production, on the one hand, andfailure to respond to a real emergency on the other. In order to improve his orher decision basis, the control room worker will usually dispatch others to thesource of the emergency signal to declare whether it is spurious (false alarm)or whether it is real, but it is containable without need for depressurizing. Thistakes up valuable time, during which the situation could escalate dangerously.
Activation of the blowdown, however, will not depressurize a system fully fora considerable length of time. One of the reasons for considering retaining thepossibility of human intervention was that the automated blowdown systemwas not considered completely reliable at the time because of the limitationsof the fire and gas detection hardware. This would have the effect of resultingin increasing the likelihood of spurious blowdown production losses.
There had been three incidents of gas/oil escapes over prolonged periodson various offshore platforms, and this had prompted the human factorsinvestigation.
The human factors audit was part of a hazard analysis which was used torecommend the degree of automation required in blowdown situations. Theresults of the human factors audit were mainly in terms of major errors whichcould affect blowdown success likelihood, and causal factors such as proce-dures, training, control room design, team communications, and aspects ofhardware equipment. The major emphasis of the study was on improving thehuman interaction with the blowdown system, whether manual or automatic.Two specific platform scenarios were investigated. One was a significant gasrelease in the molecular sieve module (MSM) on a relatively new platform,and the other a release in the separator module (SM) on an older generationplatform.
7.6.2. Method of Audit
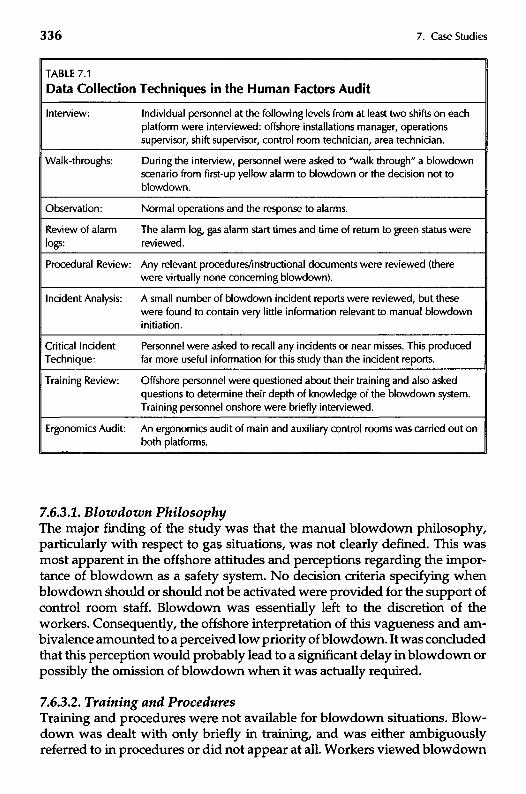
In order to identify the major factors affecting the decision to resort to blow-down and the execution process of this operation, a number of data collectiontechniques were utilized, as shown in Table 7.1.
Based on the collected information, a decision/action (DA) chart wasdeveloped to provide an overview of the main decisions involved in theblowdown operation and the main influential factors such as time stress,conflicting responsibilities, risk of gas ignition etc. Task Analysis and ErrorAnalysis of the blowdown operation were subsequently carried out to obtaina description of the sequence of tasks steps and the likely human error modeswhich could occur.
7.6.3. Findings of Audit
The main factors found to be affecting the decision to blowdown manuallywere the blowdown philosophy, procedures, and training. Factors affectingthe efficiency of the decision making process and the execution of blowdownwere the ergonomics of the information presentation in the control roomcommunications, and various aspects of the hardware.
TABLE 7.1
Data Collection Techniques in the Human Factors Audit
Interview:
WaI k-th roughs:
Observation:
Review of alarmlogs:
Procedural Review:
Incident Analysis:
Critical IncidentTechnique:
Training Review:
Ergonomics Audit:
Individual personnel at the following levels from at least two shifts on eachplatform were interviewed: offshore installations manager, operationssupervisor, shift supervisor, control room technician, area technician.
During the interview, personnel were asked to "walk through" a blowdownscenario from first-up yellow alarm to blowdown or the decision not toblowdown.
Normal operations and the response to alarms.
The alarm log, gas alarm start times and time of return to green status werereviewed.
Any relevant procedures/instructional documents were reviewed (therewere virtually none concerning blowdown).
A small number of blowdown incident reports were reviewed, but thesewere found to contain very little information relevant to manual blowdowninitiation.
Personnel were asked to recall any incidents or near misses. This producedfar more useful information for this study than the incident reports.
Offshore personnel were questioned about their training and also askedquestions to determine their depth of knowledge of the blowdown system.Training personnel onshore were briefly interviewed.
An ergonomics audit of main and auxiliary control rooms was carried out onboth platforms.
7.6.3.1. Blowdown PhilosophyThe major finding of the study was that the manual blowdown philosophy,particularly with respect to gas situations, was not clearly defined. This wasmost apparent in the offshore attitudes and perceptions regarding the impor-tance of blowdown as a safety system. No decision criteria specifying whenblowdown should or should not be activated were provided for the support ofcontrol room staff. Blowdown was essentially left to the discretion of theworkers. Consequently, the offshore interpretation of this vagueness and am-bivalence amounted to a perceived low priority of blowdown. It was concludedthat this perception would probably lead to a significant delay in blowdown orpossibly the omission of blowdown when it was actually required.
7.6.3.2. Training and ProceduresTraining and procedures were not available for blowdown situations. Blow-down was dealt with only briefly in training, and was either ambiguouslyreferred to in procedures or did not appear at all. Workers viewed blowdown
as a last resort option. This view was reinforced by the absence of proceduresor formal training. This view could only be changed by a combination oftraining in the functioning and safety value of blowdown, and by a philosophyand procedures which justified its use and specified how and when to use it.
7.6.3.3. Ergonomics of the Control RoomOn both platforms the ergonomics of layout and instrumentation wouldhinder rapid and effective response to a significant fire or gas release. Theoverall ergonomics in both control rooms betrayed the lack of a coherenthuman-machine interface design philosophy being implemented within thedesign process.
One of the most noticeable ergonomic deficiencies in both control roomswas the number of panels that had to be scanned and monitored during thescenarios, and the number of rapid actions required at opposite ends of thecontrol room. The need for virtually simultaneous actions and movementswould have been discovered and resolved in the design stage had a taskanalysis and human error analysis been carried out on an emergency operation.
The VDUs (visual display units) in both control rooms were under-util-ized for response to and control of abnormal events, in comparison to otherindustries. The control room computer had the capability to give the techni-cians considerable flexibility and power in controlling both productivity andsafety factors offshore. However, this power was not utilized.
7.6.3.4. CommunicationsThe communications systems on both platforms seemed to be prone to errorand overload, although much reliance was placed on them. In particular, thecontrol room technician had a great deal of communicating to do since he wasresponsible for coordinating the activity of a large number of workers on theplatform, while at the same time monitoring panels, accepting alarms, andcarrying out other duties.
7.6.3.5. Hardware AspectsThe most important hardware items appeared to be the detectors themselves.The gas detection system gave frequent spurious alarms, and on both plat-forms the ultraviolet (UV) fire detectors were also prone to spurious activationfrom distant hot work for example, and had a limited ability to detect real fires.The unreliability of these systems had a general effect on response time andwould, overall, lengthen the time to respond. The second aspect which wasrelated to hardware was function and performance testing of the emergencyblowdown systems. It is critical that the workers believe the systems will workwhen required, and this can only be achieved by occasional use or at leastfunction testing.
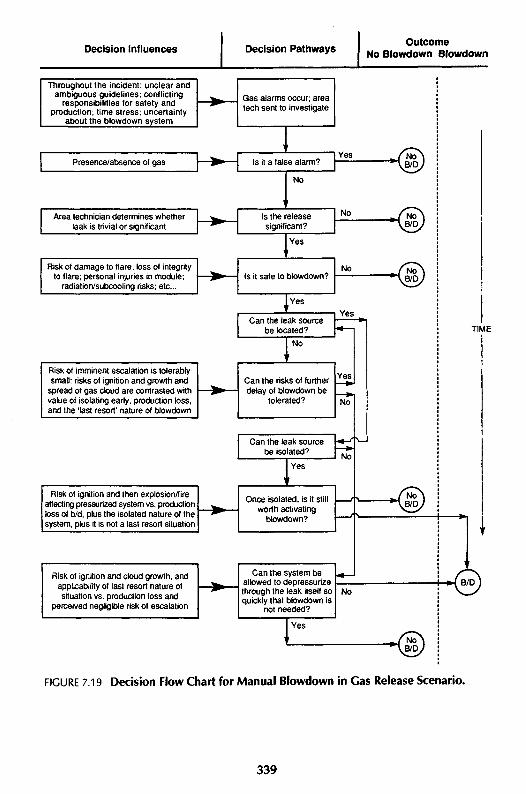
7.6.3.6. Decision-Making Aspects of BIowdown ActivationThe overall decision-making process is shown schematically in the decision/action (DA) chart (see Chapter 4) of Figure 7.19. In the case of a verified firethe decision was quickly and unequivocally made to manually blowdown thesystem. In the case of an unignited gas release however, other actions wereseen as being of more urgency. The main reason for a delay in manualblowdown on both platforms was not due to any inhibition in activating thesystem but the time required for the identification of the source of the leak andits subsequent isolation.
In the molecular sieve module (MSM) scenario, early blowdown couldcause significant production delays, and in many cases might be unnecessaryif the leak could be quickly isolated or was in fact caused by something trivial(e.g., an oil spillage or a relatively small momentary release). In the MSM therewere many potential leak sources due to the complexity of pipework arrange-ments, and once the system was blown down the identification of the leakbecame more difficult. There were also possible start-up problems once thesystem was blown down. Therefore isolation was seen as the primary objec-tive, as long as the probability of ignition was perceived to be low and the gascloud was drifting away from the platform. In the separator scenario on theother platform there were fewer production penalties following blowdown.However, isolation was still perceived to be the primary objective if possible.On this platform the blowdown function was seen as a last resort, and the factthat blowdown had never been functionally tested, combined with anxietiesexpressed over secondary risks to the flare system, reinforced this perception.
Thus, on both platforms, in the case of an unignited gas release, the causeof the leak would be investigated and isolated if possible. If the source wasdiscovered and it could not be isolated, then the last resort action of blowdownbecame applicable, unless it was felt that (in the case of the MSM scenario) itcould be allowed to depressurize through the leak itself (as this would bequicker than blowdown). However, at some stage the perceived dangers ofignition and/or gas migration would eventually outweigh other considera-tions, and a decision to blowdown would be made.
The DA flow chart in Figure 7.19 shows the dynamic nature of the decisionprocess, in as much as the inventory of gas will probably be slowly depletingitself, while the size of the gas cloud and dangers of ignition maybe increasing.In fact the workers will continually ask themselves whether ignition is likely,as this determines to a certain extent the urgency of blowdown activation. Astime passes, stress levels will increase since they are responsible for safeshutdown, and if the cloud should ignite prior to blowdown, they will beasked why blowdown was not implemented. Maintenance of productionreasons would be unlikely to satisfy any subsequent accident investigation,especially if fatalities occurred. Nevertheless it is likely, particularly in the caseof the MSM scenario where production problems will be more pronounced,
Decision Influences Decision PathwaysOutcome
No Slowdown Slowdown
Throughout the incident: unclear andambiguous guidelines; conflicting
responsibilities for safety andproduction; time stress; uncertainty
about the blowdown system
Gas alarms occur; areatech sent to investigate
Presence/absence of gas Is it a false alarm?
Area technician determines whetherleak is trivial or significant
Yes
No
Is the releasesignificant?
Risk of damage to flare; loss of integrityto flare; personal injuries in module;
radiation/subcooling risks; etc...
No
Yes
Is it safe to blowdown?No
Yes
Can the leak sourcebe located?
Risk of imminent escalation is tolerablysmall: risks of ignition and growth and
spread of gas cloud are contrasted withvalue of isolating early, production loss,and the 'last resort' nature of blowdown
Yes
No
Can the risks of furtherdelay of blowdown be
tolerated?
Yes*•
Can the leak sourcebe isolated?
Risk of ignition and then explosion/fireaffecting pressurized system vs. productionloss of b/d, plus the isolated nature of thesystem, plus it is not a last resort situation
Yes
Once isolated, is it stillworth activating
blowdown?
Risk of ignition and cloud growth, andapplicability of last resort nature ofsituation vs. production loss and
perceived negligible risk of escalation
Can the system beallowed to depressurizethrough the leak itself soquickly that blowdown is
not needed?
No
Yes
TIME
-M B/D
FIGURE 7.19 Decision Flow Chart for Manual Blowdown in Gas Release Scenario.
that reasonable attempts will be made to locate and isolate the leak sourcebefore blowdown is activated.
In summary, there was little support from the blowdown philosophy, orfrom procedures and training, to assist in the making of the decision tomanually blowdown in a significant gas release scenario. The decision makingwas made more difficult by the very high workload levels placed on thecontrol room personnel, and the delays and possible errors in critical commu-nications which served as inputs to the decision making process. Furthermore,the decision was complicated by other conflicting considerations, some par-tially related to safety and others to production, and the general uncertaintyabout the untested blowdown system and its "last resort" character. Lastly,the workers in the control room and in the affected modules were in a highlystressful situation.
Overall therefore, the workers who were required to blowdown manuallywere in a difficult situation, and tended to delay manual blowdown until itwas absolutely necessary.
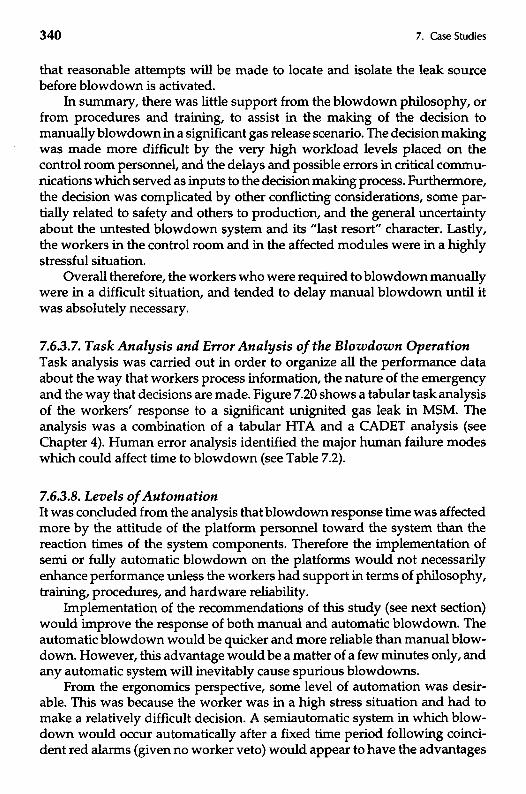
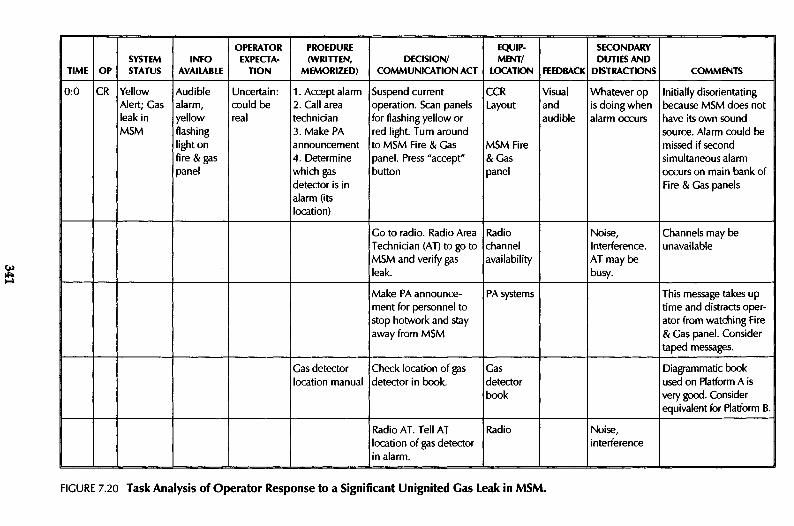
7.6.3.7. Task Analysis and Error Analysis of the Blowdown OperationTask analysis was carried out in order to organize all the performance dataabout the way that workers process information, the nature of the emergencyand the way that decisions are made. Figure 7.20 shows a tabular task analysisof the workers' response to a significant unignited gas leak in MSM. Theanalysis was a combination of a tabular HTA and a CADET analysis (seeChapter 4). Human error analysis identified the major human failure modeswhich could affect time to blowdown (see Table 7.2).
7.6.3.8. Levels of AutomationIt was concluded from the analysis that blowdown response time was affectedmore by the attitude of the platform personnel toward the system than thereaction times of the system components. Therefore the implementation ofsemi or fully automatic blowdown on the platforms would not necessarilyenhance performance unless the workers had support in terms of philosophy,training, procedures, and hardware reliability.
Implementation of the recommendations of this study (see next section)would improve the response of both manual and automatic blowdown. Theautomatic blowdown would be quicker and more reliable than manual blow-down. However, this advantage would be a matter of a few minutes only, andany automatic system will inevitably cause spurious blowdowns.
From the ergonomics perspective, some level of automation was desir-able. This was because the worker was in a high stress situation and had tomake a relatively difficult decision. A semiautomatic system in which blow-down would occur automatically after a fixed time period following coinci-dent red alarms (given no worker veto) would appear to have the advantages
COMMENTS
SECONDARYDUTIESAND
DISTRACTIONSFEEDBACK
EQUIP-MENT/
LOCATIONDECISION/
COMMUNICATION ACT
PROEDURE(WRITTEN,
MEMORIZED)
OPERATOREXPECTA-
TIONINFO
AVAILABLESYSTEMSTATUSOPTIME
Initially disorientatingbecause MSM does nothave its own soundsource. Alarm could bemissed if secondsimultaneous alarmoccurs on main bank ofFire & Gas panels
Go to radio. Radio AreaTechnician (AT) to go toMSM and verify gasleak.
This message takes uptime and distracts oper-ator from watching Fire& Gas panel. Considertaped messages.
PA systemsMake PA announce-ment for personnel tostop hotwork and stayaway from MSM
Diagrammatic bookused on Platform A isvery good. Considerequivalent for Platform B.
Gasdetectorbook
Check location of gasdetector in book.
Gas detectorlocation manual
Noise,interference
RadioRadio AT. Tell ATlocation of gas detectorin alarm.
FIGURE 7.20 Task Analysis of Operator Response to a Significant Unignited Gas Leak in MSM.
TABLE 7.2
Major Human Errors Affecting Time to Slowdown
1. Delays are caused by gas detector inhibition and panel alarm detection problems.
2. Delays are caused by workload and communication load problems.
3. Decision is made to try and locate source of leak.
4. Decision is made to continue to attempt source location identification for some time andhence delay blowdown.
5. Workers carry out alternative (higher priority) operations (e.g., load shedding).
6. Decision is made that blowdown is unnecessary if isolated.
7. Decision is made that blowdown is unnecessary even if not isolated.
8. Forget to blowdown (due to workload, distractions, or low prominence of information).
9. Procrastinate—maintain blowdown as last resort.
11. Allocation of function problem (personnel responsible believe other personnel will activateblowdown).
12. Execution fails (fail to turn key on Y platform, and leave turned; or fail to isolate beforeattempting blowdown on X platform (separator blowdown only).
13. Believe someone has already operated it—fail to verify blowdown is occurring.
14. Awaiting high level order.
15. Stress reaction—fail to activate due to high stress experienced in scenario.
of being relatively quick and robust, while allowing the operator flexibility tooverride if necessary. It also made the difficult decision of blowdown into adecision of whether or not to intervene and stop blowdown. In cases ofuncertainty, workers may be less likely to intervene and override a semiauto-matic system, whereas in a manual situation uncertainty may cause them tohesitate and fail to activate the blowdown system. Therefore, because thesemiautomatic system would require a positive response and justification toprevent blowdown, it would tend to be more reliable than a manual system.
7.6.4. Conclusions and Recommendations
The major conclusion was that if blowdown is in fact of primary importance,then the current manual system must be improved to enhance blowdownresponse time. The estimated average activation time of 20 minutes wouldhave to be brought closer to a matter of a few minutes. The basic problemunderlying the long response time was a lack of a clear statement of blowdown
philosophy and any effective procedural/training support. These aspectswere therefore the root causes of the problem, and it was these which had tobe corrected, irrespective of the decision to maintain a manual system or moveto a higher level of automation.
A selection of the recommendations which were produced are presentedbelow and cover most aspects of the blowdown operation. However, theircommon underlying theme is to provide optimum decision support in a highstress, high workload emergency situation such as a significant fire or gasrelease.
1. Issue a simple, clear management statement on blowdown, specifyingthe criteria for its activation and nonactivation.
2. Train all personnel in the functioning and value of blowdown duringan emergency. This may be achieved by safety specialists explainingthe various hazards and relative risks of blowing down and failing todepressurize.
3. Train operating personnel in recognizing criteria for blowdown activa-tion and verification, and what to do if it fails. This should consist of amixture of drills, scenarios, walkthroughs and, if possible, simulatortrials.
4. A brief checklist should be drawn up based on an explicit platform-specific procedure for the control room in the event of an emergency.The checklist should emphasize any checks that must be made beforeblowdown is initiated, and what should be observed during blow-down. This should be in the form of a flow chart.
5. The ergonomics inadequacies identified in both control rooms showthat while operational experience is being fed into the design process,there is still significant room for improvement. A design philosophy,based on current ergonomics practice in a range of industries shouldbe developed onshore (but with offshore inputs), for the purpose ofbeing used in future designs and for any retrofits that take place onexisting platforms. The development of this philosophy will requirespecialized expertise.
6. The most likely means of rectifying the very high workload and errorrates which are likely to occur, would be to make use of the VDUs inthe control room to provide important information in a centralizedlocation, perhaps also in certain cases to effect control actions. Thiswould be especially useful in one of the platform control rooms, sinceit was never intended to be a centralized control room, and there weretherefore many information limitations which could probably only becompensated for by providing VDU information.
7. The molecular sieve module fire and gas panel should be given its ownalarm sound source and alarm accept control, since there is currently arisk of an alarm being missed.
8. It is also recommended that a more comprehensive and accurate inci-dent reporting system be set up. The incident reporting system is theonly means of assembling and using data from actual incidents thathave occurred. However, the level of detail in incident reports givesvery little information which could be utilized to improve workerperformance. Also, no near miss data were available. It is suggestedthat the incident reporting and analysis system be further developedfor specifically enhancing human factors and thus reliability.
It has been demonstrated that the company-wide blowdown philosophy(or lack of) was the main root cause of the problem. As such it can be seen thatoperational areas addressed by the audit were essentially management con-trollable.