Prey Availability and the Food of Predators Author(s): David Griffiths Reviewed work(s): Source: Ecology, Vol. 56, No. 5 (Late Summer, 1975), pp. 1209-1214 Published by: Ecological Society of America Stable URL: http://www.jstor.org/stable/1936161 . Accessed: 14/10/2012 17:45 Your use of the JSTOR archive indicates your acceptance of the Terms & Conditions of Use, available at . http://www.jstor.org/page/info/about/policies/terms.jsp . JSTOR is a not-for-profit service that helps scholars, researchers, and students discover, use, and build upon a wide range of content in a trusted digital archive. We use information technology and tools to increase productivity and facilitate new forms of scholarship. For more information about JSTOR, please contact [email protected]. . Ecological Society of America is collaborating with JSTOR to digitize, preserve and extend access to Ecology. http://www.jstor.org
Transcript
Prey Availability and the Food of PredatorsAuthor(s): David GriffithsReviewed work(s):Source: Ecology, Vol. 56, No. 5 (Late Summer, 1975), pp. 1209-1214Published by: Ecological Society of AmericaStable URL: http://www.jstor.org/stable/1936161 .Accessed: 14/10/2012 17:45
Your use of the JSTOR archive indicates your acceptance of the Terms & Conditions of Use, available at .http://www.jstor.org/page/info/about/policies/terms.jsp
.JSTOR is a not-for-profit service that helps scholars, researchers, and students discover, use, and build upon a wide range ofcontent in a trusted digital archive. We use information technology and tools to increase productivity and facilitate new formsof scholarship. For more information about JSTOR, please contact [email protected].
.
Ecological Society of America is collaborating with JSTOR to digitize, preserve and extend access to Ecology.
DAVID GRIFFITHS Zoology Departmizent, Fourah Bay College, University of Sierra Leone,
Freetowtn, Sierra Leone
Abstract. Two models to predict the food of predators are proposed. They assume that prey size and prey abundance are the only availability factors of importance to predators. One model assumes that the predator consumes prey as they are encountered, and the other that predators feed to maximize their energy intake. Previous work, principally from aquatic situations, is examined to test the models. It is concluded that many invertebrates and larval vertebrates eat prey as they are encountered while adult vertebrates feed as energy maximizers. The limitations of the models are discussed and their relation to models of optimal diet examined.
Neill (1938) was probably the first to introduce the concept of "availability" of prey when examining the food of the brown trout, Salmo trutta. He noted that the food of the trout was not a simple random sample from the environment and suggested that this was because some organisms were more acces- sible than others. Allen (1941) and Hess and Swartz (1940) independently attempted to measure prey availability by comparing the percentage composition of the food with that of the organisms in the neigh- boring environment. This ratio (the forage ratio, availability factor or Ivlev's modification of it, the electivity index) is widely used, particularly by fisheries biologists. However, until very recently, there has been little attempt at further elaboration or quantification of the concept and only small progress in predicting the food of predators.
Ware (1973) developed a model describing the vulnerability of aquatic prey to visual predators. The model, which was based on an analysis of the predator's visual system, predicted the food of the rainbow trout Salmo gairdneri quite well and indi- cated the importance of various factors, particularly those associated with prey body size, in determining prey availability to the predator. Griffiths (1973) listed five factors affecting prey availability to a variety of predators but made no attempt at mea- suring their relative importance. In this paper I assume that just two factors, prey size and prey abundance, are important and I see how well models constructed from these premises explain the food of predators.
THE MODELS
Predators must have upper and lower prey size limits, i.e., they can only eat a certain size range of
prey organismns (PSR). At present I cannot predict the prey size limits (though an examination of these is in progress); they are obtained by comparing the composition of the food with that of the environ- ment. Forage ratios are calculated for each size class of prey and if a succession of size classes at either size extreme shows consistently low ratios those classes are omitted. Lauzanne (1970), for example, shows that forage ratios for the zooplankters in- gested by Alestes baretnoze increase sigmoidally with increasing body size. I regarded any organisms with forage ratios below the point at which the line rises to the plateau as being outside the PSR. For most sets of data examined all the organisms re- corded in the environment were suitable as prey. However, in five instances some very large or, more usually, very small prey had low forage ratios and these organisms were omitted as I considered them to exceed the normal PSR.
The size frequency distribution of prey present in the environment is called here the community profile. Schoener and Janzen (1968), Whittaker (1952), and Griffiths (unpubl. data) have shown that a variety of community profiles approximate to the lognormal distribution. The food profile is the size frequency distribution of prey found in the predator's food while the prey profiles are the size frequency distributions of organisms which one ex- pects to find in the food according to the models. The prey profiles are derived from that part of the community profile which falls within the PSR.
One model assumes that the predator eats its prey as they are encountered so that the most nu- merous prey in the environment (which are also assumed to be the most frequently encountered) should be the most numerous in the food. I have called this a number maximizer model. Such factors as, for example, capture success, microdistribution of prey and speed of prey movement are assumed
' Manuscript received 30 April 1974; accepted 6 March 1975.
1210 DAVID GRIFFITHS Ecology, Vol. 56, No. 5
NUMBER a IN
HABITAT
BODY SIZE
ENERGY GAIN C PER
PREY EATEN
ENERGY COST d PER
PREY EATEN
NzT GAIN e PER
PREY EATEN
NUMBER ENERGY f AVAILABLE AVAILABLE
NUMBER g EATEN
BODY SIZE
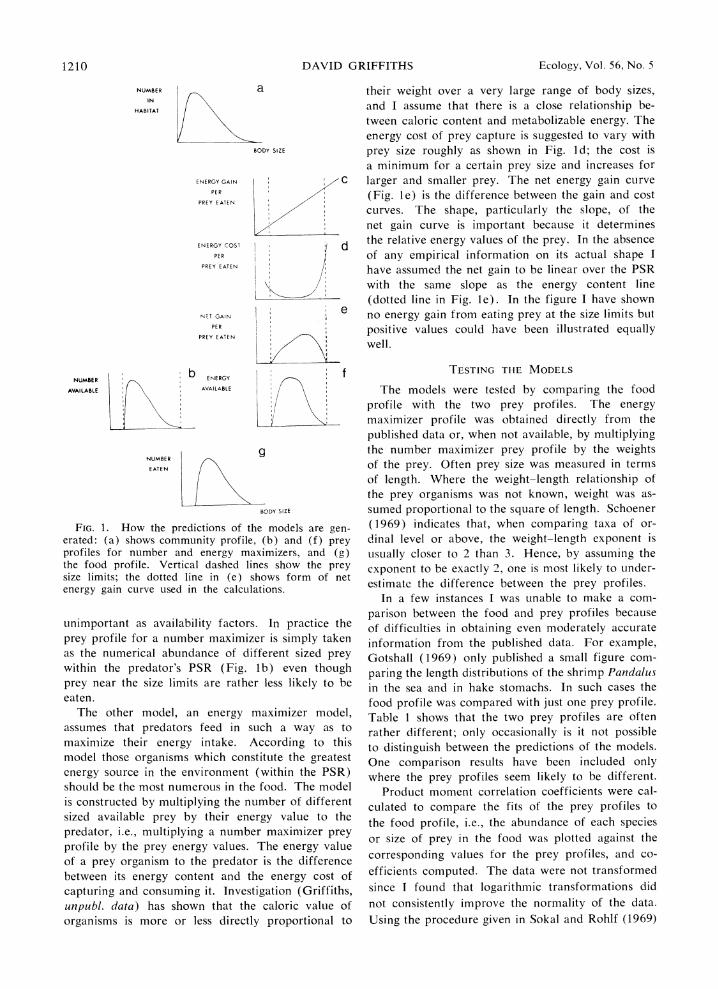
FIG. 1. How the predictions of the models are gen- erated: (a) shows community profile, (b) and (f) prey profiles for number and energy maximizers, and (g) the food profile. Vertical dashed lines show the prey size limits; the dotted line in (e) shows form of net energy gain curve used in the calculations.
unimportant as availability factors. In practice the prey profile for a number maximizer is simply taken as the numerical abundance of different sized prey within the predator's PSR (Fig. lb) even though prey near the size limits are rather less likely to be eaten.
The other model, an energy maximizer model, assumes that predators feed in such a way as to maximize their energy intake. According to this model those organisms which constitute the greatest energy source in the environment (within the PSR) should be the most numerous in the food. The model is constructed by multiplying the number of different sized available prey by their energy value to the predator, i.e., multiplying a number maximizer prey profile by the prey energy values. The energy value of a prey organism to the predator is the difference between its energy content and the energy cost of capturing and consuming it. Investigation (Griffiths, unpubl. data) has shown that the caloric value of organisms is more or less directly proportional to
their weight over a very large range of body sizes, and I assume that there is a close relationship be- tween caloric content and metabolizable energy. The energy cost of prey capture is suggested to vary with prey size roughly as shown in Fig. I d; the cost is a minimum for a certain prey size and increases for larger and smaller prey. The net energy gain curve (Fig. le) is the difference between the gain and cost curves. The shape, particularly the slope, of the net gain curve is important because it determines the relative energy values of the prey. In the absence of any empirical information on its actual shape I have assumed the net gain to be linear over the PSR with the same slope as the energy content line (dotted line in Fig. le). In the figure I have shown no energy gain from eating prey at the size limits but positive values could have been illustrated equally well.
TESTING THE MODELS
The models were tested by comparing the food profile with the two prey profiles. The energy maximizer profile was obtained directly from the published data or, when not available, by multiplying the number maximizer prey profile by the weights of the prey. Often prey size was measured in terms of length. Where the weight-length relationship of the prey organisms was not known, weight was as- sumed proportional to the square of length. Schoener (1969) indicates that, when comparing taxa of or- dinal level or above, the weight-length exponent is usually closer to 2 than 3. Hence, by assuming the exponent to be exactly 2, one is most likely to under- estimate the difference between the prey profiles.
In a few instances I was unable to make a com- parison between the food and prey profiles because of difficulties in obtaining even moderately accurate information from the published data. For example, Gotshall (1969) only published a small figure com- paring the length distributions of the shrimp Pandalus in the sea and in hake stomachs. In such cases the food profile was compared with just one prey profile. Table I shows that the two prey profiles are often rather different; only occasionally is it not possible to distinguish between the predictions of the models. One comparison results have been included only where the prey profiles seem likely to be different.
Product moment correlation coefficients were cal- culated to compare the fits of the prey profiles to
the food profile, i.e., the abundance of each species or size of prey in the food was plotted against the
corresponding values for the prey profiles, and co-
efficients computed. The data were not transformed since I found that logarithmic transformations did
not consistently improve the normality of the data.
Using the procedure given in Sokal and Rohlf (1969)
Late Summer 1975 PREY AVAILABILITY AND PREDATOR'S FOOD 1211
TABLE 1. Summary of data on the feeding strategies of predators
Daphnia galeata Plastic beads Number maximizer 67:2 NS Burns (1969a) Daphnia piulex Plastic beads Number maximizer 88:2 * Burns (1969a) Acartia tonsa Plastic beads Number maximizer ? Wilson (1973) Petromyzon marinius larvae Algae Number maximizer Moore and Beamish (1973) Lampetra lamottei larvae Algae Number maximizer Moore and Beamish (1973) Triturius viridiscens larvae Plankton Number maximizer 92:32 ** Hamilton (1940) Clupea harengius larvae Zooplankton Number maximizer 94:75 * Schnack (1972) Pleuironectes platessa larvae Oikopleiurab Number maximizer 85:16 ** ShelbouLrne (1962) Oncorhynchius nerka juveniles Zooplankton Number maximizer Hoag (1972) Oncorhynchiis gorbuscha juveniles Zooplankton Number maximizer 81:22 * Parsons and LeBrasseur (1970) Perca flavescens fry Daphniaa Number maximizer 78:39 * Wong and Ward (1972) Perca flavescens adults Daphniaa Energy maximizer 91:99 * Galbraith (1967) Perca fliviatilis Daphniaa Energy maximizer 37:58 NS Klemetsen (1973) Salmo gairdneri Daphniaa Energy maximizer 50:65 NS Galbraith (1967) Salmno gairdneri Insect drift Energy maximizer 72:76 NS Metz (1974) Lepomis macrochiruis Daphniaa Energy maximizer 10:95 ** Gerking (1962) Alestes baremoze Zooplankon1 Number maximizer 93:41 Lauzanne (1970) Alosa pseuidoharenguis Daphnia Number maximizer Warshaw (1972) Merliicciuis produictius Pandalus Number maximizer Gotshall (1969) Anolis linzifrons Insects Energy maximizer Sexton et al. (1972) Tringa totanus Corophiunt Energy maximizer ? 37:41 NS Goss-Custard (1969) Calidris canittus Maconta Energy maximizer 92:95 NS Prater (1972) Haenzatopius ostralegius Cardiiumii ediule Energy maximizer ? 75:79 NS Drinnan (1957) Delichon uirbica Insects ? 52:53 NS Bryant (1973) Polioptila caeriulea Insects Energy maximizer Root (1967) Parnis ater Insects Energy maximizer Gibb and Betts (1963) Tj'to alba Small mamimals Energy maximizer 62:87 NS Glue (1967)
Weight proportional to length2 0;3 (Burns 1969b). b Weight proportional to length2. * 0.05 > P > 0.01.
**0.01 > P >0.001.
each pair of coefficients was tested to see if they differed significantly. Where more than one set of results was available for a particular predator (for example, Goss-Custard's (1969) data on the food of the Redshank), I calculated common correlation coefficients after testing for heterogeneity and omitting any results that caused heterogeneity. In Table I coefficients of determination are shown to indicate how well each model described the food.
RESULTS
The available data are summarized in Table 1. Despite the crudeness of some of the approximations at least one of each pair of correlation coefficients was statistically significant. In 10 instances more than 80% of the variance in the food profile was accounted for by variations in the prey profile. There was a significantly better fit to one of the models than the other in 9 of the 18 instances, and in 4 further cases the small sample sizes and relative in- sensitivity of the statistical test were probably re- sponsible for the nonsignificance of the difference. In addition, while correlation coefficients for the knot (Calidris) feeding on the bivalve Macoma were not significantly different, use of the chi-squared test suggest that the bird was feeding as an energy
maximizer, there being a significant difference be- tween the food profile and the number maximizer prey profile but not between the food and energy maximizer profiles. In the four remaining cases both models explained equally well (or badly) the predator's food.
The majority of the species listed in Table 1 are aquatic. Such animals could well be more generalized feeders than terrestrial predators (Cummins 1973). The three crustaceans are normally algal filter feeders and, like most of the larval vertebrates, live in the plankton. All these species feed as number maxi- mizers. Of the adult fish the exclusively planktiv- orous Alestes and Alosa and the exclusively benthic- feeding Merluccius are number maximizers while the others, which feed on both plankton and benthos, are energy maximizers. The prey profiles for each of the three wading birds are very similar, although the energy maximizer profile is slightly better. How- ever it would seem difficult for the knot and oyster- catcher to feed as energy maximizers inasmuch as their bivalve prey are normally completely, or very largely, hidden from sight, the food usually being obtained by probing. Among the insectivorous birds, Polioptila and Parus are foliage gleaners while Delichon is an aerial planktivore. Finally the Barn
1212 DAVID GRIFFITHS Ecology, Vol. 56, No. 5
-~ ~ ' ' *
U U ~~7 .7_ NM 7 -, ,8
i 4 4;
3 ~ ~~~~~ O
J.7'
A ..r ,
.5~~~~~~~~~~~~~~~~~~~~~~~~~~~~~~~~~~~~~~~~~~~~~~~~~~~O A
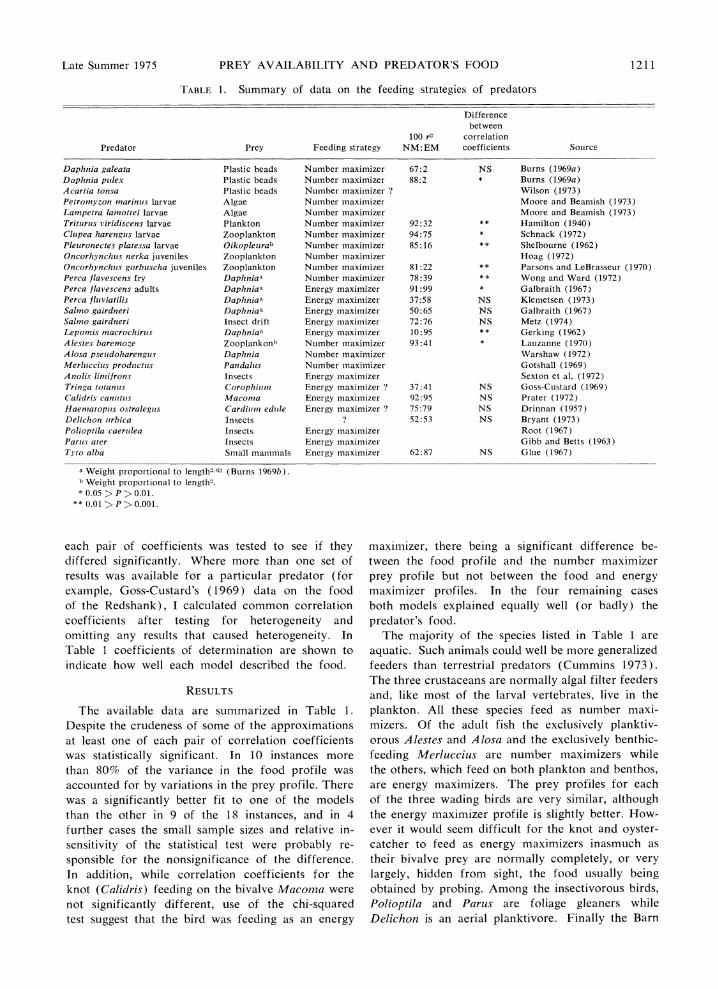
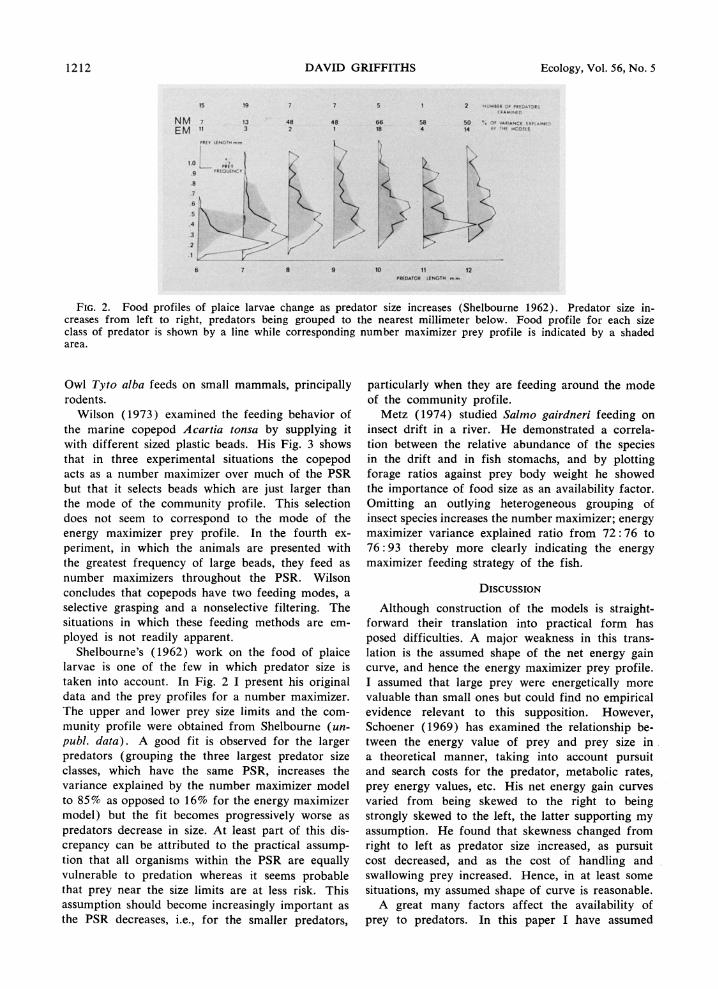
FIG. 2. Food profiles of plaice larvae change as predator size increases (Shelbourne 1962). Predator size in- creases from left to right, predators being grouped to the nearest millimeter below. Food profile for each size class of predator is shown by a line while corresponding number maximizer prey profile is indicated by a shaded area.
Owl Tyto alba feeds on small mammals, principally rodents.
Wilson (1973) examined the feeding behavior of the marine copepod Acartia tonsa by supplying it with different sized plastic beads. His Fig. 3 shows that in three experimental situations the copepod acts as a number maximizer over much of the PSR but that it selects beads which are just larger than the mode of the community profile. This selection does not seem to correspond to the mode of the energy maximizer prey profile. In the fourth ex- periment, in which the animals are presented with the greatest frequency of large beads, they feed as number maximizers throughout the PSR. Wilson concludes that copepods have two feeding modes, a selective grasping and a nonselective filtering. The situations in which these feeding methods are em- ployed is not readily apparent.
Shelbourne's (1962) work on the food of plaice larvae is one of the few in which predator size is taken into account. In Fig. 2 I present his original data and the prey profiles for a number maximizer. The upper and lower prey size limits and the com- munity profile were obtained from Shelbourne (un- publ. data). A good fit is observed for the larger predators (grouping the three largest predator size classes, which have the same PSR, increases the variance explained by the number maximizer model to 85% as opposed to 16% for the energy maximizer model) but the fit becomes progressively worse as predators decrease in size. At least part of this dis- crepancy can be attributed to the practical assump- tion that all organisms within the PSR are equally vulnerable to predation whereas it seems probable that prey near the size limits are at less risk. This assumption should become increasingly important as the PSR decreases, i.e., for the smaller predators,
particularly when they are feeding around the mode of the community profile.
Metz (1974) studied Salmo gairdneri feeding on insect drift in a river. He demonstrated a correla- tion between the relative abundance of the species in the drift and in fish stomachs, and by plotting forage ratios against prey body weight he showed the importance of food size as an availability factor. Omitting an outlying heterogeneous grouping of insect species increases the number maximizer; energy maximizer variance explained ratio from 72:76 to 76: 93 thereby more clearly indicating the energy maximizer feeding strategy of the fish.
DISCUSSION
Although construction of the models is straight- forward their translation into practical form has posed difficulties. A major weakness in this trans- lation is the assumed shape of the net energy gain curve, and hence the energy maximizer prey profile. I assumed that large prey were energetically more valuable than small ones but could find no empirical evidence relevant to this supposition. However, Schoener (1969) has examined the relationship be- tween the energy value of prey and prey size in a theoretical manner, taking into account pursuit and search costs for the predator, metabolic rates, prey energy values, etc. His net energy gain curves varied from being skewed to the right to being strongly skewed to the left, the latter supporting my assumption. He found that skewness changed from right to left as predator size increased, as pursuit cost decreased, and as the cost of handling and swallowing prey increased. Hence, in at least some situations, my assumed shape of curve is reasonable.
A great many factors affect the availability of prey to predators. In this paper I have assumed
Late Summer 1975 PREY AVAILABILITY AND PREDATOR'S FOOD 1213
that for most predators only prey size and prey abundance are good measures of this actual avail- ability. This assumption is incorrect in at least some instances. For example, Ware (1973) has shown that Salmo gairdneri is sensitive to prey activity and accessibility, both of which modify prey abundance to the predator. One would expect more sophis- ticated predators to use more information in assess- ing prey availability and hence the models should become progressively less successful predictors of the food as more sophisticated predators are examined.
These results support the notion that the only differences between species to which predators re- spond are body size differences. However there are situations, particularly terrestrial ones, in which predators do seem to respond to species characteris- tics other than body size. For example, there are a number of species which seem to be almost exclu- sively ant eaters. Much more, quantitative, informa- tion is required before the importance of such predators can be determined.
It is easy to imagine the feeding behavior of a number maximizer; it simply catches its prey as they are encountered. An energy maximizer strategy, however, requires integration of information about the number of organisms and their size, the mecha- nism of which it is far from easy to visualize. Since community profiles can change over relatively short time periods it would seem likely that predators feeding in this manner must possess sufficiently com- plex neural apparatus to learn and have life styles in which time for learning is available. If this reason- ing is correct one would expect to find that many invertebrates and larval vertebrates are number maximizers while many adult vertebrates are energy maximizers. In highly unstable situations in which the community profile changes rapidly one is more likely to find number maximizers. Sit-and-wait predators, such as the chamaeleon, are also likely to be number maximizers. These expectations are partially realized. The invertebrates and larval verte- brates listed in Table 1 all feed as number maxi- mizers while some of the fish, the lizard and the birds are energy maximizers. The feeding strategy of yellow perch changes with growth, the larvae feeding as number maximizers and the adults as energy maximizers.
A number of authors (e.g., Emlen 1966, Mac- Arthur and Pianka 1966, Schoener 1969, 1971, Pulliam 1974) have presented models of optimal diet for predators. The models presented here are models of diet, but the derivation of the PSR from the gut contents is one reason why they cannot be claimed to be models of optimal diet. These latter, theo- retical models are more rigorous than mine but the difficulty of measuring many of the parameters re-
quired for their predictions is a disadvantage. Most of the readily testable predictions of the optimal diet models are concerned with differences in diet. Because of these differences in approach and appli- cation of the models I restrict my discussion to only one aspect. All theories of optimal diet suggest that when prey are scarce a predator should take items proportional to their abundance in the environment, i.e., feed as number maximizers; at higher prey den- sities an energy maximizer feeding strategy is favored. I found that invertebrates and larval vertebrates fed exclusively as number maximizers while adult verte- brates fed in both ways. If my argument about learning is correct this would suggest that inverte- brates/larval vertebrates must feed as number maxi- mizers (in many cases suboptimally) while adult vertebrates can adopt either strategy depending on prey abundance. Only Goss-Custard's (1969) data on the food of the Redshank is suitable to test this latter point directly. Unfortunately, while many of the correlations between food and prey profiles are quite good some are nonexistent and there is no indication of a trend from one feeding strategy to another as prey density increases. There are in- sufficient data to indicate whether or not poor food conditions existed for those adult vertebrates that fed as number maximizers. In a number of instances, as mentioned earlier, there is little difference be- tween the prey profiles for either strategy. While it is possible that the many assumptions made are responsible for the similarity of the profiles it is also possible that these results represent situations in which the two feeding strategies are equivalent, i.e., situations where prey are scarce according to the optimal diet models. However, if this were the case one would expect the prey profiles for Alestes to be much closer in value (since this fish feeds as a number maximizer).
ACKNOWLEDGMENTS
This paper has benefited greatly from criticisms by H. S. Horn, W. G. Sprules and the reviewers. M. G. Galbraith and J. E. Shelbourne kindly allowed me to use some of their unpublished data. C. J. Curry made valiant attempts at translating the paper into English.
LITERATURE CITED
Allen, K. R. 1941. Studies on the biology of the early stages of the salmon (Salmo salar) 2. Feeding habits. J. Anim. Ecol. 10:47-76.
Bryant, D. M. 1973. The factors influencing the se- lection of food by the house martin (Delichon urbica (L.)). J. Anim. Ecol. 42:539-564.
Burns, C. W. 1969a. Particle size and sedimentation in the feeding behaviour of two species of Daphnia. Limnol. Oceanogr. 14:392-402.
1969b. Relation between filtering rate, tem- perature, and body size in four species of Daplhnia. Limnol. Oceanogr. 14:693-700.
1214 DAVID GRIFFITHS Ecology, Vol. 56, No. 5
Cummins, K. W. 1973. Trophic relations of aquatic insects. Annu. Rev. Entomol. 18:183-206.
Drinnan, R. E. 1957. The winter feeding of the Oystercatcher (Haematopus ostralegus) on the edible cockle (Cardiuni edule). J. Anim. Ecol. 26:441-469.
Emlen, J. M. 1966. The role of time and energy in food preference. Am. Nat. 100:611-617.
Galbraith, M. G. 1967. Size selective predation on Daplhnia by rainbow trout and yellow perch. Trans. Am. Fish. Soc. 96:1-10.
Gerking, S. D. 1962. Production and food utilization in a population of bluegill sunfish. Ecol. Monogr. 32:3 1-78.
Gibb, J. A., and M. M. Betts. 1963. Food and food supply of nesting tits (Paridae) in breckland pine. J. Anim. Ecol. 32:489-533.
Glue, D. E. 1967. Prey taken by the Barn Owl in England and Wales. Bird Study 14:169-183.
Goss-Custard, J. D. 1969. The winter feeding ecology of the Redshank Tringa totanus. Ibis 111:338-356.
Gotshall, D. W. 1969. The use of predator food habits in estimating relative abundance of the ocean shrimp Pand,alus jordani Rathbun. F.A.O. Fish. Rep. 57: 667-685.
Griffiths, D. 1973. The food of animals in an acid moorland pond. J. Anim. Ecol. 42:285-293.
Hamilton, W. J. 1940. The feeding habits of larval newts with reference to availability and predilection of food items. Ecology 21:351-356.
Hess, A. D., and A. Swartz. 1940. The forage ratio and its use in determining the food grade of streams, p. 162-164. In Trans. 5th N. Am. Wildl. Conf.
Hoag, S. H. 1972. The relationship between the sum- mer food of juvenile sockeye salmon, Oncorl7ynclius nlerka, and the standing crop of zooplankton in Iliamna Lake, Alaska. Fish. Bull. 70:355-362.
Klemetsen, A. 1973. Pelagic, plankton eating perch. Astarte 6:27-33.
Lauzanne, L. 1970. La s6lection des proies chez Alestes bareinioze (Pisc., Charac.). Cah. O.R.S.T.O.M. S6r. Hydrobiol. 4:71-76.
MacArthur, R. H., and E. R. Pianka. 1966. On optimal use of a patchy environment. Am. Nat. 100:603-609.
Metz, J. P. 1974. Die invertebratendrift an der ober- flhche eines voralpenflusses und ihre selective ausnut- zung durch die regenbogenforellen (Salmo gairdneri). Oecologia 14:247-267.
Moore, J. W., and F. W. H. Beamish. 1973. Food of larval sea lamprey (Petromnyzon iniarinus) and Amer- ican brook lamprey (Lainpetra lamnzottei). J. Fish. Res. Board Can. 30:7-15.
Neill, R. M. 1938. The food and feeding of the brown trout (Salmo trutta L.) in relation to the organic environment. Trans. R. Soc. Edinb. 59: 481-520.
Parsons, T. R., and R. J. LeBrasseur. 1970. The availability of food to different trophic levels, p. 325-343. In J. H. Steele [ed.] Marine food chains. Oliver & Boyd, Edinburgh.
Prater, A. J. 1972. The ecology of Morecambe Bay. IV. The food and feeding habits of the knot (Calidris caniutus L.) in Morecambe Bay. J. Appl. Ecol. 9: 179-194.
Pulliam, H. R. 1974. On the theory of optimal diets. Am. Nat. 108:59-74.
Root, R. B. 1967. The niche exploitation pattern of the blue-gray gnatcatcher. Ecol. Monogr. 37:317- 350.
Schoener, T. W. 1969. Models of optimal size for solitary predators. Am. Nat. 103:277-313.
1971. Theory of feeding strategies. Annu. Rev. Ecol. Syst. 2:369-404.
Schoener, T. W., and D. H. Janzen. 1968. Notes on the environmental determinants of tropical versus temperate insect size patterns. Am. Nat. 102:207- 224.
Schnack, D. 1972. Nahrungsokologische untersuchun- gen an heringslarven. Ber. Dtsch. Wiss. Komm. Meeresforsch. 22:273-343.
Sexton, 0. J., J. Bauman, and E. Ortleb. 1972. Sea- sonal food habits of A nolis limlifl rons. Ecology 53: 182-186.
Shelbourne, J. E. 1962. A predator-prey size relation- ship for plaice larvae feeding on Oikopleura. J. Mar. Biol. Assoc. U.K. 42:243-252.
Sokal, R. R., and F. J. Rohlf. 1969. Biometry. W. H. Freeman, San Francisco.
Ware, D. M. 1973. Risk of epibenthic prey to preda- tion by rainbow trout (Salmno gairdneri). J. Fish. Res. Board Can. 30:787-797.
Warshaw, S. J. 1972. Effects of alewives (Alosa pseudoliarengus) on the zooplankton of Lake Wonon- skopomuc, Connecticut. Limnol. Oceanogr. 17:816- 825.
Whittaker, R. H. 1952. A study of summer foliage insect communities in the Great Smoky Mountains. Ecol. Monogr. 22:1-44.
Wilson, D. S. 1973. Food size selection among cope- pods. Ecology 54:909-914.
Wong, B., and F. J. Ward. 1972. Size selection of Daplilnia pulicaria by yellow perch (Perca flav escenzs) fry in West Blue Lake, Manitoba. J. Fish. Res. Board Can. 29:1761-1764.