88
10 października 2014 Wojciech Kucewicz 1 LabView Some pictures and slides from LabVIEW Introduction Course

10 października 2014 Wojciech Kucewicz 1
LabView
Some pictures and slides from LabVIEW Introduction Course
10 października 2014 Wojciech Kucewicz 2
Temperature System

10 października 2014 Wojciech Kucewicz 3
System do pomiaru temperatury

10 października 2014 Wojciech Kucewicz 4
System do pomiaru temperatury

10 października 2014 Wojciech Kucewicz 5
Arrays

6
• Collection of data elements that are of same type • One or more dimensions, up to 231 elements per dimension • Elements accessed by their index; first element is index 0
index 10-element array 1.2 3.2 8.2 8.0 4.8 5.1 6.0 1.0 2.5 1.7
0 1 2 3 4 5 6 7 8 9
2D array
Five row by seven column array of 35 elements
0 1 2 3 4 5 6 0 1 2 3 4
Arrays
10 października 2014 Wojciech Kucewicz

7
Add Dimension for 2D arrays
1. Select the Array shell from the Controls palette
2. Place data object inside shell
Array Controls and Indicators
10 października 2014 Wojciech Kucewicz

8
1. Select Array Constant shell from the Array subpalette
2. Place the data object in the array shell
Creating Array Constants
10 października 2014 Wojciech Kucewicz

9
• Loops can accumulate arrays at their boundaries with auto-indexing
• For Loops auto-index by default
• While Loops output the final value by default
• Right-click on tunnel and enable/disable auto-indexing
Auto-Indexing Wire becomes thicker
Wire remains the same size
Auto-Indexing Disabled
Only one value (last iteration) is passed out of the loop
1D Array
0 1 2 3 4 5
10 października 2014 Wojciech Kucewicz
10
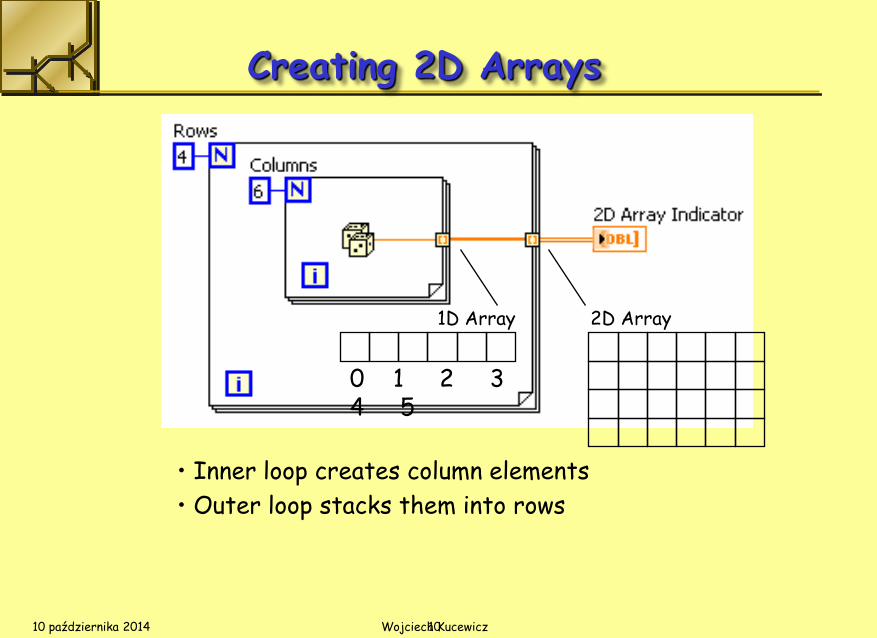
• Inner loop creates column elements
• Outer loop stacks them into rows
Creating 2D Arrays
1D Array
0 1 2 3 4 5
2D Array
10 października 2014 Wojciech Kucewicz

11
Auto-Index Input
1. An array input can be used to set the For Loop count terminal
2. Number of elements in the array equals the count terminal input
3. Run arrow not broken
10 października 2014 Wojciech Kucewicz

12
Temperature symulation
10 października 2014 Wojciech Kucewicz
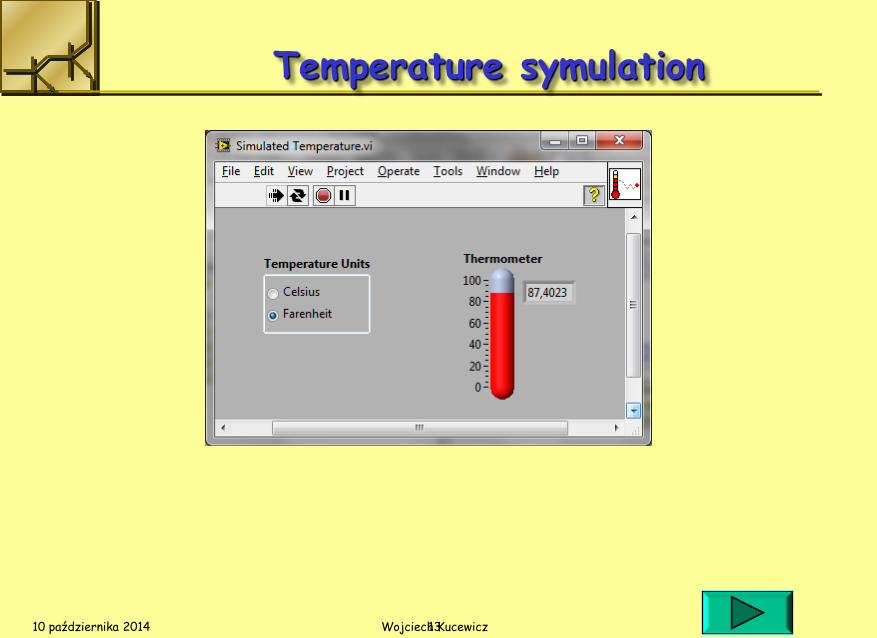
One simulated temperature data value is generated for each call to this subVI. Simulated data repeats in cycles of 100.
13
Temperature symulation
10 października 2014 Wojciech Kucewicz

14
Array Size
Initialize Array
Common Array Functions
10 października 2014 Wojciech Kucewicz

15
Array Subset
Common Array Functions
10 października 2014 Wojciech Kucewicz

16
The Build Array Function
Building a higher dimension array
Concatenate Inputs
Appending an element
default
10 października 2014 Wojciech Kucewicz

17
The Index Array Function
Extracting an Element
Extracting an Element of a Row
Extracting a Row
10 października 2014 Wojciech Kucewicz

18
Function inputs can be of different types All LabVIEW arithmetic functions are polymorphic
Scalar + Scalar
Array + Scalar
Combination Result
Scalar
Array
Array
Array + Array
Array + Array
Array
Polymorphism
10 października 2014 Wojciech Kucewicz
19
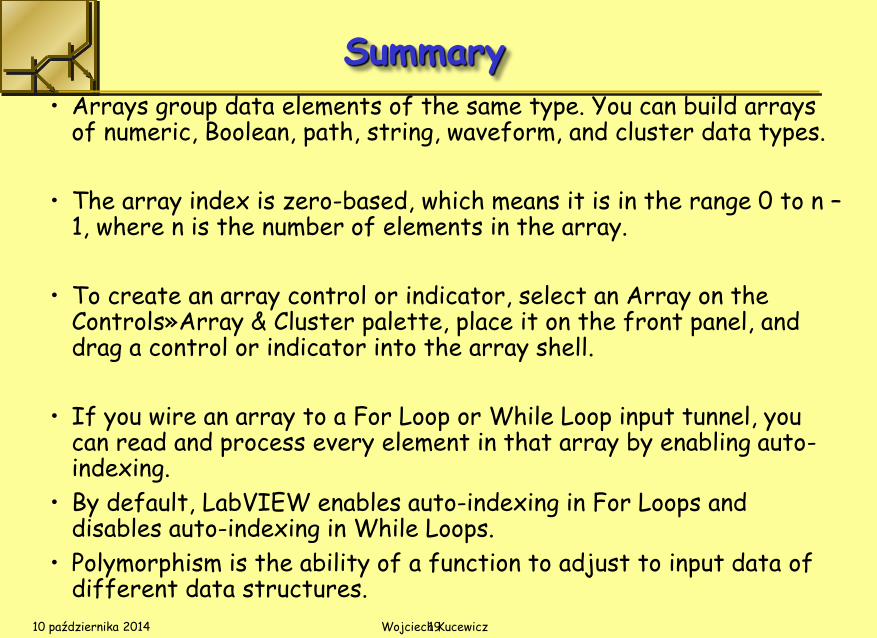
• Arrays group data elements of the same type. You can build arrays of numeric, Boolean, path, string, waveform, and cluster data types.
• The array index is zero-based, which means it is in the range 0 to n – 1, where n is the number of elements in the array.
• To create an array control or indicator, select an Array on the Controls»Array & Cluster palette, place it on the front panel, and drag a control or indicator into the array shell.
• If you wire an array to a For Loop or While Loop input tunnel, you can read and process every element in that array by enabling auto-indexing.
• By default, LabVIEW enables auto-indexing in For Loops and disables auto-indexing in While Loops.
• Polymorphism is the ability of a function to adjust to input data of different data structures.
Summary
10 października 2014 Wojciech Kucewicz

10 października 2014 Wojciech Kucewicz 20
Write to File
21
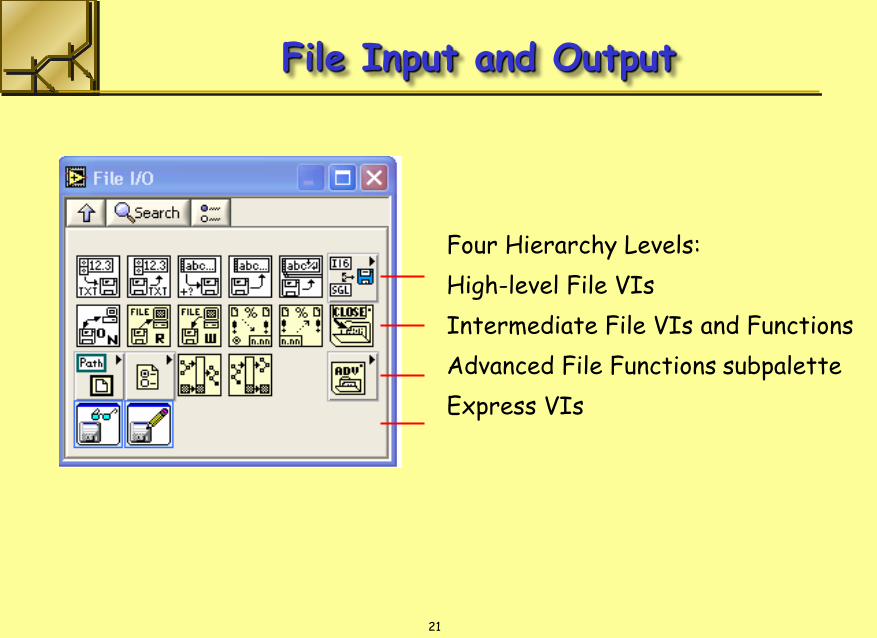
File Input and Output
Four Hierarchy Levels:
High-level File VIs
Intermediate File VIs and Functions
Advanced File Functions subpalette
Express VIs
22
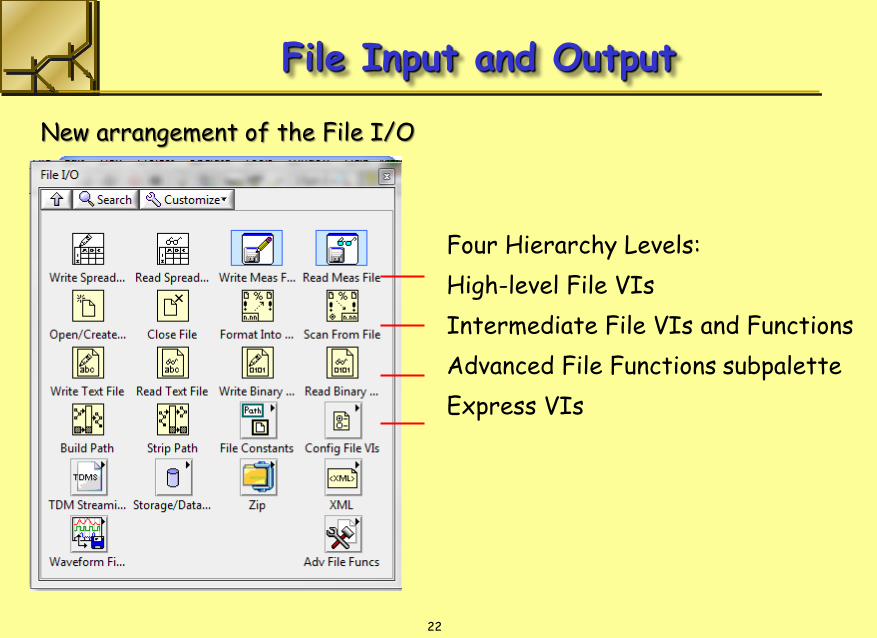
File Input and Output
Four Hierarchy Levels:
High-level File VIs
Intermediate File VIs and Functions
Advanced File Functions subpalette
Express VIs
New arrangement of the File I/O

23
The high-level VIs handle all lower level functions transparently and
provide a simplified means of error handling:
Write to Spreadsheet File
Read from Spreadsheet File
Write Characters to File
Read Characters from File
Read Lines from File
High-level File I/O VIs

24
Intermediate File VIs and Functions
Open/ Create/ Replace File
Read and/or Write to File
Close File
Check for Errors

25
Write data to File
Open/Create/Replace opens the existing file TEST1.DAT and generates refnum and error cluster Write File writes the data Close File closes the file Simple Error Handler checks for errors

26
Reading Data from a File
Open/Create/Replace opens the file
Read File reads the specified number of bytes from the file
Close File closes the file
Simple Error Handler checks for errors

10 października 2014 Wojciech Kucewicz 27
Write data to file
Generate data. Format into string. Write to file.

10 października 2014 Wojciech Kucewicz 28
Write data to file
Generate data. Format into string. Write to file.
29
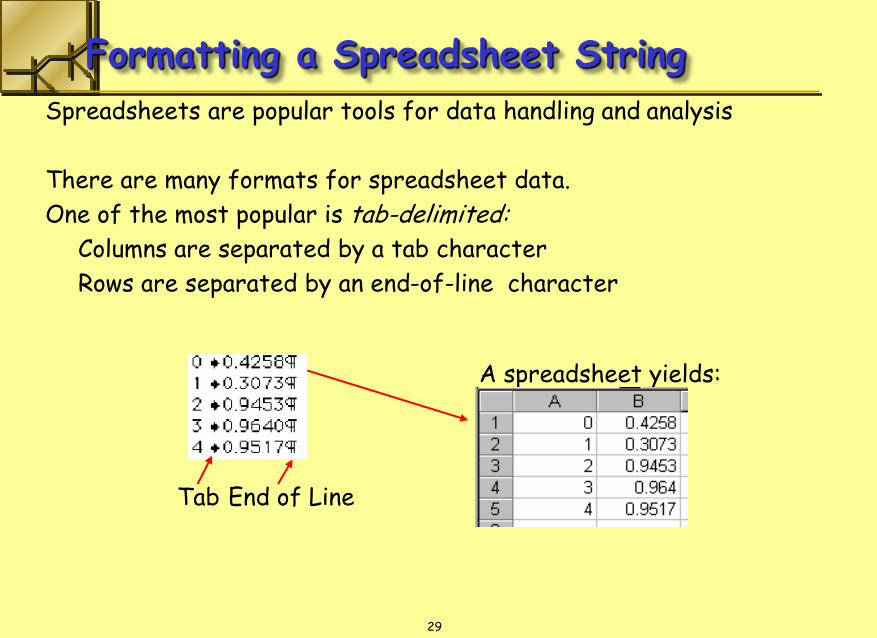
Formatting a Spreadsheet String
Spreadsheets are popular tools for data handling and analysis
There are many formats for spreadsheet data.
One of the most popular is tab-delimited:
Columns are separated by a tab character
Rows are separated by an end-of-line character
Tab End of Line
A spreadsheet yields:

30
Creating a Spreadsheet File
Can replace Format Into String and Write File with Format Into File in above example

31
Write LabVIEW Measurement File Includes the open, write, close and error handling functions
Handles formatting the string with either a tab or comma delimite
r
Merge Signals function is used to combine data into the dynamic data type

32
Use the File I/O VIs and functions located on the Functions»File I/O palette to handle all aspects of file I/O.
When writing to a file, you open, create, or replace a file, write the data, and close the file. Similarly, when you read from a file, you open an existing file, read the data, and close the file.
To access a file through a dialog box, do not wire file path in the Open/Create/Replace File VI.
To write data to a spreadsheet file, you must format the string as a spreadsheet string, which is a string that includes delimiters, such as tabs. Use the Format Into File function to format string, numeric, path, and Boolean data as text and write the text to a file
Summary, cont.

10 października 2014 Wojciech Kucewicz 33
Comunicating with instrument
10 października 2014 Wojciech Kucewicz 34
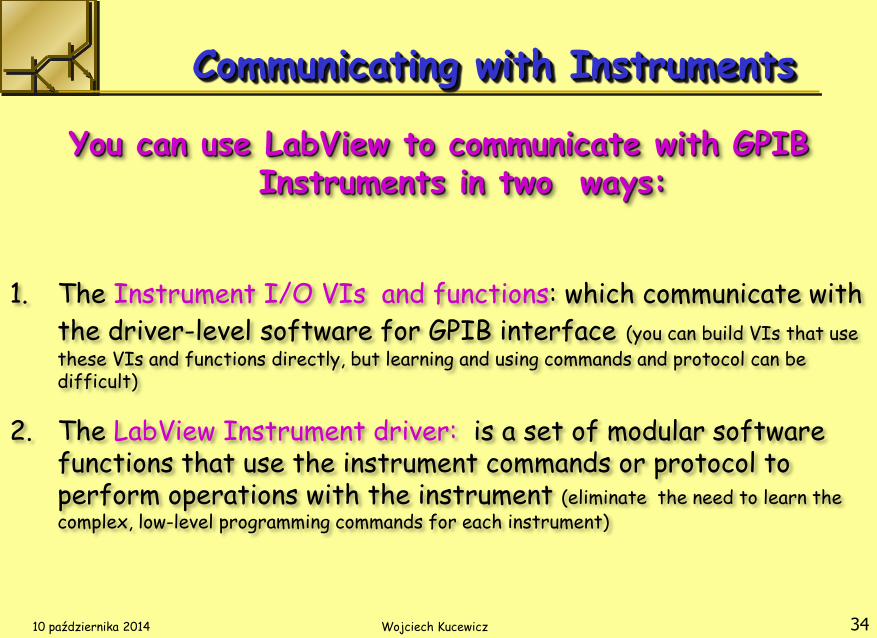
Communicating with Instruments
You can use LabView to communicate with GPIB Instruments in two ways:
1. The Instrument I/O VIs and functions: which communicate with
the driver-level software for GPIB interface (you can build VIs that use
these VIs and functions directly, but learning and using commands and protocol can be difficult)
2. The LabView Instrument driver: is a set of modular software functions that use the instrument commands or protocol to perform operations with the instrument (eliminate the need to learn the complex, low-level programming commands for each instrument)
10 października 2014 Wojciech Kucewicz 35
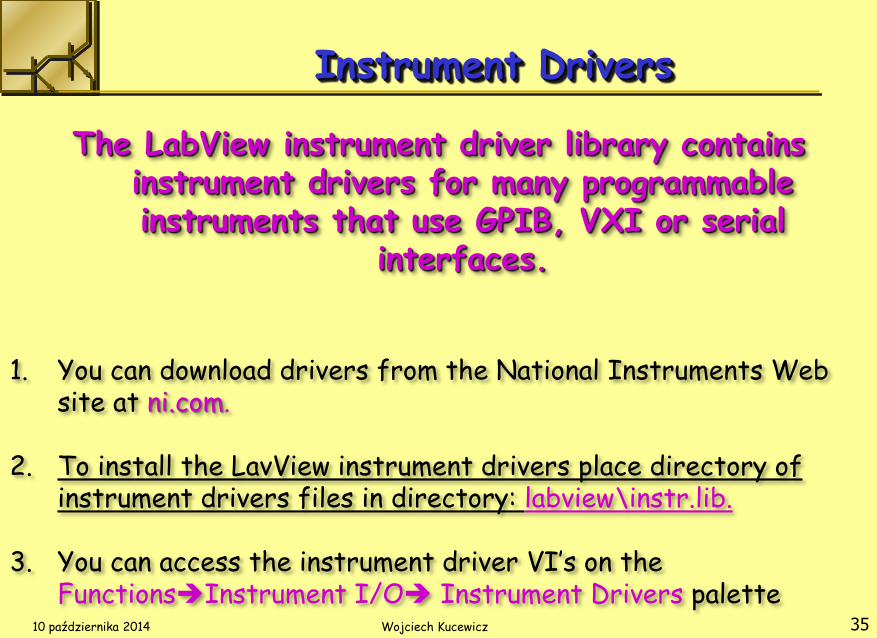
Instrument Drivers
The LabView instrument driver library contains instrument drivers for many programmable instruments that use GPIB, VXI or serial
interfaces.
1. You can download drivers from the National Instruments Web site at ni.com.
2. To install the LavView instrument drivers place directory of instrument drivers files in directory: labview\instr.lib.
3. You can access the instrument driver VI’s on the FunctionsInstrument I/O Instrument Drivers palette

10 października 2014 Wojciech Kucewicz 36
Instrument Drivers

10 października 2014 Wojciech Kucewicz 37
Instrument Drivers for K2001

10 października 2014 Wojciech Kucewicz 38
String to Number Convert string read from multimeter into number. The number you can display using waveform chart
Substitute „.” with „,”
10 października 2014 Wojciech Kucewicz 39
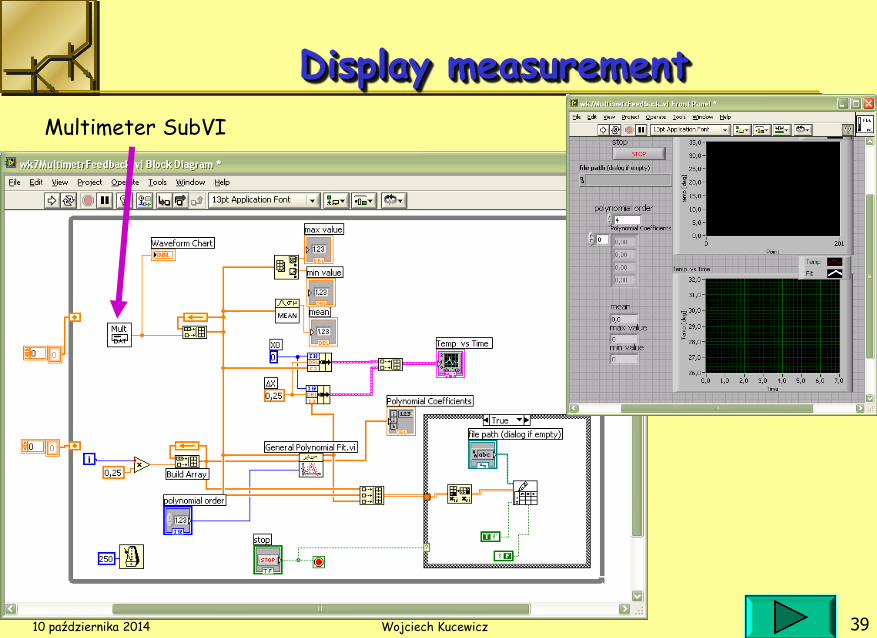
Display measurement
Multimeter SubVI

10 października 2014 Wojciech Kucewicz 40
Display options

41
Waveform Charts
Selected from the Controls»Graphs and Charts palette

42
Wiring to Charts
Single-Plot Chart Multiple-Plot Chart

43
Modifying Chart Properties
• Change the appearance
•
• Set the format and precision of the axis
• Choose the plot type
• Edit the scales
• Document the chart

10 października 2014 Wojciech Kucewicz 44
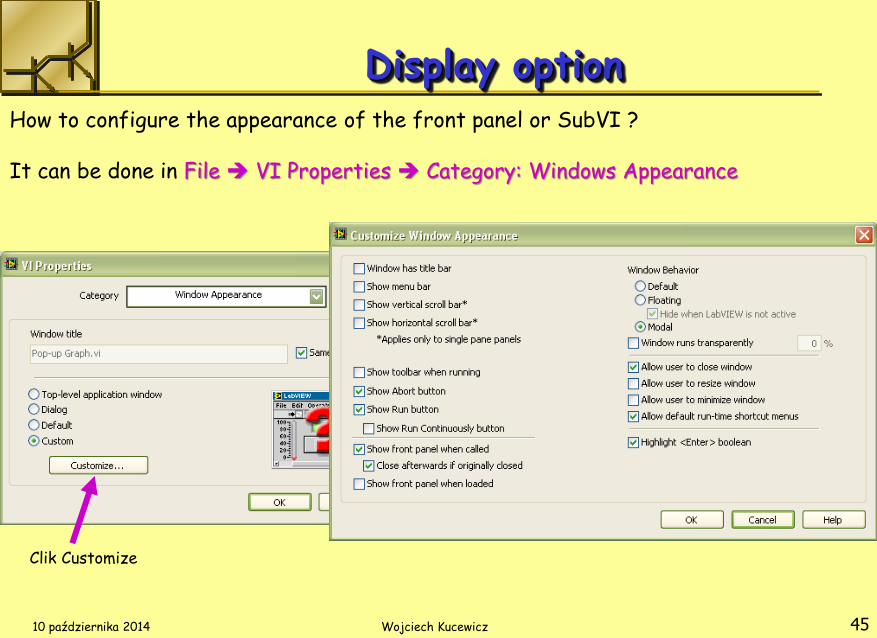
Display option How to configure the appearance of the front panel or SubVI ? It can be done in File VI Properties Category: Windows Appearance
10 października 2014 Wojciech Kucewicz 45
Display option How to configure the appearance of the front panel or SubVI ? It can be done in File VI Properties Category: Windows Appearance
Clik Customize

10 października 2014 Wojciech Kucewicz 46
Display option Example: Read 20x temperature every 0,5 s and display SubVI with Graph

10 października 2014 Wojciech Kucewicz 47
Display option Run different SubVI by pressing buton or key:
The front panel configuration is defined in the File VI properties Windows Appearance
By pressing buttons call different SubVI
10 października 2014 Wojciech Kucewicz 48
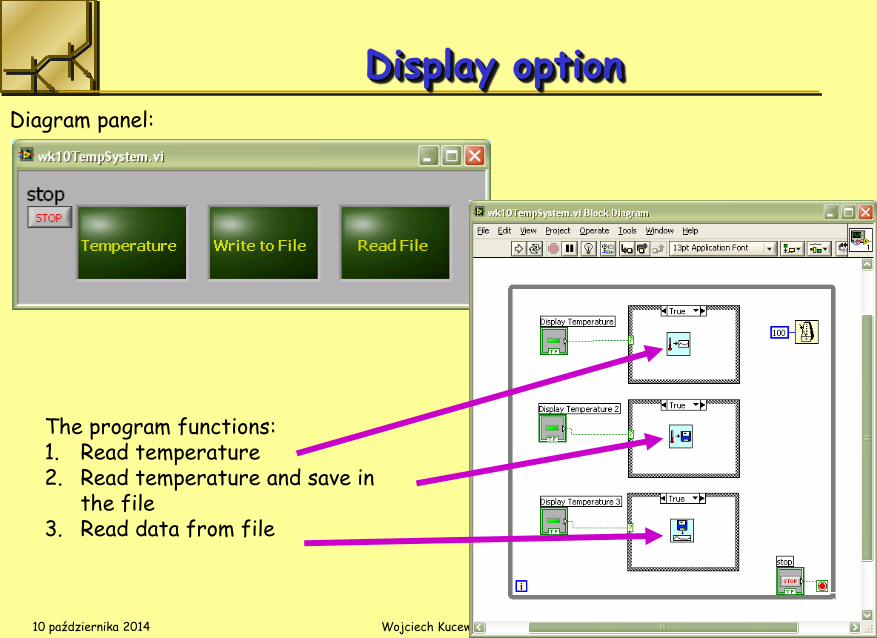
Display option Diagram panel:
The program functions: 1. Read temperature 2. Read temperature and save in
the file 3. Read data from file

10 października 2014 Wojciech Kucewicz 49
Display option Diagram panel:

50
Customizing Charts and Graphs
Right-click and select Visible Items to view the following items:
1. Plot Legend
2. Digital Display
3. Scrollbar
4. X and Y Scale
5. Graph Palette
6. Scale Legend
Graph Palette
Scale Legend
Zoom Subpalette

51
• Selected from the Graph subpalette • Waveform Graph – Plot an array of numbers against their indices • XY Graph – Plot one array against another
Plot Legend (point and line styles)
Graph Palette Scale Legend
Graphs

52
Uniform X axis Initial X = 0.0 Delta X = 1.0
Uniform X axis you specify point spacing
Single-Plot Waveform Graphs
53
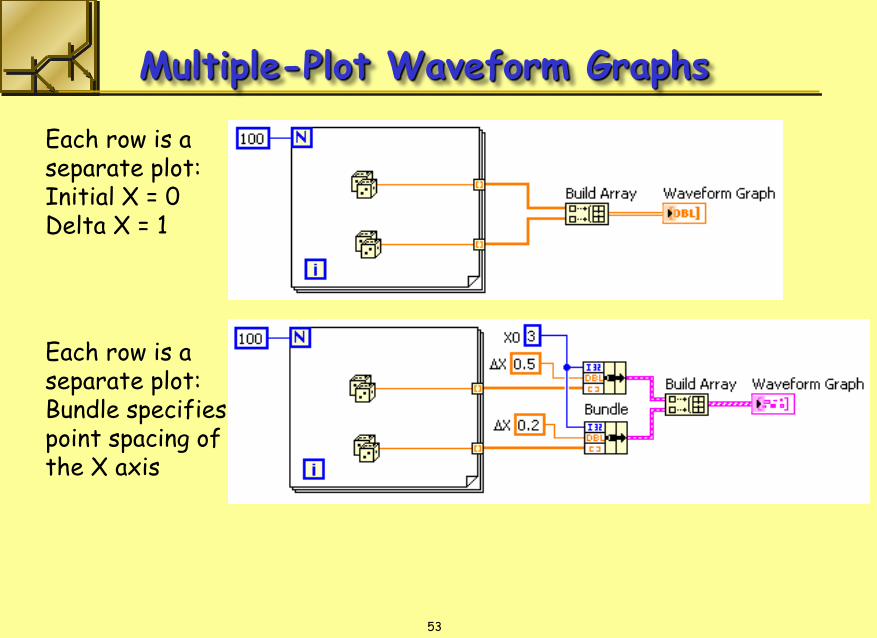
Multiple-Plot Waveform Graphs
Each row is a separate plot: Initial X = 0 Delta X = 1
Each row is a separate plot: Bundle specifies point spacing of the X axis

54
• Non-uniform X axis
• Separate X and Y arrays define data points
XY Graphs
55
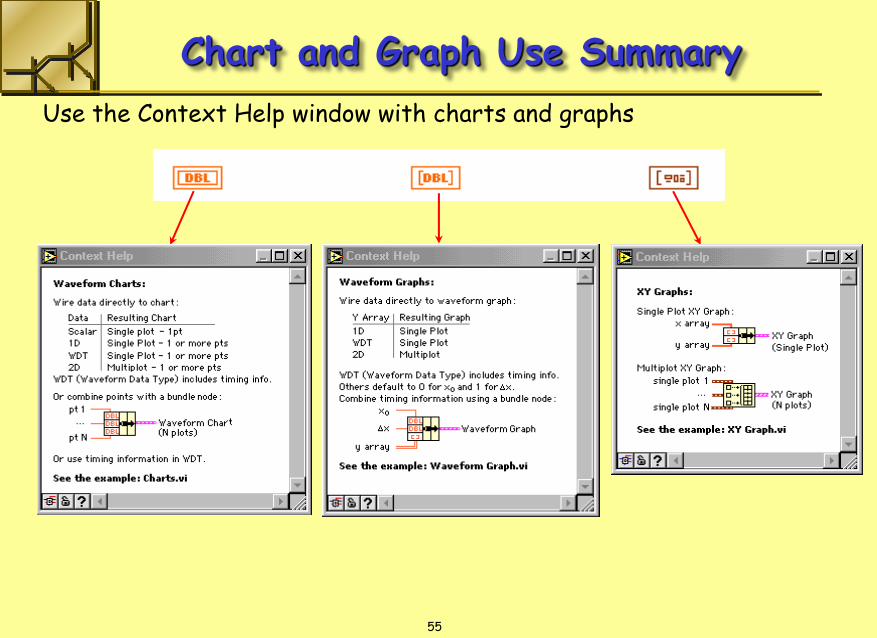
Chart and Graph Use Summary
Use the Context Help window with charts and graphs

56
Intensity Plots and Graphs
Useful in displaying terrain, temperature patterns, spectrum analysis, and image processing
Data type is a 2D array of numbers; each number represents a color
Use these options to set and display color mapping scheme
Cursor also adds a third dimension

10 października 2014 Wojciech Kucewicz 57
Display option – Tab Control
Tab Control offers a convenient way to group front panel objects together. You can create Tab Control by selecting Controls Containers Tab Control is wired directly to a Case Structure and the page name correspons to the case.

10 października 2014 Wojciech Kucewicz 58
Display option – Tab Control
Tab Control offers a convenient way to group front panel objects together. You can create Tab Control by selecting Controls Containers Tab Control is wires directly to a Case Structure and the page name correspons to the case.

59
The waveform chart is a special numeric indicator that displays one or more plots. The waveform chart has the following three update modes:
1. A strip chart shows running data continuously scrolling from left to right across the chart.
2. A scope chart shows one item of data, such as a pulse or wave, scrolling partway across the chart from left to the right.
3. A sweep works similarly to a scope except it shows the old data on the right and the new data on the left separated by a vertical line.
Waveform graphs and XY graphs display data from arrays.
Right-click a waveform chart or graph or its components to set attributes of the chart and its plots.
Summary
60
You can display more than one plot on a graph using the Build Array function and the Bundle function for charts and XY graphs. The graph becomes a multiplot graph when you wire the array of outputs to the terminal.
When you wire data to charts and graphs, use the Context Help window to determine how to wire them.
You can use intensity charts and graphs to plot three-dimensional data. The third dimension is represented by different colors corresponding to a color mapping that you define. Intensity charts and graphs are commonly used in conjunction with spectrum analysis, temperature display, and image processing.
Summary, cont.

10 października 2014 Wojciech Kucewicz 61
Property node

10 października 2014 Wojciech Kucewicz 62
Property Nodes Property Nodes in LabView are very powerful and have many uses. You can create Property Nodes by selecting Create Property Node It creates a new node with the same name as object. Property Node has one terminal: for reading or writing property.

10 października 2014 Wojciech Kucewicz 63
Property Nodes
10 października 2014 Wojciech Kucewicz 64
Cluster

65
Clusters
1. Data structure that groups data together
2. Data may be of different types
3. Analogous to struct in C or a record in Pascal
4. Elements must be either all controls or all indicators
5. Thought of as wires bundled into a cable
66
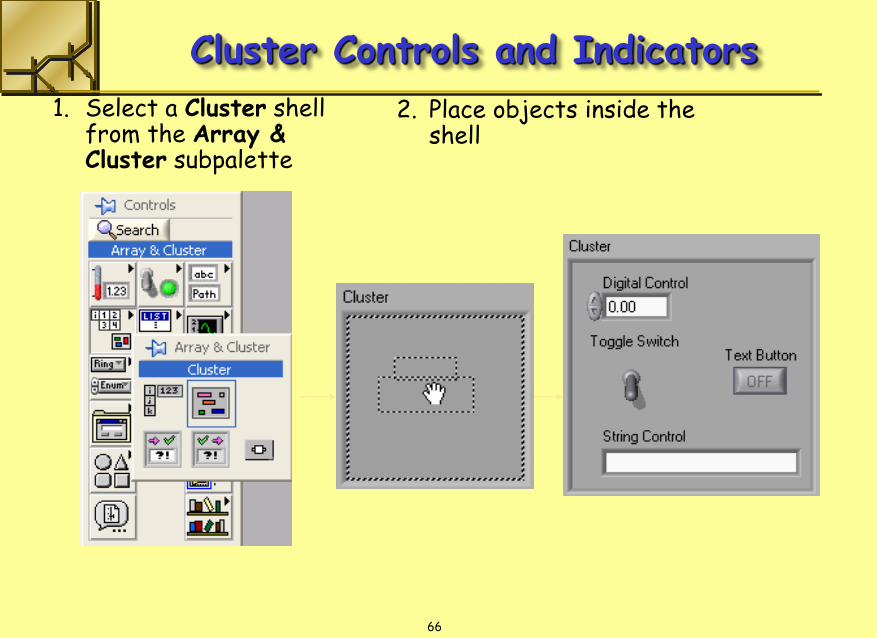
1. Select a Cluster shell from the Array & Cluster subpalette
Cluster Controls and Indicators
2. Place objects inside the shell
67
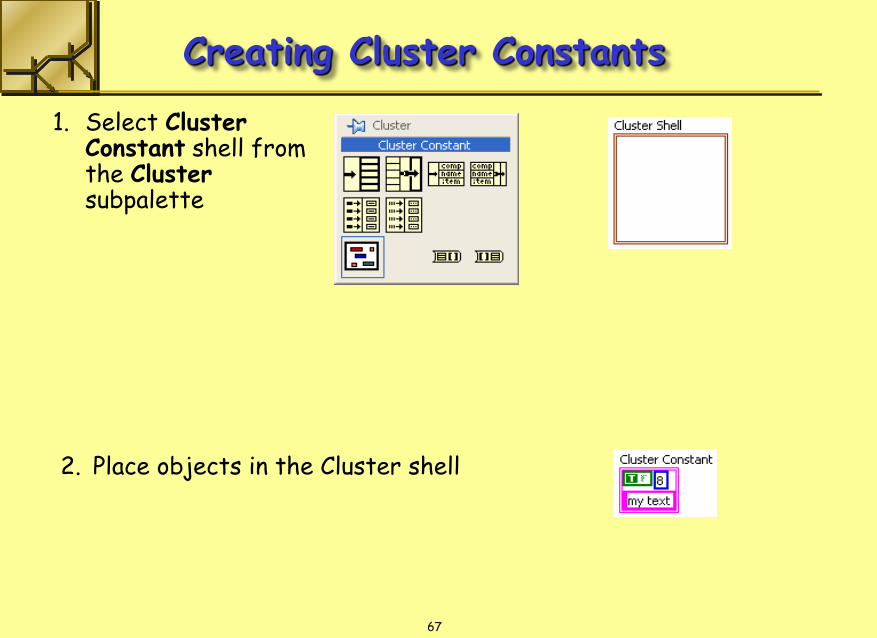
Creating Cluster Constants
1. Select Cluster Constant shell from the Cluster subpalette
2. Place objects in the Cluster shell

10 października 2014 Wojciech Kucewicz 68
Cluster

69
Cluster Order
1. Elements have a logical order (start with 0) 2. To change order, right-click the border and select
Reorder Controls in Cluster...
70
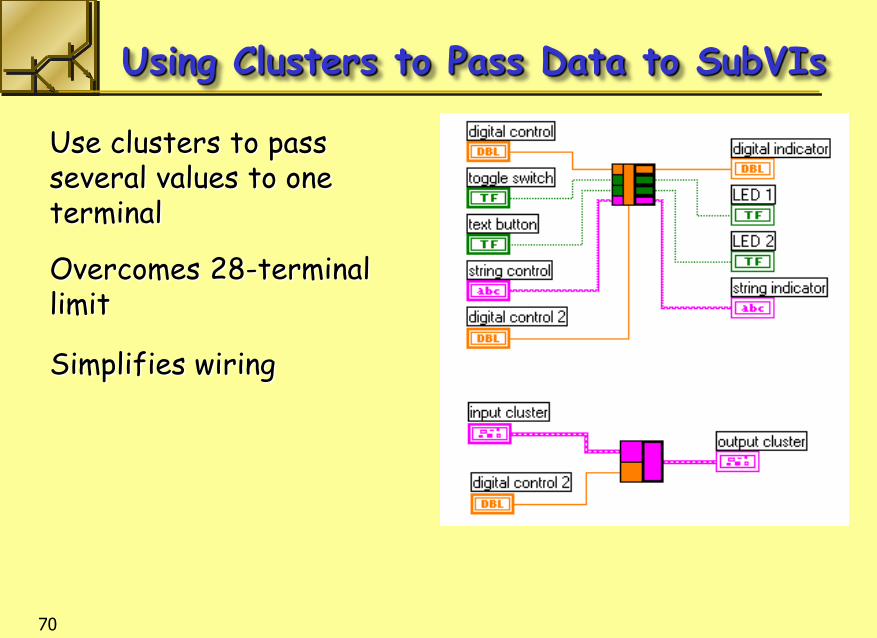
Using Clusters to Pass Data to SubVIs
Use clusters to pass several values to one terminal
Overcomes 28-terminal limit
Simplifies wiring
71
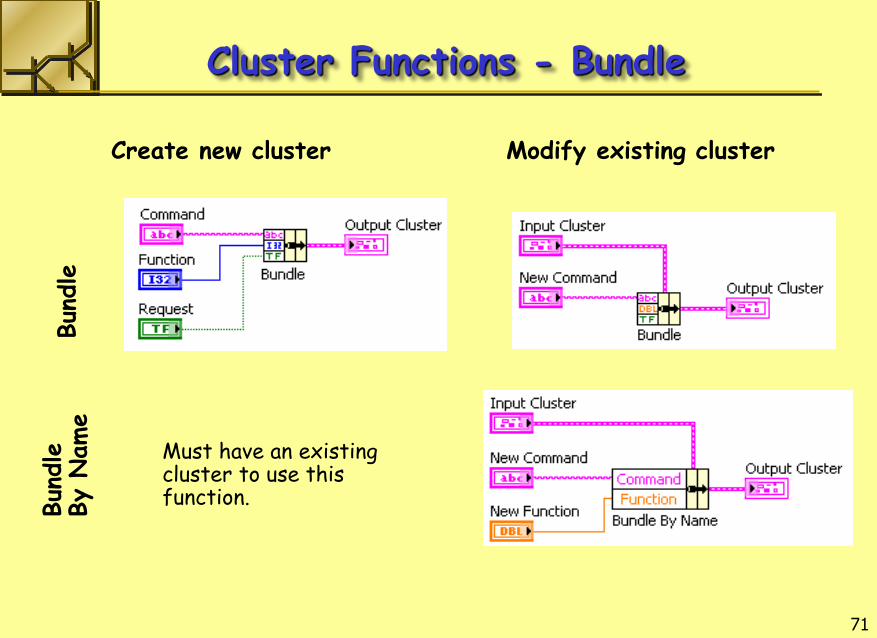
Cluster Functions - Bundle Bun
dle
Bun
dle
By N
ame
Create new cluster Modify existing cluster
Must have an existing cluster to use this function.
72
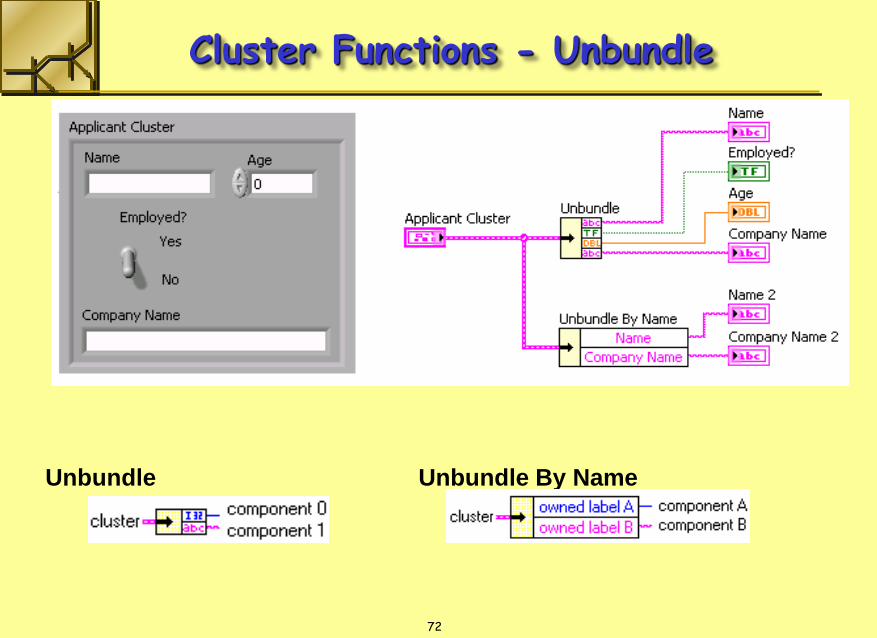
Cluster Functions - Unbundle
Unbundle Unbundle By Name

73
Error Cluster
Use the error in and error out clusters in each VI you use or build to handle errors in the VI.
The error clusters located on the Controls»Array & Cluster palette include the components of information shown

74
Error Cluster Details
1. Status is a Boolean value that reports TRUE if an error occurred. Most VIs, functions, and structures that accept Boolean data also recognize this parameter.
2. Code is a signed 32-bit integer that identifies the error numerically. A non-zero error code coupled with a status of FALSE signals a warning rather than a fatal error.
3. Source is a string that identifies where the error occurred.

75
Error Handling with Clusters
1. LabVIEW does not handle errors automatically. In LabVIEW, you can make these error handling decisions on the block diagram of the VI.
2. Error handling in LabVIEW follows the dataflow model. Just as data flow through a VI, so can error information.
3. Wire the error information from the beginning of the VI to the end.
Error Cluster

76
Simple Error Handler
Use the Simple Error Handler to handle the error at the end of the execution flow. The Simple Error Handler is located on the Functions»All Functions»Time and Dialog palette. Wire the error cluster to the Error In (no error) input.

77
Using While Loops for Error Handling
You can wire an error cluster to the conditional terminal of a While Loop to stop the iteration of the While Loop.
Only the TRUE or FALSE value of the status parameter of the error cluster is passed to the terminal.
When an error occurs, the While Loop stops.

78
• Clusters group data elements of mixed types. A cluster cannot contain a mixture of controls and indicators.
• To create a cluster control or indicator, select a cluster on the Controls»Array & Cluster palette, place it on the front panel, and drag controls or indicators into the cluster shell.
• Use the Cluster functions located on the Functions»All Functions»Cluster palette to create and manipulate clusters.
• Error checking tells you why and where errors occur.
• The error cluster reports the status, code and source of the error.
• Use the error cluster controls and indicators to create error inputs and outputs in subVIs.
Summary

79
String

80
A string is a sequence of displayable or - characters (ASCII) Many uses — displaying messages, instrument control, file I/O String control/indicator is in the Controls»String subpalette
Strings

81
String Display Modes
Normal display Password display
\ code display Hex display

82
Concatenate Strings (spaces here)
String Length
String Functions

83
String Functions
String Subset
Match Pattern

84
Converting Numerics to Strings: Build String

85
Converting Strings to Numerics: Scan From String
86
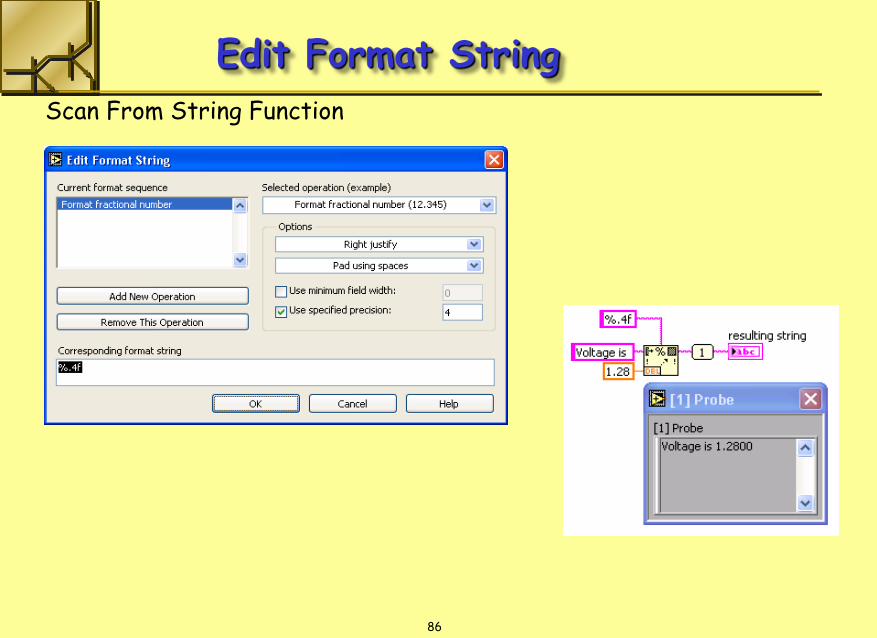
Edit Format String
Scan From String Function
87
Strings group sequences of ASCII characters. Use the string control and indicator located on the Controls»String & Path palette to simulate text entry boxes and labels.
Use the String functions located on the Functions»String palette to edit and manipulate strings on the block diagram.
Use the Format Into String function and the Build String Express VI to convert a numeric to a string.
Use the Scan From String function to convert a string to a numeric.
Right-click the Format Into String or Scan From String function and select Edit Format String or Edit Scan String from the shortcut menu to create or edit a format string.
Summary

88
Use the File I/O VIs and functions located on the Functions»File I/O palette to handle all aspects of file I/O.
When writing to a file, you open, create, or replace a file, write the data, and close the file. Similarly, when you read from a file, you open an existing file, read the data, and close the file.
To access a file through a dialog box, do not wire file path in the Open/Create/Replace File VI.
To write data to a spreadsheet file, you must format the string as a spreadsheet string, which is a string that includes delimiters, such as tabs. Use the Format Into File function to format string, numeric, path, and Boolean data as text and write the text to a file
Summary, cont.


