Page 1
1
Price Action and Pattern Trading
Course
Subtitle: Theory to Practice with over 85 years of Evidence
Author: Young Ho Seo
Finance Engineer and Quantitative Trader
Book Version: 11.1 (28 October 2017)
Publication Date: 7 July 2017
Total Pages counted in MS-Word: 248
Total Words counted in MS-Word: 38,000
www.algotrading-investment.com
Page 2
2
Risk Disclaimer
The information in this book is for educational purposes only. Leveraged trading
carries a high level of risk and is not suitable for all market participants. The
leverage associated with trading can result in losses, which may exceed your
initial investment. Consider your objectives and level of experience carefully
before trading. If necessary, seek advice from a financial advisor.
Copyright Notices
Copyright © 2016 - 2017 by Young Ho Seo. All rights reserved. No part of this
publication may be reproduced, distributed, or transmitted in any form or by
any means, including photocopying, recording, or other electronic or mechanical
methods, without the prior written permission of the publisher and author,
except in the case of brief quotations embodied in book reviews and certain
other non-commercial uses permitted by copyright law.
Page 3
3
About this book
Technical analysis for the financial trading and investment has nearly several
hundred years of history. Traders use the technical analysis to collect the
scientific evidence to find out the probable market direction and volatility for
their trading. When many people spot the same thing in the financial market, I
think we should take it very carefully, especially if they are based on the
scientific evidence. Price action and pattern trading strategies were extensively
used by many successful traders to identify the trading opportunity to profits in
the market. Price action and pattern trading strategies concern less on the
traditional technical indicators. However, they concern more on raw price
patterns. With the recent development of many brilliant trading strategies
within the price action and pattern trading, their usefulness are already beyond
the expectation of many of us.
As a quantitative developer and trader, my job allows exploring nearly
thousands of different trading strategies to validate and verify. Several price
action and pattern trading strategies have shown me that their operating
characteristics are much different from the typical momentum and mean
reversion strategies. Those price action and pattern trading strategies are
powerful. However, the idea behind these powerful trading strategies is poorly
understood by many traders. Therefore, I decided to come up with the new
concept “Equilibrium Fractal-Wave process” because I was not able to
encapsulate many proven trading strategies used by traders last 85 year using
the existing theory.
To accomplish the concept “Equilibrium Fractal-Wave process”, I had to create
more comprehensive Price Pattern Table to explain those price action and
Page 4
4
pattern trading strategies outside the trend and seasonality framework, which
are the backbone of the analysis techniques for univariate price series. The main
purpose is to communicate with traders for the potential market dynamics for
their profitable trading by spotting the existing phenomenon in the financial
market.
This book is still geared up for your practical trading. Therefore, just explaining
why the strategies work is probably not sufficient for traders. This book covers
many working price action and pattern trading strategies in details and with
examples. At the end of this book, we have also provided some useful
information towards your trading management. Especially we emphasize the
importance of the risk management in this book. I tried to offer the digestible
information as much as I can even for average traders. In addition, many free
tools are available from the website: “http://algotrading-investment.com” for
free of charge. Especially, you might need the Peak Trough Analysis tool to
follow some of the chapters in this book. You can freely download the Peak
Trough Analysis tool from the same website above. Finally, reader should note
that this book contains some strong technical language.
Page 5
5
Table of Contents
Introduction to Price Action and Pattern Trading .................................................................................. 7
1. Introduction to Technical Analysis .................................................................................................. 8
2. Introduction to Charting Techniques ............................................................................................ 23
3. The Five Regularities in the Financial Market ............................................................................... 33
4. Random Process ............................................................................................................................ 44
5. Stationary Process ......................................................................................................................... 48
6. Equilibrium Process ....................................................................................................................... 52
7. Wave Process ................................................................................................................................ 60
8. Fractal-Wave Process .................................................................................................................... 67
9. Equilibrium Wave Process ............................................................................................................. 76
10. Equilibrium Fractal-Wave Process .............................................................................................. 85
11. Choice of trading strategy and Price Patterns .......................................................................... 100
12. How to study Equilibrium Fractal-Wave Process for Financial Market .................................... 105
13. Appendix-Equilibrium Fractal Wave Process Demonstration ................................................... 119
14. References ................................................................................................................................ 125
Practical Price Action and Pattern Trading ......................................................................................... 133
1. Practical Trading with Equilibrium Fractal-Wave Process .......................................................... 134
2. Harmonic Pattern ........................................................................................................................ 137
2.1 Introduction to Harmonic Pattern ........................................................................................ 137
2.2 Harmonic Pattern Trading ..................................................................................................... 140
2.3 Pattern Matching Accuracy and Pattern Completion Interval .............................................. 149
2.4 Potential Reversal Zone ........................................................................................................ 158
3. Elliott Wave Trading .................................................................................................................... 166
3.1 Introduction to the Wave Principle....................................................................................... 166
3.2 Scientific Wave Counting with the Template and Pattern Approach ................................... 169
3.3 Impulse Wave Structural Score and Corrective Wave Structural Score ............................... 183
3.4 Channelling Techniques ........................................................................................................ 188
4. Triangle and Wedge Patterns...................................................................................................... 192
4.1 Introduction to Triangle and Wedge patterns ...................................................................... 192
4.2 Classic Perspective of Triangle and Wedge Patterns ............................................................ 195
4.3 Diagonal Support and Resistance Perspective of Triangle and Wedge Pattern ................... 203
4.4 Elliott Wave Perspective of Triangle and Wedge Pattern ..................................................... 206
Page 6
6
5. References .................................................................................................................................. 210
Trading Management.......................................................................................................................... 212
1. Risk Management ....................................................................................................................... 213
1.1 Risk and Position Sizing ......................................................................................................... 213
1.2 Reward/Risk Ratio in your trading ........................................................................................ 223
1.3 Trading Performance and Cost Metrics ................................................................................ 229
2. Portfolio Management ................................................................................................................ 233
2.1 Combining different trading strategy ................................................................................... 233
2.2 Hedging ................................................................................................................................. 242
2.3 Portfolio Diversification ........................................................................................................ 243
3. References .................................................................................................................................. 247
Page 7
7
Introduction to Price Action and Pattern
Trading
Subtitle: 1st Training in Price Action and Pattern Trading Course
Author: Young Ho Seo
Finance Engineer and Quantitative Trader
www.algotrading-investment.com
Page 8
8
1. Introduction to Technical Analysis
Designing a successful strategy is an intellectually challenging process. It
requires extensive research and testing. The research in trading is always
followed by the immediate real world outcome. The trading strategy based on
the bad system or methodology will be falsified extremely fast in the real world
trading. Naturally, a trader with the scientific mind set can learn the great deal
of knowledge about this world from testing various trading methodology with
the financial market. Science or scientific methodology plays an important role
in trading and investment.
Technical and fundamental analyses are the two main schools of thoughts for
financial trading and investment. Technical analysis assumes that price
discounts for everything. For example, technical analyst believe that at a given
time a stock’s price reflects everything that could affect the company including
company’s fundamental factors, economic factors and market psychological
factors. Technical analyst also believes that history tends to repeat itself.
Therefore, they can predict the future. Technical analysis only leaves the price
as the main subject to study. For fundamental analysis, traders study the
intrinsic value of the company. For example, they make their trading decision
based on growth potential of the security. They are more concerned with basis
like sales, earnings and management of the company. In general, fundamental
traders are considered as the long term investors whereas the technical traders
are considered as the short term investors. However, there are short-term
fundamental traders too. For example, some news traders do not hold their
position too long. On the other hands, there are technical traders basing their
Page 9
9
trading decision on monthly timeframe. Those technical traders can hold their
position for several months to few years too.
The origin of technical analysis could be traced back to the trading of Japanese
rice in Osaka in late 1600. This is the period when the Japanese candlestick
technique was developed. With the development of high capacity computers
and internet, the development of technical analysis has been accelerated even
fast. In this book, we are only interested in the technical analysis in terms of the
methodological point of view. Do not confuse the technical analysis with
technical indicators. Technical analysis is the comprehensive methodology that
covers broad scientific and mathematical methods. Technical indicator is the
mathematical transformation of the price series to extract smoothed price
trajectory or oscillating motion of the price like Simple Moving average or
Relative Strength Index. Of course, technical indicator is a part of technical
analysis but it is much smaller concept comparing to technical analysis. To give
you some ideas about technical analysis, we will present five important
categories for technical analysis. The five categories include charting, pattern
analysis, technical indicator, mathematical method and artificial intelligence.
We list some of the sub elements of the five categories in Table 1-1.
Charting Techniques Pattern Analysis
Line chart
OHLC Bar chart
Candlestick chart
Renko chart
Median Renko chart
Tick chart
Point & Figure chart
Japanese candlestick patterns
Support & resistance
Pivot point analysis
Volume Spread Analysis
Elliott Wave Theory
Harmonic Pattern
Page 10
10
Heiken Ashi
Area
Kagi
Line break
Histogram
Scatter plot
Fibonacci Retracement, Fibonacci
Fan, Fibonacci Arc,
Gann Line, Gann Fan, Gann Arc,
Gann Square
Tradable Patterns (Rising Wedge,
Falling Wedge, Double top, double
bottom, head & shoulder pattern)
Supply & Demand Zone (Rally Base
Drop and Drop Base Rally patterns)
Andrew’s pitch fork
Market Profile
Technical indicators Mathematical Methods
Simple Moving Average
Exponential Moving Average
Triple Exponential Smoothing
Average
Relative Strength Indicator
Fractals
MACD
Commodity Channel Index
Rate of Change
Williams’s Percent (%)
Stochastic Oscillator
Parabolic SAR
Principal Component Analysis
Wavelet Transformation
Multiple Regression
Logistic Regression
Exponential smoothing method
Autoregressive Integrated Moving
Average method
Vector Autoregressive method
Error correction model
Co-Integration Test
Dynamic Stochastic programming
Monte Carlos Simulation
Artificial Intelligence
Multilayer Perceptron
Page 11
11
Support Vector Machine
Self-Organizing Map
Deep Machine Learning
Genetic Algorithm
Table 1-1: Five main categories of Technical Analysis.
Charting techniques are the first requirement for trading. Simply speaking
traders cannot trade without any chart. The value for good visualization
technique is a prime importance for traders. Important attributes in the modern
charting technique is that they must allow the instant recognition of important
patterns and trend from the price series. In addition, market volatility should be
also easily gleaned from the chart too. Some commonly used charting
techniques are line chart, OHLC bar char and candlestick chart. In modern
trading software, these three types of charts are essentially provided in their
basic package. Some more sophisticated software offers Renko chart, Point &
Figure chart and Tick chart for advanced users. Traders tend to have their
preferences for the choice of the charts. For traders using Japanese candlestick
patterns, they will stick with candlestick chart over OHLC bar chart. If traders are
looking for breakout patterns, then they will prefer Renko chart or Point & Figure
chart.
Page 12
12
Figure 1-1: Candlestick chart of EURUSD Daily series with tick volume.
The objective of the technical indicator is to measure the strength of trend,
volatility and momentum of the price series. Technical indicators are mostly
derived from the price series. Sometime technical indicator uses open, high, low
and close price. Sometimes the technical indicator only uses close price for
computation. The advantage of technical indicators is ease of use. For example,
most of technical indicators can be displayed simultaneously together with the
original price series in a convenient way. Therefore, traders can easily
incorporate alerting system for his trading. The disadvantage is that most of time
technical indicators are lagging behind the actual price series. In modern trading
platform, technical indicators and charting facilities are the basic requirements
for trading. Many of the software vendors provide over 100 technical indicators
with their trading platform. There are some of the vendors claiming that they
are offering over 3000 different technical indicators unofficially. Most common
mistake for traders is that they tend to apply the same technical indicator across
Page 13
13
every market. The different market can have different market dynamics.
Therefore, before blindly applying any technical indicators, you should ask the
question like “Is this technical indicator right one for this market?”. For example,
for the stock exhibiting strong growth patterns, it is not good idea to look for the
trend reversal opportunities using the relative strength indicator.
Page 14
14
Figure 1-2: Candlestick chart of EURUSD Daily series (top) with Relative Strength
Indicator (middle) and Average Directional Movement Index (bottom).
Besides technical indicators, pattern analysis is another important tool for
traders. Pattern analysis concerns about the price levels and the geometry of
the price series. Support & resistance, Japanese candlestick pattern and
Fibonacci retracement are the popular pattern recognition techniques for
traders. Support and Resistance represents key price levels where the force of
supply and demand meets (Figure 1-3). Normally support and resistance levels
are detected by connecting frequently tested level from your chart. Support is
the price level at which demand is strong to prevent the price from declining
further. Resistance is the price level at which selling is strong to prevent the price
from rising further. Some textbook might teach you the support and resistance
level as the reversal level but this may be not true. Practically speaking, support
and resistance level can act as the breakout level too. For example, when the
price penetrates through resistance level, more buying momentum can build up
for strong bullish movement. Likewise, when the price penetrates the supply
level, more selling momentum can build up for strong bearish movement.
However, what is always true is that there are strong volatility around the
support and resistance area. Price will either penetrate hard or bounce back
hard at support and resistance level. When the resistance level is penetrated,
then the resistance level becomes support level. Likewise, when the support
level is penetrated, the support level becomes resistance level. Traders should
get habit of making note for the important levels always for their trading.
Page 15
15
Figure 1-3: Schematic diagram of Support and Resistance for financial trading.
Fibonacci retracements are ratios used to identify potential reversal levels. Since
these ratios are derived from the Fibonacci sequence, they are called Fibonacci
retracement. 23.6, 38.2, 50.0 and 61.8% are the popular ratios used for
Fibonacci retracement. Chartists often use these Fibonacci ratios to define
retracement levels and forecast the extent of a correction or pullback. For
example, Figure 1-4 show the typical sequence for bearish trend – correction –
continuing bearish trend pattern. As you can see, the correction was made
about 38.2% of the retracement from the initial bearish trend move. When you
want to apply Fibonacci retracement, you need to identify one swing high and
swing low from your chart. If swing high comes before swing low, then you will
predict the bearish trend reversal point. If swing low comes before swing high,
then you will predict the bullish trend reversal point. Like support and resistance
levels, the accuracy of the Fibonacci retracement varies for different market
Page 16
16
condition too. Fibonacci retracement is simple but powerful concept. It can be
combined with other techniques to form overall strategy. Fibonacci retracement
is normally very good supportive tool to cover the weakness of the technical
indicator.
Figure 1-4: Fibonacci Retracement drawn over daily EURUSD candlestick chart
for bearish setup.
Page 17
17
Figure 1-5: Fibonacci Retracement drawn over daily EURUSD candlestick chart
for bullish setup.
Japanese candlestick pattern is a popular pattern analysis used by many traders.
It provides visual insight for buying and selling momentum present in the market.
Japanese candlestick pattern can provide both entry and exit signal for traders.
At the same time, many traders use them as the confirmation techniques.
Japanese candlestick patterns provide both trend continuation and trend
reversal patterns as shown in Figure 1-6 and Figure 1-7. The main advantage of
Japanese candlestick is that they are simple and universal. Japanese candlestick
pattern can be detected visually without need of the sophisticated tool. At the
same time, the accuracy of the Japanese candlestick can be quite subjective to
Page 18
18
traders. Unless you want to hold your trade for one bar or two bar only,
sometime Japanese candlestick pattern can predict the direction wrong against
long-term price movement. So the caution must be made to use together with
other technical indicator or other pattern analysis. From my experience,
Japanese candlestick has more values as the confirmation technique rather than
main signal for your trading.
Figure 1- 6: Trend reversal Japanese candlestick patterns.
Page 19
19
Figure 1- 7: Trend continuation Japanese candlestick patterns.
Mathematical method is one form of the technical analysis even though they
were not originally developed for the financial trading. The common statistical
method like multiple regressions is often applied for trading and investment.
Principal Component Analysis is the common techniques used to extract some
meaningful information from the financial price series. In addition, the Vector
autoregressive method or error correction model is popular mathematical
trading tool among mathematician. Advantage of mathematical method is their
ability to incorporate robust analytical methodology. For example, with Monte
Carlos simulation method, one can develop rigorous trading strategy with
precise statistical inference about the trading setup. For example, traders can
Page 20
20
illustrate the worst and best outcome of the trading setup for the given volatility
of the price series. The disadvantage of the mathematical method is that they
might be too complex for average traders. Even though modern trading
software comes with the built in script language, implementation of serious
mathematical model takes considerable amount of time and efforts for trading
and investment. It is also important for the model builder to understand the
operating principle and practical limitation of the methods. For example, the
Generalized Autoregressive Conditional heteroscedasticity (GARCH) model can
be used to model the volatility of the financial market. When they built well,
they can offer the considerable insight about the current and future volatility of
the financial market. However, some people mistakenly uses the least square
estimation in the place of the maximum likelihood estimation because of the
readily available source code for the least square curve fitting method on online.
The wrongly applied mathematical model can do more harm than good for your
trading. Therefore, you must carefully think if the mathematical method can
provide sufficient benefit to overcome the complexity. Considering that many
investment banks hires applied mathematicians and physicists, exploring
mathematical trading model is worth for your future career when you can afford
the time and cost for building such a model.
Page 21
21
Figure 1-8: GARCH and EWMA Volatility for FTSE 100. (Alexander, 2008)
Artificial intelligence techniques are another alternative approach for technical
analysis. In fact, the computer scientist had a long interest in using artificial
intelligence for the financial market. They are often considered as more complex
methods than the mathematical methods. For example, multilayer feedforward
neural networks are one form of the nonlinear regression. The method extends
the capability of multiple regression by connecting multiple of neurons, in which
each neuron resembles multiple regression. Advantage of the artificial
intelligence is that they are nonlinear method with the capability of capturing
nonlinear patterns. The disadvantage of the artificial intelligence is that one
requires quite a lot of data and high speed computing facility. Most of time, one
requires impressive hardware to deal with the computation required for the
Page 22
22
artificial intelligence model. Apparently, the artificial intelligence has proven its
ability for the real world application. For example, Google’s Alphago beat the
world champion Lee Se-Dol and European champion Fan Hui at the board game
GO with a best of five win. However, considering that Alphago used a larger
network of computers that spanned about 1200 CPUs to match with Lee Se-Dol
and Fan Hui, it is questionable if it was a fair match for one human to compete
with 1200 CPUs. In addition, this also confirms that this technology is still rather
expensive for the budget of the average traders. Applying artificial intelligence
for making prediction for stock index and currency markets are not a new story
any more. Artificial intelligence sounds so futuristic and promising. However,
one caution must be made before you become a huge fan of artificial
intelligence. Ability of artificial intelligence is limited by usefulness of the data
feeding into the model. For example, artificial intelligence can deal with what is
inside the data only. For the poor data, artificial intelligence can only predict
with poor accuracy. Due to their complex internal structure, they are prone to
noise in the data too. Artificial intelligence can produce non-reliable prediction
for highly complex data sets sometimes. If the simple methods can produce
more or less the same results in comparison to artificial intelligence, it is better
to stick with the simple method. Simple method will provide you more reliable
trading operation in long run.
Page 23
23
Figure 1-9: Topology of feed forward neural network model with 3 input neurons,
5 hidden neurons and 1 output neuron (Left) and multiple regression model
expressed using neural network topology (right).
2. Introduction to Charting Techniques
For the Price Action and Pattern Analysis, it is important to have good
visualization tools. Since we want to find important patterns for our trading, we
will need a good size monitor and good visualization software. Of course, you
should invest on them as much as you can afford. No single visualization
techniques are perfect. They always possess some advantages as well as some
disadvantages. Firstly, line chart is the most basic visualization technique for
Page 24
24
traders. Line is simply drawn by connecting each session’s closing price. For
example, 1-hour line chart is simply drawn by connecting the closing price of 1-
hour candle. As line chart are produced by connecting two points at the fixed
time interval, they can provide a great insight about some regularities in the
price series. For this reason, not only traders use the line chart but also many
mathematicians use them to visualize the price series data. Line chart is useful
when we want to exam some cyclic behaviour like seasonality or any cyclic
patterns made up from sine or cosine function. Line chart is also useful when
you want to compare multiple price series in one chart. On the other hands, the
disadvantage of the line chart is that it does not provide the trading range of
each session. In addition, due to the continuously drawn line, it is difficult to see
any gap between sessions. In addition, line chart miss some important attributes
like highest and lowest prices of each session.
Figure 2-1: Line chart for EURUSD from 1 September 2016 to 16 January 2017
Page 25
25
Candlestick chart provides some additional attributes, which line chart misses.
Figure 2-2 presents the anatomy of the candlestick chart. Candlestick chart
provides three important information. Firstly, the bottom and top of the box
represents the opening and closing price of the session. Secondly, each
candlestick shows the trading range between high and low for each session.
Thirdly, candlestick shows the direction of movement for each session. In Figure
2-2, the green candle reveals the upward movement for the session immediately
whereas the red candle shows the downward movement. From Figure 2-3, we
can feel how richer information candlestick chart provide for each session
comparing to the Line chart. As shown in Figure 2-3, Candlestick chart is useful
to spot the gaps in between sessions. This is very useful property of the
candlestick chart since Line chart or any other chart is difficult to spot the gaps.
One of the drawbacks of the candlestick chart is that it does not provide the
sequence of high and low price but this is the common problem for other
visualization techniques too. It is simply because the sequence of high and low
price was not collected traditionally by the Financial Institutions. If anyone starts
to provide the historical sequence of high and low prices for each session, then
this would reveal a lot of information on the psychology of the financial market.
All they have to put some simple identifier which price comes first between high
and low prices during the session. For example, one can put the letter “h” to
highlight that high price comes first before low price. Therefore, storing cost is
no more than just a letter for this crucial information. This might be cheap but
useful alternative to the expensive tick history data, which often require
enormous hard drive space. In addition, the candlestick chart is the basis for the
popular Japanese candlestick patterns. Although the Japanese candlestick
Page 26
26
pattern alone does not provide the perfect trading entry, many traders uses
them as the confirming tool for their entry or exit.
Figure 2-2: Anatomy of the Candlestick chart.
Page 27
27
Figure 2-3: Candlestick chart for EURUSD from 1 September 2016 to 16 January
2017.
OHLC Bar chart is another popular form of visualization techniques. The OHLC
bar chart has some improvement over the line chart. It provides all of the same
data including open, close, range and direction to the candlestick chart.
However, OHLC bar chart is not visually easy to follow like candlestick chart. In
addition, spotting the gap between sessions is not easy with the OHLC bar chart.
However, many traders still not given up to use OHLC bar chart over the
candlestick and line chart.
Page 28
28
Figure 2-4: Anatomy of the Range Bar.
So far, we have introduced the visualization techniques with the fixed time
interval. For example, line chart, candlestick chart and the OHLC bar chart uses
the information collected in each session. The common time interval for the
session is 1 hour, 4 hour, 1 day, 1 week and 1 month. Instead of using the fixed
time interval, several techniques do not use the fixed time interval to construct
the chart. For example, tick chart record the open, high, low and close prices
during the fixed tick arrival intervals. Therefore, all the bars in the Tick chart have
the same tick volumes. For example, 100 Tick chart will record the open, high,
low and close price during 100 tick arrivals. All the bars in 100 Tick chart will have
100 tick volumes. One can construct line, candlestick chart and OHLC bar chart
with Tick chart too. Tick chart will look like normal chart except that every bar
has the identical tick volume. In Tick chart, during busy market hours, one
candlestick can be formed fast but during slow market hours, one candlestick
can be formed slowly. The tick chart is useful to replace the normal candlestick
chart with lower timeframe when the candlestick chart produces the poor visual
Page 29
29
representation of the market with standard time interval. This is not always the
case but when there is low interest in the market, this can happen. For example,
Figure 2-5 shows the broken 1-minute candlestick chart for NZDSGD currency
pairs. In this case, instead of using the candlestick chart with 1-minute chart,
trader can use 100 tick chart. Because each candle is completed with 100 tick
arrivals every time (Figure 2-6), we naturally have smoother looking chart in
comparison to the broken chart in Figure 2-5. Once traders become familiar with
tick chart, they tend to stick with them even for the higher timeframe. For
example, you can use 500 tick chart or 1000 tick chart for your trading.
Disadvantage of the tick chart is that tick is generally much heavier to store in
the hard drive in terms of size. Therefore, not many trading package offer the
capability of using tick chart for the time of writing this book. Just for your
information, one-year worth of tick data can take up over some serous gigabytes
of the space on your hard drives. In addition, Tick chart does not provide
volatility information since every bar has identical tick volume. However, if
programmatically doable, one can store time duration it takes to form the bar
in the place of the tick volume. This would provide different insight, which the
fixed time interval chart can’t provide.
Page 30
30
Figure 2-5: Broken candlestick chart for NZDSGD currency pairs in 1-minute
timeframe.
Page 31
31
Figure 2-6: EURUSD Tick chat with 100 tick volume. On average, each bar was
formed in 182.36 seconds.
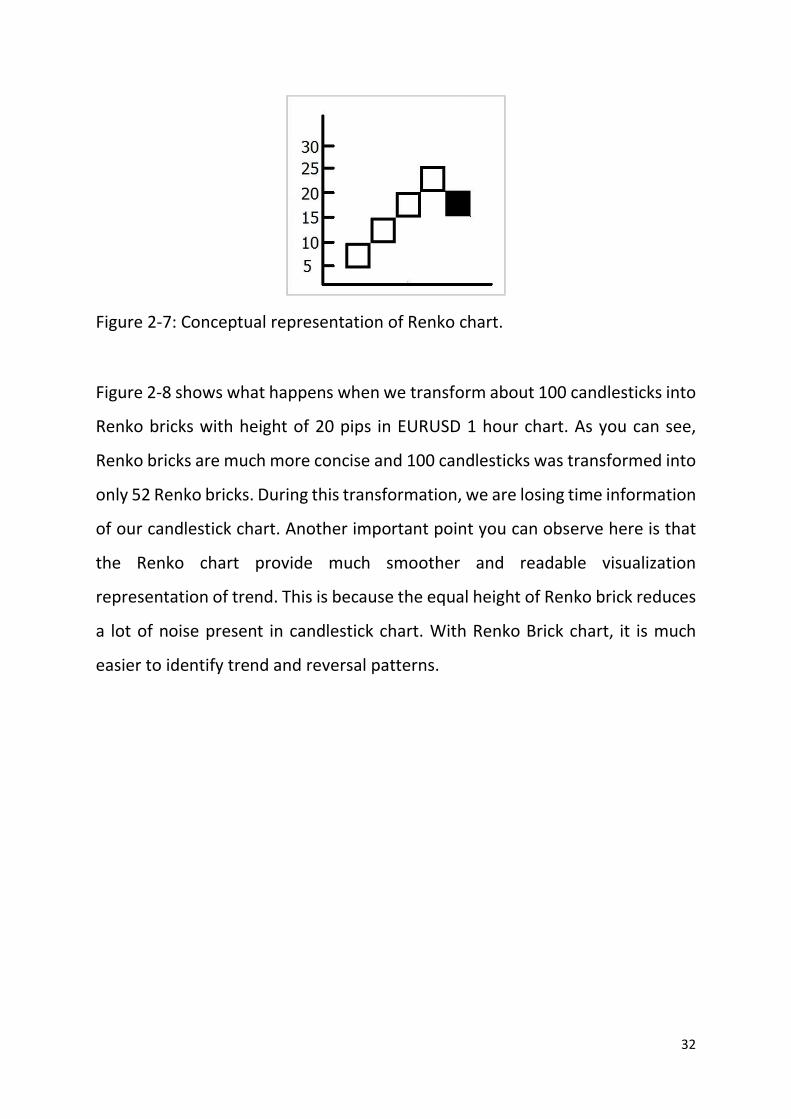
Another popular visualization technique, which does not use the fixed time
interval, is the Renko chart. The charting principle of the Renko Chart is quite
different from the rest. For example, Renko chart is constructed by drawing
bricks of fixed height in series. To illustrate the idea, consider Figure 2-7, if the
price moved up by 5 points from the top of brick, then we will draw one white
up brick. Likewise, if the price moved down by 5 points from the bottom of the
brick, then we will draw one black down brick. The brick will be drawn either on
the top or on the bottom of the other brick always.
Page 32
32
Figure 2-7: Conceptual representation of Renko chart.
Figure 2-8 shows what happens when we transform about 100 candlesticks into
Renko bricks with height of 20 pips in EURUSD 1 hour chart. As you can see,
Renko bricks are much more concise and 100 candlesticks was transformed into
only 52 Renko bricks. During this transformation, we are losing time information
of our candlestick chart. Another important point you can observe here is that
the Renko chart provide much smoother and readable visualization
representation of trend. This is because the equal height of Renko brick reduces
a lot of noise present in candlestick chart. With Renko Brick chart, it is much
easier to identify trend and reversal patterns.
Page 33
33
Figure 2-8: Daily EURUSD price series and Renko chart on the same period.
There are some drawbacks in Renko chart too. Because Renko chart lose all time
information from our candlestick chart, you are no longer able to compare your
normal candlestick chart to your Renko chart. In addition, unlike the candlestick
chart, you have to select the sensible height of brick. Since there are many
benefits using Renko chart, some traders are never worried about these
disadvantages. Overall, Renko chart provide quite a lot of features which other
chart does not provide.
3. The Five Regularities in the Financial Market
The Financial Market is the place where different investors are trading securities
like equities, bonds, currencies and derivatives. It is the market place to facilitate
the exchange of securities between buyers and sellers. Loosely speaking, the
financial market works like the auction market where buyers enter competitive
bids and where sellers enter competitive offers at the same time. However,
Page 34
34
unlike auction market, in the financial market securities are often traded
without delivering actual physical goods. Although some companies can use
financial market to hedge their physical positions, in this book, we will assume
that you are more of speculator who wants to profit from the market dynamics.
Various buyers and sellers with different attributes, different geographic
location, different purchasing power and different financial goals, forms the
daily transactions of the financial market. Therefore, the dynamics of financial
market can be represented as the crowd behaviour. It is not necessarily perfectly
rational place but the fundamentals play some important role behind the
market dynamics up to some degree.
For traders and investors, it is important to develop the trading strategy right
for the market. Good trading strategy never comes blindly. Understanding the
underlying dynamics for the financial market is the important requirement to
build a solid trading strategy. Then, what is the underlying dynamics for the
financial market and how can we study them to benefit our trading and
investment? Scientists had a strong interest in the dynamics of the financial
market for many decades. They have extensively studied the dynamics of the
financial price series in the Stock and Forex market. The simplest but most
effective ways to study the dynamics might be decomposition approach.
Decomposition is the technique that decomposes the price series into several
sub price patterns. Here, the sub price patterns are the regularities that
constitute the dynamics of the financial price series (Figure 3-1). For trading and
investment, we make use of these regularities to predict up or down movement
of the financial market. All the known trading strategies, including simple and
complex ones, are based on some of these regularities existing in the price series.
Page 35
35
Figure 3-1: The concept of the decomposition for the financial price series.
In Figure 3-1, what could be the pattern 1, pattern 2, pattern 3 and pattern N
making up the real world financial price series? Yet, many different version of
decomposition techniques exist to describe the price patterns in the financial
market. Among them, Gardner’s version considers the trend and seasonality as
the main underlying patterns of the price series data (Gardner, 1987, p175).
Many traders are already familiar with trend in the financial markets. For
example, many technical indicators like moving average and MACD were
developed to visualize trend in the financial markets. Seasonality is literally
seasonal fluctuations in the market. It is also used by many traders. For example,
because the sales of Ice Creams increase during summer, stock price for Ice
Creams Company can go up due to the increased profits during summer. This
sort of patterns will make up the seasonal fluctuations.
Page 36
36
The Gardner’s taxonomy is intuitive and easy to understand because trend and
seasonality are the backbone of the analysis technique for the univariate price
series in many fields. Although Gardner’s taxonomy does not mention about
random process explicitly, his taxonomy already assumed that any price series
include some random process.
Depending on their underlying dynamics, the price series can show the
multitude of behaviours because real world price series are made up from
different portion of each price pattern. For example, sometimes, the price series
can exhibit strong trend without seasonality and vice versa. Sometimes the price
series can exhibit some trend with some seasonality. In the Gardner’s trend-
seasonality taxonomy, we can generate twelve different behaviour of the price
series by combining the basic trend and seasonal patterns as shown in Figure 3-
2. Scientist uses this taxonomy to categorize many real world price series data
set for prediction purpose. Then, what is the practical use of the Price Pattern
Table in Figure 3-2 for traders? As a trader, we can develop trading strategies to
capture these price patterns within the price series. For example, most of
technical indicators are created to capture trend pattern in the price series. Price
patterns in price series are regularities, which help us to predict the price series
into the future. Financial trading is based on our prediction for the future market.
We buy EURUSD because we predict that EURUSD have the high chance to go
up. We sell EURUSD because we predict that EURUSD have the high chance to
go down. If we understand the existing regularities of the financial market better,
then we will likely make better trading and investment decision too.
Page 37
37
Figure 3-2: The original Gardner’s table to visualize the characteristics of
different time series data (Gardner, 1987, p175). Gardner assumed the three
components including randomness, trend and seasonality in this table.
In spite of the fact that trend and seasonality are the important price patterns
in the financial market, practically the entire financial market will not fit to this
trend-seasonality taxonomy alone. If the market was so predictable with these
two components only, then traders and investors were able to make money
much easier. Maybe you can also take advantage on buying shares of Ice Cream
Company during April and selling them late August. If the pattern is there, then
Page 38
38
you should do that. However, in the highly competitive and liquid financial
market, this is not the case. In general, price will not move in the path suggested
by the regularities of trend and seasonality for financial market. In many cases,
the trend and seasonality might be the less significant components in the
financial price series in the Stock Market and Forex in comparison to the data
obtained from the business and social studies. Therefore, there is the strong
demand for more comprehensive taxonomy suit for many practical trading
strategies. The Gardner’s trend and seasonal taxonomy can work well for
business and some social data set but it might be oversimplified for the case of
the financial markets.
Instead of the two components taxonomy with trend and seasonality, in this
book, we propose the three components taxonomy. The three components
include Equilibrium process, Wave process and Fractal-Wave process. These
three components can serve to conceptualize the basics price patterns existing
in the financial price series. Just like the trend and seasonal component in the
Gardner’s taxonomy, these three components are the building blocks to explain
complex price patterns in the financial price series and to predict the future
movement of the price series. Just to convey our idea, we will explain these
three components in brief, before we expand each in more details from the next
chapter.
The Equilibrium process is equivalent to the trend in the Gardener’s taxonomy.
However, it is also the same term “equilibrium” used in the supply- demand
economic theory. Literarily it is the market force moving the price to release the
unbalance between supply and demand. Wave process is any cyclic patterns
repeating in the fixed time interval. Therefore, wave process is a similar concept
to the seasonality in the Gardner’s model. Furthermore, Wave process can
Page 39
39
include other complex cyclic behaviour, which can be described with the
multiple combined sine and cosine waves. Fractal-Wave process is the
representation of the Fractal geometry in the time dimension. Therefore, it is
the self-similar process repeating in different scales in the financial prices series.
In plain language, Fractal-Wave process refers to the repeating patterns in
different scales. For example, trader might remember that the price patterns in
S&P 500 before 2008 financial crisis. He can come across nearly similar price
patterns in lower timeframe or in other instruments. Because he has already
seen that the price pattern led to the huge bearish movement for S&P500 before
2008 financial crisis, he would take the sell action whenever he recognize the
similar patterns from lower timeframe or from other instruments.
Just as Gardner visualized the possible combinations of trend and seasonality in
three columns in Figure 3-2, we can visualize the possible combinations of these
three components in five columns. In Figure 3-3, first three columns including
Equilibrium Process (=trend), Additive Seasonality and Multiplicative Seasonality
are identical to the Gardner’s three columns. Fourth column include any simple
and complex cyclic patterns, which can be described with the combined sine and
cosine waves. Fifth column describes the Fractal-Wave process together with
Equilibrium process. Since Wave process can be further split into three sub
components including Additive Seasonality and Multiplicative Seasonality and
multiple cyclic combination, the taxonomy can be used to describe the five
regularities in the financial price series (Figure 3-3 and Figure 3-4). In fact, you
will find that these five regularities are something you felt every time for your
trading and investment but you might not able to perceive what they were
before in the organized sense. Especially the fifth regularity is the basis for many
price action and pattern trading strategy. In this book, we want to help you to
understand the clear difference between this fifty regularity and the rest. We
Page 40
40
will focus to cover the practical trading knowledge for this fifth regularity. Finally,
we will help you to learn the price action and pattern trading strategy in the
practical level throughout this book.
There are many different data in the Stock Market and Forex. Remember that
different players are participating in the different markets. Each financial price
series will be played by different players with different attributes and different
psychologies. Therefore, each price series can have their own dynamics. Some
components among these three can present more in some price series than the
other price series. For example, some stock market price series can possess
much stronger Equilibrium process than currency price series in the Forex.
Practically speaking, the most of the price series in the Stock market and Forex
will have either the mixed effects of Equilibrium process and Wave process or
the mixed effects of Equilibrium process and Fractal-Wave process. On top of
these mixed effect, we should always assume the presence of random process
too. The portion of each process presents in the price series will vary most of
time. Hence, each price series can behave different.
Once again, the main purpose of this taxonomy is to identify regularities existing
in the financial price series. Therefore, traders can make prediction for their
trading. This taxonomy can be used to build trading strategy for different
financial market. For example, there is no need to apply hammer when the
entire house was built with bolts and nuts. In addition, the medical doctor will
prescribe you the medicine for cold when your symptoms are very close to other
patients having cold. Likewise, if the financial price series exhibit strong trend
and multiple cycles, then you should just apply the right tools to capture the
strong trend and multiple cycles for your trading. If you are applying wrong tool,
you will be suffering more than enjoying the profits. Practically speaking, trader
Page 41
41
should know what regularities they are dealing with and what tools they need
to apply to capture those regularities.
From next chapter, we will describe these three components in more details and
with examples. In addition, we will introduce another term called “stationary
process” to explain the market dynamic behind the typical mean reversion and
momentum trading strategy. Furthermore, we will also explain the combined
patterns like Equilibrium Wave process or Equilibrium Fractal-Wave process. We
do this because the price patterns in the real world financial markets are likely
to be one of these combined patterns. We will cover these seven price patterns
in terms of both trading and technical point of view in next seven chapters. We
will try our best to give you example data sets exhibiting each price patterns best.
However, for Forex and Stock market, it is not easy to find them showing simple
trend pattern or seasonal pattern alone. As we have mentioned before, highly
competitive and liquid market are likely showing more complex patterns like
Equilibrium Wave process, Equilibrium Fractal-Wave process or random process.
Therefore, when we explain three components including Equilibrium, Wave
process and Fractal-Wave process, we might use some data set not from the
Forex or stock markets because it is very difficult to find Stock or Forex market
data showing trend pattern alone. For example, in explaining the Equilibrium
process, we use UK housing price to show you how the typical Equilibrium
process dominated price series look like. Even if we use non-financial market
data sets sometimes, it is still important for you to understand these three
components and five regularities for your trading and investment. Figure 3-3 is
the price patterns for the case of growing trend present. When there is declining
trend present, you have to flip the price patterns in Figure 3-3 vertically. For your
own convenience, we provide the separate table for the case of the declining
Page 42
42
trend in Figure 3-4. The price patterns in Figure 3-4 occurs during the bearish
market whereas the price patterns in Figure 3-3 occur during the bullish market.
Figure 3-3: Three components Price Pattern Table for the case of growing trend.
Each pattern can be referenced using their row and column number. For
example, exponential trend pattern in the third row and first column can be
referenced as Pattern (3, 1) in this table. The Price Pattern Table, developed by
Young Ho Seo.
Page 43
43
Figure 3-4: Three components Price Pattern Table for the case of declining trend.
Each pattern can be referenced using their row and column number. For
example, exponential trend pattern in the third row and first column can be
referenced as Pattern (3, 1) in this table. The Price Pattern Table, developed by
Young Ho Seo.
Page 44
119
Figure 12-14: Butterfly pattern detected in GBPUSD in H1 timeframe.
13. Appendix-Equilibrium Fractal Wave Process Demonstration
Equilibrium Fractal Wave process is the fifth regularity in the Price Pattern Table.
Simply speaking, the regularity is based on the repeating geometric patterns in
the financial market. In this appendix, we share the moments that we have
captured the appearance of the equilibrium Fractal Wave process in the financial
market. We hope that you can develop some intuition behind the Equilibrium
Fractal-Wave process or the fifth regularity in our Price Pattern Table (Figure 3-
3 and Figure 3-4). Reader should also note that the infinite cycles in Equilibrium
fractal wave process are implicitly resulted from the varying scale of the
repeating patterns.
Page 45
120
Figure 13-1: Small ABCD pattern (H1 timeframe) inside greater ABCD pattern (D1
timeframe) in EURUSD. All patterns were detected by automatic pattern
detection algorithm.
Page 46
121
Figure 13-2: ABCD pattern (H1 timeframe) inside greater Cypher pattern (D1
timeframe) in USDJPY. All patterns were detected by automatic pattern
detection algorithm.
Page 47
122
Figure 13-3: Triangle pattern (H1 timeframe) and rising wedge pattern (H1
timeframe) in EURGBP. All patterns were detected by automatic pattern
detection algorithm.
Page 48
123
Figure 13-4: Triangle pattern (H1 timeframe) and rising wedge pattern (H1
timeframe) in GBPUSD. All patterns were detected by automatic pattern
detection algorithm.
Page 49
124
Figure 13-5: Head and Shoulder pattern (H1 timeframe) inside greater head and
shoulder pattern (D1 timeframe) in EURUSD. All patterns were detected by
automatic pattern detection algorithm.