Price Informativeness and Investment Sensitivity to Stock Price Qi Chen Fuqua School of Business, Duke University Itay Goldstein Wharton School, University of Pennsylvania Wei Jiang Columbia Business School The article shows that two measures of the amount of private information in stock price—price nonsynchronicity and probability of informed trading (PIN)—have a strong positive effect on the sensitivity of corporate investment to stock price. More- over, the effect is robust to the inclusion of controls for managerial information and for other information-related variables. The results suggest that firm managers learn from the private information in stock price about their own firms’ fundamentals and incorporate this information in the corporate investment decisions. We relate our findings to an alternative explanation for the investment-to-price sensitivity, namely that it is generated by capital constraints, and show that both the learning channel and the alternative channel contribute to this sensitivity. (JEL G14, G31) One of the main roles of financial markets is the production and aggregation of information. This occurs via the trading process that transmits informa- tion produced by traders for their own speculative trading into market prices [e.g., Grossman and Stiglitz (1980), Glosten and Milgrom (1985), and Kyle (1985)]. The markets’ remarkable ability to produce information that gen- erates precise predictions about real variables has been demonstrated empirically in several contexts. Roll (1984) showed that private information of citrus futures traders regarding weather conditions gets impounded into citrus futures’ prices, so that prices improve even public predictions of the weather. Relatedly, the literature on prediction markets has shown that We thank Brad Barber, Alon Brav, David Easley, Simon Gervais, Larry Glosten, John Graham, Campbell Harvey, Florian Heider, Charlie Himmelberg, Laurie Hodrick, Burton Hollifield, Gur Huberman, Soeren Hvidkjaer, Roni Michaely, Robert Neal, Jeremy Stein, Clara Vega, S. Viswanathan, Jeff Wurgler, Yun Zhang, and, in particular, Maureen O’Hara (the editor), and an anonymous referee for helpful comments and discussions. We also thank seminar participants at Duke University, the University of North Carolina at Chapel Hill, the University of Virginia, Columbia–NYU joint seminar, the University of California at Davis, London Business School, and participants at the following conferences: The 14th Annual Conference on Financial Economics and Accounting at Indiana University; The 6th Texas Finance Festival and the 1st conference of the Financial Intermediation Research Society. Address correspondence to Itay Goldstein, Wharton School, University of Pennsylvania, 2300 Steinberg Hall - Dietrich Hall, 3620 Locust Walk, Philadelphia, PA 19104, or e-mail: [email protected]. Ó The Author 2006. Published by Oxford University Press on behalf of The Society for Financial Studies. All rights reserved. For permissions, please email: [email protected]. doi:10.1093/rfs/hhl024 Advance Access publication July 6, 2006
Transcript
Price Informativeness and Investment
Sensitivity to Stock Price
Qi Chen
Fuqua School of Business, Duke University
Itay Goldstein
Wharton School, University of Pennsylvania
Wei Jiang
Columbia Business School
The article shows that two measures of the amount of private information in stock
price—price nonsynchronicity and probability of informed trading (PIN)—have a
strong positive effect on the sensitivity of corporate investment to stock price. More-
over, the effect is robust to the inclusion of controls for managerial information and
for other information-related variables. The results suggest that firm managers learn
from the private information in stock price about their own firms’ fundamentals and
incorporate this information in the corporate investment decisions. We relate our
findings to an alternative explanation for the investment-to-price sensitivity, namely
that it is generated by capital constraints, and show that both the learning channel
and the alternative channel contribute to this sensitivity. (JEL G14, G31)
One of the main roles of financial markets is the production and aggregation
of information. This occurs via the trading process that transmits informa-tion produced by traders for their own speculative trading into market prices
[e.g., Grossman and Stiglitz (1980), Glosten and Milgrom (1985), and Kyle
(1985)]. The markets’ remarkable ability to produce information that gen-
erates precise predictions about real variables has been demonstrated
empirically in several contexts. Roll (1984) showed that private information
of citrus futures traders regarding weather conditions gets impounded into
citrus futures’ prices, so that prices improve even public predictions of the
weather. Relatedly, the literature on prediction markets has shown that
We thank Brad Barber, Alon Brav, David Easley, Simon Gervais, Larry Glosten, John Graham,Campbell Harvey, Florian Heider, Charlie Himmelberg, Laurie Hodrick, Burton Hollifield, Gur Huberman,Soeren Hvidkjaer, Roni Michaely, Robert Neal, Jeremy Stein, Clara Vega, S. Viswanathan, Jeff Wurgler,Yun Zhang, and, in particular, Maureen O’Hara (the editor), and an anonymous referee for helpfulcomments and discussions. We also thank seminar participants at Duke University, the University ofNorth Carolina at Chapel Hill, the University of Virginia, Columbia–NYU joint seminar, the Universityof California at Davis, London Business School, and participants at the following conferences: The 14thAnnual Conference on Financial Economics and Accounting at Indiana University; The 6th Texas FinanceFestival and the 1st conference of the Financial Intermediation Research Society. Address correspondence toItay Goldstein, Wharton School, University of Pennsylvania, 2300 Steinberg Hall - Dietrich Hall, 3620Locust Walk, Philadelphia, PA 19104, or e-mail: [email protected].
� The Author 2006. Published by Oxford University Press on behalf of The Society for Financial Studies. All rights
doi:10.1093/rfs/hhl024 Advance Access publication July 6, 2006
markets provide better predictions than polls and other devices [see
Wolfers and Zitzewitz (2004)].
The theoretical literature in corporate finance has argued that managers
can learn from the information in stock price about the prospects of their
own firms. Two prominent examples of this theory are Dow and Gorton
(1997) and Subrahmanyam and Titman (1999).1 The idea behind the theory
is that stock prices aggregate information from many different participants
who do not have channels for communication with the firm outside thetrading process. Thus, stock prices may contain some information that
managers do not have.2 This information, in turn, can guide managers in
making corporate decisions, such as the decision on corporate investments.
This theory has far-reaching implications for the role of financial markets
as it implies that financial markets affect the real economy and are not just
a sideshow [see Morck, Shleifer, and Vishny (1990), Stein (2003)].
In this article, we empirically assess the hypothesis that managers learn
from the private information in stock price when they make corporateinvestment decisions. We do so by examining the relation between measures
of the amount of private information in stock price and the sensitivity of
corporate investment to price. The learning hypothesis predicts a positive
relation based on the following reasoning. It is commonly believed that stock
prices reflect public information and private information about firms’ fun-
damentals. The private information gets into the price via speculators’
trading activities. If, at a given point in time, managers decide on the level
of investment attempting to maximize the expected value of the firm, theywill use all information available to them at that point. This includes both the
information in the stock price and other information that managers have and
that has not found its way to the price yet. In this environment, investment
will be more sensitive to stock price when the price provides more informa-
tion that is new to managers. Information that managers already had will
move the price but not affect the investment decision (as it already affected
past investments) and thus will decrease the sensitivity of investment to price.
Based on this reasoning, an empirical finding of a positive relation betweenthe investment sensitivity to stock price and the amount of private informa-
tion incorporated into the price by speculators would imply that the private
information in price is new to managers and that managers look at the price
to learn this information and use it in their investment decisions.
Key to our empirical analysis is determining when stock prices contain
more private information. In equilibrium, different stocks may have
different amounts of private information in their prices due, for example,
1 See also Dye and Sridhar (2002), Dow and Rahi (2003), and Goldstein and Guembel (2005).
2 This information is more likely to be about the demand for the firm’s products or about strategic issues,such as competition with other firms. It is less likely to be about the technology used by the firm, becausethe manager is expected to have an informational advantage about technological factors.
The Review of Financial Studies / v 20 n 3 2007
620
to different costs of private information production [see Grossman and
Stiglitz (1980)]. While such costs are difficult to measure directly, two
strands of the finance literature have come up with measures to assess the
equilibrium level of private information in price based on the resulting
price and trading behaviors. We use two such measures for our empirical
analysis.
The first measure is price nonsynchronicity. This measure was first
proposed by Roll (1988) and recently developed by Morck, Yeung, andYu (2000), Durnev et al. (2003), and Durnev, Morck, and Yeung (2004).
It is computed on the basis of the correlation between the stock’s return
and the return of the corresponding industry and of the market. The idea
is that if a firm’s stock return is strongly correlated with the market and
industry returns, then the firm’s stock price is less likely to convey firm-
specific information, which is useful for managerial investment decisions.
Thus, the measure will be higher when the return on the stock is less
correlated with the market and industry returns. There is a large body ofempirical work demonstrating the information content captured by this
measure (a detailed review is provided in Section 1). Moreover, the
seminal paper by Roll (1988) showed unambiguously that this measure
has very little correlation with public news, and thus, it seems to capture
private information. In Roll’s own words, he suggests that, based on his
results, it seems that ‘‘the financial press misses a great deal of relevant
information generated privately.’’
The second measure, probability of informed trading ðPINÞ, utilizesinformation from the trading process. The measure was developed in
Easley, Kiefer, and O’Hara (1996 1997a,b) and used in many other articles
(a detailed review is provided in Section 1). Based on a structural market
microstructure model, this measure directly captures the probability of
informed trading in a stock. Thus, the composition of information for
stocks with high PIN is coming more from private sources than from
public sources. This idea is consistent with the finding of Easley, Hvidk-
jaer, and O’Hara (2002) that stocks with high PIN earn higher returns thatcompensate investors for the high risk of private information.
We find that both measures are strongly positively correlated with the
sensitivity of investment to price, consistent with the hypothesis that stock
prices with large content of private information provide managers with
more new information, which, in turn, affects managers’ investment
decisions. Two clarifications about this conclusion are in order. First,
we do not wish to imply that only the private information in stock price is
new to managers. Clearly, some public information—such as the realiza-tion of GDP or the success or the failure of a patent application—get
reflected in stock price at the same time when it is revealed to managers
via public sources and thus is new to managers. Our results only suggest
that, on average, the private information of speculators increases the
Price Informativeness and Investment Sensitivity to Stock Price
621
amount of information in price that is new to managers and thus the
extent to which managers rely on the price when they make their invest-
ment decisions. Second, our results do not imply that stock prices with
large content of private information are closer to fundamental value. The
distance of a price from fundamental value depends on the total amount
of information in the price, not just the amount of private information. In
fact, as the incorporation of private information into price is a process
that takes time, it might be that stock prices with more private and lesspublic information are farther away from fundamentals. Still, our results
suggest that the private information in price makes price more informa-
tive to managers, in the sense that it is new to managers and thus affects
their investment decisions.
We perform more tests to assess the validity of this conclusion. First, our
conclusion implies that price nonsynchronicity and PIN measure the private
information in price that is not otherwise available to managers. We assess
this more directly by controlling for the amount of managerial informationwith two different proxies. The first proxy is firms’ insider trading activ-
ities. The idea is that on average, managers with more private information
are more likely to trade and thus greater activity represents more manage-
rial information. The second proxy is earnings surprises, measured as the
absolute abnormal return around earnings announcement dates. As man-
agers know the earnings before they are released to the public, this variable
captures information that managers have before it is reflected in the price.
We find that both insider trading and earnings surprises are negativelycorrelated with the sensitivity of investment to price, consistent with the
idea that managers are expected to rely less strongly on the price in their
investment decision when they have more private information on their
own. More importantly, we find that the effects of price nonsynchronicity
and PIN on the investment-to-price sensitivity remain equally strong in the
presence of the proxies for managerial information. Thus, to the extent
that insider trading and earnings surprises are good proxies for managerial
private information, this result suggests that our measures of privateinformation in price reflect some information that is not already known
to managers and thus lends more support to the idea that managers learn
from prices. Second, we examine the relation between the amount of
private information in price and firms’ future operating performance. A
positive relation is expected if the private information in price helps
managers make better investment decisions. We find that our measures
of private information in price have significantly positive relations to firms’
ex post performance as measured by return on assets (ROA), sales growthand assets turnover rate.
Another result that we find is related to the role of financial analysts.
We show that the sensitivity of investment to price decreases in the
amount of analyst coverage a firm gets. This implies that the information
The Review of Financial Studies / v 20 n 3 2007
622
released by analysts and impounded in the stock price does not have
much effect on managers’ investment decisions. This result is consistent
with empirical evidence suggesting that a large fraction of the information
analysts have come from firm managers, especially for our sample period
which was before Regulation Fair Disclosure (Reg FD) took effect [see,
e.g., Bailey et al. (2003), Agrawal, Chadha, and Chen (2006), Hutton
(2005), and others]. Thus, analyst information is expected to move price
and improve the overall information content of price. However, as man-agers already know the information produced by analysts, they do not
adjust their investments to it when it gets reflected in the price, and this
results in a lower sensitivity of investment to price. On top of that, as
argued by Easley, O’Hara, and Paperman (1998), the presence of analysts
can attract more noise trading to the stock. This reduces the content of
private information in the stock price and thus decreases the sensitivity of
investment to price even further.
We relate our findings to the literature in economics and finance thatdocuments a strong positive correlation between stock prices and corpo-
rate investments. While many articles document this correlation [see
Barro (1990), Morck, Shleifer, and Vishny (1990), Blanchard, Rhee, and
Summers (1993)], the reasons behind it are still under debate. Our find-
ings suggest that an important factor contributing to the correlation
between stock price and corporate investment is that managers incorpo-
rate what they learn from the private information in price in their invest-
ment decisions. Baker, Stein, and Wurgler (2003) have shown that thesensitivity of investment to price increases in the level of capital con-
straints faced by the firm. The idea is that financing constraints prevent
firms from pursuing their optimal investment plans and that an increase
in stock price may ease these constraints and thus enable firms to increase
investments. To relate our results to those reported by Baker, Stein, and
Wurgler (2003), we conduct our analysis on five quintile subsamples
sorted by the degree of capital constraints. We show that both the capital
constraints and the amount of private information in price have a role ingenerating the investment-to-price sensitivity and that each factor affects
different firms to a different degree.
We consider several other robustness issues in the article. The most
important one concerns the effect of firm size. Both our measures of private
information in price are negatively correlated with firm size. Firm size, in
turn, may affect the sensitivity of investment to price for reasons unrelated to
the amount of private information reflected in the price. Thus, to ensure that
our results are not driven by firm size, we conduct our analysis on fivequintile subsamples sorted by firm size. We also control for size directly in
our main regressions by including it as an additional variable. In both these
tests, we find that private information in price remains important after size is
controlled for. We also control for other factors such as diversification and
Price Informativeness and Investment Sensitivity to Stock Price
623
institutional holding as well as examine different empirical specifications.
Our results remain intact in all these tests.
Another issue we address in this article is the effect of the private
information in price on the sensitivity of investment to cash flow. The
finance literature has thoroughly discussed the investment-to-cash flow
sensitivity and found that investments are strongly correlated with cash
flows.3 We find that the investment-to-cash flow sensitivity is lower when
prices contain more private information. A possible interpretation of thisresult originates from the recent work of Gomes (2001) and Alti (2003).
They argue that investments may be correlated with cash because cash
provides information on the profitability of firms’ investments beyond
stock prices. According to this hypothesis, when prices become more
informative to managers, managers will rely less on cash and more on
prices to obtain information about investment profitability.
Several recent articles have studied hypotheses related to our article.
Giammarino et al. (2004) analyzed a sample of seasoned equity offeringsand found that managers seem to learn from prices as prices affect
managers’ decisions to withdraw the offering but do not have any causal
relationship with their trading. Luo (2005) found that the positive corre-
lation between announcement date return and the completion of mergers
can be attributed to insiders’ learning from outsiders after controlling for
common information. Gilchrist, Himmelberg, and Huberman (2004)
analyzed how real investment reacts to the ‘‘bubble’’ component in prices
as measured by analysts’ forecast dispersion.A more closely related article is Durnev, Morck, and Yeung (2004).
They find that firms with high level of price nonsynchronicity make more
efficient investment decisions in that their marginal Tobin’s Q is closer to
one. Our article is different from Durnev, Morck, and Yeung (2004) in
two important dimensions. First, we analyze directly the effect of price
nonsynchronicity on the sensitivity of investment to price. This effect may
be a mechanism that generates their result that price nonsynchronicity
enhances efficiency. Second, we examine the effect of private informationmore directly by using the PIN measure. To the best of our knowledge,
our article is the first one to relate the PIN to real investment, and one of
the first empirical articles to use a market-microstructure measure in a
corporate finance context.4
Finally, we acknowledge that the interpretation of the results in the
article depends on our measures of private information in the price. We
rely on prior literature establishing price nonsynchronicity and PIN as
measures of private information. However, one can still view our analysis
3 For example, see Fazzari, Hubbard, and Petersen (1988) and, more recently, Stein (2003).
4 For a theoretical article that relates the PIN measure to corporate finance issues, see Easley and O’Hara(2004).
The Review of Financial Studies / v 20 n 3 2007
624
as testing the joint hypotheses (i) that price nonsynchronicity and PIN
are measures of private information in the price and (ii) that managers
learn the private information from the price and use it in their investment
decisions. Clearly, the strength of interpreting our results as consistent
with managers learning from stock price depends on the extent to which
our measures actually capture private information in the price. Admit-
tedly, it is also possible that our measures are correlated with other
factors that make firms’ viability unusually dependent on stock marketvaluation and that drive the sensitivity of investment to stock price. We
believe that our extensive robustness tests mitigate this concern to a large
extent. But, it remains possible that something else is behind our results.
The remainder of the article is organized as follows: Section 1 presents
the measures of private information used in this article. In Section 2, we
describe the data and the construction of the main variables. Section 3
presents the main empirical results on the relation between the private
information in price and the sensitivity of investment to price. Section 4extends the basic tests to control for managerial information and analyst
coverage, relates our results to the effects of capital constraints and size,
and examines the effect of private information in price on firm perfor-
mance. Section 5 presents several robustness checks. Section 6 concludes.
1. Measures of Private Information
1.1 Price nonsynchronicityThe variation of a stock return can be decomposed into three differ-
ent components: a market-related variation, an industry-related varia-
tion, and a firm-specific variation. The first two components measure
systematic variations. The last one captures firm-specific variation or
price nonsynchronicity. This is the first measure we use in the article.
It can be estimated by 1� R2, where R2 is the R-square from the
Here, ri,j,t is the return of firm i in industry j at time t, rm,t is the marketreturn at time t, and rj,t is the return of industry j at time t.
This measure is based on a large body of literature, both empirical
and theoretical. Roll (1988) was the first one to suggest that price
nonsynchronicity (or firm-specific return variation) is correlated with
private information. His argument goes as follows: prices move upon
new information, which is capitalized into prices in two ways. The first is
through a general revaluation of stock values following the release of
public information, such as unemployment statistics or quarterly
Price Informativeness and Investment Sensitivity to Stock Price
625
earnings. The second is through the trading activity of speculators who
gather and possess private information. As Roll (1988) found that firm-
specific stock price movements are generally not associated with identi-
fiable news release, he argued that private information is especially
important in the capitalization of firm specific information. However,
he acknowledged two possible explanations of his findings: the existence
of either private information or else occasional frenzy.
The relative importance of these two possibilities is an empirical ques-tion. Empirical evidence documented since then provides strong support
to the hypothesis that price nonsynchronicity reflects more private infor-
mation than noise. For example, Durnev et al. (2003) found that stock
price nonsynchronicity is highly correlated with stock prices’ ability to
predict firms’ future earnings, supporting the argument that price non-
synchronicity reflects more private information than noise.
Other articles in this literature provide consistent evidence. Morck,
Yeung, and Yu (2000) showed that firm-specific return variation is highin countries with well-developed financial systems and low in emerging
markets. They argued that in countries with well-developed financial
markets, traders are more motivated to gather information on individual
firms, and thus, prices reflect more firm-specific information. Durnev,
Morck, and Yeung (2004) showed that industries with higher firm-specific
return variation allocate capital more efficiently in the sense that their
marginal Tobin’s Qs are closer to 1. They argued that the private
information in price, as measured by price nonsynchronicity, enhancesinvestment efficiency. Wurgler (2000) obtained a similar result in a cross-
country analysis. Defond and Hung (2004) showed that the association
between lagged stock returns and subsequent Chief Executive Officer
(CEO) turnover is stronger in countries with low stock return synchroni-
city. In their framework, stocks with high nonsynchronicity contain more
private information about firm performance and hence generate an effect
of price on CEO turnover decisions. Finally, Bris, Goetzmann, and Zhu
(2004) used price nonsynchronicity to measure the effects of short sales onthe amount of private information being impounded in price.
On the theoretical level, stock price co-movements can reflect phenom-
ena such as lack of transparency [Li and Myers (2005)], contagion
[Kodres and Pritsker (2002), Kyle and Xiong (2001)], style investing
[Barberis and Shleifer (2003)], and investors’ sentiment [Barberis, Shleifer,
and Wurgler (2005)], all of which are associated with less information on
fundamentals being impounded into the stock price. As such, prices are
less likely to reflect refined firm-specific information, which is importantfor managerial investment decisions. This mechanism is formally ana-
lyzed in Veldkamp (2006), who developed a model in which high fixed
costs of producing information on individual firms cause investors to
focus on signals that are common to many firms. When this happens,
The Review of Financial Studies / v 20 n 3 2007
626
prices will exhibit greater co-movement and will reflect less private infor-
mation on each firm’s fundamentals. Thus, her model predicts a negative
correlation between the price synchronicity and the amount of private
information investors produce about a firm, which is the basis of our first
empirical measure.
1.2 Probability of informed trading
Our second measure, the PIN measure, has strong theoretical founda-tions as a measure of the amount of private information in stock price.
The measure was developed and used in a series of articles by Easley et
al. (1996), Easley, Kiefer, and O’Hara (1996, 1997a,b), Easley, O’Hara,
and Paperman (1998), Easley, O’Hara, and Srinivas (1998), and Easley,
Hvidkjaer, and O’Hara (2002). It is based on a structural market micro-
structure model in which trades can come from noise traders or from
informed traders. It measures the probability of informed trading in a
stock. By definition, informed traders will trade on their informationonly if they think it is not yet publicly known. As PIN directly estimates
the probability of informed trading, it is conceptually a sound measure
for the private information reflected in stock price.
Let us briefly describe the basic idea behind the measure. Suppose the
daily arrival rates of noise traders that submit buy and sell orders are "b
and "s, respectively. The probability that an information event occurs is
�, in which case the probability of bad news is � and the probability of
good news is ð1� �Þ. If an information event occurs, the arrival rate ofinformed traders is �. Informed traders submit a sell order if they get bad
news and a buy order if they get good news. Thus, on a day with no
information event [which happens with probability ð1� �Þ], the arrival
rate of a buy order will be "b and the arrival rate of a sell order will be "s.
On a day with a bad information event (which happens with probability
��), the arrival rate of a buy order will be "b and the arrival rate of a sell
order will be "sþ�. On a day with a good information event [which
happens with probability �ð1� �Þ], the arrival rate of a buy order will be"b þ � and the arrival rate of a sell order will be "s. Let �¼f"b,"s,�,�,�g.The likelihood function for a single trading day is given by
L �jB,Sð Þ ¼ 1� �ð Þe�"b"bð ÞB
B!e�"s
"sð ÞS
S!þ ��e�"b
"bð ÞB
B!e� "sþ�ð Þ "s þ �ð ÞS
S!
þ � 1� �ð Þe�"bþ� "b þ �ð ÞB
B!e�"s
"sð ÞS
S!: ð2Þ
Here, B is the number of buy orders and S is the number of sell orders
in a single trading day. Using trading information over J days and
assuming cross-trading-day independence, one can estimate the
Price Informativeness and Investment Sensitivity to Stock Price
627
parameters of the model ("b, "s, �, �, and �) by maximizing the following
likelihood function:
V ¼ L �jB,Sð Þ ¼Yj¼J
j¼1
L �jBj,Sj
� �: ð3Þ
Then, the probability of informed trading in a given stock for a given
period, which determines the PIN measure, will be:
PIN ¼ ��
��þ "s þ "b
: ð4Þ
Intuitively, PIN is low for stocks with less fluctuations of daily buy and
sell orders. If a stock receives roughly balanced buy and sell orders from
day to day, these orders are more likely to arise from investors’ indepen-
dent liquidity needs or noise trading. The law of large numbers smooths
out these orders, and accordingly, the probability of information events is
small (small �). Following the same line of reasoning, the measure will behigh for stocks that exhibit frequent large deviations from their ‘‘normal’’
order flows.
In the articles mentioned above, the PIN measure has been used to
study various important issues. These include the differences in informa-
tion across exchanges, informed trading in options versus stocks, and
information and liquidity in the trading of less-frequently-traded stocks.
Recently, Easley, Hvidkjaer, and O’Hara (2002) related the PIN measure
to the asset pricing literature and found that the risk of private informa-tion as captured by this measure is priced, so that high PIN stocks earn
higher expected returns. These articles also directly test the validity of the
PIN measure by comparing the predictions of the information-based
model with other alternative models. The overall results from these tests
strongly support PIN as a measure of the probability of informed trading.
More recently, Vega (2005) found further evidence supporting PIN as a
measure of private information in price. She showed that stocks with
higher PIN values have smaller post-earnings-announcement drifts, sug-gesting high PIN stocks adjust to fundamentals quicker. As she found
that this quicker adjustment is not because of media coverage or other
public news releases, her results suggest that stocks with high PIN values
likely contain more private information by speculators.
2. Sample Selection, Specification, and Variable Construction
We collect our data from six databases. We obtain firms’ stock price and
return information from Center for Research in Security Prices (CRSP)
The Review of Financial Studies / v 20 n 3 2007
628
investment and other financial data from Compustat, intraday transac-
tion data from Trade And Quote (TAQ), insider trading information
from the Thomson Financial’s TFN database, analysts’ coverage data
from Zacks Investment Research database, and institutional holding data
from Spectrum. Our sample consists of an unbalanced panel of Compu-
stat firms from 1981 to 2001, excluding firms in the financial industries
(SIC code 6000–6999) and utility industries (SIC code 4200). We exclude
firm-year observations with less than $10 million book value of equity orwith less than 30 days of trading activities in a year. Our final sample
consists of 68,277 firm-year observations with 7268 firms. Analyses using
intraday transaction data (PIN) have fewer observations (19,208 firm-
year observations) because TAQ’s coverage starts from 1993.
Our baseline equation for testing the hypothesis is as follows:
Iit ¼�t þ �i þ �1 �Qit�1 þ �2 � INFOit�1 �Qit�1
þ � � CONTROL þ "it,ð5Þ
where Iit is firm i’s investment in year t, and �t and �i represent year andfirm-fixed effects. We use three different investment measures for the
dependent variable ðIi,tÞ : CAPXRNDit, measured as the sum of capital
expenditure and R&D expenses (Compustat Annual Item 128þ Item46),
scaled by beginning-of-year book assets (Ait�1, Item 6); CAPXit, capital
expenditures scaled by Ait� 1; and CHGASSETit, measured as the per-
centage change in book assets. All three variables are expressed in
percentage points. Both CAPXRNDit and CAPXit are direct measures
of firms’ ongoing investment and R&D activities, whereasCHGASSETSit includes firms’ acquisition and divestiture activities.
Qit� 1 is the (normalized) price in our analysis and is measured by firm
i´s Q. It is calculated as the market value of equity (price times shares
outstanding from CRSP) plus book value of assets minus the book value
of equity (Item 6–Item 60), scaled by book assets, all measured at the end
of year t� 1. We expect �1 > 0, that is, Iit be positively correlated with
Qit�1, as has been observed in the literature many times. The focus of this
article, however, is �2, the coefficient for INFOit�1 �Qit�1, which mea-sures the effect of private information in price on the sensitivity of
investment to price.
INFOit�1 is a measure of the private information in stock price. As
discussed in Section 1, we have two such measures. The first is ð1�R2Þ,where R2 is the R2 from a regression of firm i’s daily stock returns in year
t� 1 on a constant, the CRSP value-weighted market return, and the
return of the three-digit SIC industry portfolio. We set a firm-year’s
ð1�R2Þ to be missing if it is estimated with less than 30 daily observa-tions. The second measure is the PIN. Following the procedure
Price Informativeness and Investment Sensitivity to Stock Price
629
prescribed in Easley, Hvidkjaer, and O’Hara (2002), for each trading day
in year t� 1, we classify all trades between 9:30 A.M. and 4:00 P.M. as
either a buyer-initiated trade or a seller-initiated trade using the Lee
and Ready (1991) algorithm.5 We eliminate large size trades (trade
size greater than 10,000 shares) and trades coded by TAQ as trading
with special conditions. We then estimate a firm-year PIN based on the
number of buys and sells in each trading day of the year. For reliability,
we set a firm’s PIN to be missing if it is estimated with less than 30 tradingdays.
Based on prior studies on investment, our basic regressions include
the following set of control variables ðCONTROLÞ : 1=ASSETSi,t�1, CFi,t, INFOit�1 � CFi,t, RETi,tþ3, and INFOit�1. We include
1=ASSETSi,t�1 because both the dependent variable ðIitÞ and the regres-
sor Qi,t�1 are scaled by last-year book assets ðASSETSi,t�1Þ, which could
introduce spurious correlation. Therefore, 1=ASSETSi,t�1 is included to
isolate the correlation between Iit and Qit�1 induced by the commonscaling variable. Cash flow ðCFi,tÞ is included both separately and in
interaction with INFOit�1 to accommodate the well-documented effect
of cash flow on investment [e.g., Fazzari, Hubbard, and Petersen (1988)].
We measure CFit as the sum of net income before extraordinary items
(Item 18), depreciation and amortization expenses (Item 14), and R&D
expenses (Item 46), scaled by beginning-of-year book assets.6 We include
future returns ðRETi,tþ3Þ because Loughran and Ritter (1995), Baker and
Wurgler (2002), and Baker, Stein, and Wurgler (2003) argued that firmsinvest more when their stocks are overvalued (i.e., when expected future
returns are lower). Thus, we include firms’ future returns ðRETi,tþ3Þ to
control for managers’ market timing of investment. RETi,tþ3 is measured
as the value-weighted market adjusted three-year cumulative return,
starting from the end of the investment year.7 Finally, INFOit�1 is
included separately to control for its direct effect on investment and to
make sure that this direct effect does not drive the result on �2.
Except for PIN, Table 1 summarizes the summary statistics for allvariables for the whole sample of 68,277 observations. The summary
statistics for the subsample of observations where PIN is available are
very similar to those shown in Table 1 and hence not reported. The mean
(standard deviation) of 1� R2 is 0.83 (0.23), indicating that, on average,
5 Specifically, we compare trade prices with the midpoint of the bid-ask spread five seconds before thetrades. We classify trades above the midpoint as buys and classify trades below the midpoint as sells. Fortrades at the midpoint, we compare their prices with the preceding trade price and classify those executedat a higher price than the preceding trades as buys and those at a lower price as sells.
6 We add back R&D expenses because US GAAP require expensing R&D expenditure in the incomestatement.
7 For observations in the last two years of our sampling period, two-year or one-year future returns areused.
The Review of Financial Studies / v 20 n 3 2007
630
Table 1Variable definitions and summary statistics
Variable Definition
Panel A: DefinitionsCAPXRND Capital expenditure plus R&D scaled by beginning-of-year assets (%)CAPX Capital expenditure scaled by beginning-of-year assets (%)CHGASSET Change in assets scaled by beginning-of-year assets (%)Q Market value of equity plus book value of assets minus book value of equity,
scaled by book value of assets1 – R2 One minus R2 from regressing daily return on market and industry index over year tPIN PIN measure per Easley et al. (1996)CF Net income before extraordinary item + depreciation and amortization expenses +
R&D expenses, scaled by lagged assetsRET Value-weighted market return adjusted firm return for next three yearsASSET Total book value of assets in $billionsINV_AST Inverse of ASSETINSIDER Number of transactions by insiders scaled by total number of transactions recorded
in TAQKZ4 Four-variable KZ score (excluding Q) per Kaplan and Zingales (1997)ERC Average of the absolute stock returns over the four quarterly earnings announcement
periods (day –1 to day 1) (in %)SIZE Market capitalization ($million)SALES Total sales revenues ($million)HERFINDAHL Herfindahl index of sales based on firms segment reportsANALYST Number of analysts issuing forecasts or recommendations for the firmINSTITUTION Percentage of shares held by institutional investorsROA Operating earnings (i.e., earnings before interest, taxes, depreciation, and
amortization) as a percentage of market value of assets, which is the sumof market value of equity and book value of debt (in %)
Sales growth Annual growth rate in sales revenues (%)Asset turnover Sales revenue divided by total asset values (%)
Definitions of all variables are listed in Table 1 Panel A. Dependent variables (CAPXRND, CAPX, and CHGASSET) are expressed as percentage points of book assets at thebeginning of the year. Both firm- and year-fixed effects are included. Coefficient estimates are shown in bold and their standard errors are displayed right below. Standard errorsadjust for both heteroskedasticity and within correlation clustered by firm. Number of observations is 64,782 for Columns 1, 4, and 7 and 19,208 for other columns.*, **, and *** indicate a two-tailed test significance level of less than 1%, 5%, and 10%, respectively.
Price
Info
rmativen
essa
nd
Investm
ent
Sen
sitivityto
Sto
ckP
rice
63
3
and other control variables—cash flows, future returns, and inverse book
assets—in the regression. All the three investment measures show similar
results. Thus, we illustrate the main message here with CAPXRND, our
default investment measure (Columns 1, 2, and 3).
Column 1 shows that CAPXRNDit is positively correlated with Qit�1,
with the coefficient for Qit�1 estimated at 3.52, significant at less than the
1% level. This result supports the observation in the literature that
investments are positively correlated with prices. We focus on the coeffi-cient for ð1�R2Þ �Q. As Column 1 shows, this coefficient is estimated at
3.13 with t-statistic of 11.2. This shows that the investment-to-price
sensitivity is higher for firms whose stock prices have greater firm-specific
return variations. Given that the 25th percentile value of ð1�R2Þ is 0.79
and median value is 0.92 (Table 1), these estimates indicate that the
investment-to-price sensitivity for a firm with a 25th percentile value of
ð1�R2Þ is 3.11 ½¼ 3:52� ð0:92� 0:79Þ3:13�. The investment-to-price sen-
sitivity will increase by 0.60 (or 19%), if a firm’s ð1�R2Þ increases from a25th percentile value to a 75th percentile value of 0.98.
Column 2 repeats the same analysis with PIN. We can see that the
coefficient for PIN �Q is 4.21 (significant at less than 1%). This demon-
strates that the investment sensitivity to price is higher for firms with a
higher PIN. Given that the 25th, 50th, and 75th percentile values for PIN
are 0.16, 0.21, and 0.26, respectively, this estimate implies that the invest-
ment-to-price sensitivity of a firm with a 25th percentile value of PIN is
1.97 ½¼ 2:18� ð0:21� 0:16Þ4:21� and that for a firm with 75th percentilevalue of PIN is higher by more than 21% at 2.39.
Column 3 puts both measures of private information, together with the
control variables, in the regression. Because ð1�R2Þ is positively corre-
lated with PIN (with a correlation coefficient of 0.27), it is possible that
PIN captures the same effect as ð1�R2Þ. The results in Column 3 indicate
that this is not the case, as the coefficients for ð1�R2Þ �Q and PIN �Qremain significantly positive. The significance level is lower than that in
Columns 1 and 2, as expected. The fact that both measures are significantin explaining investment-to-price sensitivity suggests that they may cap-
ture different aspects of private information. This may be the case as PIN
captures the source of information reflected in price, that is, the trading
activities of informed traders, whereas ð1�R2Þ captures the result of this
information, that is, its effect on the price. Overall, these results are
consistent with the hypothesis that private information contained in
stock prices, as captured by ð1�R2Þ and PIN, affects managers’ invest-
ment decisions.As to the control variables, all columns in Table 2 show that the
coefficient estimate for CF is significantly positive (at less than the 1%
level), confirming the result in the prior literature that investments
depend positively on cash. Consistent with the market mispricing
The Review of Financial Studies / v 20 n 3 2007
634
argument, the coefficient for RETitþ 3 is negative and significant, suggest-
ing that firms invest more when their stocks are overpriced. Finally, we
find that the coefficient for ð1�R2Þ � CF is negative and significant (at
less than the 1% level). This suggests that firms with more private
information in stock price have lower sensitivity of investment to cash.
As discussed earlier, this can happen if the private information in stock
price enables firms to rely less on cash as a source of information on
investment profitability. We do not get a similar result for PIN � CF inTable 2, although we will see that such result emerges under a different
specification in Table 6.
4. Extending the Basic Tests
4.1 Controlling for managerial information
The positive coefficients on ð1�R2Þ �Q and PIN �Q documented above
are consistent with the idea that managers learn from stock prices. In thissubsection, we attempt to strengthen this interpretation by controlling
directly for managerial information and thus establishing more firmly
that the private information captured by ð1�R2Þ and PIN is new to
managers. The results appear in the first three columns of Table 3. Our
tests rely on measures that proxy for the private information held by
managers (these measures are denoted as MANAGER in Table 3).
Our first measure for managerial information is based on insider trad-
ing activities. Although managers do not always trade on their privateinformation, the premise underlying our test is that, on average, managers
with greater private information will trade more. Prior research has
shown that insider trade indeed reveals private, firm-specific information
not impounded in price.8 We measure managers’ information with the
intensity of a firm’s insider trading activities in a given year, calculated as
the percentage of insider transactions to the total number of all transac-
tions for a given firm-year as recorded in TAQ.
Column 1 in Table 3 reports the effect of the intensity of insidertrading. It shows a negative coefficient estimate ð�6:57Þ for
INSIDER �Q, indicating a negative correlation between insider trading
and investment-to-price sensitivity. The negative correlation is expected
because more insider trading activities indicate that managers possess
more private information and thus rely less on the information in stock
price for their investment decisions. The coefficient, however, is not
statistically significant at conventional levels.
More important for us is the effect of including INSIDER �Q on theestimated coefficients for ð1�R2Þ �Q and PIN �Q. If PIN and ð1�R2Þ
8 See, for example, Seyhun (1992, 1998), Meulbroek (1992), Damodoran and Liu (1993), Ke, Huddart, andPetroni (2002), and Piotroski and Roulstone (2005).
Price Informativeness and Investment Sensitivity to Stock Price
635
reflect information already known by insiders and if INSIDER captures
insiders’ information, then we should expect the coefficients on
ð1�R2Þ �Q and PIN �Q to become insignificant once INSIDER �Q is
present. This does not appear to be the case. Column 1 shows that both
the coefficient for PIN �Q and the coefficient for ð1�R2Þ �Q remain
positive and highly significant in the presence of INSIDER �Q.
In sensitivity checks (results not tabulated), we first re-estimate Column1 using the percentage of insider buys and the percentage of insider sells
instead of the percentage of all insider transactions. The idea is that
insider purchases may convey different information than insider sales.
We find that both numbers of buys and sells are negatively related to
investment-to-price sensitivity and that the coefficients of ð1�R2Þ �Q and
PIN �Q remain significantly positive after adding these alternative insi-
der trading controls. We also obtain qualitatively similar results when we
re-estimate Column 1 using the unscaled number of insider transactionsin the firm-year to capture the insider trading activity.
In Column 2 of Table 3, we adjust for insider trading differently. We use a
modified version of the probability of privately informed trading ðPIN*Þ net
of all insider transactions. Specifically, we make the strongest assumption (to
our least favor) that all insider trades are informed, and calculate PIN* for the
outside informed traders as ðPIN*#trans�#insiderÞ=#trans, where #trans
Table 3Controlling for managerial information and analyst coverage
Number of observations 19130 19130 18722 19208Adjusted R2 0.58 0.58 0.58 0.58Within R2 0.14 0.14 0.15 0.15
Definitions of all variables are listed in Table 1 Panel A. The dependent variable is CAPXRND. Thevariable MANAGER represents the manager’s relative information advantage over the market, which isproxied, from Columns 1–3, by INSIDER (the percentage of insider transactions to total number oftransactions), PIN* (the PIN measure adjusted to exclude insider trading from informed trading, andERC (the average of the absolute market-model abnormal stock returns around the two-day windows ofthe four quarterly earnings announcement dates in the previous year). ANALYST is the number of Zacksanalysts covering the firm during the previous year, in logarithms. Both firm- and year-fixed effects areincluded. Shown are coefficient estimates for Q, MANAGER*Q, (1–R2)*Q, and PIN*Q (in bold print)and their standard errors (displayed right below). Standard errors adjust for both heteroskedasticity andwithin correlation clustered by firm.*, **, and *** indicate a two-tailed test significance level of less than 1, 5, and 10%, respectively.
The Review of Financial Studies / v 20 n 3 2007
636
is the total number of transactions in the firm-year recorded on TAQ and
#insider is the total number of insider transactions in the same firm-year. This
modified PIN* measure thus gets us closer to the goal of testing whether
managers learn from price. Column 2 finds that using this alternative measure
of PIN has little effect on the coefficients of ð1�R2Þ �Q and PIN �Q.
Our second proxy for managerial private information is based on
earnings surprise. We measure earnings surprise as the abnormal stock
return around the earnings announcement dates. Specifically, for eachfirm-year, we compute the abnormal (relative to a market model-adjusted
benchmark) stock returns in the three-day period centering on each of the
four quarterly earnings announcement dates. We then use the average of
the absolute abnormal returns as a proxy for the earnings surprise. The
idea is that if the average absolute abnormal return is high, there is
information in earnings that was not known to investors and was not
impounded in price. Because managers have access to internal accounting
data and thus know the earnings before they are released to the public,earnings surprise is a measure for managers’ private information. This
measure has been used in the literature as a measure of managers’ infor-
mation advantage. For example, Gomes and Phillips (2004) showed that
firms with lower earnings surprises are able to issue more information
sensitive public securities; and Gomes, Gorton, and Madureira (2004)
used earnings surprise to test whether Reg FD improves information
transmission from the firm to the market.
As Column 3 shows, earnings surprise (ERC) has a negative effect onthe sensitivity of investment to stock price. Similar to the result obtained
with measures of insider trading, this suggests that when managers have a
greater informational advantage, they rely less on the price in their
investment decisions. Moreover, Column 3 shows that when earnings
surprise is included as a measure of managerial information, both the
coefficient for PIN �Q and the coefficient for ð1�R2Þ �Q remain positive
and highly significant. This suggests that ð1�R2Þ and PIN reflect some
information that is not known to managers.In summary, to the extent that insider trading activities and earnings
surprises are reasonable proxies for managers’ private information, the
results in Table 3 lend support to the interpretation that ð1�R2Þ and PIN
capture some private information in price that is new to managers.
4.2 Controlling for analyst coverage
Column 4 in Table 3 adds the effect of analyst coverage to the empiricalanalysis. Our goal is twofold. First, we want to verify that the coefficients
for ð1�R2Þ �Q and PIN �Q remain positive and statistically significant
after controlling for analyst coverage. Second, we wish to explore the
effect of analyst coverage, which constitutes an important source of
Price Informativeness and Investment Sensitivity to Stock Price
637
information in financial markets, on the investment-to-price sensitivity
and deepen our understanding of the main factors affecting this sensitiv-
ity. We measure analyst coverage as the logarithm of the number of
analysts that have issued either an earnings forecast or a stock recom-
mendation for the firm in year t�1.
High analyst coverage could have two opposite effects on the invest-
ment-to-price sensitivity. If the information produced by analysts and
impounded in the stock price is new to managers, we should expect apositive relation between analyst coverage and investment-to-price sensi-
tivity. A more commonly held view, however, is that a large fraction of
the information analysts produce came from firm managers, especially for
our sample period (i.e., before Reg FD). Bailey et al. (2003), Agrawal,
Chadha, and Chen (2006), and Hutton (2005), among others, provide
empirical support for this view. If analysts mainly transfer information
from managers to the markets, information released by analysts will move
the stock price (closer to firms’ fundamental values because it helps stockprices impound managerial information) but will unlikely affect man-
agers’ investment decisions (because managers had already incorporated
such information in their past investments). This would suggest a negative
relation between analyst coverage and investment-to-price sensitivity.
Which effect dominates is an empirical question that we address here.
The results show that after the inclusion of analyst coverage, the
coefficient estimates of ð1�R2Þ �Q and PIN �Q remain significantly
positive. We also find that analyst coverage has a significantly negativeeffect on the investment-to-price sensitivity, suggesting that the negative
effect discussed above is the dominant effect. Another possible effect that
also contributes to a negative relation in our setting is offered by Easley,
O’Hara, and Paperman (1998), who argued that the presence of analysts
may attract more noise trading to the stock. This reduces the content of
private information in the stock price and thus further decreases the
sensitivity of investment to price.
4.3 Sorting by capital constraints and size
Thus far, our results indicate that the private information in price is a
significant and important variable in explaining the sensitivity of invest-
ment to stock price. In a recent article, Baker, Stein, and Wurgler (2003)
showed that capital constraints are also important in driving this sensi-
tivity. On the basis of parameter estimates from Kaplan and Zingales
(1997), Baker, Stein, and Wurgler (2003) constructed a four-variable
version of the Kaplan–Zingales measure, KZ4, as a proxy for firms’degree of equity dependence. In particular, KZ4 is calculated as a
weighted sum of cash flow ðCFitÞ, cash dividends (DIVit, Item 19þItem
21), and cash balances (Cit, Item 1), all scaled by lagged assets (Item 6),
The Review of Financial Studies / v 20 n 3 2007
638
as well as leverage ratio [LEV, ðItem 9þ Item 34Þ=ðItem 9þ Item
34þ Item 216Þ]:
KZ4 ¼ � 1:002CFit
Ait�1� 39:368DIVit
Ait�1� 1:315Cit
Ait�1þ 3:139LEVit: ð6Þ
Higher values of KZ4 indicate that firms are more constrained to equity
financing. Baker, Stein, and Wurgler (2003) found that the coefficient forQ is higher in portfolios of higher KZ values, consistent with their
hypothesis that more equity-financing constrained firms have higher
investment-to-price sensitivity.
To assess the sensitivity of our results to firms’ capital constraints, we
construct KZ4 along the same lines described above and incorporate it into
our analysis. We find that KZ4 is positively correlated with both ð1�R2Þand PIN. We follow Baker, Stein, and Wurgler (2003) and assign firm-year
observations to quintiles based on their KZ4 score. We estimate equation (5)for each quintile and report the results in Table 4, Panel A.
Number of observations 2989 3557 3863 4056 4743Adjusted R2 0.49 0.67 0.66 0.69 0.71Within R2 0.07 0.16 0.20 0.19 0.29
Definitions of all variables are listed in Table 1 Panel A. All observations are sorted into five subsamplesdepending on the quintile in which a firm’s KZ4 score (Panel A) or market size (Panel B) falls during theprevious year. KZ4 is used to proxy for a firm’s financing constraints. Regressions of CAPXRND on Q,(1–R2)*Q, PIN*Q, and the same control variables as in Table 3 are estimated in each quintile. Weestimate the five-quintile equations simultaneously with both year- and firm-fixed effects. Shown are thecoefficient estimates for Q,,(1 – R2)*Q and PIN*Q (in bold font) and their standard errors (displayedright below). Standard errors adjust for both heteroskedasticity and within correlation clustered by firm.*, **, and *** indicate a two-tailed test significance level of less than 1, 5, and 10%, respectively.
Price Informativeness and Investment Sensitivity to Stock Price
639
We find that investment-to-price sensitivity (i.e., the estimate for �1)
stays relatively flat from quintile 1 to quintile 2, and increases mono-
tonically from quintile 2 to quintile 5. This confirms that the Baker,
Stein, and Wurgler (2003) result exists in our dataset (which is smaller
than their dataset because of the limited availability of data required for
the PIN measure). More important for us are the coefficient estimates for
ð1�R2Þ �Q and PIN �Q. We find that they stay positive across all KZ
quintiles, with ð1�R2Þ �Q significantly positive in KZ4 quintiles 1– 4,and PIN �Q significant in quintiles 1 and 3. The lowered significance is
expected because of the smaller sample size in each quintile than the full
sample. These results indicate that both private information in price and
capital constraints play important roles in generating the variation in the
sensitivity of investment to price, with different firms affected by each
factor to a different degree. Panel A also shows that the effect of private
information in price on investment-to-price sensitivity is more statisti-
cally significant for firms that are less financially constrained. This resultmay be generated by the intuition that firms can respond to information
in market prices more easily (in adjusting their investment levels) when
they are less constrained in financing their investment.
We also assess the sensitivity of our results to firm size. Larger firms are
less likely, on average, to exhibit strong sensitivity of investment to stock
price, possibly because changes in their stock prices are less likely to affect
their ability to finance investment. As size is negatively correlated with
both price nonsynchronicity and PIN, we need to verify that our mainresults are not driven merely by size. To check this point, we construct
portfolios by size quintiles (where size is measured by firms’ market
equity) and estimate Equation (5) for each quintile.
Panel B of Table 4 reports the estimation results for each size quintile
portfolio. As expected, we find that investment-to-price sensitivity
decreases in size. Importantly, we find that the coefficients for
ð1�R2Þ �Q and PIN �Q stay positive across all size quintiles, with
ð1�R2Þ �Q significantly positive in size quintiles 3–5, and PIN �Q sig-nificant in quintile 5. Given that the significance is expected to decrease
relative to the basic regressions because of reduced sample size in quin-
tiles, these results indicate that the private information in price, as
captured by ð1�R2Þ and PIN, remains an important factor even when
size is considered. They also indicate that the effect of information in
price on investment-to-price sensitivity is more significant for bigger
firms. This is consistent with the idea that bigger firms may be less
affected by capital constraints and therefore can respond more easily toinformation in prices when they make their investment plans.
We perform a series of robustness checks and obtain similar results (not
tabulated). These tests include using NYSE quintiles instead of the size
quintiles in our sample, forming quintiles using double sorting by capital
The Review of Financial Studies / v 20 n 3 2007
640
constraints and size, as well as including SIZE �Q and KZ �Q directly as
control variables in the pooled regression. In all these tests, the coefficient
estimates for ð1�R2Þ �Q and PIN �Q remain positive, whereas their
significance levels either remain intact or improve.
4.4 Private information in stock price and firms’ future
operating performance
If price contains private information that is new to managers and hencehelps managers make better investment decisions, we should expect that
the amount of private information in price will have a positive effect on
firms’ future operating performance. In this subsection, we test this aspect
of the theory.
We construct three measures of operating performance. The first mea-
sure is the ROA, calculated as the percentage of earnings before interest,
taxes, depreciation, and amortization (i.e., EBITDA) to firms’ market
value of assets, where the market value of assets is calculated as the sumof market value of equity and the book value of liabilities. (As Healy,
Palepu, and Ruback (1992) note, this measure overcomes the nonperfor-
mance-related differences caused by the different accounting methods
used by firms.) The second measure is sales growth. The third measure
is asset turnover, calculated as the ratio of sales revenues to total assets.
We then construct a ‘‘score’’ variable, representing the degree of private
information in price for a given firm, and test whether firms with higher
score also exhibit stronger ex post performance. We construct two scores:one based on 1� R2 value and one based on both 1� R2 and PIN. For
the score based on 1� R2, we take the score to be the percentage ranking
of the observation’s 1� R2 in the sample. For the score based on both
1� R2 and PIN, we take the score to be the percentage ranking of a
weighted average of these two values, with the weights as the coefficient
estimates on 1� R2 and PIN from regressions in Table 2. We regress the
performance measures on the scores, controlling for other variables that
can potentially affect performance, such as size, capital constraints, anddiversification. We include firm and year-fixed effects in the regressions to
capture the within-firm effect of private information in price on future
performance, which is the effect of interest here.
The results are summarized in Table 5, with columns 1, 3, and 5 using
ð1�R2Þ as a measure of private information in the price, and columns 2,
4, and 6 report results that are based on both ð1�R2Þ and PIN as
measures of private information in the price. The results show a signifi-
cant positive correlation between the amount of private information inprice, as captured by ð1�R2Þ and PIN, and future performance. These
results are obtained across all measures of performance and all measures
of information. For example, when ð1�R2Þ increases from the 25th to
the 75th percentile, ROA increases by 0.76 percentage points, sales
Price Informativeness and Investment Sensitivity to Stock Price
641
growth increases by 2.98 percentage points, and total asset turnover
increases by 5.69 percentage points.Overall, these results provide additional support to the hypothesis that
prices contain private information new to managers and hence help
managers in their investment decisions. They also reinforce the interpre-
tation of ð1�R2Þ and PIN as measures of private information and not
measures of noise. This is because if these measures capture noise or
mispricing, we should not expect them to be positively correlated with
future performance.
5. Robustness Checks
5.1 Portfolio regressions
To address the concern that the positive coefficient estimates forð1�R2Þ �Q and PIN �Q are driven only by extreme observations of the
information measures, we sort firm-year observations into quintiles
Table 5Regression of future performance on investment-price sensitivity scores
1 2 3 4 5 6
Dependentvariable ROA ROA
SalesGrowth
SalesGrowth
AssetTurnover
AssetTurnover
SCORE based on 1–R2 1–R2&PIN 1–R2 1 –R2&PIN 1–R2 1–R2&PINSCORE 1.51* 0.42*** 5.96* 9.59* 11.38* 5.11*
Definitions of all variables are listed in Table 1 Panel A. The dependent variable is ROA in columns 1 and 2,Sales Growth in columns 3 and 4, and Asset Turnover in columns 5 and 6. ROA is calculated as thepercentage of operating earnings to firms’ total market value of assets (sum of market value of equity andbook value of liabilities). Sales Growth is the annual growth rate in sales revenues. Asset Turnover is thepercentage ratio of sales revenue to total assets. All dependent variables are averages over the three-yearperiods after year t. SCORE is a variable between 0 and 1, representing the percentile of the ‘‘learningscore’’ in the sample. The score based on 1 – R2 is the percentage ranking of the observation’s 1–R2 in thesample. The score based on both 1–R2 and PIN is calculated as the percentage ranking of a weightedaverage of these two values, with the weights being the coefficient estimates on 1–R2 and PIN fromregressions in Table 3. SALES is the sales revenue in year t – 1. Both firm- and year-fixed effects areincluded. Coefficient estimates are printed in bold and their standard errors are displayed right below.Standard errors adjust for both heteroskedasticity and within correlation clustered by firm.*, **, and *** indicate a two-tailed test significance level of less than 1, 5, and 10%, respectively.
The Review of Financial Studies / v 20 n 3 2007
642
based on their ð1�R2Þ or PIN values and estimate the following regres-
sion for each quintile:
Iit ¼ �t þ �1Qit�1 þ �CONTROLþ "i,t: ð7Þ
A finding of �̂1 increasing from low ð1�R2Þ or PIN quintiles to high
quintiles will confirm that our main results represent stable relationsacross the whole sample.
Table 6 summarizes the results from estimating Equation (7) for both
the quintiles sorted by ð1�R2Þ (Panel A) and the quintiles sorted by PIN
(Panel B). In Panel A, we see that the average investment-to-price sensi-
tivity for the lowest ð1�R2Þ quintile (Column 1) is also the smallest at
�̂1 ¼ 1:70 and that for the highest quintile (Column 5) is the largest at
�̂1 ¼ 3:92, with the difference significant at less than the 1% level. The
increase is approximately monotonic except that quintile 4 has an invest-ment-to-price sensitivity slightly lower than that for quintile 3.
Panel B reports similar results for quintiles formed on PIN values.
Column 1 shows that the investment-to-price sensitivity is the lowest for
Table 6Sensitivity to alternative specification: the portfolio approach
Q1 Q2 Q3 Q4 Q5
Panel A: Quintiles formed by 1 – R2Q 1.70* 2.63* 3.35* 3.24* 3.92*
Definitions of all variables are listed in Table 1 Panel A. Each firm-year observation is assigned intoquintiles by its 1–R2 value in Panel A and by its PIN value in Panel B, with the lowest value in quintile 1and the highest value in quintile 5. The dependent variable is CAPXRND. Shown below are coefficientestimates for each quintile, with standard errors shown below. Year-fixed effects are included. Standarderrors adjust for both heteroskedasticity and within correlation clustered by firm.*, **, and *** indicate a two-tailed test significance level of less than 1, 5, and 10%, respectively.
Price Informativeness and Investment Sensitivity to Stock Price
643
quintile 1 at 1.55. The sensitivity increases monotonically from quintile 1
to quintile 5 with the sensitivity estimate in quintile 5 at 5.26. The
difference is significant at less than the 1% level.
Also notable from Table 6 is that the sensitivity of investment to cash
flow is mostly decreasing in both measures of private information in
price. This is consistent with the result reported in Section 3. The differ-
ence here is that the result is obtained not only for ð1�R2Þ but also for
PIN.Overall, the portfolio approach indicates that our results are not driven
only by observations with extreme values of ð1�R2Þ or PIN: that the
positive correlation between private information in the price and invest-
ment-to-price sensitivity represents a general relation.
5.2 Cross-firm versus within-firm effect
In this article, we are interested in both a cross-firm effect and a within-
firm effect. That is, we wish to test whether, cross-sectionally, firms withmore private information in the price have higher sensitivities of invest-
ment to price and whether, overtime, firms are more responsive to stock
prices when their stock prices contain more private information. Results
from pooled regressions on unbalanced panel data (our main regressions)
can be driven by both within- and cross-firm effects. To identify the cross-
firm effect, we re-estimate our main specification using the Fama–
MacBeth approach. Specifically, we estimate Equation (5) with all firms
each year and report the simple averages of yearly estimated coefficients.The standard errors are obtained through cluster-controlled bootstrap to
adjust for the correlation among estimates from different years because of
correlation of disturbances among same-firm observations.9
The results from the Fama–MacBeth approach (reported in Table 7)
are qualitatively similar to those reported in Table 2. Specifically, with the
exception of the regression where the dependent variable is CAPX, the
coefficient estimate for ð1�R2Þ �Q is significantly positive. The coeffi-
cient estimate for PIN �Q remains positive and significant across allspecifications. While the results of the pooled regressions identify both
within-firm and between-firm effects, the results in Table 7 indicate that
the cross-sectional effect is robust. Overall, these results are consistent
with prior literature on the effect of our measures. For example, Easley,
Hvidkjaer, and O’Hara (2002) incorporated their estimates into a Fama
and French (1992) asset-pricing framework and show that PIN affects
cross-sectional asset returns. The empirical literature on price
9 The bootstraping approach amounts to grouped re-sampling with replacement, that is, when a firm-yearobservation gets sampled, all observations belonging to the same firm get sampled automatically. Fordetails, see Hardin and Hilbe (2001), Chapter 17.
The Review of Financial Studies / v 20 n 3 2007
644
non-synchronicity (as reviewed in Section 1) also shows that price non-
Definitions of all variables are listed in Table 1 Panel A. Regressions are estimated for each year.Reported coefficient estimates are the averages of yearly estimates. Standard errors are estimated withclustered controlled bootstrapping. Number of observations is 64,782 in Columns 1–3 and 19,208 inColumns 4–6.*, **, and *** indicate a two-tailed test significance level of less than 1%, 5%, and 10%, respectively.
Price Informativeness and Investment Sensitivity to Stock Price
645
with size and with analyst coverage, this result is expected given the
results we have discussed thus far. Column 2 shows that investments in
more diversified firms are less responsive to stock prices. This result is
intuitive because stock prices may not be as informative about the inter-
nal operations of diversified firms as they are for focused firms. Lower
sensitivity for a more diversified firm may also result from the cross-
subsidizations of investments within the firm.Finally, Column 3 considers another specification to control for the
effect of diversification. One may argue that our measures of information,
especially ð1�R2Þ, are mechanically affected by diversification structure
and that, as a robustness check, we should focus on pure-play firms, that
is, firms with only one reported business segment. We thus run our basic
regression using only pure-play firms. Column 3 shows that the effects of
ð1�R2Þ and PIN on the investment to price sensitivity remain intact.
5.4 Robustness of price non-synchronicity
Price nonsynchronicity measures firm-specific return variation and is sup-
ported by prior literature as a measure for the amount of private informa-
tion in price. We perform several robustness checks with respect to this
measure (results not tabulated). First, we add lagged market and industry
returns (one day or two days lagged) to the regression estimating ð1� R2Þto control for the possibility that some market or industry information
Table 8Sensitivity to other factors affecting investment-price sensitivity
1 2 3
CONTROL INSTITUTION HERFINDAHL PURE PLAY
Q 2.02* 2.06* 2.03*0.13 0.14 0.15
(1–R2)*Q 1.14* 2.15* 1.80*0.36 0.47 0.53
PIN*Q 1.49** 3.41* 4.49*0.76 1.23 1.38
CONTROL*Q -2.72* 0.57*** –0.37 0.30 –
Number of observations 15,635 15,213 11,518Adjusted R2 0.60 0.51 0.49Within R2 0.17 0.15 0.14
Definitions of all variables are listed in Table 1 Panel A. The dependent variable is CAPXRND. InColumns 1 and 2, the dependent variables are those in Table 3 plus the additional CONTROL variable:INSTITUTION (measured as the average percentage of shares held by institutional investors in year t – 1)and HERFINDAHL (the Herfindahl index of firms’ reported business segments based on previous-yearsales). In Column 3, the same regression (without the extra CONTROL variable) is performed on ‘‘pureplay’’ firms (i.e., firms that have only one reported business segment). Both firm- and year-fixed effectsare included. Coefficient estimates for Q, (1 – R2)*Q, PIN*Q and CONTROL*Q are printed in bold andtheir standard errors are displayed right below. Standard errors adjust for both heteroskedasticity andwithin correlation clustered by firm.*, **, and *** indicate a two-tailed test significance level of less than 1, 5, and 10%, respectively.
The Review of Financial Studies / v 20 n 3 2007
646
may take longer than a day to be reflected in firms’ returns. The resulting
1� R2 measure is highly correlated with our baseline measure and does
not affect our main results established in Table 2. We also examine whether
industry- or market-related return variation affect investment-to-price sen-
sitivity similarly as the firm-specific return variation does. For the effect of
industry-related return variation, we use the 1� R2 from regressing a firm
return on the market return alone (thus, it is a measure of both industry-
related return variation and firm-specific return variation). We find thatadding industry-related return variation reduces the explanatory power of
the 1� R2 measure, consistent with the idea that industry-related return
variation is most likely from information managers already knew and
hence would reduce investment-to-price sensitivity. As to the effect of
market-related return variation (which can be captured by R2), the fact
that we find significantly positive coefficient for ð1� R2Þ*Q in our regres-
sions implies that market-related return variation would likely have a
negative effect on investment-to-price sensitivity, suggesting that market-related return variation does not play a role in determining managers’
investment decisions.
5.5 Other specifications
Our main parameter of interest is the coefficient estimate ð�2Þ for the
interactive term INFOit�1 �Qit�1. To ensure that �2 is not capturing any
nonlinear relation between Iit and Qit�1, we perform a cubic-spline
regression diagnosis and find that the relation between Iit and Qit�1 isapproximately linear. Such a linear relation is also documented in Baker,
Stein, and Wurgler (2003). In addition, we obtain qualitatively similar
results (hence not reported) regarding the coefficient estimate for
INFOit�1 �Qit�1 after we include a squared-term of Qit�1 in the estima-
tion. Finally, results are not qualitatively affected if we include lagged
investment ðIi,t�1Þ to control for the autocorrelation in firms’
investments.
6. Conclusion
This article studies the empirical relation between the amount of private
information in stock price and the sensitivity of investment to stock price.
Using two different measures of the amount of private information inprice—price nonsynchronicity and PIN—we find strong positive correla-
tion between the amount of private information in price and the invest-
ment-to-price sensitivity. This relation is robust to the inclusion of
controls for managerial information, analyst coverage, capital constraint,
and firm size, as well as to a variety of different specifications. Overall,
our results are consistent with the hypothesis that some private
Price Informativeness and Investment Sensitivity to Stock Price
647
information in price is new to managers and that managers learn it from
the price and incorporate it in their investment decisions.
The possibility that prices guide managers in their investment decisions
implies that financial markets affect the real economy. This observation
has important implications. On the one hand, as Subrahmanyam and
Titman (1999) argued, financial markets may enhance investment effi-
ciency because they provide valuable information to managers. On the
other hand, as Goldstein and Guembel (2005) showed, the feedback effectfrom prices to the real economy may make price manipulation possible,
which can cause inefficiencies in the real economy. These effects have
important implications for regulations aimed at increasing market trans-
parency and encouraging information acquisition.
ReferencesAgrawal, A., S. Chadha, and M. A. Chen, 2006, ‘‘Who is Afraid of Reg FD? The Behavior andPerformance of Sell-Side Analysts Following the SEC’s Fair Disclosure Rules,’’ forthcoming in Journalof Business.
Alti, A., 2003, ‘‘How Sensitive is Investment to Cash Flow When Financing is Frictionless,’’ Journal ofFinance, 58, 707–722.
Bailey, W., H. Li, C. X. Mao, and R. Zhong, 2003, ‘‘Regulation Fair Disclosure and Earnings Informa-tion: Market, Analyst, and Corporate Responses,’’ Journal of Finance, 58, 2487–2514.
Baker, M., J. Stein, and J. Wurgler, 2003, ‘‘When Does the Market Matter? Stock Prices and theInvestment of Equity-Dependent Firms,’’ Quarterly Journal of Economics, 118, 969–1006.
Baker, M., and J. Wurgler, 2002, ‘‘Market Timing and Capital Structure,’’ Journal of Finance, 57, 1–32.
Barberis, N., and A. Shleifer, 2003, ‘‘Style Investing,’’ Journal of Financial Economics, 68, 161–199.
Barberis, N., A. Shleifer, and J. Wurgler, 2005, ‘‘Comovement,’’ Journal of Financial Economics, 75,283–317.
Barro, R., 1990, ‘‘The Stock Market and Investment,’’ Review of Financial Studies, 3, 115–131.
Blanchard, O., C. Rhee, and L. Summers, 1993, ‘‘The Stock Market, Profit, and Investment,’’ QuarterlyJournal of Economics, 108, 115–136.
Bris, A., W. N. Goetzmann, and N. Zhu, 2006, ‘‘Efficiency and the Bear: Short Sales and MarketsAround the World,’’ forthcoming in Journal of Finance .
Damodoran, A., and C. H. Liu, 1993, ‘‘Insider Trading as a Signal of Private Information,’’ Review ofFinancial Studies, 6, 79–119.
DeFond, M., and M. Hung, 2004, ‘‘Investor Protection and Corporate Governance: Evidence fromWorldwide CEO Turnover,’’ Journal of Accounting Research, 42, 269–312.
Dow, J., and G. Gorton, 1997, ‘‘Stock Market Efficiency and Economic Efficiency: Is There a Connec-tion?’’ Journal of Finance, 52, 1087–1129.
Dow, J., and R. Rahi, 2003, ‘‘Informed Trading, Investment, and Economic Welfare,’’ Journal ofBusiness, 76, 430–454.
Durnev, A., R. Morck, and B. Yeung, 2004, ‘‘Value Enhancing Capital Budgeting and Firm-SpecificStock Return Variation,’’ Journal of Finance, 59, 65–105.
The Review of Financial Studies / v 20 n 3 2007
648
Durnev, A., R. Morck, B. Yeung, and P. Zarowin, 2003, ‘‘Does Greater Firm-Specific Return VariationMean More or Less Informed Stock Pricing,’’ Journal of Accounting Research, 41, 797–836.
Dye, R. A., and S. S. Sridhar, 2002, ‘‘Resource Allocation Effects of Price Reactions to Disclosures,’’Contemporary Accounting Research, 19, 385–410.
Easley, D., S. Hvidkjaer, and M. O’Hara, 2002, ‘‘Is Information Risk a Determinant of Asset Returns?’’Journal of Finance, 57, 2185–2221.
Easley, D., N. Kiefer, and M. O’Hara, 1996, ‘‘Cream-Skimming or Profit-Sharing? The Curious Role ofPurchased Order Flow,’’ Journal of Finance, 51, 811–833.
Easley, D., N. Kiefer, and M. O’Hara, 1997a, ‘‘The Information Content of the Trading Process,’’ Journalof Empirical Finance, 4, 159–186.
Easley, D., N. Kiefer, and M. O’Hara, 1997b, ‘‘One Day in the Life of a Very Common Stock,’’ Review ofFinancial Studies, 10, 805–835.
Easley, D., N. Kiefer, M. O’Hara, and J. Paperman, 1996, ‘‘Liquidity, Information, and Less-FrequentlyTraded Stocks,’’ Journal of Finance, 51, 1405–1436.
Easley, D., and M. O’Hara, 2004, ‘‘Information and the Cost of Capital,’’ Journal of Finance, 59,1553–1583.
Easley, D., M. O’Hara, and J. Paperman, 1998. ‘‘Financial Analysts and Information-Based Trade,’’Journal of Financial Markets, 1, 175–201.
Easley, D., M. O’Hara, and P. S. Srinivas, 1998, ‘‘Option Volume and Stock Prices: Evidence on WhereInformed Traders trade,’’ Journal of Finance, 53, 431–465.
Fama, E. F., and K. R. French, 1992, ‘‘The Cross Section of Expected Stock Returns,’’ Journal ofFinance, 47, 427–465.
Fazzari, S., R. G. Hubbard, and B. C. Petersen, 1988, ‘‘Finance Constraints and Corporate Investment,’’Brookings Papers on Economic Activity, 1, 141–195.
Giammarino, R., R. Heinkel, B. Hollifield, and K. Li, 2004, ‘‘Corporate Decisions, Information andPrices: Do Manages Move Prices or Do Prices Move Managers?’’ Economic Notes (Banca Monte deiPaschi di Siena SpA), 33(1), 83–110.
Gilchrist, S., C. Himmelberg, and G. Huberman, 2004, ‘‘Do Stock Price Bubbles Influence CorporateInvestment?’’ forthcoming in Journal of Monetary Economics.
Glosten, L. R., and P. R. Milgrom, 1985, ‘‘Bid, Ask and Transaction Prices in a Specialist Market withHeterogeneously Informed Traders,’’ Journal of Financial Economics, 14, 71–100.
Goldstein, I., and A. Guembel, 2005, ‘‘Manipulation and the Allocational Role of Prices,’’ working paper,University of Pennsylvania and Oxford University.
Gomes, J., 2001. ‘‘Financing Investment,’’ American Economic Review, 91, 1263–85.
Gomes, A., G. Gorton, and L. Madureira, 2004, ‘‘SEC Regulation Fair Disclosure, Information, and theCost of Capital,’’ working paper, University of Pennsylvania Wharton School.
Gomes, A., and G. Phillips, 2004, ‘‘Why Do Public Firms Issue Public and Private Equity, Debt, andConvertibles?’’ working paper, University of Pennsylvania Wharton School.
Grossman, S. J., and J. E. Stiglitz, 1980, ‘‘On the Impossibility of Informationally Efficient Markets,’’American Economic Review, 70, 393–408.
Hardin, J., and J. Hilbe, 2001, Generalized Linear Models and Extensions, Stata Press, Texas.
Healy, P. M., K. G. Palepu, and R. S. Ruback, 1992, ‘‘Does Corporate Performance Improve AfterMerges?’’ Journal of Financial Economics, 31, 135–175.
Price Informativeness and Investment Sensitivity to Stock Price
649
Hutton, A., 2005, ‘‘Determinants of Managerial Earnings Guidance Prior to Regulation Fair Disclosureand Bias in Analysts’ Earnings Forecasts,’’ forthcoming in Contemporary Accounting Research.
Kaplan, S., and L. Zingales, 1997, ‘‘Do Investment-Cash Flow Sensitivities Provide Useful Measures ofFinancing Constraints,’’ Quarterly Journal of Economics, 112, 169–215.
Ke, B., S. Huddart, and K. Petroni, 2002, ‘‘What Insiders Know About Future Earnings and How TheyUse It: Evidence from Insider Trades,’’ Journal of Accounting and Economics, 35, 315–346.
Kodres, L., and M. Pritsker, 2002, ‘‘A Rational Expectations Model of Financial Contagion,’’ Journal ofFinance, 57, 769–799.
Kyle, A. S., 1985, ‘‘Continuous Auctions and Insider Trading,’’ Econometrica, 53, 1315–1335.
Kyle, A., and W. Xiong, 2001, ‘‘Contagion as a Wealth Effect,’’ Journal of Finance, 56, 1401–1439.
Lee, C., and M. Ready, 1991, ‘‘Inferring Trade Direction from Intraday Data,’’ Journal of Finance, 46, 733–746.
Li, J., and S. Myers, 2005, ‘‘R-squared Around the World: New Theory and New Tests,’’ forthcoming inJournal of Financial Economics.
Loughran, T., and J. Ritter, 1995, ‘‘The New Issues Puzzle,’’ Journal of Finance, 50, 23–51.
Luo, Y., 2005, ‘‘Do Insiders Learn from Outsiders? Evidence from Mergers and Acquisitions,’’ Journal ofFinance, 60, 1951–1982.
Meulbroek, L. K., 1992, ‘‘An Empirical Analysis of Illegal Insider Trading,’’ Journal of Finance, 47,1661–1699.
Morck, R., A. Shleifer, and R. Vishny, 1990, ‘‘The Stock Market and Investment: Is the Market a Side-Show?,’’ Brookings Papers on Economic Activity, 2, 157–215.
Morck, R., B. Yeung, and W. Yu, 2000, ‘‘The Information Content of Stock Markets: Why do EmergingMarkets have Synchronous Stock Price Movements?’’ Journal of Financial Economics, 59, 215–260.
Piotroski, J., and D. Roulstone, 2005, ‘‘Do Insider Trades Reflect Both Contrarian Beliefs and SuperiorKnowledge about Future Cash-Flow Realizations?’’ Journal of Accounting and Economics, 39, 55–81.
Roll, R., 1984, ‘‘Orange Juice and Weather,’’ American Economic Review, December, 861–880.
Roll, R., 1988, ‘‘R2,’’ Journal of Finance, 43, 541–566.
Seyhun, H. N., 1992, ‘‘Why Does Aggregate Insider Trading Predict Future Stock Returns?’’ QuarterlyJournal of Economics, 107, 1303–1331.
Seyhun, H. N., 1998, Investment Intelligence from Insider Trading, MIT Press, Cambridge.
Stein, J., 2003, ‘‘Agency, Information and Corporate Investment,’’ in George Constantinides, MiltonHarris, and Rene Stultz (eds), Handbook of the Economics of Finance, Elsecier Science, Amsterdam,Holland.
Subrahmanyam, A., and S. Titman, 1999, ‘‘The Going-Public Decision and the Development of FinancialMarkets,’’ Journal of Finance, 54, 1045–1082.
Vega, C., 2005, ‘‘Stock Price Reaction to Public and Private Information,’’ forthcoming in Journal ofFinancial Economics.
Veldkamp, L., 2006, ‘‘Information Markets and the Comovement of Asset Prices,’’ Review of EconomicStudies, 73, 823–845.
Wolfers, J., and E. Zitzewitz, 2004, ‘‘Predictions Market,’’ Journal of Economic Perspective, Spring,107–126.
Wurgler, J., 2000, ‘‘Financial Markets and the Allocation of Capital,’’ Journal of Financial Economics, 58,187–214.


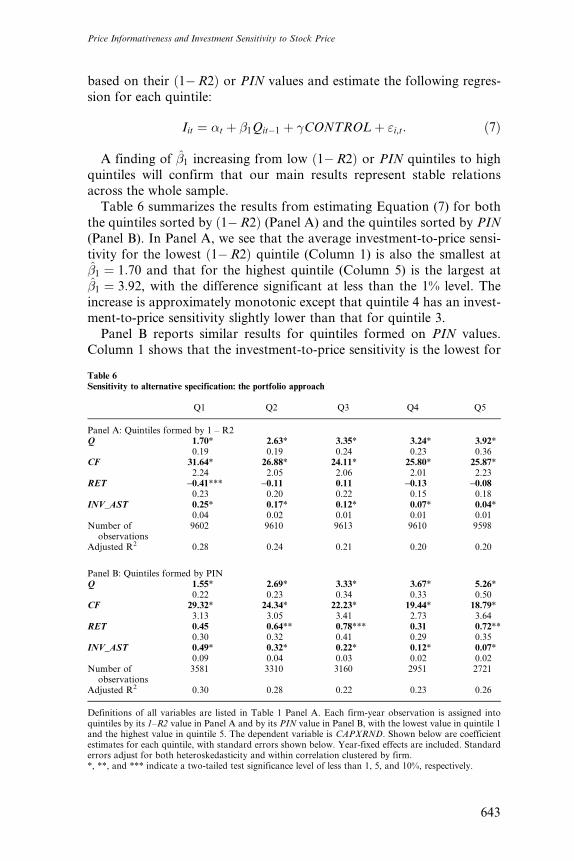


![Fuzzy Logic, Informativeness and Bayesian Decision-Making ... · arXiv:math/0610876v1 [math.GM] 28 Oct 2006 Fuzzy Logic, Informativeness and Bayesian Decision-Making Problems Peter](https://static.documents.pub/doc/80x56/5e3d445f624afc47794ef204/fuzzy-logic-informativeness-and-bayesian-decision-making-arxivmath0610876v1.jpg)