www.pwccn.com www.pwc.com/globalmoneytree PricewaterhouseCoopers Zhong Tian LLP MoneyTree TM China TMT Report Q1/Q2 2015 Data source: Zero2IPO Research Technology Institute This MoneyTree TM China Telecommunications, Media and Technology (TMT) Report includes information on private equity and venture capital (PE/VC) investment in the TMT industry for Q1/ Q2 2015, as well as 2014, 2013 and Q3/Q4 2012.
Transcript
www.pwccn.comwww.pwc.com/globalmoneytree
PricewaterhouseCoopers Zhong Tian LLP
MoneyTreeTM China TMT ReportQ1/Q2 2015 Data source: Zero2IPO Research
Technology Institute
This MoneyTreeTM China Telecommunications, Media and Technology (TMT) Report includes information on private equity and venture capital (PE/VC) investment in the TMT industry for Q1/Q2 2015, as well as 2014, 2013 and Q3/Q4 2012.
Table of contents
1. Overview 4
2. PE/VC investments in the TMT industry 5
TMT industry investments compared to all industries 5
Investments by quarter 7
Investments by sector 8
First-time funding compared with follow-on funding 11
Investments by stage of development 13
Investments by region 16
3. PE/VC exits in the TMT industry 17
Exits by quarter 17
Exits by type 18
Exits by sector 20
4. Sector focus: Technology, Internet, and Telecommunications and Mobile
21
Investments in Technology 21
Investments in Internet 27
Investments in Telecommunications and Mobile 33
5. A close look at investments in Mobile 37
6. Methodology and definitions 40
7. Contacts 42
4 MoneyTreeTM China TMT Report Q1/Q2 2015
In the first half (H1) of 2015, the Telecommunications, Media and Technology (TMT) industry in China continued the good momentum developed in second half (H2) of 2014. The “Internet +” theory gradually took hold in various traditional industries, prompting new business models to emerge while developing enterprises continued to expand, attracting capital from institutional investors. The TMT industry is now one of the fastest-growing industries in China.
In H1 2015, overall private equity and venture capital (PE/VC) investment soared from its early lows, and an investment spurt occurred in the second quarter of the year (Q2). The overall investments were far above the full-year total of 2014 due to the implementation of government entrepreneurship and innovation incentive policies. The overall investments in H1 2015 slightly decreased by 7% to US$25.40 billion compared to H2 2014, but remained high. In terms of the specific industry, both deal volume and deal value in the Medical, Finance and TMT industry in H1 2015 increased significantly.
Investments in TMT companies in H1 2015 were almost the same as the full-year total of 2014, and the number of investments increased by 44% compared to H2 2014. As the hotspot of all industries, and under the impact of wealth effect brought about by booming stock markets and the New Third Board, TMT industry investments reached a historical high since 2012 in both deal value and deal volume.
In H1 2015, investments in both the Technology industry and the Entertainment and Media industry were outstanding, and significantly increased in both deal value and volume. This was mainly due to the occurrence of several large investments.
It is worth noting that there were 32 TMT deals with values over US$100 million, three of which exceeded US$1 billion with the largest single
1. Overviewdeal of US$1.63 billion for the initial investment in an electronic and optical equipment enterprise mainly for the manufacturing and development of integrated circuits. These enterprises attracted generous investments due to their rapid development, many of which were at expansion or PIPE stage.
In H1 2015, the exit volume of IPOs reached 34, accounting for 69% of all TMT industry exits and the main method of exit. With respect to the selection of listing areas, IPO in the US is no longer as popular an exit strategy just as we previously predicted. In H1 2015, the Chinese A-share (especially Growth Entherprise Market [GEM]) market was hot; IPO volume was up to 28 deals, representing 82% of the total. In H1 2015, both the IPOs of the TMT industry and Chinese A-share reached a historical high since 2012. However, the exits through IPO have become much more difficult due to fluctuations in the capital markets.
While constantly changing people’s way of life and work efficiency, the TMT industry is also having revolutionary impact on the operating models of enterprises. With smart terminals permeating our daily life, various traditional ways of life and working modes have been fundamentally changed via Mobile, and many traditional industries have been closely linked to TMT at an accelerated speed. Going forward, thorough analyses of high-risk and high-yielding TMT companies and investment value will be critical to effective and responsible investment decision-making in the TMT industry. This report endeavors to provide a clear understanding of PE/VC investment and exit strategy in the TMT industry as a whole and the Technology, Internet and Telecommunications and Mobile segments individually, as well as to highlight potential trends in the market.
If you would like to discuss your thoughts and ideas about this report, please contact us. We are looking forward to hearing from you.
Wilson ChowPwC China & Hong Kong TMT Leader
Jianbin GaoPwC China Technology Industry Leader
5 MoneyTreeTM China TMT Report Q1/Q2 2015
In Q1, the deal value of overall PE/VC dropped significantly while the deal volume surged and single deal value decreased significantly. The average single deal value in the TMT industry remained on an upward trend.
In Q1 2015, despite PE/VC deal value seeing a 25% downturn quarter over quarter (QoQ), the deal volume increased by 52%, and the average single deal size was only US$9 million, a drop of 51% QoQ. TMT industry remained the high speed development trend of 2014, with the deal value significantly increasing by 61% to US$7.58 billion, and the deal volume increasing from 371 deals in Q4 2014 to 635 deals in Q1 2015, up 71%. Both the deal value and volume reached a new high since 2012. The average single deal value in the TMT industry was US$18.08 million, up 19% compared to Q1 2014.
TMT industry investments compared with all industries
2. PE/VC investments in the TMTindustry
Overall investment in H1 2015 had the following characteristics:
1. In H1 2015, overall PE/VC investment soared from the early lows and an investment spurt occurred in Q2 2015.
2. In H1 2015, the volume of overall investment enterprises was far above the full-year total of 2014 due to the implementation of entrepreneurship and innovation incentive policies encouraged by the government. The overall investments in H1 2015 slightly decreased by 7% to US$25.4 billion compared to H2 2014, but remained high. In terms of the specific industry, both deal volume and deal value in the Medical, Finance and TMT industries in H1 2015 increased significantly.
3. Investment enthusiasm was extremely high in H1 2015. As the hotspot of investment in all industries and under the impact of the wealth effect brought about by booming stock markets and the New Third Board, TMT industry investments reached their highest point since 2012 in both deal value and deal volume. In Q1, the deal value and volume in the TMT industry accounted for 90% and 70% of the total, respectively; in Q2, the proportions declined to 47% and 30% respectively. This was mainly due to the significant increase in Medical and Finance industry.
PwC Viewpoints
In Q2, the deal value and volume of overall PE/VC investments surged abruptly, and the overall trend was optimistic. The gross investment and average single investment in the TMT industry rose greatly.
In Q2 2015, PE/VC deal value significantly increased by 101% and deal volume increased by 80% QoQ to 1,623 deals, with an average single deal value US$10 million, an increase of 12% compared to Q1 2015. In Q2, the deal volume in the TMT industry was 491 deals. Despite a slight decrease in deal volume, the deal value and average single deal value still increased significantly to US$7.98 billion and US$20.26 million, respectively. Both overall PE/VC investment and TMT industry investment in H1 2015 were at a high level and continued the strong momentum of 2014. Deal value and volume in the TMT industry reached a historical high since 2012.
The overall industry investment in H1 2015 dropped compared to H2 2014, but remained on an upward trend. Total TMT deal value and volume accounted for 61% and 45% of overall industry investment, respectively.
6 MoneyTreeTM China TMT Report Q1/Q2 2015
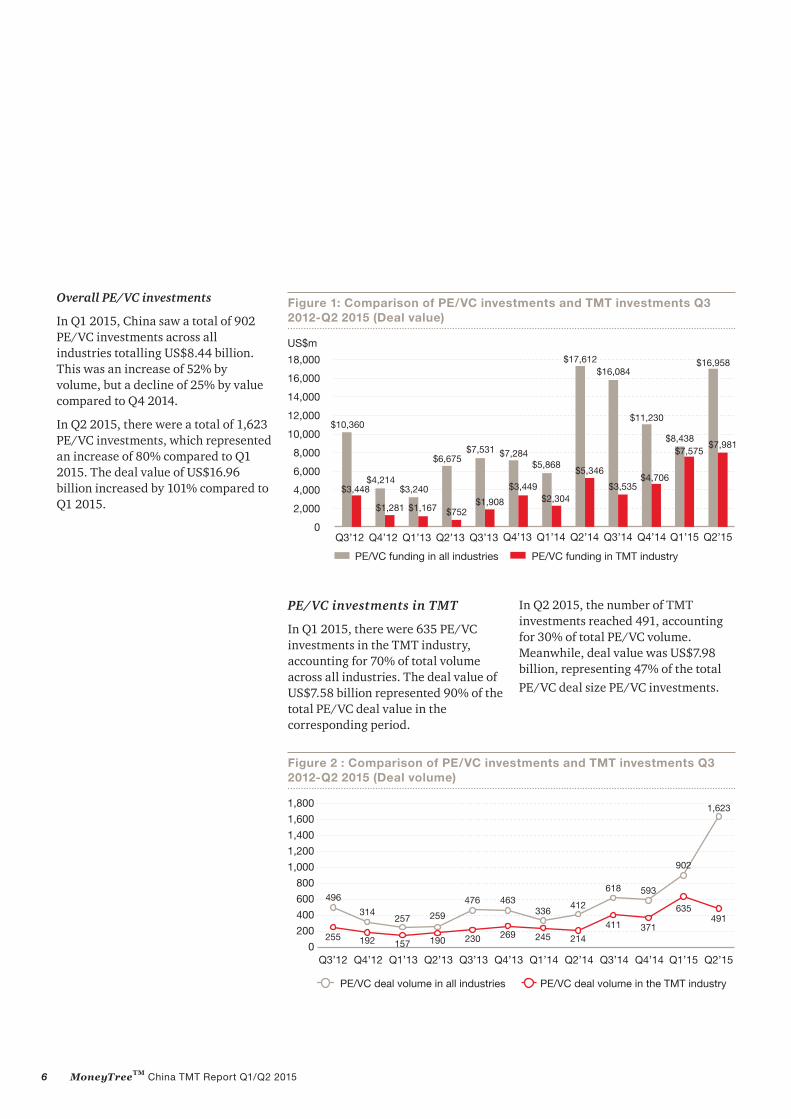
Overall PE/VC investments
In Q1 2015, China saw a total of 902 PE/VC investments across all industries totalling US$8.44 billion. This was an increase of 52% by volume, but a decline of 25% by value compared to Q4 2014.
In Q2 2015, there were a total of 1,623 PE/VC investments, which represented an increase of 80% compared to Q1 2015. The deal value of US$16.96 billion increased by 101% compared to Q1 2015.
PE/VC investments in TMT
In Q1 2015, there were 635 PE/VC investments in the TMT industry, accounting for 70% of total volume across all industries. The deal value of US$7.58 billion represented 90% of the total PE/VC deal value in the corresponding period.
In Q2 2015, the number of TMT investments reached 491, accounting for 30% of total PE/VC volume. Meanwhile, deal value was US$7.98 billion, representing 47% of the total PE/VC deal size PE/VC investments.
Figure 1: Comparison of PE/VC investments and TMT investments Q3 2012-Q2 2015 (Deal value)
PE/VC deal volume in all industries PE/VC deal volume in the TMT industry
7 MoneyTreeTM China TMT Report Q1/Q2 2015
Investments by quarter
In Q1 2015, there were 635 deals in the TMT industry, a rise of 71% over Q4 2014. The deal value amounted to US$7.58 billion, an increase of 61% compared to Q4 2014.
In Q2 2015, there were 491 deals, a drop of 23% compared to Q1 2015. The deal value amounted to US$7.98 billion, up 5% compared to Q1 2015.
In Q1, the deal volume reached the highest figure since 2012
In Q1, the deal value and volume in TMT industry rose sharply by 61% and 71%, respectively, compared to Q4 2014, and the deal volume reached a new record since 2012. There were 16 deals over US$100 million, and the largest single deal was US$1.63 billion.
In H1 2015, the high-speed development trends in the Chinese IT industry and Internet companies from 2014 continued, and the overall TMT investment increased rapidly, with the deal volume and value reaching the highest figure since 2012. It was also noted that there were three deals with single deal value exceeding US$1 billion in the Technology and Entertainment and Media sectors. From the point of PE/VC, the TMT industry will continue to be a hotspot.
In Q1 2015, investments were mostly concentrated in the Semiconductor, e-commerce and network marketing subsectors, while radio & television and digital television took over first place in Q2. There were 32 TMT deals with a single deal value of over US$100 million in H1 2015, a historical high since 2012. Therefore, the average single deal value in H1 2015 increased by 31% compared with H2 2014.
PwC Viewpoints
In Q2, the deal value reached almost US$8 billion, a historical high since 2012.
In Q2, the deal value in TMT industry increased by 5% to US$7.98 billion compared to Q1, hitting a record high since 2012, while deal volume decreased by 23% compared to Q1. Therefore, the average single deal value increased by 12% compared to Q1. In Q2, there were also 16 deals over US$100 million, and the largest single deal was US$1.28 billion.
The TMT industry is divided into the following sectors: Technology, Internet, Telecommunications and Mobile, and Entertainment and Media.
The average single deal value in H1 2015 was approximately twice that of H2 2014. The deal value in Q1 2015 was US$2.39 billion, second only to the historical high value of US$2.81 billion in Q2 2014. The deal value in Q2 2015 decreased by 32% compared to Q1; however, the deal volume increased by 5% to 125 deals compared to Q1 2015, a new record high since 2012.
The Internet sector has always been the hottest investment area in the TMT industry and was outstandingly successful in H1 2015. There were 288 investments with a total investment value of US$3.82 billion in Q1, reaching a record high since 2012. The deal volume and value in Q2 decreased by 20% and 28%, respectively, compared to Q1.
The Telecommunications and Mobile sector posted average performance in H1 2015. In Q1, average single investment value decreased by 72%; the deal value decreased by 48% compared to Q4 2014 but the deal volume increased by 84%. In Q2, the deal value and volume declined by 34% and 50%, respectively, compared to Q1 2015.
In Q2, the deal volume in the Entertainment and Media sector increased by 55%, and the deal value surged 4,279% QoQ to US$2.74 billion, reaching the magnitude of billions for the first time.
In Q1 2015, among the 16 deals over US$100 million, the Internet sector, Technology sector, and the Telecommunications and Mobile sector accounted for 75%, 19% and 6% respectively. In Q2, among the 16 deals over US$100 million, the Internet sector, the Telecommunications and Mobile sector, the Entertainment and Media sector, and the Technology sector represented 44%, 25%, 19% and 12%, respectively.
Overall, in H1 2015:
The Internet still occupied the dominant position in terms of deal volume and value;.
The Entertainment and Media sector emerged as a dark horse. In Q2, the deal value in the Entertainment and Media industry increased significantly, almost leveling with the Internet industry. It is also worth noting that there were two investments in content companies with single deal values of over US$1 billion, representing the emphasis on the content of entertainment and media. The main investment targets in Entertainment and Media sector were still large-scale enterprises. Usually, the deal volume was small but the single deal value was large.
Average single deal value in the Technology industry remained high. In H1 2015, the largest investment deal of US$1.63 billion, which was made in an electronic and optical equipment enterprise mainly for the manufacturing and development of integrated circuits, was in the Technology industry, keeping the investments in the Technology industry at a high level.
Investment value of H1 2015 in the Telecommunication industry was relative low compared with that of H2 2014; however, the investment quantity was only secondary to the Internet industry, showing a good increase.
The deal value in Telecommunications and Mobile sector declined, compared to H2 2014. This was due to the high valuation of enterprises in this sector in Q1 2015, but the investors cooled down in Q2 2015.Meanwhile the deal volume was only second to that in Internet sector, maintaining a good trend.
PwC Viewpoints
Figure 4: Deal value comparison in TMT sectors Q3 2012-Q2 2015
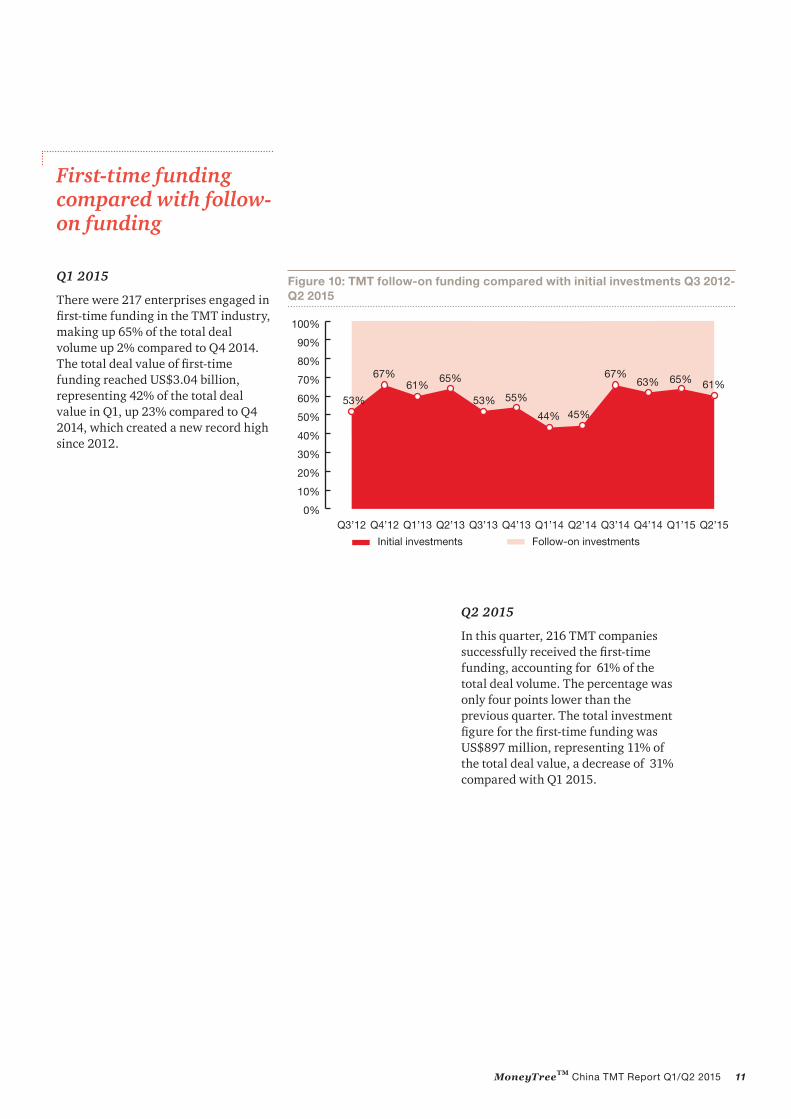
First-time funding compared with follow-on funding
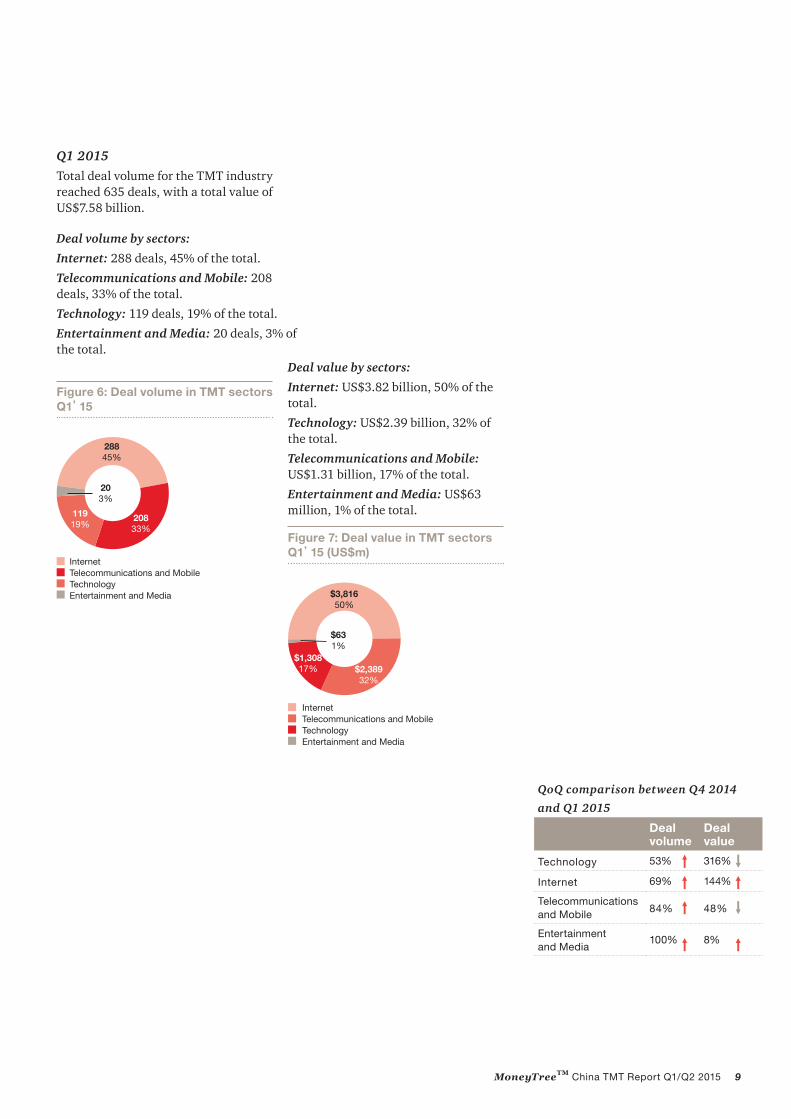
Q1 2015
There were 217 enterprises engaged in first-time funding in the TMT industry, making up 65% of the total deal volume up 2% compared to Q4 2014. The total deal value of first-time funding reached US$3.04 billion, representing 42% of the total deal value in Q1, up 23% compared to Q4 2014, which created a new record high since 2012.
Q2 2015
In this quarter, 216 TMT companies successfully received the first-time funding, accounting for 61% of the total deal volume. The percentage was only four points lower than the previous quarter. The total investment figure for the first-time funding was US$897 million, representing 11% of the total deal value, a decrease of 31% compared with Q1 2015.
12 MoneyTreeTM China TMT Report Q1/Q2 2015
Q1 2015
Enterprises engaged in first-time funding by sectors:
Internet: 101 enterprises, funding total US$683 million.
Telecommunications and Mobile: 46 enterprises, funding total US$228 million.
Entertainment and Media: 11 enterprises, funding total US$18 million.
For first-time funding, 139 enterprises were at the early stage, accounting for 64%; 61 enterprises were at the expansion stage, accounting for 28% and 16 enterprises were at late stage, accounting for 7%.
(1 at the undisclosed stage, accounting for 1%)
Q2 2015
Enterprises engaged in first-time funding by sector:
Telecommunications and Mobile: 40 enterprises, funding US$125 million.
Entertainment and Media: 14 enterprises, funding US$73 million.
For first-time funding, 118 enterprises were at early stage, accounting for 55%; 56 were at the expansion stage, accounting for 26 % and 42 were at late stage, accounting for 19%.
By comparing first-time TMT investments and subsequent investments, we find:
1. In Q1 2015, the volume of first-time investments increased by 41% QoQ, and the deal value significantly increased by 249% to US$3.04 billion, mainly because of the A-round investment of US$1.63 billion in the Technology industry in Q1 2015. In Q2 2015, the volume of first-time investments was almost the same as that of Q1, while the deal value of first-time investments declined by 70% due to the lack of a single large deal.
2. Apart from the impact of the above-mentioned single large deals in the Technology industry, Internet enterprises were far ahead of the other three segments in terms of both volume and value.
3. In H1 2015, first-time investments continued to be as strong as in H2 2014, accounting for over 60% of the total investments, which not only evidenced the rapid replacement rate in the TMT industry, but also indicated investors’ preference for early-stage projects.
PwC Viewpoints
Q1 2015
First-time funding summary (US$)
Number of enterprises
<= 1m 49
1m-5m 96
>5m-10m 19
>10m 22
N/A 31
Q2 2015
First-time funding summary (US$)
Number of enterprises
<= 1m 51
1m-5m 90
>5m-10m 23
>10m 16
N/A 36
59
46
10111
8874
40 14
13 MoneyTreeTM China TMT Report Q1/Q2 2015
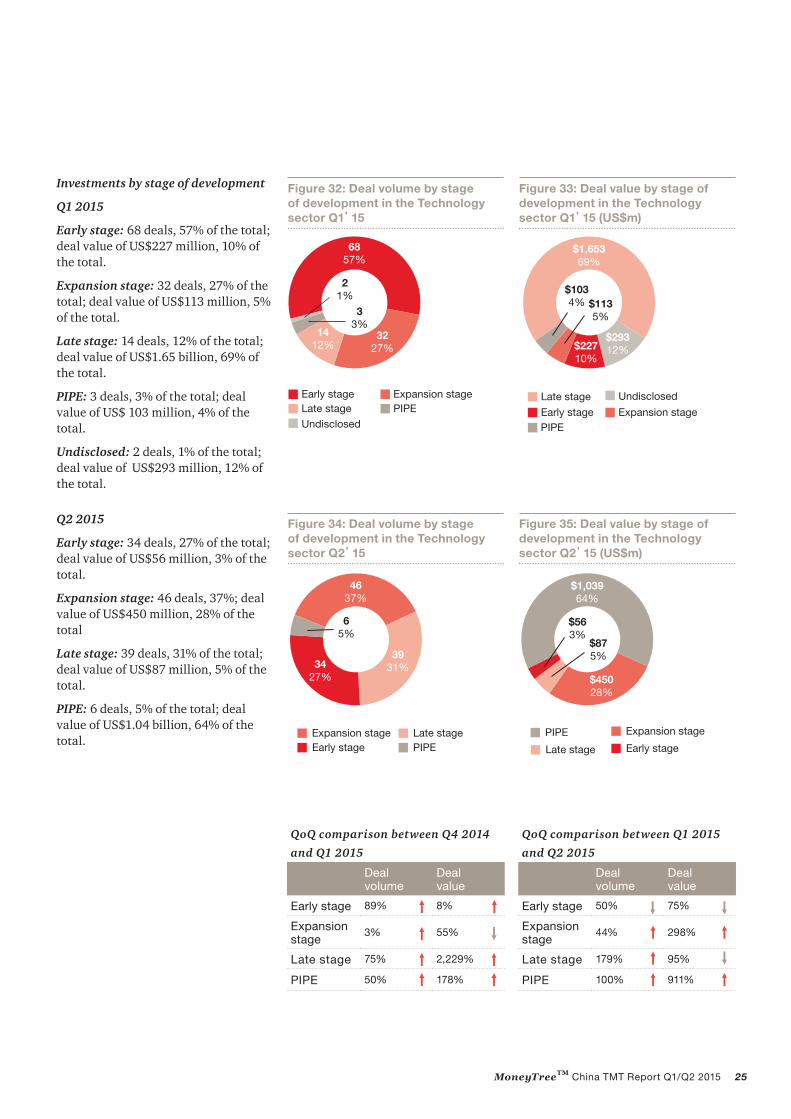
Investments by stage of development
The deal volume for early-stage investments continued to rise in H1, while the deal value declined slightly.
In the four stages of investment, the deal volume for early-stage investments took the lead as usual, accounting for 75% and 61% of the total in Q1 and Q2 2015, respectively. In Q1 2015, early-stage investments reached US$1.61 billion, accounting for 21% of the total, with almost the same deal value as the investments in Q4 2014 which ranked the highest since 2012.
In Q1 and Q2, the deal volume and value for expansion stage went up steadily, with little fluctuation.
The expansion stage is also an attractive stage for investors. In Q1 and Q2 2015, the deal volumes of expansion-stage investments were almost the same as the early-stage investments and the deal value of expansion-stage investment exceeded that of early-stage investment.
The deal value of the expansion stage in Q1 and Q2 was US$2.8 billion and US$1.93 billion, respectively, and the deal value in Q1 reached a record high since 2012. The deal volume in Q1 increased by 34% compared to Q4 2014, while the deal volume in Q2 only went up 2% compared to Q1.
Deal value for late-stage investments in Q1 took the lead, seeing significant growth, while the deal value in Q2 decreased abruptly. Deal volume continued to hit new records in H1 2015 since 2012.
The deal value in Q1 2015 was US$2.61 billion, accounting for 35% of the total, a historic high since 2012, mainly due to two huge investments with values of US$1.63 billion and US$800 million, respectively, at the late stage. Enterprises at the late stage might regain the trust of investors due to their potential for expanding on diversified network platforms and stable operating basis. However, the deal value in Q2 decreased by 92% compared to Q1. In 2015, the deal volume in H1 continued to grow, and the late stage investments in Q2 were 62 deals, having broken the previous 2012 record.
PIPE deal value increased significantly with several investments over US$100 million in H1.
Overall, the deal volume of PIPE investments was low, but rose further in H2 2015. However, the deal value at PIPE stage was capricious; the deal value in Q2 reached US$4.27 billion, not only creating a historical high since 2012 but also accounting for 54% of the total with a huge growth of 3,788% compared to Q1. In Q2 2015, the transactions with deal values ranking as the top two were PIPE transactions.
Figure 11: TMT investments by stage of development Q3 2012-Q2 2015 (Deal value)
Total deal volume for the TMT industry reached 635 deals, with a total value of US$7.58 billion.
Deal volume by stage of development:
Early stage: 477 deals, 75% of the total.
Expansion stage: 118 deals, 19% of the total.
Late stage: 28 deals, 4% of the total.
PIPE: 4 deals, 1% of the total
Undisclosed: 8 deals, 1% of the total.
Figure 14: Deal value in TMT industry by stage of development Q1’15(US$m)
PIPE
Early stageLate stage
Expansion stage
Undisclosed
$4466%$110
1%
$2,80137%
$2,61735%
$1,60821%
Deal value by stage of development
Late stage: US$2.61 billion, 35% of the total.
Early stage: US$1.61 billion, 21% of the total.
Expansion stage: US$2.8 billion, 37% of the total.
PIPE: US$110 million, 1% of the total
Undisclosed: US$446 million, 6% of the total.
QoQ comparison between Q4 2014 and Q1 2015
Deal volume
Deal value
Early stage 84% 31%
Expansion stage
34% 31%
Late stage 75% 2,150%
PIPE 20% 7%
Figure 13: Deal volume in TMT industry by stage of development Q1’15
47775%
11819%
81% 4
1%
284%
PIPE
Early stage
Late stageExpansion stage
Undisclosed
15 MoneyTreeTM China TMT Report Q1/Q2 2015
Q2 2015
Total deal volume for the TMT industry reached 491 deals, with a total value of US$7.98 billion.
Deal volume by stage of development
Early stage: 297 deals, 60% of the total.
Expansion stage: 119 deals, 24% of the total.
Late stage: 62 deals, 13% of the total.
PIPE: 12 deals, 2% of the total.
Undisclosed: 1 deal, 1% of the total.
Deal value by stage of development
Early stage: US$1.59 billion, 20% of the total.
Expansion stage: US$1.93 billion, 24% of the total.
PIPE: US$4.27 billion, 54% of the total.
Late stage: US$198 million, 2% of the total.
Figure 15: Deal volume in TMT industry by stage of development Q2’15
29760%
11924%
6213%
11%
122%
PIPE
Early stage
Late stageExpansion stage
Undisclosed
Figure 16: Deal value in TMT industry by stage of development Q2’15 (US$m)
$4,26954%
$1,92724%
$1,58720%
$1982%
PIPE
Early stageLate stage
Expansion stage
QoQ comparison between Q1 2015 and Q2 2015
Deal volume
Deal volume
Early stage传 38% 1%
Expansion stage传传
1% 31%
Late stage传 121% 92%
PIPE 200% 3,788%
16 MoneyTreeTM China TMT Report Q1/Q2 2015
Investments by region
In H1 2015, 831 of the 1,126 TMT deals gave details on the regions where investments took place. The top five investment regions in China in the TMT industry were, by deal volume, Beijing with 313 (accounting for 28% of the total deal volume), Shanghai with a modest 146, Shenzhen with 74, Zhejiang Province with 60 and Guangdong Province (except Shenzhen) with 53. The total deal volume of the top five regions was 646, accounting for 57% of the total.
In terms of investments regions, both the deal volume and value in Beijing were far above other provinces in H1 2015; Beijing was still the core area of the Chinese TMT industry, and it is estimated that it would be difficult to surpass by other regions in the short term.
In H1 2015, the deal volume and value in Shanghai saw a significant increase; Fujian Province also surged abruptly with deal value surpassing Shenzhen. Overall, TMT investments were mostly concentrated in the four first-tier cities of Beijing, Shanghai, Guangzhou and Shenzhen and the provinces located on the east coast of China.
Total deal value of investments which disclosed their region was US$13.83 billion. In terms of deal value, the top two rankings had no change. Zhejiang Province surpassed Shenzhen and ranked third. The top five regions by deal value had an aggregated deal value of US$11.76 billion, accounting for 75% of the total. Beijing took the top spot with an impressive sum of US$6.16 billion, and Shanghai ranked second with US$2.74 billion, followed by Zhejiang Province with total of
PwC Viewpoints
US$1.4 billion. Fujian Province and Shenzhen ranked fourth and fifth, respectively, with an aggregated deal value of US$1.45 billion.
Figure 17: The top six regions for TMT investments in Q1/Q2’15 (Deal volume/Deal value)
US$m
Deal volume
Beijing
Shanghai
Shenzhen
Zhejiang Province
Fujian Province
Guangdong Province
313
146
60
20
74
$6,162
$1,400
$835
$2,743
$619
53 $518
0 1,000 3,000 4,000 6,000 7,0005,0002,000
17 MoneyTreeTM China TMT Report Q1/Q2 2015
Exits by quarter
3. PE/VC exits in the TMT industry
In H1 2015, TMT exit volume hit a record high since 2012.
In Q1 2015, there were 23 exits; and one quarter later, the number rose to 26. There were 34 exits in H2 2014. In general, the total amount of exits in H1 2015 increased by 44% compared to H2 2014.
In H1 2015, exits via IPO reached 34, accounting for 69% of all TMT industry exits and once again becoming the main method for exit.
With respect to the listing areas, IPO in the US was not a popular exit strategy just as we previously predicted. In H1 2015, the Chinese A-share (especially GEM) market was hot, and IPO volume was up to 28 deals, accounting for 82% of the total. The privatization of the companies listed overseas will keep occuring, but Chinese TMT companies haven’t stopped going abroad for IPO listing. From the perspective of number and scale, domestic A Share IPOs will become the main trend; from the point of PE/VC, the TMT industry will continue to be a hotspot.
The domestic capital market provides various trading platforms for TMT companies in different stages. In H1 2015, IPOs in both the TMT industry and the Chinese A-share market reached historical highs since 2012. However, due to the re-suspension of the Chinese A-Share market in July, investments and exits in H2 2015 are expected to decrease.
PwC Viewpoints
Figure 18: Exit volume in the TMT industry Q3 2012-Q2 2015
Since the beginning of 2014, due to the restart of the A-share market in China and the confidence Chinese companies have in the American capital market, the number of IPOs and its ratios among the total exits rose significantly. This optimistic trend continued in H1 2015, and IPOs rose dramatically, accounting for 77% of all exits, a new high since H2 2012. In H1 2015, IPOs surpassed M&A as the main form of exit.
Exits by type
M&A accounted for 22% and 19% of total exits in Q1 and Q2 2015, respectively, a significant decrease compared to 61% in Q4 2014.
Management buy-out and secondary sale represent a small percentage, normally no more than 20%, of the total exits. There were only four secondary sales and no buy-outs in Q1, and there was only one buy-out and no secondary sale in Q2.
Figure 19: TMT exit trends by type Q3 2012-Q2 2015
IPO Strategic sale Management buy-out Secondary sale
19 MoneyTreeTM China TMT Report Q1/Q2 2015
In Q1 2015, there were 23 exits in total.
IPO: 14 exits, 61% of the total.
Strategic sale: 5 exits, 22% of the total.
Secondary sale: 4 exits, 17% of the total.
In Q2 2015, there were 26 exits in total.
IPO: 20 exits, 77% of the total.
Strategic sale: 5 exits, 19% of the total.
Management buy-out: (including buy-back): 1 exit, 4% of the total.
Listing of Chinese TMT companies in mainland China was unprecedented since 2012.
Since 2012, there has been a trend of Chinese TMT companies listing in the US. In Q2 2014 US-listed Chinese TMT companies reached a record high since 2012, which was due mainly to simpler procedures, higher liquidity levels, and no rigorous profitability requirement relating to listing in the US. However, new technology and business models, represented by the internet subsector, have been profoundly changing the traditional industries of China. Meanwhile, the relatively high valuation given to the TMT industry in China’s capital market, Chinese government encouraging public listing of Small and Medium Enterprises (SME) in recent years, and the disadvantages related to the listing in American exchanges (e.g., high initial public offerings costs and relatively low valuation) encouraged more and more enterprises to seek being listed in mainland China.
In terms of choices of listing areas, in Q1 2015, 86% of TMT companies were listed domestically and the remaining 14% listed in Hong Kong.
In Q2 2015, 80% of TMT companies were listed in mainland China, 10% of listings were on NASDAQ and NYSE, and another 10% were listed in Hong Kong.
Thus it can be seen that the US markets are no longer the first choice. When the situation for domestic stock market is favorable, TMT companies may prefer to list in mainland China.
Among the TMT companies listed domestically, 64% chose to list on the GEM Board in Shenzhen, 25% chose to list on the main board of the Shanghai Stock Exchange and 11% chose to list on the SME board in Shenzhen.
Figure 20: Comparison of TMT exits in mainland China, Hong Kong and US capital markets Q3 2012-Q2 2015
Q2’13
100%
Q3’12 Q4’12 Q1’13
0%100% 100%
Q1’14 Q2’14
Q3’13 50% Q4’13
43%
57%
90%
10%
64%
27%9%
Q4’14 Q1’15 Q2’15Q3’14
64%
27%9%
50% 57%
29%14%25%25%
86% 80%
10%10%14%
Mainland China Hong Kong US
Figure 21: Exit types in the TMT industry Q1’15
1461%
417%
522%
IPOStrategic sale
Secondary sale
Figure 22: Exit types in the TMT industry Q2’15
2077%
519%
14%
IPOStrategic sale Management buy-out
20 MoneyTreeTM China TMT Report Q1/Q2 2015
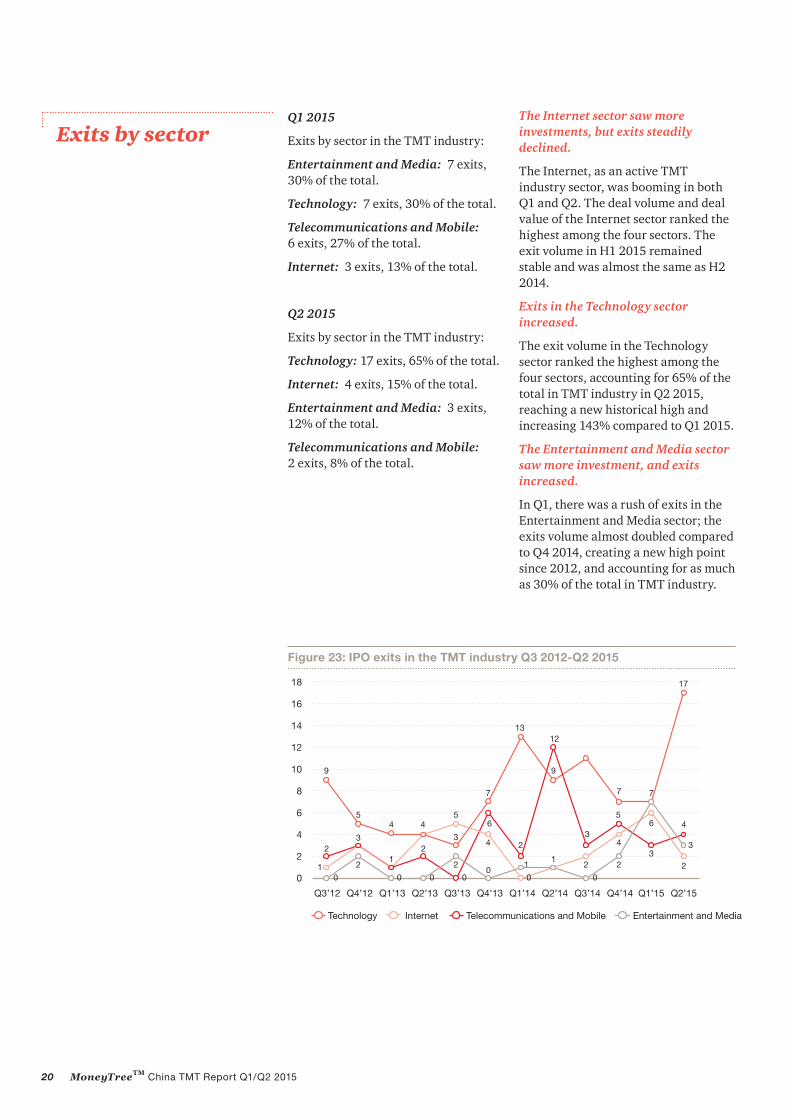
The Internet sector saw more investments, but exits steadily declined.
The Internet, as an active TMT industry sector, was booming in both Q1 and Q2. The deal volume and deal value of the Internet sector ranked the highest among the four sectors. The exit volume in H1 2015 remained stable and was almost the same as H2 2014.
Exits in the Technology sector increased.
The exit volume in the Technology sector ranked the highest among the four sectors, accounting for 65% of the total in TMT industry in Q2 2015, reaching a new historical high and increasing 143% compared to Q1 2015.
The Entertainment and Media sector saw more investment, and exits increased.
In Q1, there was a rush of exits in the Entertainment and Media sector; the exits volume almost doubled compared to Q4 2014, creating a new high point since 2012, and accounting for as much as 30% of the total in TMT industry.
Exits by sectorQ1 2015
Exits by sector in the TMT industry:
Entertainment and Media: 7 exits, 30% of the total.
Technology: 7 exits, 30% of the total.
Telecommunications and Mobile: 6 exits, 27% of the total.
Internet: 3 exits, 13% of the total.
Q2 2015
Exits by sector in the TMT industry:
Technology: 17 exits, 65% of the total.
Internet: 4 exits, 15% of the total.
Entertainment and Media: 3 exits, 12% of the total.
Telecommunications and Mobile: 2 exits, 8% of the total.
Figure 23: IPO exits in the TMT industry Q3 2012-Q2 2015
Technology Internet Telecommunications and Mobile Entertainment and Media
21 MoneyTreeTM China TMT Report Q1/Q2 2015
4. Sector focus: Technology, Internet, and Telecommunications and Mobile
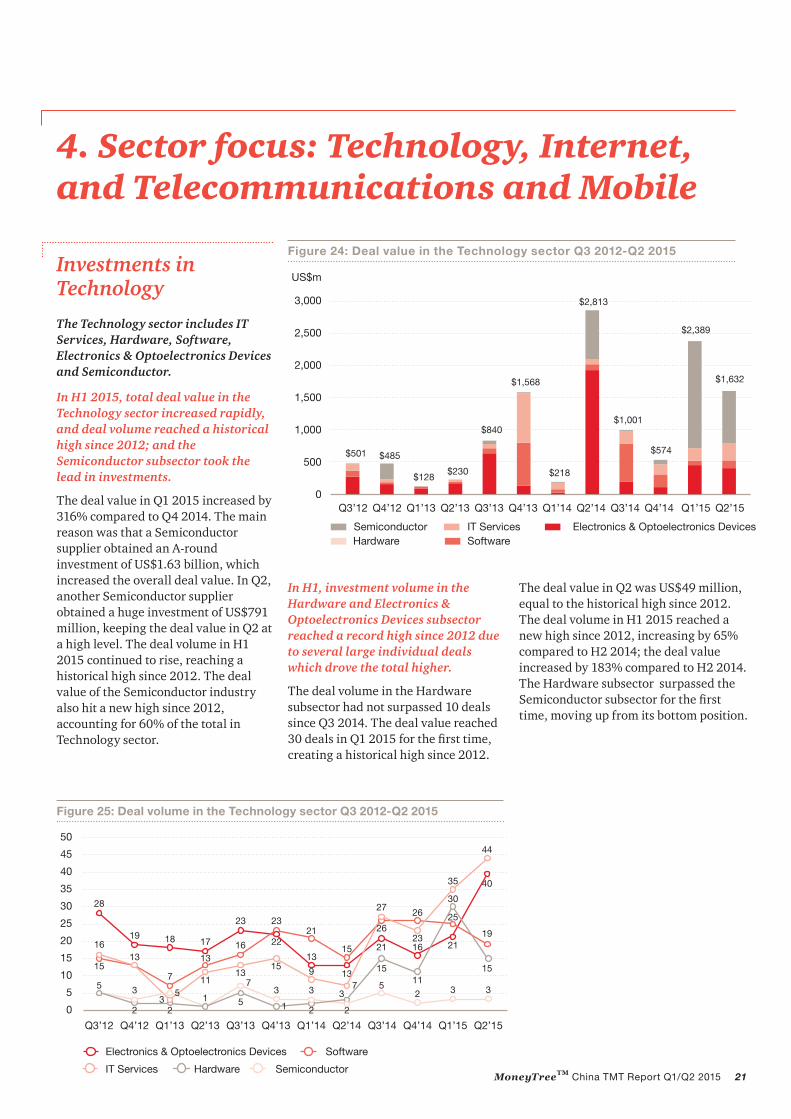
Investments in Technology
The Technology sector includes IT Services, Hardware, Software, Electronics & Optoelectronics Devices and Semiconductor.
In H1 2015, total deal value in the Technology sector increased rapidly, and deal volume reached a historical high since 2012; and the Semiconductor subsector took the lead in investments.
The deal value in Q1 2015 increased by 316% compared to Q4 2014. The main reason was that a Semiconductor supplier obtained an A-round investment of US$1.63 billion, which increased the overall deal value. In Q2, another Semiconductor supplier obtained a huge investment of US$791 million, keeping the deal value in Q2 at a high level. The deal volume in H1 2015 continued to rise, reaching a historical high since 2012. The deal value of the Semiconductor industry also hit a new high since 2012, accounting for 60% of the total in Technology sector.
In H1, investment volume in the Hardware and Electronics & Optoelectronics Devices subsector reached a record high since 2012 due to several large individual deals which drove the total higher.
The deal volume in the Hardware subsector had not surpassed 10 deals since Q3 2014. The deal value reached 30 deals in Q1 2015 for the first time, creating a historical high since 2012.
Figure 24: Deal value in the Technology sector Q3 2012-Q2 2015
The deal value in Q2 was US$49 million, equal to the historical high since 2012. The deal volume in H1 2015 reached a new high since 2012, increasing by 65% compared to H2 2014; the deal value increased by 183% compared to H2 2014. The Hardware subsector surpassed the Semiconductor subsector for the first time, moving up from its bottom position.
22 MoneyTreeTM China TMT Report Q1/Q2 2015
Deal volume and value
Q1 2015
There were 119 deals in the Technology sector, with a total value of US$2.39 billion.
IT Services: 35 deals, 29% of the total; deal value of US$ 193 million, 8% of the total.
Software: 25 deals, 21% of the total; deal value of US$68 million, 3% of the total.
Electronics & Optoelectronics Devices: 21 deals, 17% of the total; deal value of US$443 million, 19% of the total.
Hardware: 30 deals, 25% of the total; deal value of US$32 million, 1% of the total.
Semiconductor: 3 deals, 3% of the total; deal value of US$1.63 billion, 68% of the total.
Undisclosed: 5 deals, 5% of the total; deal value of US$18 million, 1% of the total.
The average single deal value in the IT Services and Software subsectors declined slightly.
In H1 2015, despite the deal volume in IT Services rising continuously and creating historical highs since 2012, the growth in deal value was not as good as the growth in deal volume, resulting in the single deal value decreasing compared to 2014. The deal volume and value in the Software subsector were low and fell further in H1 2015.
The investment in the Semiconductor subsector was outstanding; both the total deal value and the average single investment value took the lead.
The outstanding performance of the Semiconductor subsector in 2014 continued in H1 2015. Even though there were only six deals, the total deal value reached US$2.43 billion, with the average single investment value reaching US$405 million. Total deals value, average single investment value and the ratio of the total Technology investment all reached historical highs since 2012. In H1 2015, the investor in
the two largest deals in the Semiconductor subsector was a state-owned investing fund that mainly invests in companies which performed well in integrated circuit industrial chains, which demonstrates the significant importance and investment attached to the industrial development of integrated circuits from the perspective of the Chinese national strategy.
Figure 26: Deal volume by Technology subsector Q1’15
Hardware
Semiconductor
Undisclosed
IT Services
Software
Electronics & Optoelectronics Devices
33%
55%
3529%
2521%
2117%
3025%
Figure 27: Deal value by Technology subsector Q1’15 (US$m)
There were 125 deals in the Technology sector, with a total value of US$1.63 billion.
Software: 19 deals, 15% of the total; deal value of US$118 million, 7% of the total.
IT services: 44 deals, 35% of the total; deal value of US$265 million, 16% of the total.
Electronics & Optoelectronics devices: 40 deals, 32% of the total; deal value of US$399 million, 24% of the total.
Hardware: 15 deals, 12% of the total; deal value of US$49 million, 3% of the total.
Semiconductor: 3 deals, 3% of the total; deal value of US$794 million, 49% of the total.
Undisclosed: 4 deals, 3% of the total; deal value of US$7 million, 1% of the total.
Figure 28: Deal volume by Technology subsector Q2’15
Figure 29: Deal value by Technology subsector Q2’15 (US$m)
HardwareSemiconductor
IT Services
Software
Electronics & Optoelectronics Devices
4032%
4435% 19
15%
1512%
33%
43%
Undisclosed
HardwareSemiconductor
IT Services SoftwareElectronics & Optoelectronics Devices
$71%
$39924%
$1187%
$26516%
$79449%
$493%
Undisclosed
QoQ comparison between Q1 2015 and
Q2 2015
Dealvolume
Deal value
Electronics & Optoelectronics Devices 传传传传传
90% 10%
Software 24% 74%
IT Services传传 26% 37%
Semiconductor 传 — 51%
Hardware 50% 54%
24 MoneyTreeTM China TMT Report Q1/Q2 2015
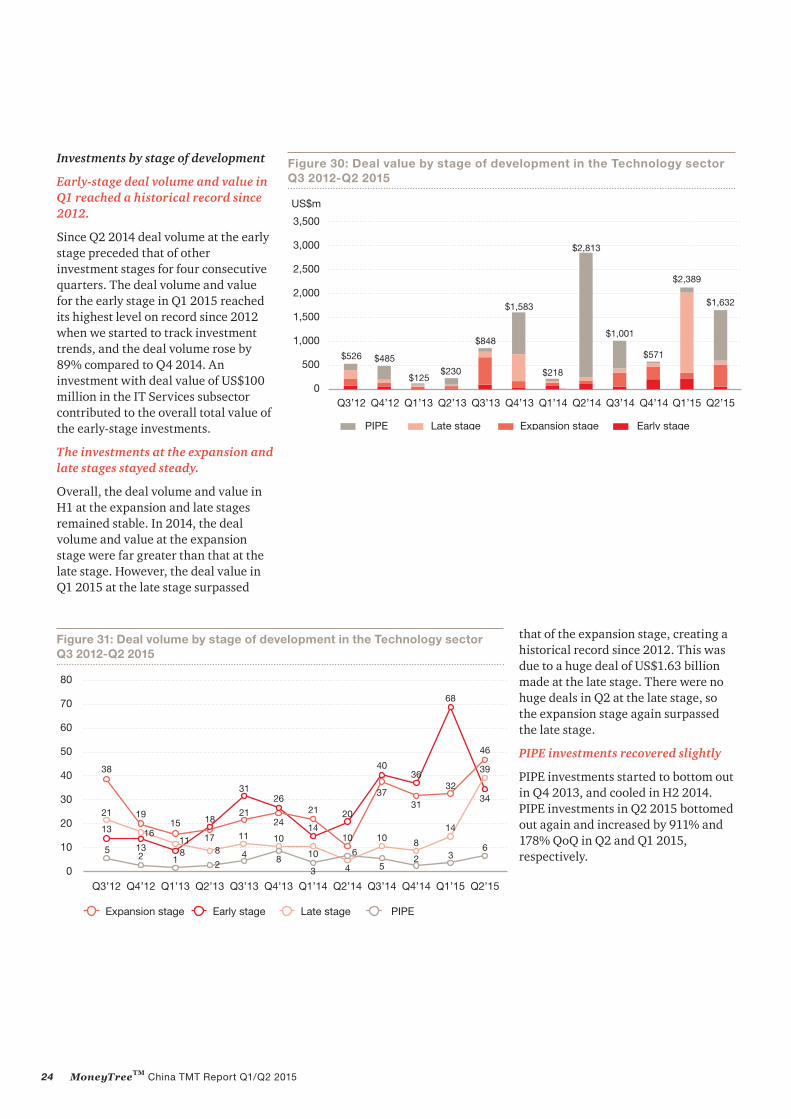
Investments by stage of development
Early-stage deal volume and value in Q1 reached a historical record since 2012.
Since Q2 2014 deal volume at the early stage preceded that of other investment stages for four consecutive quarters. The deal volume and value for the early stage in Q1 2015 reached its highest level on record since 2012 when we started to track investment trends, and the deal volume rose by 89% compared to Q4 2014. An investment with deal value of US$100 million in the IT Services subsector contributed to the overall total value of the early-stage investments.
The investments at the expansion and late stages stayed steady.
Overall, the deal volume and value in H1 at the expansion and late stages remained stable. In 2014, the deal volume and value at the expansion stage were far greater than that at the late stage. However, the deal value in Q1 2015 at the late stage surpassed
that of the expansion stage, creating a historical record since 2012. This was due to a huge deal of US$1.63 billion made at the late stage. There were no huge deals in Q2 at the late stage, so the expansion stage again surpassed the late stage.
PIPE investments recovered slightly
PIPE investments started to bottom out in Q4 2013, and cooled in H2 2014. PIPE investments in Q2 2015 bottomed out again and increased by 911% and 178% QoQ in Q2 and Q1 2015, respectively.
Figure 30: Deal value by stage of development in the Technology sector Q3 2012-Q2 2015
Figure 34: Deal volume by stage of development in the Technology sector Q2’15
Figure 35: Deal value by stage of development in the Technology sector Q2’15 (US$m)
46
37%
65%
3931%34
27%
PIPEEarly stageExpansion stage Late stage
$1,03964%
$563%
$875%
$45028%
PIPE
Early stage
Expansion stage
Late stage
QoQ comparison between Q4 2014
and Q1 2015
Deal volume
Deal value
Early stage 89% 8%
Expansion stage技
3% 55%
Late stage 75% 2,229%
PIPE 50% 178%
QoQ comparison between Q1 2015
and Q2 2015
Deal volume
Deal value
Early stage 50% 75%
Expansion stage技
44% 298%
Late stage 179% 95%
PIPE 100% 911%
26 MoneyTreeTM China TMT Report Q1/Q2 2015
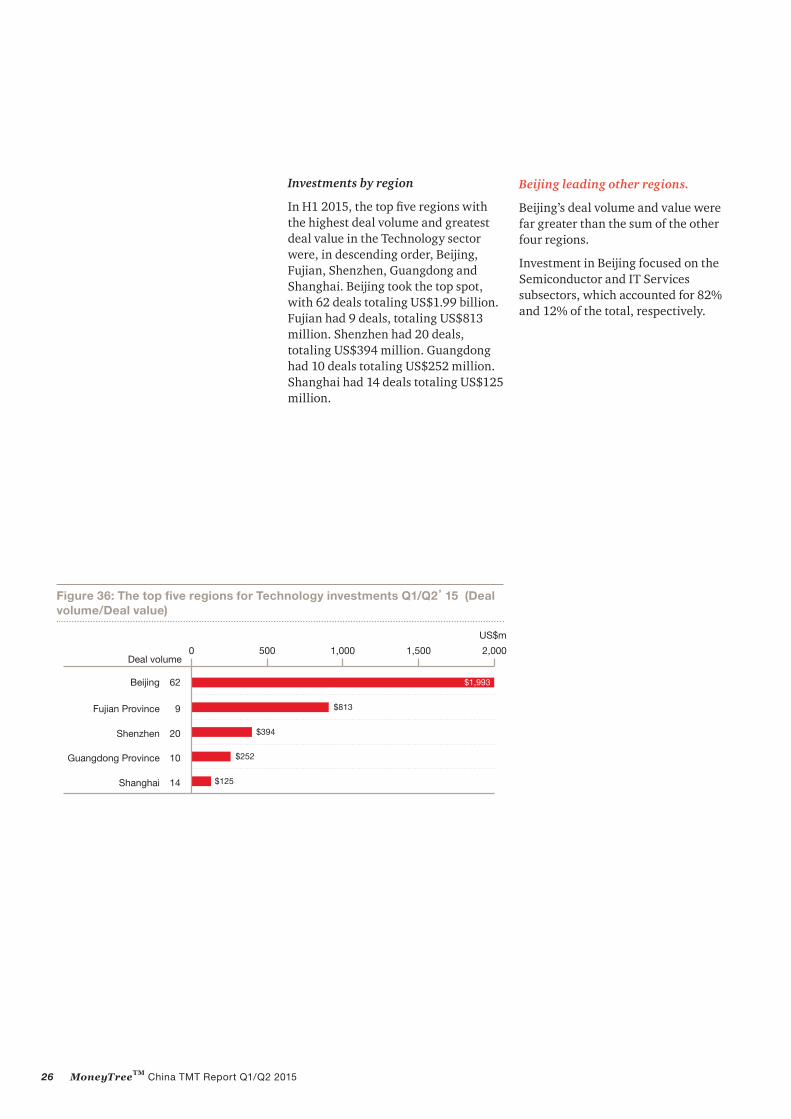
Investments by region
In H1 2015, the top five regions with the highest deal volume and greatest deal value in the Technology sector were, in descending order, Beijing, Fujian, Shenzhen, Guangdong and Shanghai. Beijing took the top spot, with 62 deals totaling US$1.99 billion. Fujian had 9 deals, totaling US$813 million. Shenzhen had 20 deals, totaling US$394 million. Guangdong had 10 deals totaling US$252 million. Shanghai had 14 deals totaling US$125 million.
Beijing leading other regions.
Beijing’s deal volume and value were far greater than the sum of the other four regions.
Investment in Beijing focused on the Semiconductor and IT Services subsectors, which accounted for 82% and 12% of the total, respectively.
Figure 36: The top five regions for Technology investments Q1/Q2’15 (Deal volume/Deal value)
62 $1,993
9 $813
20 $394
10 $252
14 $125
0 1,000 2,000500 1,500Deal volume
Beijing
Shanghai
Shenzhen
Guangdong Province
Fujian Province
US$m
27 MoneyTreeTM China TMT Report Q1/Q2 2015
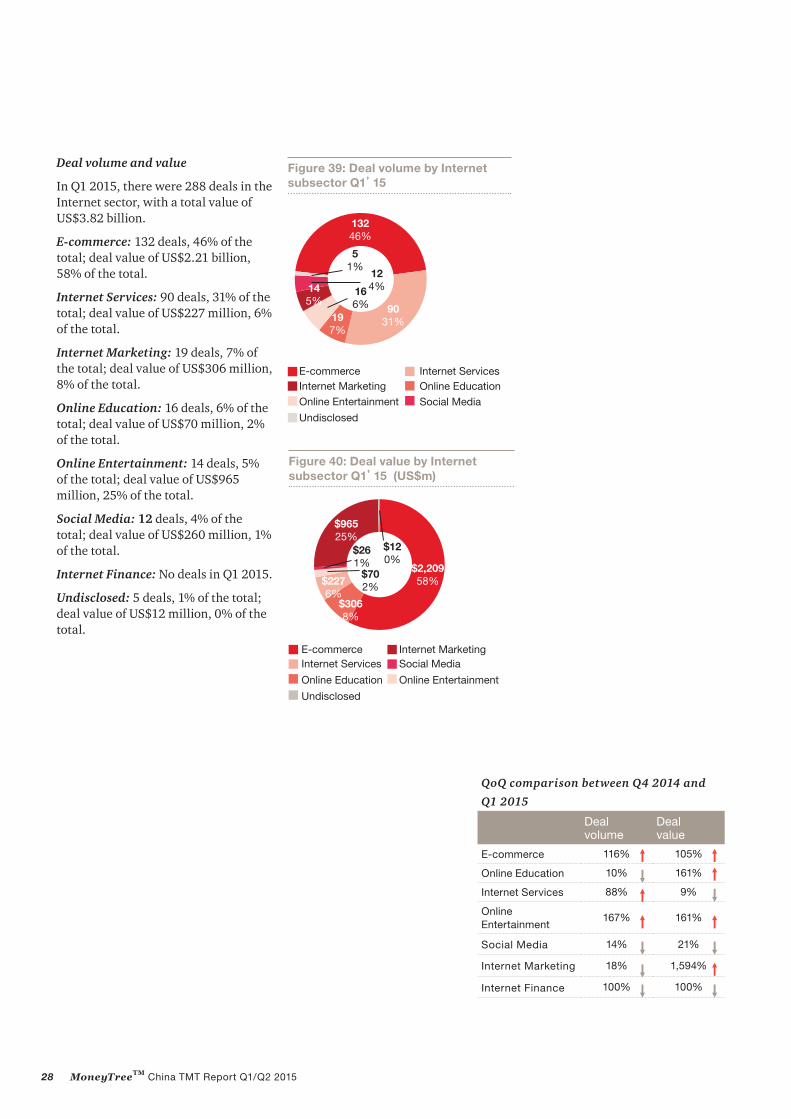
The E-commerce subsector became the most active in the Internet sector, and the total deal volume and value in H1 2015 reached a historical high level since we began tracking in 2012.
As the leader in the Internet sector, E-Commerce kept increasing in H1 2015. The deal volume in Q1was 132 deals and rose by 116% compared to Q4 2014, and the deal value was US$2.21 billion and rose by 105% QoQ, which was the best performance since 2012. Currently, most of the E-commerce enterprises remain at the early and expansion stages.Specifically, 77% of deals stayed at the early stage, 19% stayed at the expansion stage, and only 3% stayed at the late stage. In H1 2015, the investments with deal value over US$100 million amounted to 12 deals.
Investments in Internet
The Internet sector includes E-commerce, Online Education, Internet Services, Online Entertainment, Social Media, Internet Marketing and Internet Finance.
In H1, deal value in Internet Marketing and Internet Services was over US$100 million, which created a new record since 2012.
Internet Marketing mainly consisted of consulting firms, advertising agencies and organizations of network marketing services. There were 14 deals in Internet Marketing in Q1 and total deal value was US$965 million, representing a historical high since 2012. In H1, the biggest single deal value of the Internet sector was US$800 million, which belonged to the subsector of Internet Marketing.
In Q2, the deal value of Internet Services was over US$1 billion and reached US$1.06 billion, which was mainly due to two PIPE.
Figure 37: Deal value in the Internet sector Q3 2012-Q2 2015
In Q1 2015, there were 288 deals in the Internet sector, with a total value of US$3.82 billion.
E-commerce: 132 deals, 46% of the total; deal value of US$2.21 billion, 58% of the total.
Internet Services: 90 deals, 31% of the total; deal value of US$227 million, 6% of the total.
Internet Marketing: 19 deals, 7% of the total; deal value of US$306 million, 8% of the total.
Online Education: 16 deals, 6% of the total; deal value of US$70 million, 2% of the total.
Online Entertainment: 14 deals, 5% of the total; deal value of US$965 million, 25% of the total.
Social Media: 12 deals, 4% of the total; deal value of US$260 million, 1% of the total.
Internet Finance: No deals in Q1 2015.
Undisclosed: 5 deals, 1% of the total; deal value of US$12 million, 0% of the total.
Figure 39: Deal volume by Internet subsector Q1’15
13246%
145%
124%16
6%
51%
9031%19
7%
E-commerce Internet ServicesInternet Marketing
Social Media
Online Education Online Entertainment
Undisclosed
Figure 40: Deal value by Internet subsector Q1’15 (US$m)
E-commerceInternet Services
Internet MarketingSocial Media
Online Education Online Entertainment
$702%
$120%
$2,20958%
$96525%
$3068%
$2276%
$261%
Undisclosed
QoQ comparison between Q4 2014 and
Q1 2015
Deal volume
Dealvalue
E-commerce 116% 105%
Online Education 10% 161%
Internet Services 88% 9%
Online Entertainment
167% 161%
Social Media 14% 21%
Internet Marketing 18% 1,594%
Internet Finance 技技 100% 100%
29 MoneyTreeTM China TMT Report Q1/Q2 2015
Deal volume and value
In Q2 2015, there were 230 deals in the Internet sector, with a total value of US$2.75 billion.
E-commerce: 94 deals, 41% of the total; deal value of US$1.19 billion, 43% of the total.
Internet Services: 79 deals, 34% of the total; deal value of US$1.06 billion, 39% of the total.
Internet Marketing: 8 deals, 3% of the total; deal value of US$68 million, 2% of the total.
Online Entertainment: 11 deals, 5% of the total; deal value of US$171 million, 6% of the total.
Social Media: 16 deals, 7% of the total; deal value of US$87 million, 3% of the total.
Online Education: 21 deals, 9% of the total; deal value of US$134 million, 5% of the total.
Internet Finance: 1 deal, 1% of the total; deal value of US$50 million, 2% of the total.
Figure 41: Deal volume by Internet subsector Q2’15
Figure 42: Deal value by Internet subsector Q2’15 (US$m)
9441%
167%
83%11
5%
11%
7934%
219%
E-commerce Internet ServicesInternet Marketing
Social MediaOnline Education
Online EntertainmentInternet Finance
$1,05739%
$1,18543%
$502%
$682%$87
3%
$1345% $171
6%
E-commerce Internet ServicesInternet Marketing
Social MediaOnline Education
Online Entertainment
Internet Finance
QoQ comparison between Q1 2015 and
Q2 2015
Deal volume
Dealvalue
E-commerce 29% 46%
Online Education 11% 56%
Internet Services 12% 366%
Online Entertainment
31% 142%
Social Media 33% 231%
Internet Marketing 43% 93%
Internet Finance 技技 900% 4,900%
30 MoneyTreeTM China TMT Report Q1/Q2 2015
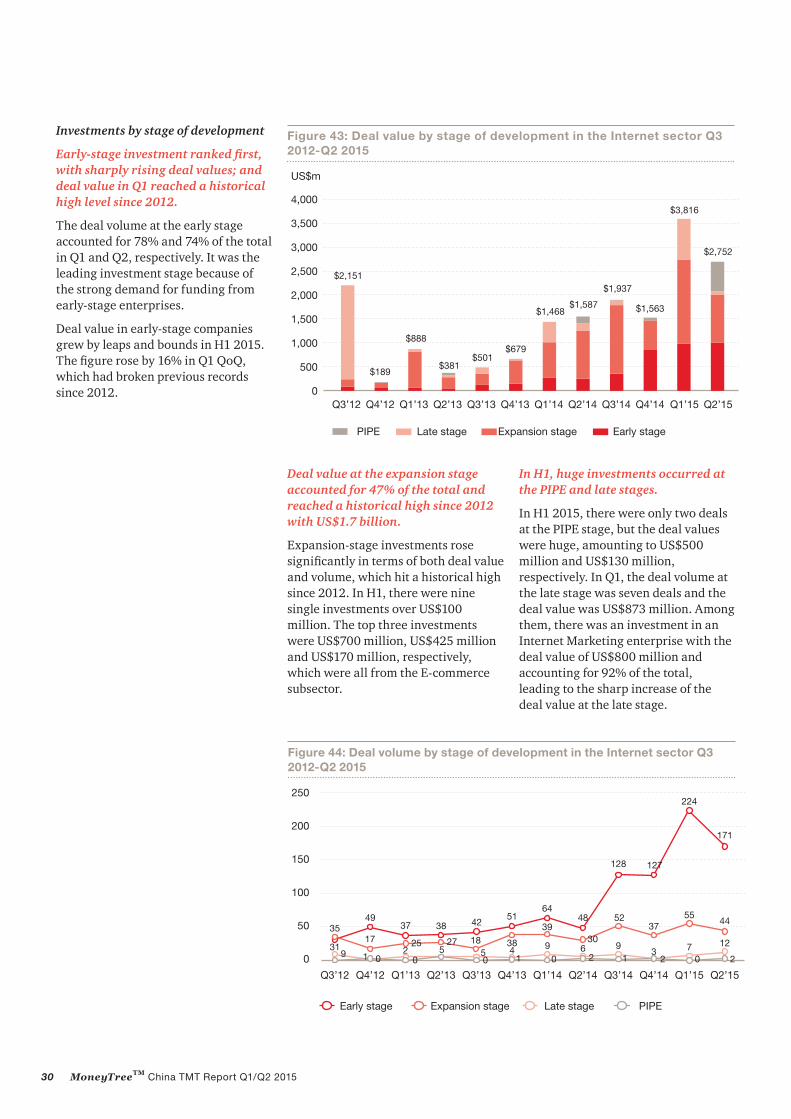
Investments by stage of development
Early-stage investment ranked first, with sharply rising deal values; and deal value in Q1 reached a historical high level since 2012.
The deal volume at the early stage accounted for 78% and 74% of the total in Q1 and Q2, respectively. It was the leading investment stage because of the strong demand for funding from early-stage enterprises.
Deal value in early-stage companies grew by leaps and bounds in H1 2015. The figure rose by 16% in Q1 QoQ, which had broken previous records since 2012.
Deal value at the expansion stage accounted for 47% of the total and reached a historical high since 2012 with US$1.7 billion.
Expansion-stage investments rose significantly in terms of both deal value and volume, which hit a historical high since 2012. In H1, there were nine single investments over US$100 million. The top three investments were US$700 million, US$425 million and US$170 million, respectively, which were all from the E-commerce subsector.
In H1, huge investments occurred at the PIPE and late stages.
In H1 2015, there were only two deals at the PIPE stage, but the deal values were huge, amounting to US$500 million and US$130 million, respectively. In Q1, the deal volume at the late stage was seven deals and the deal value was US$873 million. Among them, there was an investment in an Internet Marketing enterprise with the deal value of US$800 million and accounting for 92% of the total, leading to the sharp increase of the deal value at the late stage.
Figure 43: Deal value by stage of development in the Internet sector Q3 2012-Q2 2015
There were 288 deals in the Internet sector, with a total value of US$3.82 billion.
Early stage: 224 deals, 78% of the total; deal value of US$1.01 billion, 26% of the total.
Expansion stage: 55 deals, 19% of the total; deal value of US$1.78 billion, 47% of the total.
Late stage: 7 deals, 2% of the total; deal value of US$873 million, 23% of the total.
PIPE: No deals in Q1 2015.
Undisclosed: 2 deals, 1% of the total; deal value of US$150 million, 4% of the total.
Q2 2015
There were 230 deals in total in the Internet sector, with a total value of US$2.752 billion.
Early stage: 171 deals, 74% of the total; deal value of US$1.02 billion, 37% of the total.
Expansion stage: 44 deals, 19% of the total; deal value of US$1.02 billion, 37% of the total.
Late stage: 12 deals, 5% of the total; deal value of US$80 million, 3% of the total.
PIPE: 2 deals, 1% of the total; deal value of US$630 million, 23% of the total.
Undisclosed: 1 deal, 1% of the total; deal value undisclosed.
Figure 45: Deal volume by stage of development in the Internet sector Q1’15
Figure 46: Deal value by stage of development in the Internet sector Q1’15 (US$m))
Figure 47: Deal value by stage of development in the Internet sector Q2’15 (US$m)
Figure 48: Deal value by stage of development in the Internet sector Q2’15 (US$m)
22478%
5519%
21% 7
2%
Expansion stage
Late stage
Early stage
Undisclosed
$1,01026%
$87323%
$1,78347%
$1504%
Expansion stage
Late stage
Early stage
Undisclosed
17174%
11%
125%
4419%
21%
Expansion stage
Late stage
Early stage
PIPE
Undisclosed
$803%
$1,02437%
$1,01837%
$63023%
Expansion stage
Late stage
Early stage
PIPE
QoQ comparison between Q4 2014
and Q1 2015
Deal volume
Deal value
Early stage 76% 16%
Expansion stage
49% 183%
Late stage 133% 174,536%
PIPE 100% 100%
QoQ comparison between Q1 2015
and Q2 2015
Deal volume
Deal value
Early stage 24% 1%
Expansion stage
20% 43%
Late stage 71% 91%
PIPE 1,900% 62,900%
32 MoneyTreeTM China TMT Report Q1/Q2 2015
Investments by region
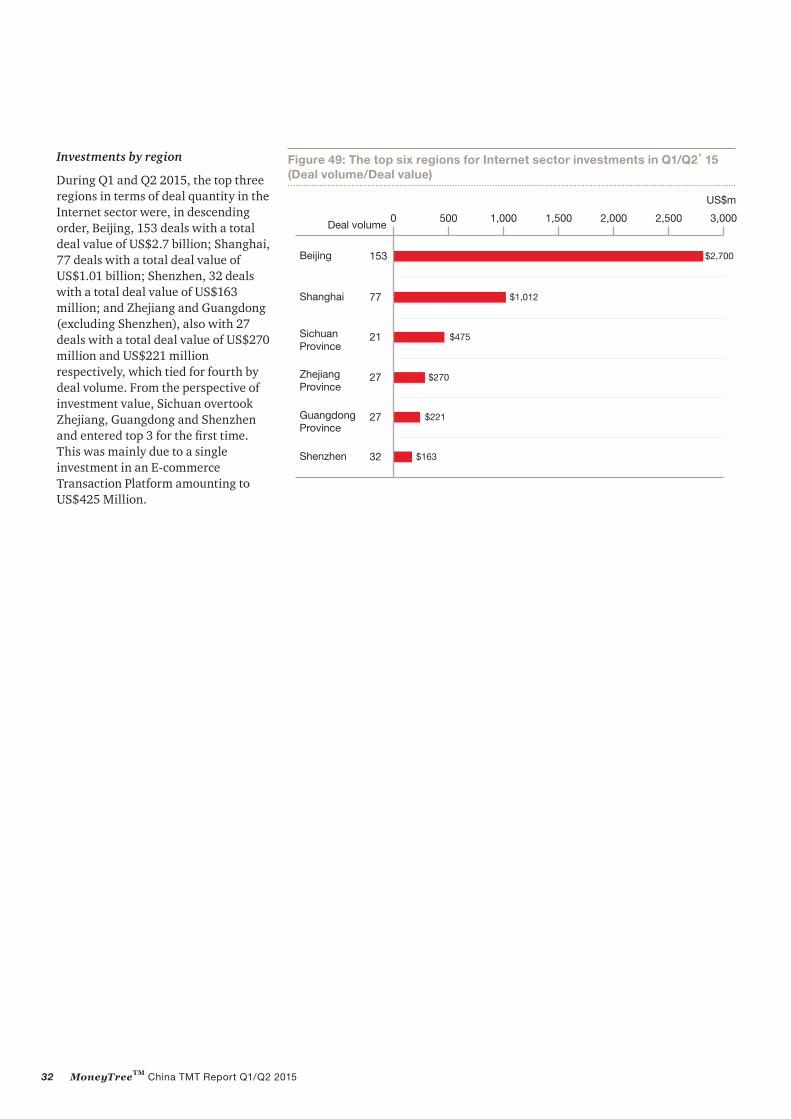
During Q1 and Q2 2015, the top three regions in terms of deal quantity in the Internet sector were, in descending order, Beijing, 153 deals with a total deal value of US$2.7 billion; Shanghai, 77 deals with a total deal value of US$1.01 billion; Shenzhen, 32 deals with a total deal value of US$163 million; and Zhejiang and Guangdong (excluding Shenzhen), also with 27 deals with a total deal value of US$270 million and US$221 million respectively, which tied for fourth by deal volume. From the perspective of investment value, Sichuan overtook Zhejiang, Guangdong and Shenzhen and entered top 3 for the first time. This was mainly due to a single investment in an E-commerce Transaction Platform amounting to US$425 Million.
Figure 49: The top six regions for Internet sector investments in Q1/Q2’15 (Deal volume/Deal value)
153 $2,700
21 $475
27 $270
27 $221
32 $163
77 $1,012
0 1,000500 2,000 2,5001,500 3,000Deal volume
Beijing
Shanghai
Shenzhen
Guangdong Province
Sichuan Province
Zhejiang Province
US$m
33 MoneyTreeTM China TMT Report Q1/Q2 2015
Investments in Telecommunications and MobileThe Telecommunications and Mobile sector includes Telecom Equipment and Terminals, Other Telecommunications Subsectors and Mobile.
Deal volume and value
Q1 2015
There were 208 deals in Telecommunications and Mobile sector, with a total value of US$1.31 billion.
Mobile: 204 deals, 98% of the total; deal value of US$1.24 billion, 95% of the total.
Telecom Equipment and Terminals: 4 deals, 2% of the total; deal value of US$69 million, 5% of the total.
Other Telecommunications Subsectors: No deals in Q1 2015. Mobile, the pillar of the
Telecommunications sector, saw unprecedented investment in Q1 2015 in terms of the deal volume and value.
The small, light and convenient smartphone brought a wave of mobile to all aspects of society. It also increased investments in smartphone platforms in the Mobile sector.
In Q1 2015, investment volumes in Mobile reached historical highs since 2012, hitting 204 deals and accounting for 98% of the total. This was up 87% QoQ from Q4 2014. In Q2 2015, investments decreased QoQ mainly due to a single investment in a well-known taxi hailing app enterprise amounting to US$600 million in Q1 2015.
Other Telecommunications Subsectors only had five deals in H1 2015.
Since 2012 the deal volume of this subsector has never surpassed 10 deals and the deal value was also historically low. The deal value in Q2 2015 was US$4 million even though there were no deals in Q1 2015.
Telecom Equipment and Terminals: the investments were stable in H1.
There were four deals and three deals in Q1 and Q2 in the Telecom Equipment and Terminals subsector with deal value of US$69 million and US$2 million, respectively, which remained stable compared with previous years.
Figure 50: Deal volume by subsegment in the Telecommunications and Mobile sector Q1’15
Figure 51: Deal value by subsegment in the Telecommunications and Mobile sector Q1’15 (US$m)
20498%
42%
Mobile
Telecom Equipment and Terminals
$1,23995%
$695%
Mobile
Telecom Equipment and Terminals
34 MoneyTreeTM China TMT Report Q1/Q2 2015
Q2 2015
There were a total of 105 deals in the Telecommunications and Mobile sector, with a total value of US$859 million.
Mobile: 97 deals, 92% of the total; deal value of US$853 million, 98% of the total.
Telecom Equipment and Terminals: 3 deals, 3% of the total; deal value of US$2 million, 1% of the total.
Other Telecommunications Subsectors:5 deals, 5% of the total; deal value of US$4 million, 1% of the total.
Figure 52: Deal volume by subsectors in the Telecommunications and Mobile sector Q2’15
Figure 53: Deal value by subsectors in the Telecommunications and Mobile sector Q2’15(US$m)
9792%
33%
55%
Mobile
Telecom Equipment and Terminals
Other Telecommunications Subsectors
$85398%
$21%
$41%
Mobile
Telecom Equipment and Terminals
Other Telecommunications Subsectors
QoQ comparison between Q4 2014
and Q1 2015
Deal volume
Dealvalue
Mobile 87% N/A
Telecom Equipment and Terminals
33% 94%
Other Telecommunications Subsectors 传传
100% N/A
QoQ comparison between Q1 2015
and Q2 2015
Deal volume
Dealvalue
Mobile 52% 31%
Telecom Equipment and Terminals
25% 98%
Other Telecommunications Subsectors 传传
4,900% 3,906%
35 MoneyTreeTM China TMT Report Q1/Q2 2015
Investments by stage of development
Q1 2015
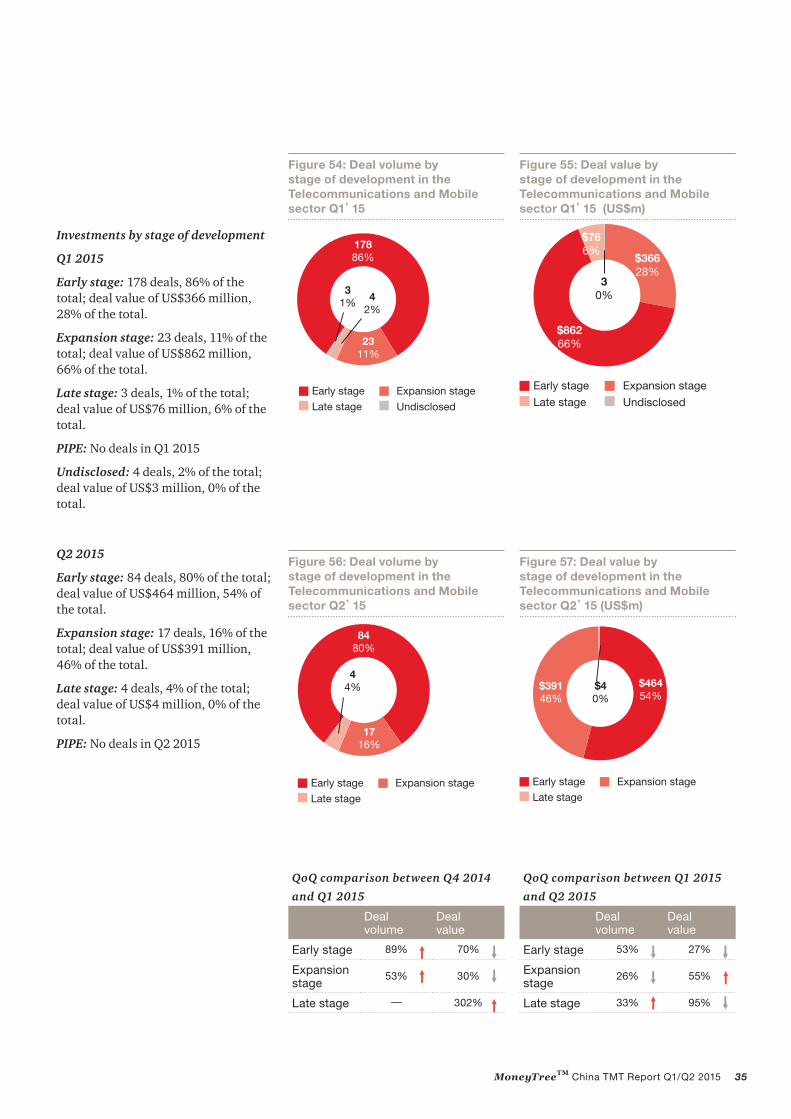
Early stage: 178 deals, 86% of the total; deal value of US$366 million, 28% of the total.
Expansion stage: 23 deals, 11% of the total; deal value of US$862 million, 66% of the total.
Late stage: 3 deals, 1% of the total; deal value of US$76 million, 6% of the total.
PIPE: No deals in Q1 2015
Undisclosed: 4 deals, 2% of the total; deal value of US$3 million, 0% of the total.
Q2 2015
Early stage: 84 deals, 80% of the total; deal value of US$464 million, 54% of the total.
Expansion stage: 17 deals, 16% of the total; deal value of US$391 million, 46% of the total.
Late stage: 4 deals, 4% of the total; deal value of US$4 million, 0% of the total.
PIPE: No deals in Q2 2015
Figure 54: Deal volume by stage of development in the Telecommunications and Mobile sector Q1’15
Figure 56: Deal volume by stage of development in the Telecommunications and Mobile sector Q2’15
Figure 55: Deal value by stage of development in the Telecommunications and Mobile sector Q1’15 (US$m)
Figure 57: Deal value by stage of development in the Telecommunications and Mobile sector Q2’15 (US$m)
17886%
2311%
31% 4
2%
Early stage Expansion stage
Late stage Undisclosed
Early stage Expansion stage
Late stage
$86266%
$36628%
$766%
Undisclosed
30%
8480%
44%
1716%
Early stage Expansion stage
Late stage
QoQ comparison between Q4 2014
and Q1 2015
Deal volume
Deal value
Early stage 89% 70%
Expansion stage
53% 30%
Late stage — 302%
QoQ comparison between Q1 2015
and Q2 2015
Deal volume
Deal value
Early stage 53% 27%
Expansion stage
26% 55%
Late stage 33% 95%
Early stage Expansion stage
Late stage
$46454%
$39146%
$40%
36 MoneyTreeTM China TMT Report Q1/Q2 2015
Investments by region
During Q1 and Q2 2015 in the Telecommunications and Mobile sector, Beijing took the top spot with 91 deals and total deal value of US$1.39 billion. Shanghai took second place with 51 deals. There were 24 deals in Zhejiang, 23 deals in Shenzhen and 11 deals in Guangdong (excluding Shenzhen), respectively. From the perspective of deal values, Shenzhen ranked third, with a total deal value of US$61 million and Zhejiang came fourth. The largest single deal was US$600 million provided to a well-known taxi hailing app enterprise in Beijing.
Figure 58: The top five regions for investment in the Telecommunications and Mobile sector Q1/Q2’15 (Deal volume/Deal value)
Beijing
Shanghai
Shenzhen
Zhejiang Province
GuangdongProvince
Deal volume
US$m
91 $1386
23
11
$38
51
$61
$27
24
$315
0 500 15001000
37 MoneyTreeTM China TMT Report Q1/Q2 2015
The Mobile subsector includes Mobile Entertainment, Mobile Advertising, Mobile Shopping, Mobile Healthcare, Mobile Technology, Mobile Education, Mobile Services, Mobile Social Media, Mobile Finance and Mobile Messaging.
5. A close look at investments in Mobile
MobileShopping
Mobile
MobileEntertainment Mobile
Technology
Mobile Finance
Mobile Services(Including Mobile TravelServices, Mobile Housekeeeping Services)
Mobile Messaging
Education
Mobile Social Media
Mobile Advertising
Mobile Healthcare
(Including Mobile Video, Mobile Music, Mobile Gaming, etc.)
38 MoneyTreeTM China TMT Report Q1/Q2 2015
Deal volume and value
Q1 2015
The total number of deals in the Mobile subsector was 204, with a total value of US$1.24 billion.
Mobile Services: 29 deals, 14% of the total; deal value of US$701 million, 57% of the total.
Mobile Advertising: 19 deals, 9% of the total; deal value of US$130 million, 10% of the total.
Mobile Entertainment: 29 deals, 14% of the total; deal value of US$120 million, 10% of the total.
Mobile Social Media: 44 deals, 22% of the total; deal value of US$60.39 million, 5% of the total.
Mobile Technology: 19 deals, 9% of the total; deal value of US$81.24 million, 7% of the total.
Mobile Shopping: 11 deals, 5% of the total; deal value of US$29.13 million, 2% of the total.
Mobile Education: 5 deals, 2% of the total; deal value of US$21.30 million, 2% of the total.
Mobile Healthcare: 8 deals, 4% of the total; deal value of US$8.05 million, 1% of the total.
Mobile Finance: 1 deal, 1% of the total; deal value of US$0.16 million, 0% of the total.
Mobile Messaging: No deals in Q1 2015.
Undisclosed: 39 deal, 20% of the total;
Deal volume and value
Q2 2015
The total number of deals in the Mobile subsector was 97, with a total value of US$853 million.
Mobile Entertainment: 15 deals, 16% of the total; deal value of US$38.66 million, 5% of the total.
Mobile Services: 24 deals, 25% of the total; deal value of US$468 million, 55% of the total.
Mobile Social Media: 12 deals, 13% of the total; deal value of US$27.99 million, 3% of the total.
Mobile Technology: 5 deals, 5% of the total; deal value of US$27.73 million, 3% of the total.
Mobile Advertising: 7 deals, 7% of the total; deal value of US$139 million, 16% of the total.
Mobile Education: 4 deals, 4% of the total; deal value of US$3.29 million, 1% of the total.
Mobile Finance: No deals in Q2 2015.
Mobile Shopping: 7 deals, 7% of the total; deal value of US$45.47 million, 5% of the total.
Mobile Healthcare: 7 deals, 7% of the total; deal value of US$39.79 million, 5% of the total.
Mobile Messaging: 2 deals, 2% of the total; deal value of US$17.97 million, 2% of the total.
Undisclosed: 14 deal, 14% of the total; deal value of US$44.87 million, 5% of the total.
Figure 59: Deal value by Mobile Internet subsegments Q3 2012-Q2 2015
Mobile Advertising Mobile Shopping Mobile Healthcare
Mobile TechnologyMobile Education
Mobile Services Mobile Social MediaMobile FinanceMobile Messaging
US$m
39 MoneyTreeTM China TMT Report Q1/Q2 2015
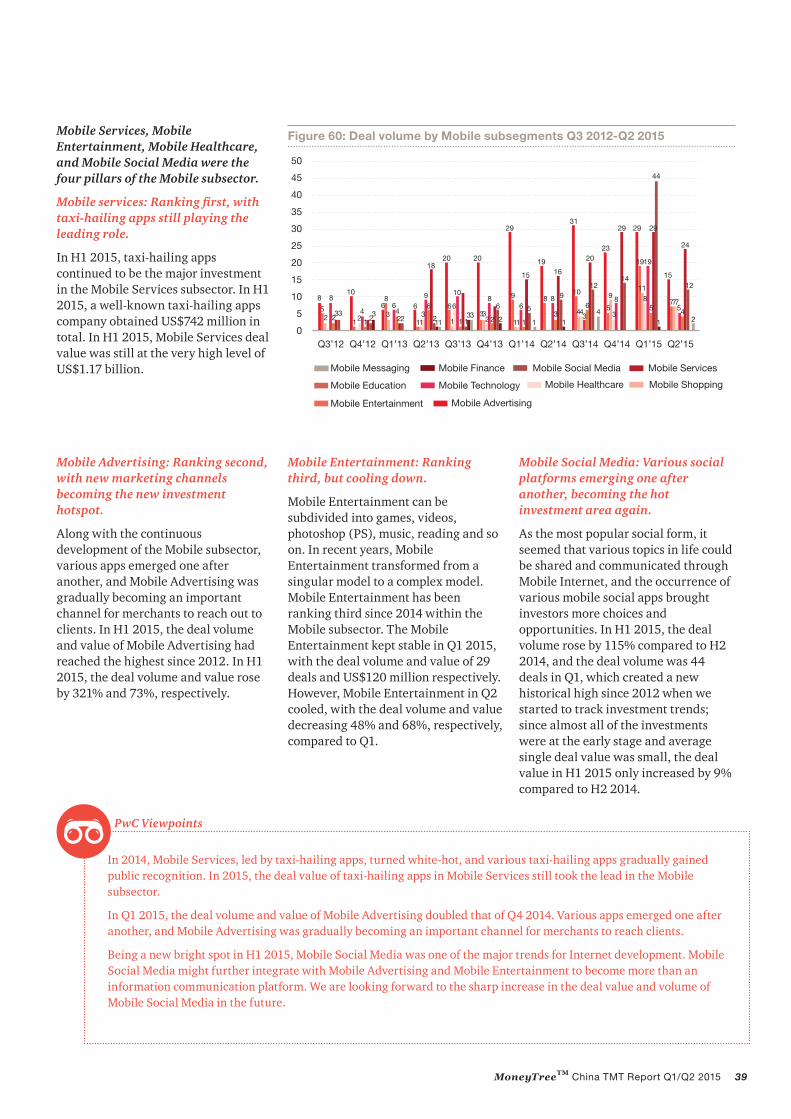
Mobile Services, Mobile Entertainment, Mobile Healthcare, and Mobile Social Media were the four pillars of the Mobile subsector.
Mobile services: Ranking first, with taxi-hailing apps still playing the leading role.
In H1 2015, taxi-hailing apps continued to be the major investment in the Mobile Services subsector. In H1 2015, a well-known taxi-hailing apps company obtained US$742 million in total. In H1 2015, Mobile Services deal value was still at the very high level of US$1.17 billion.
Mobile Advertising: Ranking second, with new marketing channels becoming the new investment hotspot.
Along with the continuous development of the Mobile subsector, various apps emerged one after another, and Mobile Advertising was gradually becoming an important channel for merchants to reach out to clients. In H1 2015, the deal volume and value of Mobile Advertising had reached the highest since 2012. In H1 2015, the deal volume and value rose by 321% and 73%, respectively.
In 2014, Mobile Services, led by taxi-hailing apps, turned white-hot, and various taxi-hailing apps gradually gained public recognition. In 2015, the deal value of taxi-hailing apps in Mobile Services still took the lead in the Mobile subsector.
In Q1 2015, the deal volume and value of Mobile Advertising doubled that of Q4 2014. Various apps emerged one after another, and Mobile Advertising was gradually becoming an important channel for merchants to reach clients.
Being a new bright spot in H1 2015, Mobile Social Media was one of the major trends for Internet development. Mobile Social Media might further integrate with Mobile Advertising and Mobile Entertainment to become more than an information communication platform. We are looking forward to the sharp increase in the deal value and volume of Mobile Social Media in the future.
PwC Viewpoints
Figure 60: Deal volume by Mobile subsegments Q3 2012-Q2 2015
Mobile Shopping Mobile Healthcare Mobile TechnologyMobile Education
Mobile Services Mobile Social MediaMobile FinanceMobile Messaging
Mobile Entertainment: Ranking third, but cooling down.
Mobile Entertainment can be subdivided into games, videos, photoshop (PS), music, reading and so on. In recent years, Mobile Entertainment transformed from a singular model to a complex model. Mobile Entertainment has been ranking third since 2014 within the Mobile subsector. The Mobile Entertainment kept stable in Q1 2015, with the deal volume and value of 29 deals and US$120 million respectively. However, Mobile Entertainment in Q2 cooled, with the deal volume and value decreasing 48% and 68%, respectively, compared to Q1.
Mobile Social Media: Various social platforms emerging one after another, becoming the hot investment area again.
As the most popular social form, it seemed that various topics in life could be shared and communicated through Mobile Internet, and the occurrence of various mobile social apps brought investors more choices and opportunities. In H1 2015, the deal volume rose by 115% compared to H2 2014, and the deal volume was 44 deals in Q1, which created a new historical high since 2012 when we started to track investment trends; since almost all of the investments were at the early stage and average single deal value was small, the deal value in H1 2015 only increased by 9% compared to H2 2014.
40 MoneyTreeTM China TMT Report Q1/Q2 2015
6. Methodology and definitions
TMT is an acronym for Telecommunications, Media and Technology. In this report, we have carried out analysis of the three most active sectors within TMT. They are Technology, Internet and Telecommunications and Mobile.
This report covers Q1 and Q2 2015. However, in order to show trends and make comparisons in the industry, we have included data from the second half of 2012 to the year of 2014. Deals that did not disclose the specific investment period, deal value or investment stage were excluded from the relevant analysis in order to maintain the accuracy of the report.
All data in this report was provided by Zero2IPO Research.
DefinitionsTechnology sector
Electronics & Optoelectronics Devices: Optoelectronic components, optoelectronics, electronics, and power supply
Software: Software applications for business or consumer use
IT Services: IT consultation, software outsourcing, computer repair, computer and network security
Semiconductor: IC design, IC testing and packaging, IC equipment manufacturing
Internet Services: Online travel services, online recruitment services, online housekeeping services, etc.
Internet Marketing: Search engine, digital ad agency work and Internet marketing services
Online Education: e-learning, online classroom, etc.
Online Entertainment: Online gaming, online video, online music
Social Media: BBS/Forum, online networking
Internet Finance: E-payment
Telecommunications and Mobile sector
Telecom Equipment and Terminals: Communication equipment, terminals, software
Other Telecommunications Subsectors: Mobile operators, fixed-line operators
Mobile: Mobile entertainment, mobile advertising, mobile shopping, mobile healthcare, mobile technology, mobile education, mobile services, mobile social media, mobile finance, mobile messaging
Entertainment and Media sector
Traditional Media: Newspaper, magazines, publishing
Outdoor Media: Outdoor print ads, outdoor LED TV, mobile TV, building TV
Video Production and Distribution: Film and television production and distribution
Advertising: Ad agencies, media buying
Cultural Exchange: Cultural exchange agency, etc.
Entertainment & Leisure: Animation and other industries
41 MoneyTreeTM China TMT Report Q1/Q2 2015
Stage of development
Early stage: This stage varies from one to five years while the product or concept is under development and not yet in mass and commercial production. During this stage, funds are mainly used for acquiring production equipment and developing products as well as marketing and setting up management systems.
Expansion stage: The investment period at this stage usually lasts about two or three years. The product or service is in production and commercially available. The company generally needs more funds to further develop the product, as well as to expand facilities and production. Inventory planning and marketing efforts are also ramped up.
Late stage: During this stage, the company has grown its operating revenue, and is more likely to be, but not necessarily, profitable. The company may have plans to go public. The main purpose of financing is to seek capital to grow capacity, and to introduce shareholders with industry experience and influence, thereby increasing corporate recognition and attracting shareholders. The company will aim to improve its financial structure and management team in preparation for listing. At this stage, the investment is low risk, but has a lower chance of high returns.
PIPE (private investment in public equity): PE investments in publicly listed companies via preferential allotments or private placements, and the acquisition of shares by PE firms via the secondary market.
Exits
Initial public offering (IPO): This includes the sale of the PE or VC investors’ equity stake in an unlisted company through its first public offering of stock.
Strategic sale: This includes the sale of the PE or VC investors’ equity stakes (or the entire investee company itself )to a third-party company.
Management buy-out: The purchase of a company by its management through either debt-credit finance or stock transaction, which results in relevant changes in corporate ownership, control, residual claim and assets, in order to alter the structure of corporate proprietary rights.
Secondary sale: Any purchase of the PE or VC investors’ equity stakes by another PE or VC investors constitutes secondary sale.
42 MoneyTreeTM China TMT Report Q1/Q2 2015
If you’d like to discuss what’s happening in your particular technology market or how PwC might be able to help your company meets its challenges, please reach out to one of the technology industry leaders listed here.
PwC helps organizations and individuals create the value they’re looking for. We’re a network of firms in 157 countries with more than 195,000 people who are committed to delivering quality in assurance, tax and advisory services. Tell us what matters to you and find out more by visiting us at www.pwc.com.
PwC refers to the PwC network and/or one or more of its member firms, each of which is a separate legal entity. Please see www.pwc.com/structure (http://www.pwc.com/structure) for further details.
PwC – Mainland China, Hong Kong and Macau
PwC in Mainland China, Hong Kong and Macau work together on a collaborative basis, subject to local applicable laws. Collectively, we have around 500 partners and a strength of around 12,100 people.
Providing organizations with the advice they need, wherever they may be located. Our highly qualified, experienced professionals listen to different points of view to help organizations solve their business issues and identify and maximize the opportunities they seek. Our industry specialization allows us to help co-create solutions with our clients for their sector of interest.
We are located in these cities: Beijing, Shanghai, Tianjin, Chongqing, Dalian, Xi’an, Qingdao, Nanjing, Suzhou, Hangzhou, Ningbo, Xiamen, Guangzhou, Shenzhen, Wuhan, HongKong and Macau.
About PwC’s Technology Institute
The Technology Institute is PwC’s global research network that studies the business of technology and the technology of business with the purpose of creating thought leadership that offers both fact-based analysis and experience-based perspectives. Technology Institute insights and viewpoints originate from active collaboration between our professionals across the globe and their first-hand experiences working in and with the technology industry.