Mette Bjørndal Endre Bjørndal NHH Norwegian School of Economics Department of Business and Management Science Energy Lab / ENE Kristian Gerhard Jebsen Centre NHH September 13 2017 Pricing and congestion management in coupled European wholesale markets
Transcript
Mette BjørndalEndre Bjørndal
NHH Norwegian School of EconomicsDepartment of Business and Management Science
Energy Lab / ENEKristian Gerhard Jebsen CentreNHHSeptember 13 2017
Pricing and congestion management in coupled European wholesale markets
Background and outline
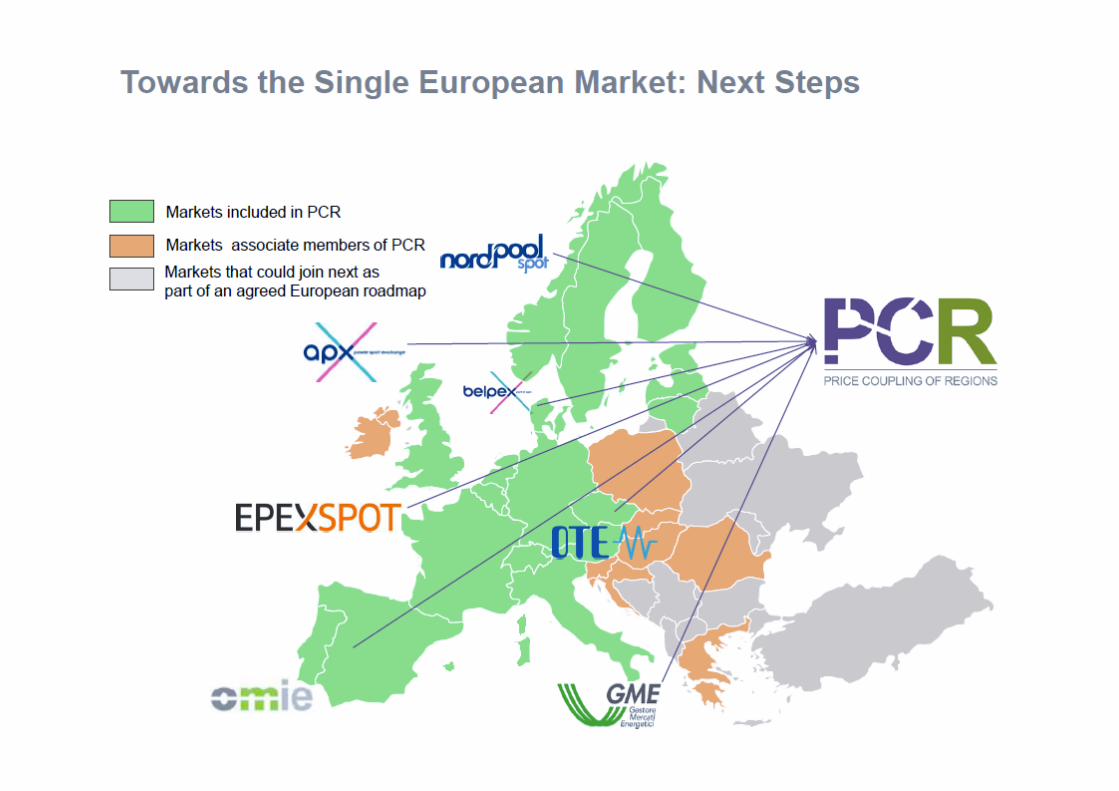
• European day-ahead market integration- Target model
• Energy only regional markets• Market coupling between regional markets
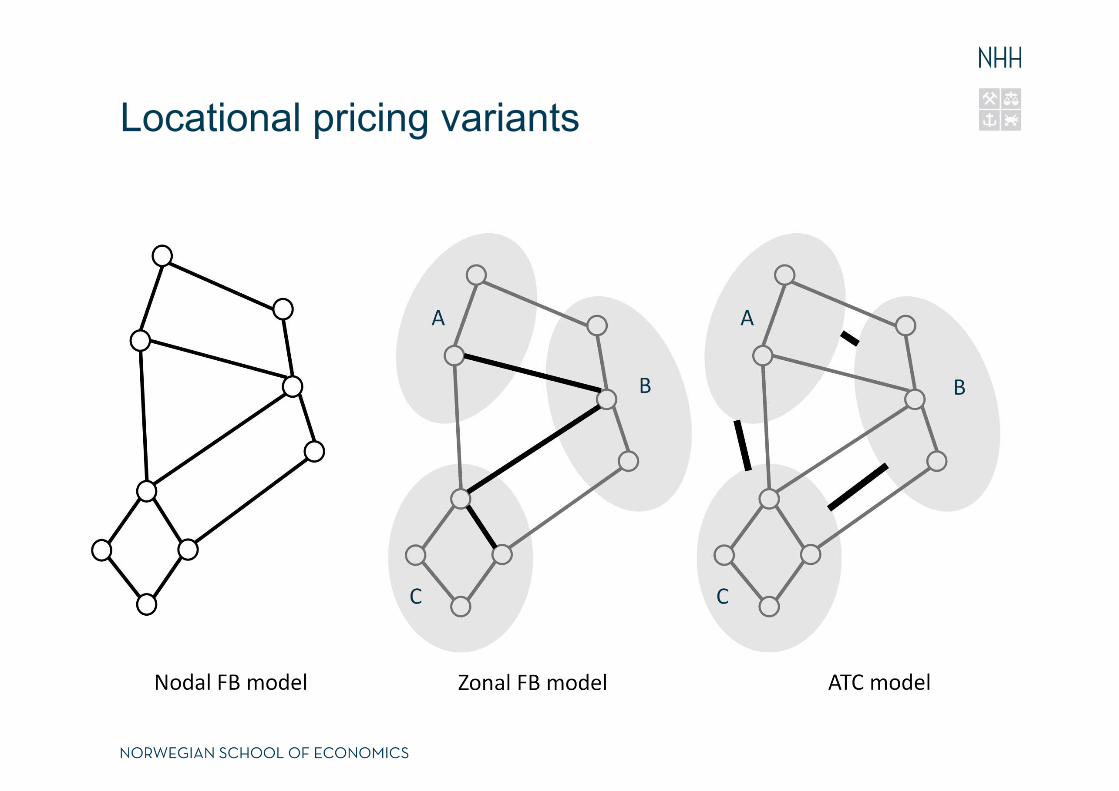
• Nodal pricing – Benchmark • Zonal pricing – Available Transfer Capacity (ATC) model• Zonal pricing – Flow-based Market Coupling (FBMC) model
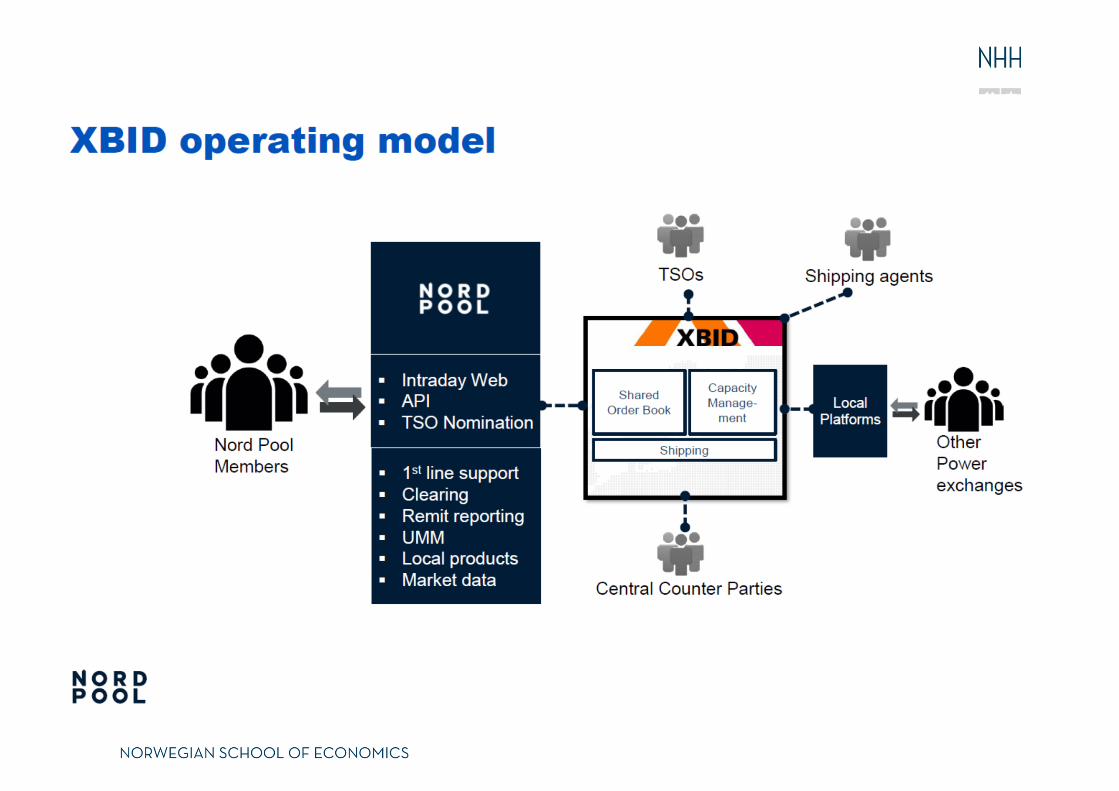
• Future developments- Integration of intraday and balancing markets
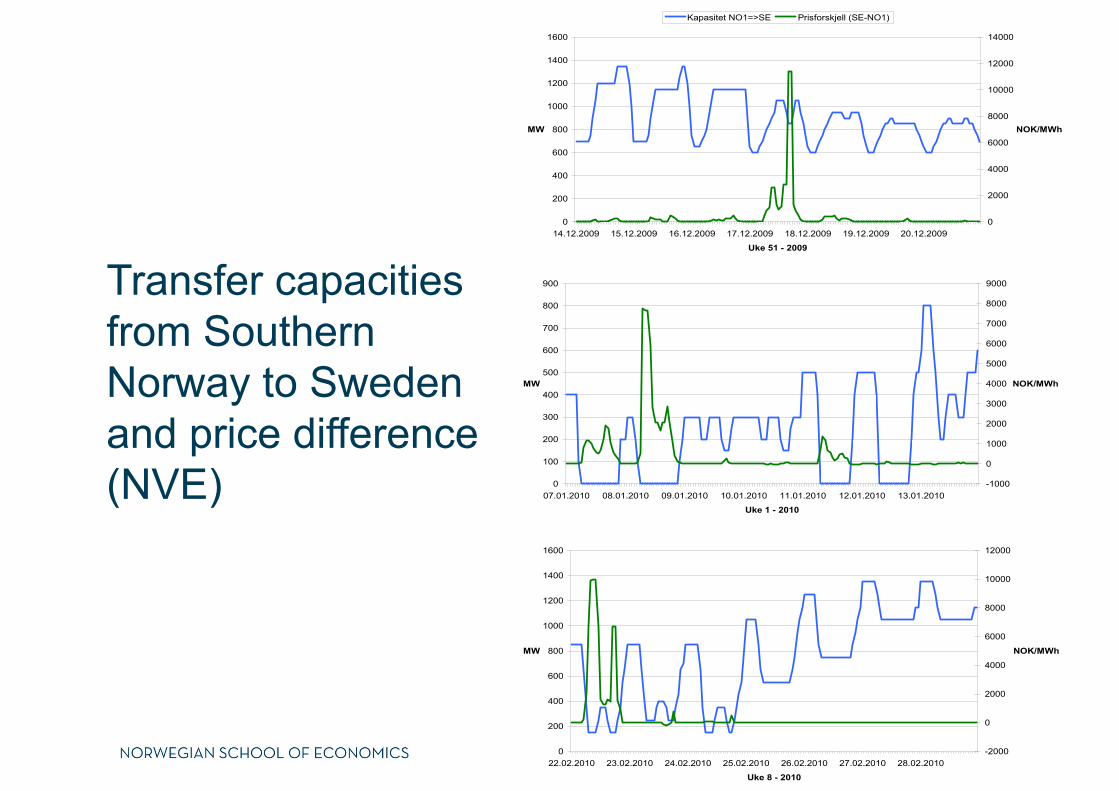
Why is the grid so important?
• The grid integrates geographically dispersed markets• The grid affects the formation of prices
- The technology for transmitting electricity presents some special challenges to the competitive markets model• Electricity is very costly to store• Supply must equal demand at every instant in time• Severe capacity constraints• Power flow equations and loop flow
• Short run relevant costs for transmission- Losses- Ancillary services, reactive power- Congestion cost
• The opportunity cost that results from out-of-merit order dispatch, i.e. the cost of not being able to dispatch the cheapest generators first
Congestion Management• Objective
- Optimal economic dispatch• Max social welfare (consumer benefit – production cost)• S.t. thermal and security constraints
- Gives the value of power in every node, i.e. nodal prices• Benchmark
• Different methods to realize optimal dispatch- Nodal prices, Flowgate prices, Optimal re-dispatch…
• Provide price signals- For efficient use of the transmission system- For transmission, generation and load upgrades
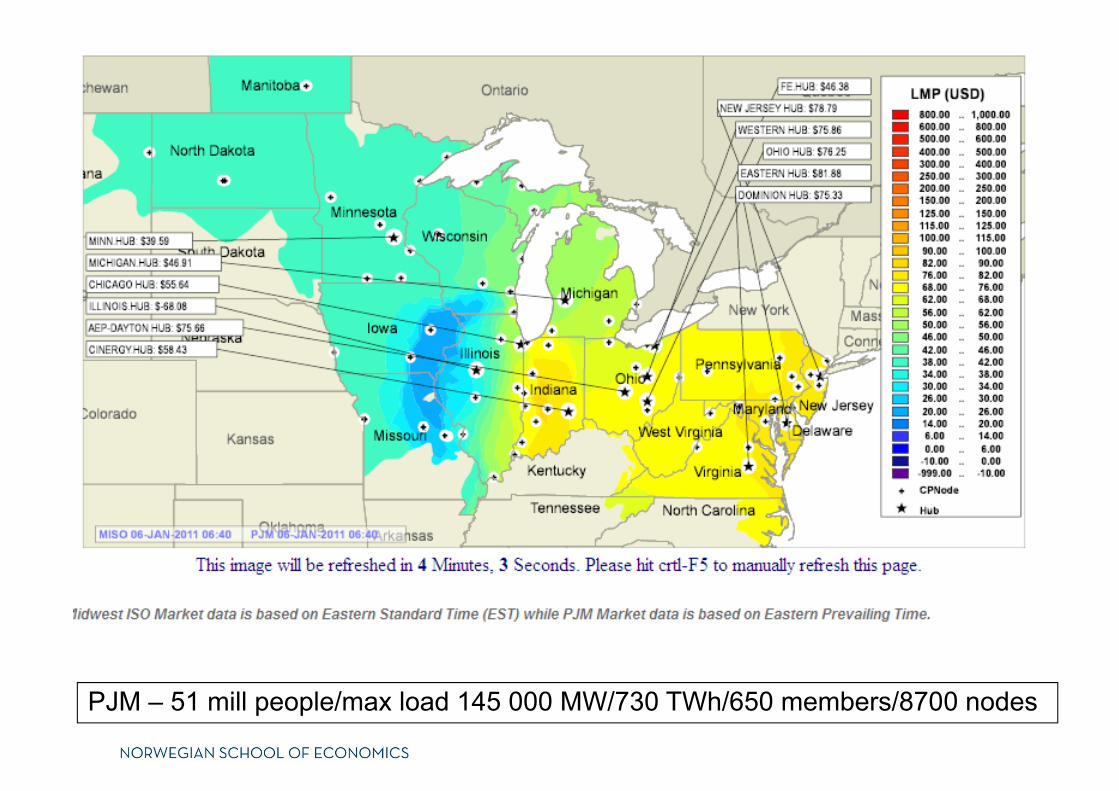
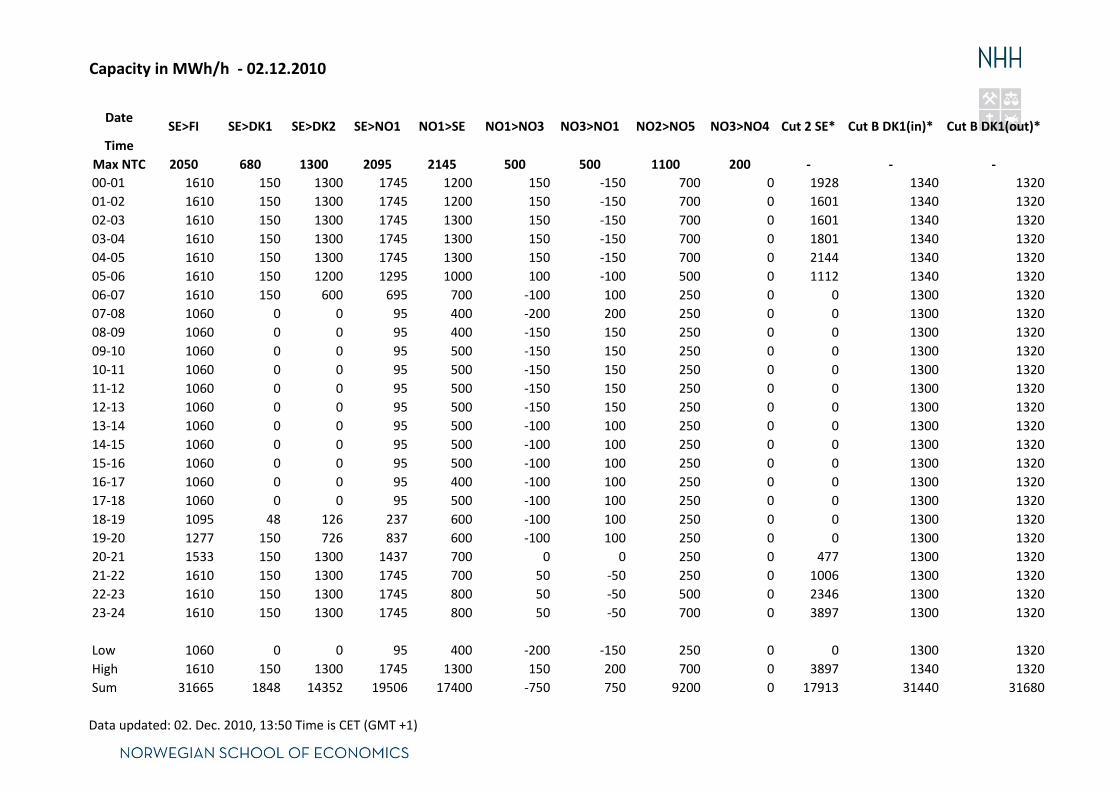
Data updated: 02. Dec. 2010, 13:50 Time is CET (GMT +1)
Cut B DK1(in)* Cut B DK1(out)*NO3>NO4 Cut 2 SE*NO3>NO1 NO2>NO5NO1>NO3SE>NO1 NO1>SESE>DK2SE>FI SE>DK1
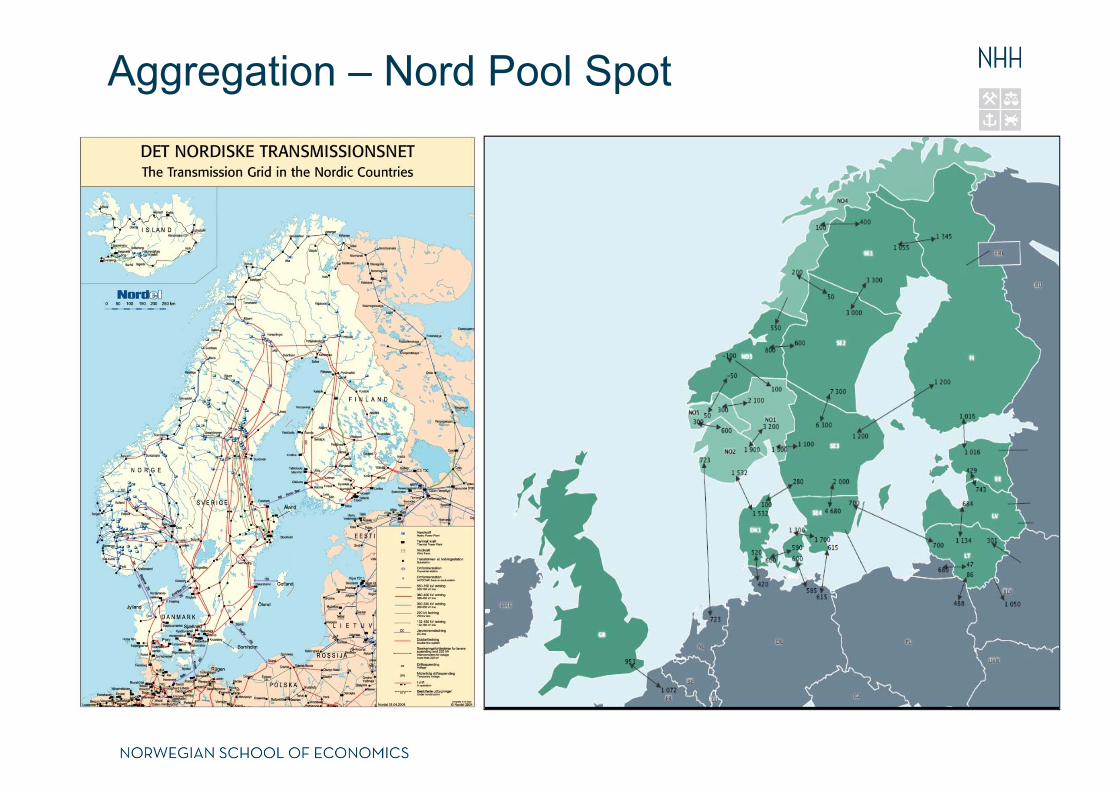
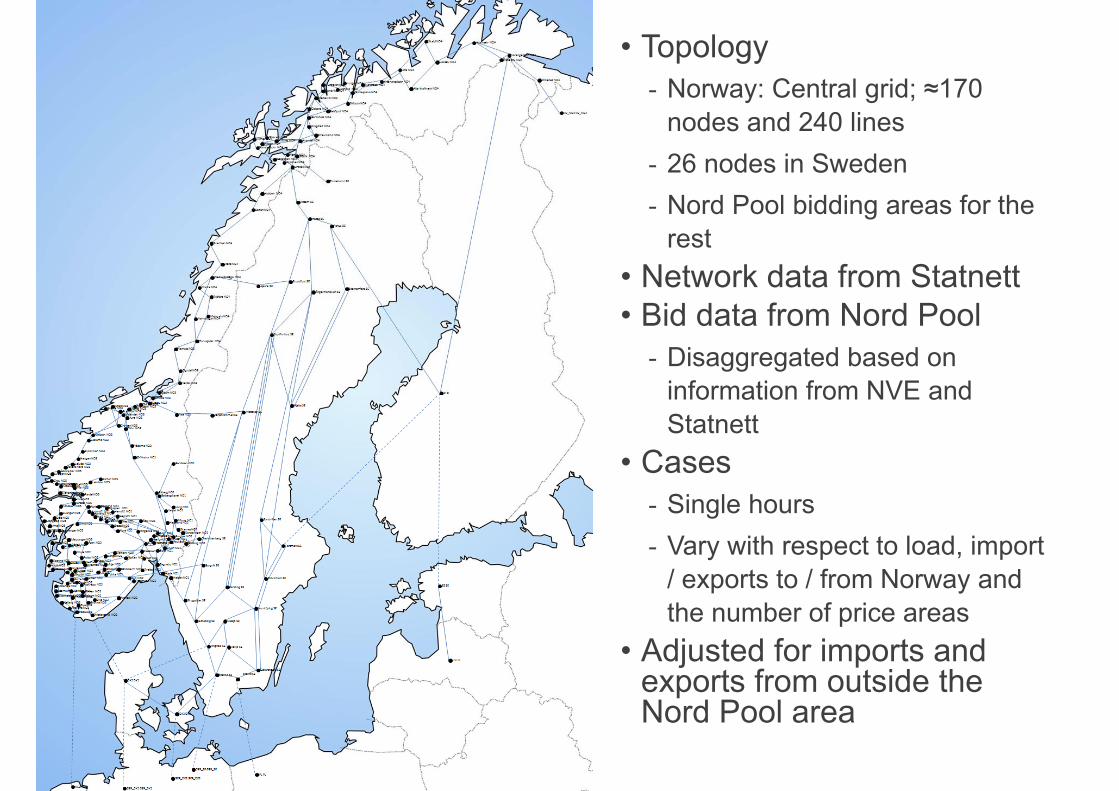
• Topology- Norway: Central grid; ≈170
nodes and 240 lines- 26 nodes in Sweden- Nord Pool bidding areas for the
rest• Network data from Statnett• Bid data from Nord Pool
- Disaggregated based on information from NVE and Statnett
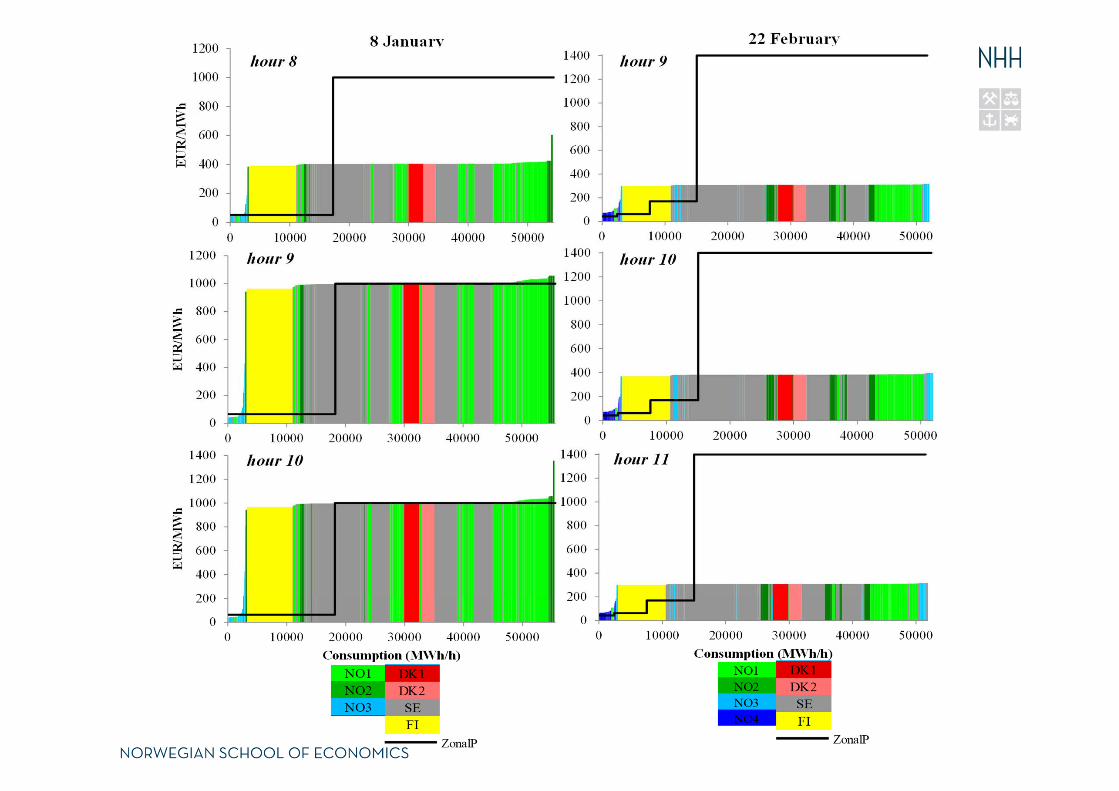
• Cases- Single hours- Vary with respect to load, import
/ exports to / from Norway and the number of price areas
• Adjusted for imports and exports from outside the Nord Pool area
Locational pricing variants
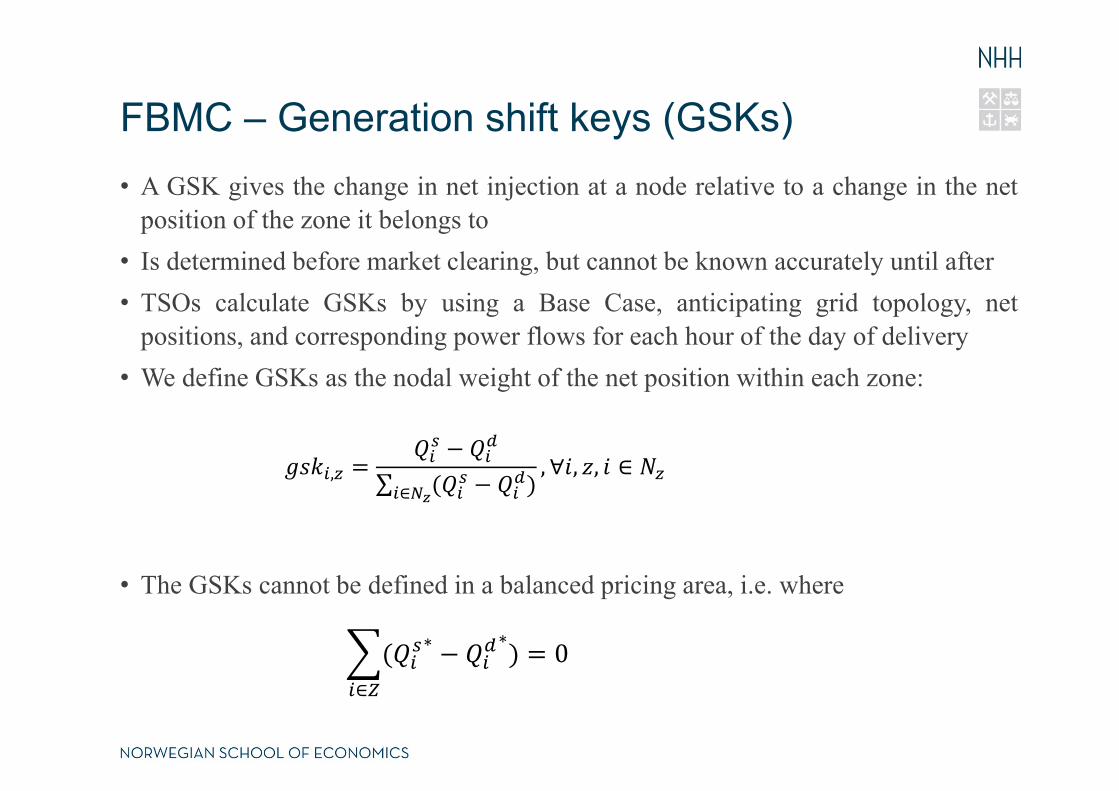
FBMC – Generation shift keys (GSKs)• A GSK gives the change in net injection at a node relative to a change in the net
position of the zone it belongs to• Is determined before market clearing, but cannot be known accurately until after• TSOs calculate GSKs by using a Base Case, anticipating grid topology, net
positions, and corresponding power flows for each hour of the day of delivery• We define GSKs as the nodal weight of the net position within each zone:
• The GSKs cannot be defined in a balanced pricing area, i.e. where
, ∑ ∈, ∀ , , ∈
∗ ∗
∈
0
FBMC – Zonal PTDFs
• TSOs use GSKs and nodal PTDF matrices to calculate zonal PTDFmatrices
• Zonal PTDF matrices are used to estimate the influence of the netposition of any zone on the lines in the FBMC model
• In the nodal model physical limitations are typically applied to thewhole network
• In the FBMC model physical restrictions are imposed on theselected critical branches (CBs)
, , ∗∈
, , ∀ ∈
,, ,
FBMC – Critical branches (CBs)
• A CB is a transmission line that is significantly impacted bycross-border trading- In CWE a transmission line is critical if its maximum zone-to-zone
PTDF is larger than a fixed threshold value
• The TSOs publish CBs and their corresponding RemainingAvailable Margin (RAM) before market clearing
FBMC – Remaining Available Margin (RAM)
• The RAM is the line capacity that can be used by the day-ahead market, and is calculated as
• where capl is the thermal capacity limit and Fl’ includes:- flows caused by transactions outside the day-ahead market, e.g. re-
dispatching, bilateral trades, forward market,…
- an adjustment value based on TSO knowledge, and
- a safety margin that is needed to compensate for the approximations andsimplifications made by the FBMC model
• For simplicity we assume
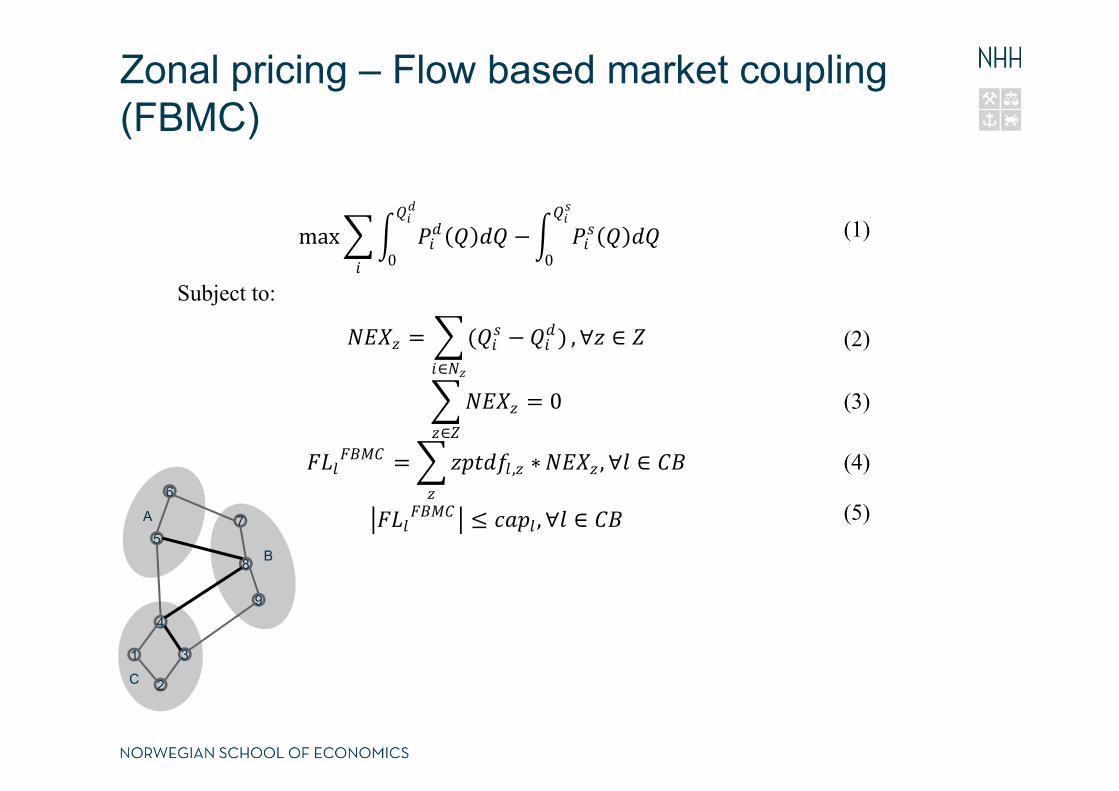
Zonal pricing – Flow based market coupling (FBMC)
max0 0
(1)
Subject to:
∈
, ∀ ∈ (2)
∈
0 (3)
, ∗ , ∀ ∈ (4)
, ∀ ∈ (5)
1
2
3
5
6
4
7
8
9
A
C
B
Nodal pricing versus FBMC
• If the base case that defines the GSKs is feasible in the nodal model, it is also feasible in the FBMC model
• If the optimal nodal price solution is used to set GSKs, then the optimal nodal price solution is feasible in FBMC and the objective function value is ≥ the objective function value of the nodal price solution
• The FBMC solution might not be feasible in the original problem implying a need for re-dispatching
• A lot of discretion- Generation shift keys, GSKs- Critical branches, CBs- Capacity on critical branches, RAM
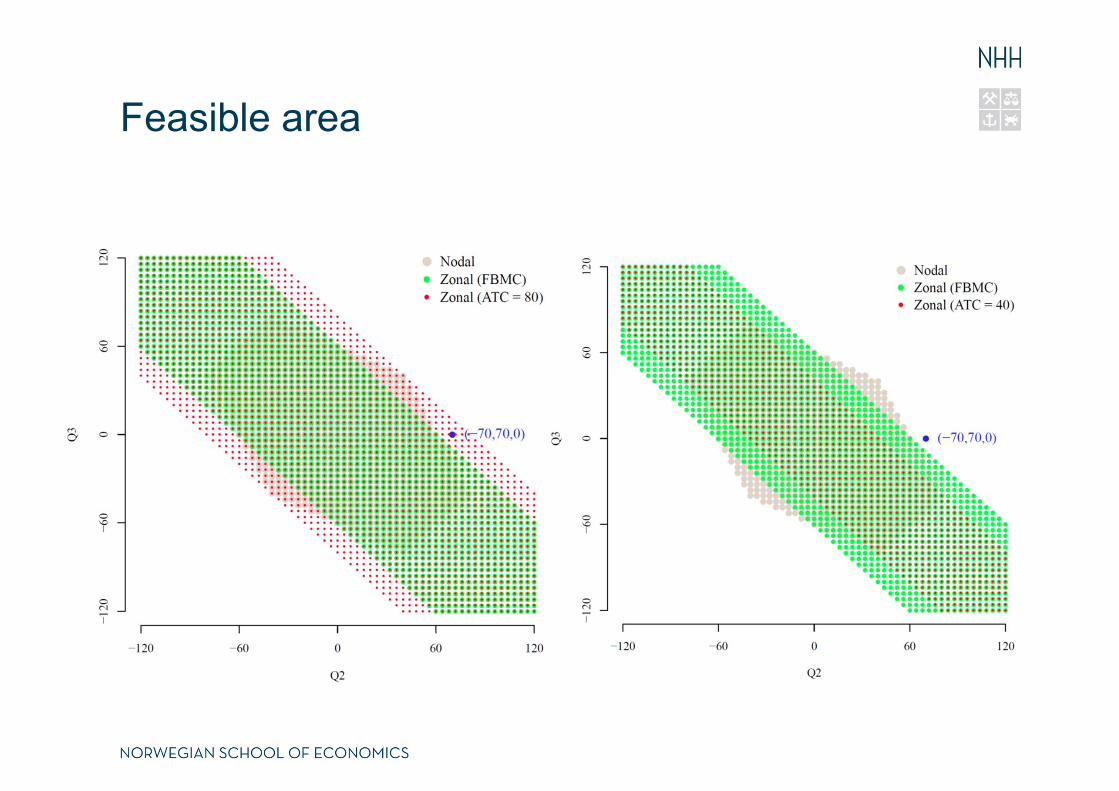
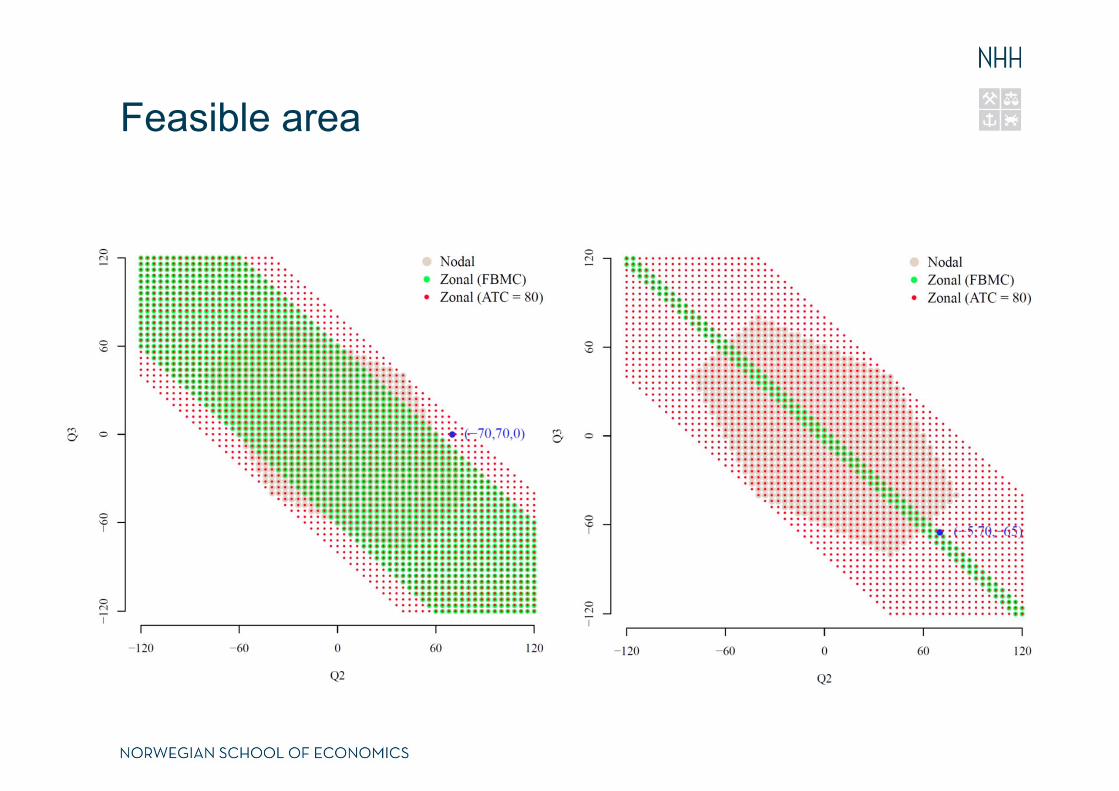
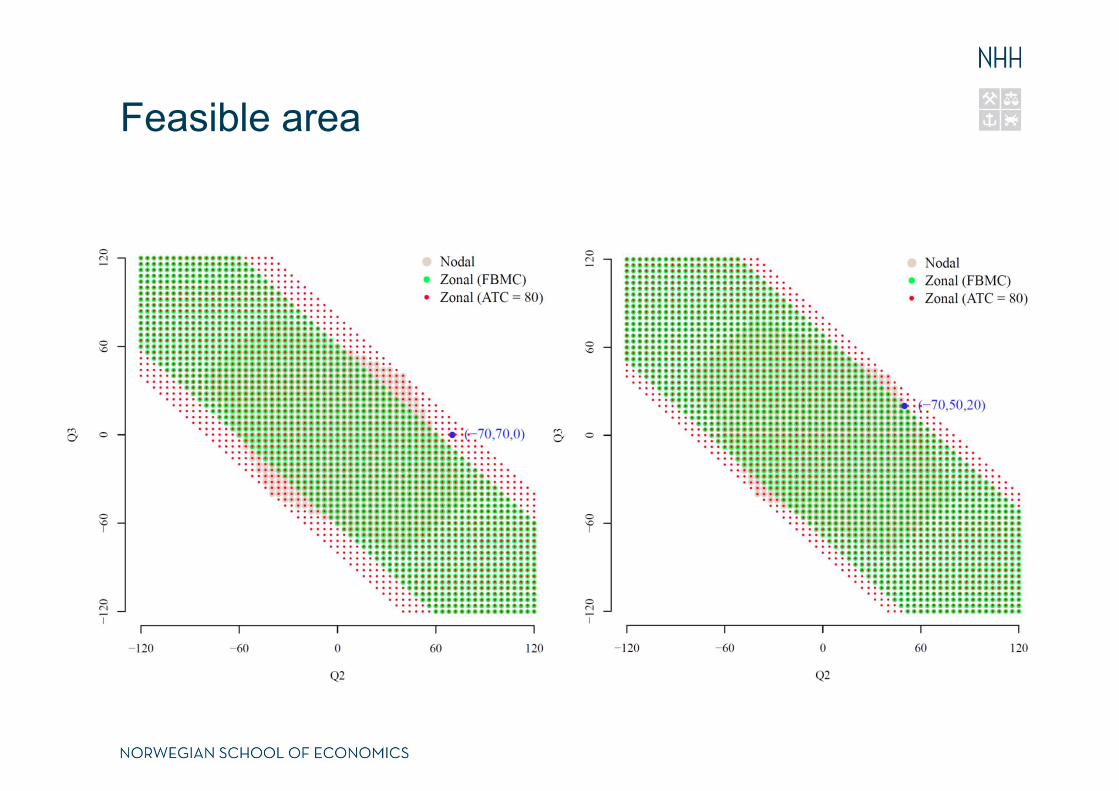
Feasible area
Feasible area
Feasible area
Conclusions
• The European market coupling model prices power in large regions
• Many important operational details are omitted
• Not necessarily clear that FBMC model is an improvement, neither when it comes to efficiency nor transparency
• Still many choices that affect prices in own and other regions (GSKs, CBs, RAM)


![ENTRIES STRICTLY LIMITED SOLOS 1300 ACTS - GROUPS 150 … · SOLOS 1300 ACTS - GROUPS 150 ACTS . GENERAL CONDITIONS 1] STATUS: Competitions are only open to Amateurs, meaning one](https://static.documents.pub/doc/80x56/5e80f1348bd3533c5b1aea28/entries-strictly-limited-solos-1300-acts-groups-150-solos-1300-acts-groups-150.jpg)


