T. ROWE PRICE April 30, 2021 SEMIANNUAL REPORT TRGVX Global Value Equity Fund PRIGX Global Value Equity Fund– I Class For more insights from T. Rowe Price investment professionals, go to troweprice.com.
Transcript
T. ROWE PRICE
April 30, 2021SEMIANNUAL REPORT
TRGVX Global Value Equity Fund
PRIGX Global Value Equity Fund– I Class
For more insights from T. Rowe Price investment professionals, go to troweprice.com.
srgve_0421_P4Proof #
srgve_0421_P4Proof #
Log in to your account at troweprice.com for more information.
* Certain mutual fund accounts that are assessed an annual account service fee can also save money by switching to e-delivery.
It’s fast—receive your statements and confirmations faster than U.S. mail.
It’s convenient—access your important account documents whenever you need them.
It’s secure—we protect your online accounts using “True Identity” to confirm new accounts and make verification faster and more secure.
It can save you money—where applicable, T. Rowe Price passes on the cost savings to fund holders.*
TO ENROLL:If you invest directly with T. Rowe Price, go to troweprice.com/paperless.
If you invest through an investment advisor, a bank, or a brokerage firm, please contact that organization and ask if it can provide electronic documentation.
Go PaperlessSign up for e-delivery of your statements, confirmations, and prospectuses or shareholder reports.
T. ROWE PRICE GlObal ValuE EquITy Fund
HIGHLIGHTS
nn The Global Value Equity Fund–I Class returned 35.96% in the six-month period ended April 30, 2021, outperforming both the primary and secondary benchmarks and its peer group.
nn Stock selection within information technology, industrials and business services, and financials made significant positive relative contributions. By contrast, the overweighting to utilities detracted from returns on a relative basis.
nn As the outlook for the global economy improved, we bought a number of deeper-value stocks that had been disproportionately impacted by the pandemic and that, as a result, we believed stood to gain the most from improving conditions. In particular, we invested in industries such as travel, restaurants, and bank loans.
nn As we see signs of the start of a recovery period that could strengthen over the next 12–18 months, we believe this could provide a more sustained positive backdrop for value investing. A more constructive stance in the market’s longer-term prognosis for inflation and interest rates should similarly be very supportive.
srgve_0421_P4Proof #
1
T. ROWE PRICE GlObal ValuE EquITy Fund
CIO Market Commentary
Global stock markets produced very strong returns during the first half of your fund’s fiscal year, the six-month period ended April 30, 2021, while rising yields weighed on returns for bond investors. Although the coronavirus continued to spread in many regions, the beginning of vaccine distributions led investors to look beyond negative headlines in anticipation of a strong economic recovery.
All major global and regional equity benchmarks recorded positive results during the period, and returns in the 20% to 40% range were common across developed and emerging markets. Reports of successful vaccine trials in November increased hopes for a return to normalcy in 2021 and spurred a rotation toward segments that had been beaten down in the initial phase of the pandemic.
After a long period of underperformance, value shares outperformed their growth counterparts during the six-month period, and sector leaders also changed. Energy stocks produced strong gains as oil prices rebounded to their highest level in more than two years, and financials also outperformed as banks benefited from rising longer-term interest rates and improved lending margins. Meanwhile, information technology and consumer discretionary companies, which had been the big winners in the early days of the pandemic, trailed wider benchmarks, although they continued to produce solid gains. A weaker U.S. dollar aided returns for U.S. investors in most regions.
Besides the rollout of vaccines, extraordinary fiscal and monetary support from global governments and central banks remained a key factor in providing a supportive backdrop for markets. In the U.S., President Joe Biden signed the American Rescue Plan Act—a $1.9 trillion program that included direct payments of up to $1,400 to most Americans—into law in March. Central banks kept short-term lending rates near or even below zero, and both the Federal Reserve and the European Central Bank emphasized that the time had not yet arrived for scaling back asset purchases designed to keep downward pressure on long-term interest rates.
Although some regions continued to be impacted by lockdowns, there were signs of a rebound in many economies. The International Monetary Fund increased its forecast for global growth in 2021 to 6%, which would mark the fastest growth rate since 1976, and corporate earnings reports were generally better than expected.
srgve_0421_P4Proof #
2
T. ROWE PRICE GlObal ValuE EquITy Fund
While stock investors looked favorably on the continued accommodative policies and positive economic news, bond investors became concerned about rising inflation. As a result, yields of longer-term Treasuries and other high-quality sovereign debt surged during the period, weighing on returns in many fixed income sectors. High yield bonds, which are less sensitive to interest rate changes, produced strong results though, and tax-free municipal bonds recorded positive returns as states received pandemic-related financial assistance from the federal government and state tax revenues held up better than expected.
As we look ahead, the widespread rollout of vaccines, very supportive monetary and fiscal policies, and the release of pent-up consumer demand could provide support for additional market gains. However, we are aware that there are risks in this environment. Valuations are expensive under all but the most optimistic scenarios. In addition, there are signs of speculation in markets, as shown by the rapid rise in cryptocurrencies and capital formation through less conventional vehicles.
During the tumultuous market volatility of February and March 2020, our portfolio managers remained rooted in company fundamentals and focused on the long term—identifying companies with balance sheets that appeared strong enough to get them to the other side of this pandemic was a particular focus. As we hopefully move forward to better days, our investment teams will continue to follow this approach, applying strong fundamental analysis as they seek out the best investments for your portfolio.
Thank you for your continued confidence in T. Rowe Price.
Sincerely,
Robert SharpsGroup Chief Investment Officer
srgve_0421_P4Proof #
3
T. ROWE PRICE GlObal ValuE EquITy Fund
Management’s discussion of Fund Performance
INVESTMENT OBJECTIVE
The fund seeks long-term capital appreciation.
FUND COMMENTARY
How did the fund perform in the past six months?
The Global Value Equity Fund–I Class returned 35.96% in the six months ended April 30, 2021. The fund outperformed the MSCI World Index Net, the MSCI World Value Index Net, and the Lipper Global Multi-Cap Value Funds Average. (The return for the Investor Class shares reflects a different fee structure. Past performance cannot guarantee future results.)
What factors influenced the fund’s performance?
The information technology (IT) sector had a very favorable impact on the portfolio over the six-month period as shares of semiconductor-related companies rose. Many of our key semiconductor holdings—including Lam Research, Micron Technology, ASML, and SK Hynix—posted high double-
digit gains. The industry as a whole sold off early in 2020 on fears that the pandemic would lead to lower demand for chips. However, these shares rallied strongly as investors’ confidence and risk appetite returned. (Please refer to the fund’s portfolio of investments for a complete list of holdings and the amount each represents in the portfolio.)
The financials sector was another important source of performance over the review period, due to both our significant overweight position and our choice of securities. Bank stocks as a whole were particularly strong on the back of the promising vaccine developments as well as expectations of higher inflation and a steepening yield curve. Our beneficial holdings included Wells Fargo, Morgan Stanley, and ICICI Bank. Several nonbanks also performed well, including India-based commercial vehicle finance specialist Shriram Transport
Six-Month Period Ended 4/30/21 Total Return
Global Value Equity Fund 35.82%
Global Value Equity Fund–I Class 35.96
MSCI World Index net 29.10
MSCI World Value Index net 34.60
lipper Global Multi-Cap Value Funds average 33.51
The Institutional Global Value Equity Fund changed its name to Global Value Equity Fund and designated all outstanding shares as I Class as of March 1, 2020.
PERFORMANCE COMPARISON
srgve_0421_P4Proof #
4
T. ROWE PRICE GlObal ValuE EquITy Fund
Finance and digital financial services company Ally Financial. In the case of Morgan Stanley, its shares soared alongside many of its U.S. banking peers. This followed a sharp sector sell-off earlier in the year as investors worried about credit quality. We are encouraged that Morgan Stanley has de-risked its balance sheet and continued to reduce its exposure to volatile and capital-intensive activities in favor of higher-margin businesses such as wealth and asset management.
A number of our holdings within the industrials and business services sector, notably GE and commercial aircraft leasing company Aercap, contributed significantly to portfolio returns. General Electric, whose diversified conglomerate’s businesses include a number of industries, such as aviation, was hit hard by pandemic-related concerns. As such, the stock was one of the main beneficiaries of the improved sentiment in late 2020 and early 2021, with the share price rising sharply.
In such a buoyant market, there were few areas of negative performance over the review period. Defensive sectors underperformed, which meant our overweight position in utilities held back relative gains to some extent. In Latin America, our holdings in Brazil-based bus manufacturer Marcopolo came under pressure as coronavirus-related shutdowns lowered demand from both domestic and overseas clients. Mexico-based precious metals miner Fresnillo also significantly underperformed as the increased hopes of a global economic recovery drove down gold prices.
How is the fund positioned?
We made a number of adjustments to both our sector and country positioning over the review period. While our portfolio maintains a balance across the value style spectrum, we are positioned more bullishly than in the past. As the outlook for the global economy improved, we bought a number of deeper-value stocks that had been disproportionately impacted by the pandemic and that, as a result, we believed stood to gain the most from improving conditions. In particular, we invested in industries such as travel, restaurants, and bank loans. On a sector basis, we added to financials and raised the portfolio’s exposure to industrials and business services. Within financials, our exposure is tilted toward U.S. banks as we believe they stand to benefit from a favorable interest rate environment, are generally better managed than banks in other regions, and operate under the jurisdiction of a more benign regulator. We initiated a position in Wells Fargo; we believe the asset cap in place since 2018 could be removed, management is looking to tackle expenses more aggressively, and earnings are more likely to normalize as the economy recovers from the pandemic.
srgve_0421_P4Proof #
5
T. ROWE PRICE GlObal ValuE EquITy Fund
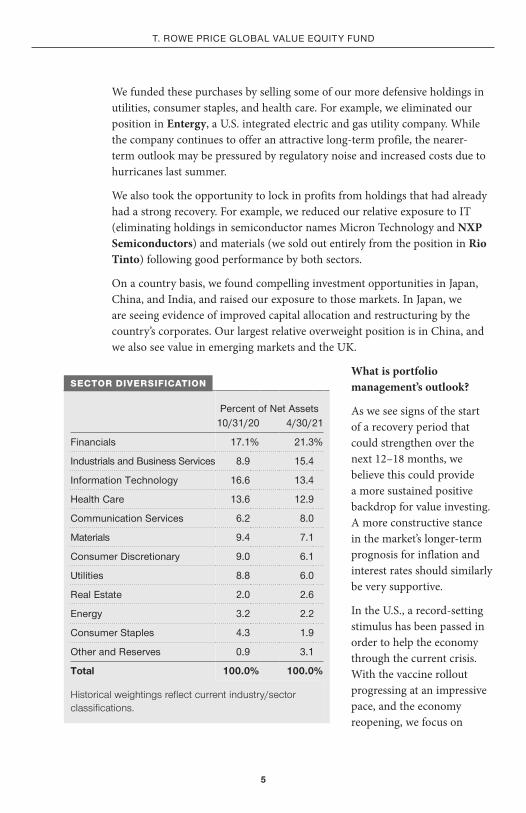
We funded these purchases by selling some of our more defensive holdings in utilities, consumer staples, and health care. For example, we eliminated our position in Entergy, a U.S. integrated electric and gas utility company. While the company continues to offer an attractive long-term profile, the nearer-term outlook may be pressured by regulatory noise and increased costs due to hurricanes last summer.
We also took the opportunity to lock in profits from holdings that had already had a strong recovery. For example, we reduced our relative exposure to IT (eliminating holdings in semiconductor names Micron Technology and NXP Semiconductors) and materials (we sold out entirely from the position in Rio Tinto) following good performance by both sectors.
On a country basis, we found compelling investment opportunities in Japan, China, and India, and raised our exposure to those markets. In Japan, we are seeing evidence of improved capital allocation and restructuring by the country’s corporates. Our largest relative overweight position is in China, and we also see value in emerging markets and the UK.
What is portfolio management’s outlook?
As we see signs of the start of a recovery period that could strengthen over the next 12–18 months, we believe this could provide a more sustained positive backdrop for value investing. A more constructive stance in the market’s longer-term prognosis for inflation and interest rates should similarly be very supportive.
In the U.S., a record-setting stimulus has been passed in order to help the economy through the current crisis. With the vaccine rollout progressing at an impressive pace, and the economy reopening, we focus on
Percent of net assets10/31/20 4/30/21
Financials 17.1% 21.3%
Industrials and business Services 8.9 15.4
Information Technology 16.6 13.4
Health Care 13.6 12.9
Communication Services 6.2 8.0
Materials 9.4 7.1
Consumer discretionary 9.0 6.1
utilities 8.8 6.0
Real Estate 2.0 2.6
Energy 3.2 2.2
Consumer Staples 4.3 1.9
Other and Reserves 0.9 3.1
Total 100.0% 100.0%
Historical weightings reflect current industry/sector classifications.
SECTOR DIVERSIFICATION
srgve_0421_P4Proof #
6
T. ROWE PRICE GlObal ValuE EquITy Fund
well-run companies. Certain industries look set to benefit most as the impact of the stimulus measures is fully felt. Higher inflation expectations could provide a further boost to stocks in the value space.
European nations were hit hard by the spread of the virus, but the outlook is improving with an acceleration of the vaccine distribution. Fiscal stimulus measures are being rolled out, and monetary policy remains accommodative. European markets were among the worst performers early last year, and we were able to find well-run companies with particularly inexpensive valuations.
In Asia, while the first cases of the coronavirus were reported in China, lockdown measures were eased earlier than the rest of the world and subsequent outbreaks appear to have been quickly contained. A return to some normalization has helped investor sentiment. Japan’s government has announced a significant fiscal stimulus package to aid the economic recovery. Crucially for investors such as ourselves, corporate governance in Japan has been improving in recent years, with companies becoming more shareholder friendly, and we continue to identify stocks with compelling valuations befitting of our value perspective.
Our strategy continues to invest across the value spectrum in the best ideas from our global research platform. We concentrate on the bottom-up view, with a focus on balancing our exposure to economically sensitive and “deep value” names. We also hold companies with strong free cash flow generation not yet fully appreciated by the market and with the scope to increase shareholder returns and look for pockets of controversy where fundamentally sound, well-run businesses face unwarranted investor skepticism. Given our robust research platform and collective experience, we are confident in our ability to find these unique opportunities before their potential for substantial prosperity becomes obvious to other investors.
The views expressed reflect the opinions of T. Rowe Price as of the date of this report and are subject to change based on changes in market, economic, or other conditions. These views are not intended to be a forecast of future events and are no guarantee of future results.
srgve_0421_P4Proof #
7
T. ROWE PRICE GlObal ValuE EquITy Fund
RISKS OF INTERNATIONAL INVESTING
Funds that invest overseas generally carry more risk than funds that invest strictly in U.S. assets. Funds investing in a single country or in a limited geographic region tend to be riskier than more diversified funds. Risks can result from varying stages of economic and political development; differing regulatory environments, trading days, and accounting standards; and higher transaction costs of non-U.S. markets. Non-U.S. investments are also subject to currency risk, or a decline in the value of a foreign currency versus the U.S. dollar, which reduces the dollar value of securities denominated in that currency.
The fund’s value approach to investing could cause it to underperform when compared with other stock funds that employ a different investment style. The intrinsic value of a stock with value characteristics may not be fully recognized by the market for a long time, or a stock judged to be undervalued may actually be appropriately priced at a low level.
Note: MSCI makes no express or implied warranties or representations and shall have no liability whatsoever with respect to any MSCI data contained herein. The MSCI data may not be further redistributed or used as a basis for other indices or any securities or financial products. This report is not approved, reviewed, or produced by MSCI.
srgve_0421_P4Proof #
8
T. ROWE PRICE GlObal ValuE EquITy Fund
TWENTY-FIVE LARGEST HOLDINGS
Percent ofnet assets
4/30/21
JPMorgan Chase, united States 2.4%Microsoft, united States 2.4Wells Fargo, united States 2.3bank of america, united States 2.2unitedHealth Group, united States 2.1
Facebook, united States 2.1GE, united States 1.9Morgan Stanley, united States 1.9uPS, united States 1.7astraZeneca, united Kingdom 1.6
Public Service Enterprise, united States 1.5Southern Company, united States 1.5abbVie, united States 1.5Caterpillar, united States 1.5Franco-nevada, Canada 1.5
Sempra Energy, united States 1.5Johnson & Johnson, united States 1.5Thermo Fisher Scientific, united States 1.5Fiserv, united States 1.4Walt disney, united States 1.4
american International Group, united States 1.4Welltower, united States 1.3T-Mobile uS, united States 1.2Coca-Cola, united States 1.2broadcom, united States 1.2
Total 41.7%
Note: The information shown does not reflect any exchange-traded funds (ETFs), cash reserves, or collateral for securities lending that may be held in the portfolio.
PORTFOLIO HIGHLIGHTS
srgve_0421_P4Proof #
9
T. ROWE PRICE GlObal ValuE EquITy Fund
AVERAGE ANNUAL COMPOUND TOTAL RETURN
Periods Ended 4/30/21One year
Five years
Since Inception
Inception date
Global Value Equity Fund 51.52% – 29.04% 3/2/20
Global Value Equity Fund–I Class 51.66 12.10% 12.31 7/26/12
This table shows how the fund would have performed each year if its actual (or cumulative) returns for the periods shown had been earned at a constant rate. Returns do not reflect taxes that the shareholder may pay on fund distributions or the redemption of shares. Past performance cannot guarantee future results. Investors should note that the fund’s short-term performance is highly unusual and unlikely to be sustained.
This chart shows the value of a hypothetical $10,000 investment in the fund over the past 10 fiscal year periods or since inception (for funds lacking 10-year records). The result is compared with benchmarks, which include a broad-based market index and may also include a peer group average or index. Market indexes do not include expenses, which are deducted from fund returns as well as mutual fund averages and indexes.
GROWTH OF $10,000
Note: Performance for the Investor Class shares will vary due to its differing fee structure. See the Average Annual Compound Total Return table.
As of 4/30/21
$27,65128,28822,191
Global Value Equity Fund–I ClassMSCI World Index netMSCI World Value Index net
4/214/204/194/184/174/164/154/144/137/26/12
10,000
15,000
20,000
25,000
30,000
$35,000
GLOBAL VALUE EQUITY FUND–I CLASS
srgve_0421_P4Proof #
10
T. ROWE PRICE GlObal ValuE EquITy Fund
EXPENSE RATIO
Global Value Equity Fund 3.93%
Global Value Equity Fund–I Class 3.04
The expense ratio is as of the fund’s most recent prospectus. This number may vary from the expense ratio shown elsewhere in this report because it is based on a different time period and, if applicable, includes acquired fund fees and expenses but does not include fee or expense waivers.
FUND EXPENSE EXAMPLE
As a mutual fund shareholder, you may incur two types of costs: (1) transaction costs, such as redemption fees or sales loads, and (2) ongoing costs, including management fees, distribution and service (12b-1) fees, and other fund expenses. The following example is intended to help you understand your ongoing costs (in dollars) of investing in the fund and to compare these costs with the ongoing costs of investing in other mutual funds. The example is based on an investment of $1,000 invested at the beginning of the most recent six-month period and held for the entire period.
Please note that the fund has two share classes: The original share class (Investor Class) charges no distribution and service (12b-1) fee, and the I Class shares are also available to institutionally oriented clients and impose no 12b-1 or administrative fee payment. Each share class is presented separately in the table.
Actual ExpensesThe first line of the following table (Actual) provides information about actual account values and expenses based on the fund’s actual returns. You may use the information on this line, together with your account balance, to estimate the expenses that you paid over the period. Simply divide your account value by $1,000 (for example, an $8,600 account value divided by $1,000 = 8.6), then multiply the result by the number on the first line under the heading “Expenses Paid During Period” to estimate the expenses you paid on your account during this period.
Hypothetical Example for Comparison PurposesThe information on the second line of the table (Hypothetical) is based on hypothetical account values and expenses derived from the fund’s actual expense ratio and an assumed 5% per year rate of return before expenses (not the fund’s actual return). You may compare the ongoing costs of investing in the fund with other funds by contrasting this 5% hypothetical example and the 5% hypothetical examples that appear in the shareholder reports of the other funds. The hypothetical account values and expenses may not be used to estimate the actual ending account balance or expenses you paid for the period.
srgve_0421_P4Proof #
11
T. ROWE PRICE GlObal ValuE EquITy Fund
FUND EXPENSE EXAMPLE (CONTINUED)
Note: T. Rowe Price charges an annual account service fee of $20, generally for accounts with less than $10,000. The fee is waived for any investor whose T. Rowe Price mutual fund accounts total $50,000 or more; accounts electing to receive electronic delivery of account statements, transaction confirmations, prospectuses, and shareholder reports; or accounts of an investor who is a T. Rowe Price Personal Services or Enhanced Personal Services client (enrollment in these programs generally requires T. Rowe Price assets of at least $250,000). This fee is not included in the accompanying table. If you are subject to the fee, keep it in mind when you are estimating the ongoing expenses of investing in the fund and when comparing the expenses of this fund with other funds.
You should also be aware that the expenses shown in the table highlight only your ongoing costs and do not reflect any transaction costs, such as redemption fees or sales loads. Therefore, the second line of the table is useful in comparing ongoing costs only and will not help you determine the relative total costs of owning different funds. To the extent a fund charges transaction costs, however, the total cost of owning that fund is higher.
beginningaccount Value
11/1/20
Endingaccount Value
4/30/21
Expenses Paidduring Period*
11/1/20 to 4/30/21
Investor Classactual $1,000.00 $1,358.20 $5.20
Hypothetical (assumes 5% return before expenses) 1,000.00 1,020.38 4.46
I Classactual 1,000.00 1,359.60 3.98
Hypothetical (assumes 5% return before expenses) 1,000.00 1,021.42 3.41
* Expenses are equal to the fund’s annualized expense ratio for the 6-month period, multiplied by the average account value over the period, multiplied by the number of days in the most recent fiscal half year (181), and divided by the days in the year (365) to reflect the half-year period. The annualized expense ratio of the Investor Class was 0.89%, and the I Class was 0.68%.
GLOBAL VALUE EQUITY FUND
srgve_0421_P4Proof #
12
T. ROWE PRICE GlObal ValuE EquITy Fund
QUARTER-END RETURNS
Periods Ended 3/31/21One year
Five years
Since Inception
Inception date
Global Value Equity Fund 62.11% – 28.20% 3/2/20
Global Value Equity Fund– I Class 62.43 11.54% 12.07 7/26/12
The fund’s performance information represents only past performance and is not necessarily an indication of future results. Current performance may be lower or higher than the performance data cited. Share price, principal value, and return will vary, and you may have a gain or loss when you sell your shares. For the most recent month-end performance, please visit our website (troweprice.com) or contact a T. Rowe Price representative at 1-800-225-5132 or, for I Class shares, 1-800-638-8790.
This table provides returns through the most recent calendar quarter-end rather than through the end of the fund’s fiscal period. It shows how the fund would have performed each year if its actual (or cumulative) returns for the periods shown had been earned at a constant rate. Average annual total return figures include changes in principal value, reinvested dividends, and capital gain distributions. Returns do not reflect taxes that the shareholder may pay on fund distributions or the redemption of fund shares. When assessing performance, investors should consider both short- and long-term returns. Investors should note that the fund’s short-term performance is highly unusual and unlikely to be sustained.
srgve_0421_P4Proof #
13
The accompanying notes are an integral part of these financial statements.
T. ROWE PRICE GlObal ValuE EquITy Fund
unaudited
T. ROWE PRICE GLOBAL VALUE EQUITY FUND
(Unaudited)
FINANCIAL HIGHLIGHTS
1
For a share outstanding throughout each period
Investor Class (1)
6 Months . Ended 4/30/21
3/2/20 (1) Through 10/31/20
NET ASSET VALUE Beginning of period $ 11.87 $ 11.99
Investment activities Net investment income (2)(3) 0.11 0.12 Net realized and unrealized gain/loss 4.12 (0.24 ) Total from investment activities 4.23 (0.12 )
Distributions Net investment income (0.16 ) —
NET ASSET VALUE End of period $ 15.94 $ 11.87
Ratios/Supplemental Data
Total return (3)(4) 35.82% (1.00)%
Ratios to average net assets: (3) Gross expenses before waivers/payments by Price Associates 2.50% (5) 3.94% (5) Net expenses after waivers/payments by Price Associates 0.89% (5) 0.89% (5) Net investment income 1.54% (5) 1.56% (5)
Portfolio turnover rate 28.1% 76.1% Net assets, end of period (in thousands) $8,643 $918
0.00 % 0.00 %
(1) Inception date (2) Per share amounts calculated using average shares outstanding method. (3) See Note 7 for details of expense-related arrangements with Price Associates. (4) Total return refl ects the rate that an investor would have earned on an investment in the
fund during each period, assuming reinvestment of all distributions, and payment of no redemption or account fees, if applicable. Total return is not annualized for periods less than one year.
(5) Annualized
The accompanying notes are an integral part of these financial statements.
Total return (2)(4) 35.96% (3.28)% 10.54% (4.27)% 22.41% 2.12%
Ratios to average net assets: (2) Gross expenses before waivers/payments by Price Associates 2.40% (5) 3.15% 3.10% 2.90% 3.15% 3.60% Net expenses after waivers/payments by Price Associates 0.68% (5) 0.80% (6) 0.75% 0.75% 0.75% 0.75% Net investment income 1.47% (5) 1.62% 2.25% 1.87% 1.45% 1.95%
Portfolio turnover rate 28.1% 76.1% 79.1% 100.4% 84.0% 108.3% Net assets, end of period (in thousands) $13,929 $9,728 $10,704 $10,438 $11,243 $8,910
0.00 % 0.00 % 0.00 % 0.00 % 0.00 % 0.00 %
(1) Per share amounts calculated using average shares outstanding method. (2) See Note 7 for details of expense-related arrangements with Price Associates. (3) Amounts round to less than $0.01 per share. (4) Total return refl ects the rate that an investor would have earned on an investment in the
fund during each period, assuming reinvestment of all distributions, and payment of no redemption or account fees, if applicable. Total return is not annualized for periods less than one year.
(5) Annualized (6) See Note 7. Includes one-time expenses related to the fund restructure (0.09% of average
net assets).
The accompanying notes are an integral part of these financial statements.
srgve_0421_P4Proof #
16
T. ROWE PRICE GlObal ValuE EquITy Fund
april 30, 2021 (unaudited)
T. ROWE PRICE GLOBAL VALUE EQUITY FUND
April 30, 2021 (Unaudited)
4
PORTFOLIO OF INVESTMENTS‡ Shares
$ Value
( Cost and value in $000s) ‡
AUSTRALIA 0.5% Common Stocks 0.5%
Downer EDI 26,821 116
Total Australia (Cost $97 ) 116 AUSTRIA 0.8%
Common Stocks 0.8%
BAWAG Group 3,474 187
Total Austria (Cost $156 ) 187 BRAZIL 0.5%
Preferred Stocks 0.5%
Marcopolo (1) 234,763 113
Total Brazil (Cost $128 ) 113 CANADA 2.1%
Common Stocks 2.1%
Air Canada (2) 7,166 145 Franco-Nevada 2,370 330
Total Canada (Cost $381 ) 475 CHINA 4.8%
Common Stocks 3.8%
Beijing Capital International Airport, H Shares (HKD) 174,000 126 China Overseas Land & Investment (HKD) 52,500 133 Hope Education Group (HKD) (3) 356,000 120 JOYY, ADR (USD) 1,546 147 Trip.com Group, ADR (USD) (2) 4,012 157 Yangzijiang Shipbuilding Holdings (SGD) 171,500 184
867 Common Stocks - China A Shares 1.0%
Gree Electric Appliances of Zhuhai, A Shares (CNH) 12,058 111
srgve_0421_P4Proof #
17
T. ROWE PRICE GlObal ValuE EquITy FundT. ROWE PRICE GLOBAL VALUE EQUITY FUND
5
Shares
$ Value
( Cost and value in $000s)
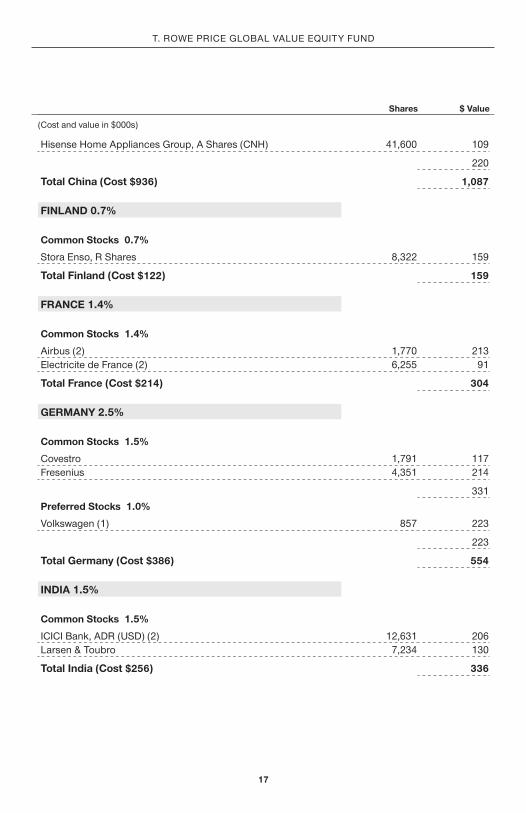
Hisense Home Appliances Group, A Shares (CNH) 41,600 109
220
Total China (Cost $936 ) 1,087 FINLAND 0.7%
Common Stocks 0.7%
Stora Enso, R Shares 8,322 159
Total Finland (Cost $122 ) 159 FRANCE 1.4%
Common Stocks 1.4%
Airbus (2) 1,770 213 Electricite de France (2) 6,255 91
Total United Kingdom (Cost $1,235 ) 1,471 UNITED STATES 56.4%
Common Stocks 56.4%
AbbVie 3,019 337 Albemarle 918 154 American International Group 6,452 313 Bank of America 12,263 497 Broadcom 585 267 Capital One Financial 1,681 251 Caterpillar 1,453 331 CF Industries Holdings 2,983 145 Chubb 1,469 252 Citrix Systems 1,582 196 Coca-Cola 5,089 275 ConocoPhillips 3,496 179 Equitable Holdings 6,291 215 Facebook, Class A (2) 1,450 471 Fiserv (2) 2,685 323 General Electric 32,135 422 GrafTech International 10,100 128 Hartford Financial Services Group 3,069 202 HCA Healthcare 1,072 216 Johnson & Johnson 2,018 328 JPMorgan Chase 3,564 548 Korn Ferry 2,191 149 Lam Research 368 228 Microchip Technology 1,275 192 Microsoft 2,124 536 Morgan Stanley 5,084 420 NextEra Energy 3,268 253 Packaging Corp. of America 1,798 265 PRA Group (2) 3,792 143 Public Service Enterprise Group 5,400 341 QUALCOMM 1,647 229 RenaissanceRe Holdings 1,194 202 Sempra Energy 2,399 330 Shoals Technologies Group, Class A (2) 3,126 100 Southern 5,115 338 Southwest Airlines (2) 3,542 222 T-Mobile U.S. (2) 2,126 281
srgve_0421_P4Proof #
21
T. ROWE PRICE GlObal ValuE EquITy FundT. ROWE PRICE GLOBAL VALUE EQUITY FUND
9
Shares
$ Value
( Cost and value in $000s)
Thermo Fisher Scientifi c 697 328 United Parcel Service, Class B 1,923 392 UnitedHealth Group 1,194 476 Walt Disney (2) 1,689 314 Wells Fargo 11,455 516 Welltower, REIT 3,867 290 Westlake Chemical 1,430 134
Total United States (Cost $9,526 ) 12,729 SHORT-TERM INVESTMENTS 2.8%
Money Market Funds 2.8%
T. Rowe Price Government Reserve Fund, 0.02% (4)(5) 639,964 640
Total Short-Term Investments (Cost $640) 640
SECURITIES LENDING COLLATERAL 0.4%
INVESTMENTS IN A POOLED ACCOUNT THROUGH SECURITIES LENDING PROGRAM WITH JPMORGAN CHASE BANK 0.4%
Short-Term Funds 0.4%
T. Rowe Price Short-Term Fund, 0.09% (4)(5) 10,080 101
Total Investments in a Pooled Account through Securities Lending Program with JPMorgan Chase Bank 101
Total Securities Lending Collateral (Cost $101) 101
Total Investments in Securities
100.2% of Net Assets (Cost $17,658) $ 22,620
‡ Country classifi cations are generally based on MSCI categories or another unaffi liated third party data provider; Shares are denominated in the currency of the country presented unless otherwise noted.
(1) Preferred stocks are shares that carry certain preferential rights. The dividend rate may not be consistent each pay period and could be zero for a particular year.
(2) Non-income producing (3) See Note 4. All or a portion of this security is on loan at April 30, 2021. (4) Seven-day yield (5) Affi liated Companies
ADR American Depositary Receipts CNH Off shore China Renminbi
srgve_0421_P4Proof #
22
T. ROWE PRICE GlObal ValuE EquITy FundT. ROWE PRICE GLOBAL VALUE EQUITY FUND
10
GBP British Pound HKD Hong Kong Dollar JPY Japanese Yen
REIT A domestic Real Estate Investment Trust whose distributions pass-through with original tax character to the shareholder
SGD Singapore Dollar USD U.S. Dollar
srgve_0421_P4Proof #
23
T. ROWE PRICE GlObal ValuE EquITy FundT. ROWE PRICE GLOBAL VALUE EQUITY FUND
Gain/(Loss) Bank of America 5/14/21 USD 55 JPY 6,009 $ — Goldman Sachs 5/14/21 JPY 27,054 USD 250 ( 2 ) HSBC Bank 5/14/21 USD 219 JPY 24,036 ( 1 ) JPMorgan Chase 5/14/21 USD 110 JPY 12,025 — Morgan Stanley 5/14/21 JPY 27,054 USD 250 ( 2 ) Morgan Stanley 5/14/21 USD 110 JPY 12,037 — Net unrealized gain (loss) on open forward currency exchange contracts $ ( 5 )
srgve_0421_P4Proof #
24
T. ROWE PRICE GlObal ValuE EquITy Fund
The accompanying notes are an integral part of these financial statements.
T. ROWE PRICE GLOBAL VALUE EQUITY FUND
12
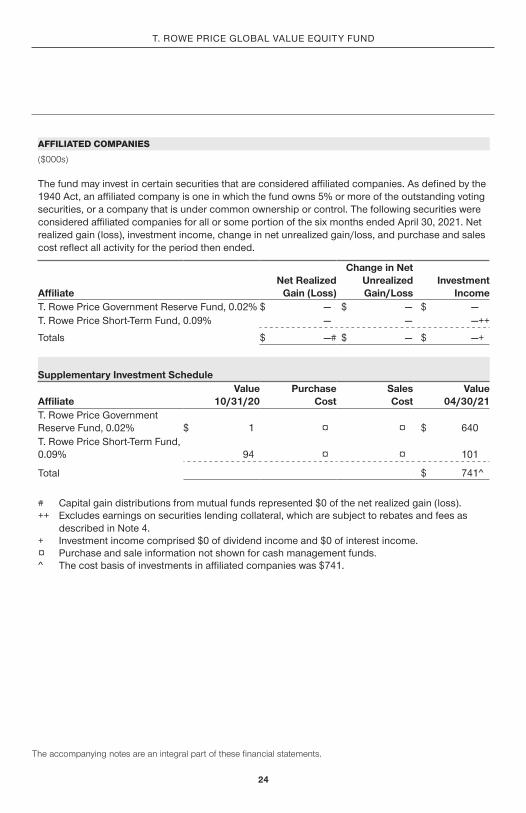
AFFILIATED COMPANIES ($000s) The fund may invest in certain securities that are considered affi liated companies. As defi ned by the 1940 Act, an affi liated company is one in which the fund owns 5% or more of the outstanding voting securities, or a company that is under common ownership or control. The following securities were considered affi liated companies for all or some portion of the six months ended April 30, 2021. Net realized gain (loss), investment income, change in net unrealized gain/loss, and purchase and sales cost refl ect all activity for the period then ended.
Affi liate Net Realized
Gain (Loss)
Change in Net Unrealized Gain/Loss
Investment Income
T. Rowe Price Government Reserve Fund, 0.02% $ — $ — $ — T. Rowe Price Short-Term Fund, 0.09% — — — ++
Totals $ — # $ — $ — +
Supplementary Investment Schedule
Affi liate Value
10/31/20 Purchase
Cost Sales Cost
Value 04/30/21
T. Rowe Price Government Reserve Fund, 0.02% $ 1 ¤ ¤ $ 640 T. Rowe Price Short-Term Fund, 0.09% 94 ¤ ¤ 101
Total $ 741 ̂
# Capital gain distributions from mutual funds represented $0 of the net realized gain (loss). ++ Excludes earnings on securities lending collateral, which are subject to rebates and fees as
described in Note 4. + Investment income comprised $0 of dividend income and $0 of interest income. ¤ Purchase and sale information not shown for cash management funds. ̂ The cost basis of investments in affi liated companies was $741.
The accompanying notes are an integral part of these financial statements.
srgve_0421_P4Proof #
25
T. ROWE PRICE GlObal ValuE EquITy Fund
april 30, 2021 (unaudited)
The accompanying notes are an integral part of these financial statements.
T. ROWE PRICE GLOBAL VALUE EQUITY FUND
April 30, 2021 (Unaudited)
STATEMENT OF ASSETS AND LIABILITIES
13
($000s, except shares and per share amounts)
Assets Investments in securities, at value (cost $17,658) $ 22,620 Dividends receivable 32 Receivable for investment securities sold 29 Foreign currency (cost $28) 28 Receivable for shares sold 24 Due from affi liates 20 Other assets 66 Total assets 22,819
Liabilities Payable for investment securities purchased 102 Obligation to return securities lending collateral 101 Investment management fees payable 11 Unrealized loss on forward currency exchange contracts 5 Other liabilities 28 Total liabilities 247
NET ASSETS $ 22,572
Net Assets Consist of: Total distributable earnings (loss) $ 5,569 Paid-in capital applicable to 1,414,643 shares of $0.01 par value capital stock outstanding; 1,000,000,000 shares of the Corporation authorized 17,003
NET ASSETS $ 22,572
NET ASSET VALUE PER SHARE
Investor Class ($8,643,270 / 542,296 shares outstanding) $ 15.94 I Class ($13,928,364 / 872,347 shares outstanding) $ 15.97
srgve_0421_P4Proof #
26
T. ROWE PRICE GlObal ValuE EquITy Fund
unaudited
The accompanying notes are an integral part of these financial statements.
T. ROWE PRICE GLOBAL VALUE EQUITY FUND
(Unaudited)
STATEMENT OF OPERATIONS
14
($000s)
6 Months Ended
4/30/21 Investment Income (Loss) Dividend Income (net of foreign taxes of $11) $ 189 Expenses
Investment management 54 Shareholder servicing
Investor Class 4 Prospectus and shareholder reports
Investor Class $ 2 I Class 1 3
Custody and accounting 72 Registration 37 Legal and audit 19 Executive, directors, and offi cer insurance 14 Miscellaneous 3 Waived / paid by Price Associates (143 ) Total expenses 63
Net investment income 126
Realized and Unrealized Gain / Loss – Net realized gain on securities (net of foreign taxes of $7) 1,006 Change in net unrealized gain / loss
Securities (net of increase in deferred foreign taxes of $3) 3,344 Forward currency exchange contracts (5 ) Change in net unrealized gain / loss 3,339
Net realized and unrealized gain / loss 4,345
INCREASE IN NET ASSETS FROM OPERATIONS $ 4,471
srgve_0421_P4Proof #
27
T. ROWE PRICE GlObal ValuE EquITy Fund
unaudited
T. ROWE PRICE GLOBAL VALUE EQUITY FUND
(Unaudited)
STATEMENT OF CHANGES IN NET ASSETS
15
($000s)
6 Months Ended
4/30/21
Year Ended
10/31/20 Increase (Decrease) in Net Assets Operations
Net investment income $ 126 $ 165 Net realized gain (loss) 1,006 ( 325 ) Change in net unrealized gain / loss 3,339 ( 118 ) Increase (decrease) in net assets from operations 4,471 ( 278 )
Distributions to shareholders Net earnings
Investor Class ( 30 ) – I Class ( 131 ) ( 255 )
Decrease in net assets from distributions ( 161 ) ( 255 )
Capital share transactions * Shares sold
Investor Class 8,925 1,405 I Class 1,167 764
Distributions reinvested Investor Class 26 – I Class 23 45
Shares redeemed Investor Class ( 2,150 ) ( 510 ) I Class ( 375 ) ( 1,229 )
Increase in net assets from capital share transactions 7,616 475
srgve_0421_P4Proof #
28
T. ROWE PRICE GlObal ValuE EquITy Fund
unaudited
The accompanying notes are an integral part of these financial statements.
T. ROWE PRICE GLOBAL VALUE EQUITY FUND
(Unaudited)
STATEMENT OF CHANGES IN NET ASSETS
16
($000s)
The accompanying notes are an integral part of these financial statements.
6 Months Ended
4/30/21
Year Ended
10/31/20 Net Assets Increase (decrease) during period 11,926 ( 58 ) Beginning of period 10,646 10,704 End of period $ 22,572 $ 10,646
*Share information Shares sold
Investor Class 605 123 I Class 77 65
Distributions reinvested Investor Class 2 – I Class 2 3
Shares redeemed Investor Class ( 142 ) ( 46 ) I Class ( 25 ) ( 101 )
Increase in shares outstanding 519 44
srgve_0421_P4Proof #
29
T. ROWE PRICE GlObal ValuE EquITy Fund
unaudited
T. ROWE PRICE GLOBAL VALUE EQUITY FUND
Unaudited
NOTES TO FINANCIAL STATEMENTS
17
T. Rowe Price Global Funds, Inc. (the corporation) is registered under the Investment Company Act of 1940 (the 1940 Act). The Global Value Equity Fund (the fund) is a diversified , open-end management investment company established by the corporation. The fund seeks long-term capital appreciation. The fund has two classes of shares: the Global Value Equity Fund (Investor Class) and the Global Value Equity Fund–I Class (I Class). I Class shares require a $1 million initial investment minimum, although the minimum generally is waived for retirement plans, financial intermediaries, and certain other accounts. Each class has exclusive voting rights on matters related solely to that class; separate voting rights on matters that relate to both classes; and, in all other respects, the same rights and obligations as the other class.
NOTE 1 - SIGNIFICANT ACCOUNTING POLICIES
Basis of Preparation The fund is an investment company and follows accounting and reporting guidance in the Financial Accounting Standards Board (FASB) Accounting Standards Codification Topic 946 (ASC 946). The accompanying financial statements were prepared in accordance with accounting principles generally accepted in the United States of America (GAAP), including, but not limited to, ASC 946. GAAP requires the use of estimates made by management. Management believes that estimates and valuations are appropriate; however, actual results may differ from those estimates, and the valuations reflected in the accompanying financial statements may differ from the value ultimately realized upon sale or maturity.
Investment Transactions, Investment Income, and Distributions Investment transactions are accounted for on the trade date basis. Income and expenses are recorded on the accrual basis. Realized gains and losses are reported on the identified cost basis. Income tax-related interest and penalties, if incurred, are recorded as income tax expense. Dividends received from mutual fund investments are reflected as dividend income; capital gain distributions are reflected as realized gain/loss. Dividend income and capital gain distributions are recorded on the ex-dividend date. Distributions from REITs are initially recorded as dividend income and, to the extent such represent a return of capital or capital gain for tax purposes, are reclassified when such information becomes available. Non-cash dividends, if any, are recorded at the fair market value of the asset received. Distributions to shareholders are recorded on the ex-dividend date. Income distributions, if any, are declared and paid by each class annually. A capital gain distribution may also be declared and paid by the fund annually.
srgve_0421_P4Proof #
30
T. ROWE PRICE GlObal ValuE EquITy FundT. ROWE PRICE GLOBAL VALUE EQUITY FUND
18
Currency Translation Assets, including investments, and liabilities denominated in foreign currencies are translated into U.S. dollar values each day at the prevailing exchange rate, using the mean of the bid and asked prices of such currencies against U.S. dollars as quoted by a major bank. Purchases and sales of securities, income, and expenses are translated into U.S. dollars at the prevailing exchange rate on the respective date of such transaction. The effect of changes in foreign currency exchange rates on realized and unrealized security gains and losses is not bifurcated from the portion attributable to changes in market prices.
Class Accounting Shareholder servicing, prospectus, and shareholder report expenses incurred by each class are charged directly to the class to which they relate. Expenses common to both classes, investment income, and realized and unrealized gains and losses are allocated to the classes based upon the relative daily net assets of each class.
Capital Transactions Each investor’s interest in the net assets of the fund is represented by fund shares. The fund’s net asset value (NAV) per share is computed at the close of the New York Stock Exchange (NYSE), normally 4 p.m. ET, each day the NYSE is open for business. However, the NAV per share may be calculated at a time other than the normal close of the NYSE if trading on the NYSE is restricted, if the NYSE closes earlier, or as may be permitted by the SEC. Purchases and redemptions of fund shares are transacted at the next-computed NAV per share, after receipt of the transaction order by T. Rowe Price Associates, Inc., or its agents.
Indemnification In the normal course of business, the fund may provide indemnification in connection with its officers and directors, service providers, and/or private company investments. The fund’s maximum exposure under these arrangements is unknown; however, the risk of material loss is currently considered to be remote.
NOTE 2 - VALUATION
Fair Value The fund’s financial instruments are valued at the close of the NYSE and are reported at fair value, which GAAP defines as the price that would be received to sell an asset or paid to transfer a liability in an orderly transaction between market participants at the measurement date. The T. Rowe Price Valuation Committee (the Valuation Committee) is an internal committee that has been delegated certain responsibilities by the fund’s Board of Directors (the Board) to ensure that financial instruments are appropriately priced at fair value in accordance with GAAP and the 1940 Act. Subject to oversight by the Board, the Valuation Committee develops and oversees pricing-related policies and procedures and approves all fair value determinations. Specifically, the Valuation Committee establishes policies and procedures used in valuing financial instruments, including those which cannot be valued in accordance
srgve_0421_P4Proof #
31
T. ROWE PRICE GlObal ValuE EquITy FundT. ROWE PRICE GLOBAL VALUE EQUITY FUND
19
with normal procedures or using pricing vendors; determines pricing techniques, sources, and persons eligible to effect fair value pricing actions; evaluates the services and performance of the pricing vendors; oversees the pricing process to ensure policies and procedures are being followed; and provides guidance on internal controls and valuation-related matters. The Valuation Committee provides periodic reporting to the Board on valuation matters.
Various valuation techniques and inputs are used to determine the fair value of financial instruments. GAAP establishes the following fair value hierarchy that categorizes the inputs used to measure fair value:
Level 1 – quoted prices (unadjusted) in active markets for identical financial instruments that the fund can access at the reporting date
Level 2 – inputs other than Level 1 quoted prices that are observable, either directly or indirectly (including, but not limited to, quoted prices for similar financial instruments in active markets, quoted prices for identical or similar financial instruments in inactive markets, interest rates and yield curves, implied volatilities, and credit spreads)
Level 3 – unobservable inputs (including the fund's own assumptions in determining fair value)
Observable inputs are developed using market data, such as publicly available information about actual events or transactions, and reflect the assumptions that market participants would use to price the financial instrument. Unobservable inputs are those for which market data are not available and are developed using the best information available about the assumptions that market participants would use to price the financial instrument. GAAP requires valuation techniques to maximize the use of relevant observable inputs and minimize the use of unobservable inputs. When multiple inputs are used to derive fair value, the financial instrument is assigned to the level within the fair value hierarchy based on the lowest-level input that is significant to the fair value of the financial instrument. Input levels are not necessarily an indication of the risk or liquidity associated with financial instruments at that level but rather the degree of judgment used in determining those values.
Valuation Techniques Equity securities, including exchange-traded funds, listed or regularly traded on a securities exchange or in the over-the-counter (OTC) market are valued at the last quoted sale price or, for certain markets, the official closing price at the time the valuations are made. OTC Bulletin Board securities are valued at the mean of the closing bid and asked prices. A security that is listed or traded on more than one exchange is valued at the quotation on the exchange determined to be the primary
srgve_0421_P4Proof #
32
T. ROWE PRICE GlObal ValuE EquITy FundT. ROWE PRICE GLOBAL VALUE EQUITY FUND
20
market for such security. Listed securities not traded on a particular day are valued at the mean of the closing bid and asked prices for domestic securities and the last quoted sale or closing price for international securities.
The last quoted prices of non-U.S. equity securities may be adjusted to reflect the fair value of such securities at the close of the NYSE, if the fund determines that developments between the close of a foreign market and the close of the NYSE will affect the value of some or all of its portfolio securities. Each business day, the fund uses information from outside pricing services to evaluate and, if appropriate, decide whether it is necessary to adjust quoted prices to reflect fair value by reviewing a variety of factors, including developments in foreign markets, the performance of U.S. securities markets, and the performance of instruments trading in U.S. markets that represent foreign securities and baskets of foreign securities. The fund uses outside pricing services to provide it with quoted prices and information to evaluate or adjust those prices. The fund cannot predict how often it will use quoted prices and how often it will determine it necessary to adjust those prices to reflect fair value.
Investments in mutual funds are valued at the mutual fund’s closing NAV per share on the day of valuation. Forward currency exchange contracts are valued using the prevailing forward exchange rate. Assets and liabilities other than financial instruments, including short-term receivables and payables, are carried at cost, or estimated realizable value, if less, which approximates fair value.
Investments for which market quotations or market-based valuations are not readily available or deemed unreliable are valued at fair value as determined in good faith by the Valuation Committee, in accordance with fair valuation policies and procedures. The objective of any fair value pricing determination is to arrive at a price that could reasonably be expected from a current sale. Financial instruments fair valued by the Valuation Committee are primarily private placements, restricted securities, warrants, rights, and other securities that are not publicly traded. Factors used in determining fair value vary by type of investment and may include market or investment specific considerations. The Valuation Committee typically will afford greatest weight to actual prices in arm’s length transactions, to the extent they represent orderly transactions between market participants, transaction information can be reliably obtained, and prices are deemed representative of fair value. However, the Valuation Committee may also consider other valuation methods such as market-based valuation multiples; a discount or premium from market value of a similar, freely traded security of the same issuer; discounted cash flows; yield to maturity; or some combination. Fair value determinations are reviewed on a regular basis and updated as information becomes available, including actual purchase and sale transactions of the investment. Because any
srgve_0421_P4Proof #
33
T. ROWE PRICE GlObal ValuE EquITy FundT. ROWE PRICE GLOBAL VALUE EQUITY FUND
21
fair value determination involves a significant amount of judgment, there is a degree of subjectivity inherent in such pricing decisions, and fair value prices determined by the Valuation Committee could differ from those of other market participants.
Valuation Inputs The following table summarizes the fund’s financial instruments, based on the inputs used to determine their fair values on April 30, 2021 (for further detail by category, please refer to the accompanying Portfolio of Investments):
During the six months ended April 30, 2021, the fund invested in derivative instruments. As defined by GAAP, a derivative is a financial instrument whose value is derived from an underlying security price, foreign exchange rate, interest rate, index of prices or rates, or other variable; it requires little or no initial investment and permits or requires net settlement. The fund invests in derivatives only if the expected risks and rewards are consistent with its investment objectives, policies, and overall risk profile, as described in its prospectus and Statement of Additional Information. The fund may use derivatives for a variety of purposes, such as seeking to hedge against declines in principal value, increase yield, invest in an asset with greater efficiency and at a lower cost than is possible through direct investment, to enhance return, or to adjust credit exposure. The risks associated with the use of derivatives are different from, and potentially much
srgve_0421_P4Proof #
34
T. ROWE PRICE GlObal ValuE EquITy FundT. ROWE PRICE GLOBAL VALUE EQUITY FUND
22
greater than, the risks associated with investing directly in the instruments on which the derivatives are based. The fund at all times maintains sufficient cash reserves, liquid assets, or other SEC-permitted asset types to cover its settlement obligations under open derivative contracts.
The fund values its derivatives at fair value and recognizes changes in fair value currently in its results of operations. Accordingly, the fund does not follow hedge accounting, even for derivatives employed as economic hedges. Generally, the fund accounts for its derivatives on a gross basis. It does not offset the fair value of derivative liabilities against the fair value of derivative assets on its financial statements, nor does it offset the fair value of derivative instruments against the right to reclaim or obligation to return collateral. The following table summarizes the fair value of the fund’s derivative instruments held as of April 30, 2021, and the related location on the accompanying Statement of Assets and Liabilities, presented by primary underlying risk exposure:
($000s) Location on Statement of
Assets and Liabilities Fair Value
Assets
Foreign exchange derivatives Forwards $ —*
Total $ —
Liabilities
Foreign exchange derivatives Forwards $ 5
Total $ 5
* Amount represents less than $1,000.
srgve_0421_P4Proof #
35
T. ROWE PRICE GlObal ValuE EquITy FundT. ROWE PRICE GLOBAL VALUE EQUITY FUND
23
Additionally, the amount of gains and losses on derivative instruments recognized in fund earnings during the six months ended April 30, 2021, and the related location on the accompanying Statement of Operations is summarized in the following table by primary underlying risk exposure:
Counterparty Risk and Collateral The fund invests in derivatives, such as bilateral swaps, forward currency exchange contracts, or OTC options, that are transacted and settle directly with a counterparty (bilateral derivatives), and thereby may expose the fund to counterparty risk. To mitigate this risk, the fund has entered into master netting arrangements (MNAs) with certain counterparties that permit net settlement under specified conditions and, for certain counterparties, also require the exchange of collateral to cover mark-to-market exposure. MNAs may be in the form of International Swaps and Derivatives Association master agreements (ISDAs) or foreign exchange letter agreements (FX letters).
MNAs govern the ability to offset amounts the fund owes a counterparty against amounts the counterparty owes the fund (net settlement). Both ISDAs and FX letters generally allow termination of transactions and net settlement upon the occurrence of contractually specified events, such as failure to pay or bankruptcy. In addition, ISDAs specify other events, the occurrence of which would allow one of the parties to terminate. For example, a downgrade in credit rating of a counterparty below a specified rating would allow the fund to terminate, while a decline in the fund’s net assets of more than a specified percentage would allow the counterparty to terminate. Upon termination, all transactions with that counterparty would be liquidated and a net termination amount determined. ISDAs include collateral agreements whereas FX letters do not. Collateral requirements are determined daily based on the net aggregate
srgve_0421_P4Proof #
36
T. ROWE PRICE GlObal ValuE EquITy FundT. ROWE PRICE GLOBAL VALUE EQUITY FUND
24
unrealized gain or loss on all bilateral derivatives with each counterparty, subject to minimum transfer amounts that typically range from $100,000 to $250,000. Any additional collateral required due to changes in security values is typically transferred the next business day.
Forward Currency Exchange Contracts The fund is subject to foreign currency exchange rate risk in the normal course of pursuing its investment objectives. It uses forward currency exchange contracts (forwards) primarily to protect its non-U.S. dollar-denominated securities from adverse currency movements. A forward involves an obligation to purchase or sell a fixed amount of a specific currency on a future date at a price set at the time of the contract. Although certain forwards may be settled by exchanging only the net gain or loss on the contract, most forwards are settled with the exchange of the underlying currencies in accordance with the specified terms. Forwards are valued at the unrealized gain or loss on the contract, which reflects the net amount the fund either is entitled to receive or obligated to deliver, as measured by the difference between the forward exchange rates at the date of entry into the contract and the forward rates at the reporting date. Appreciated forwards are reflected as assets and depreciated forwards are reflected as liabilities on the accompanying Statement of Assets and Liabilities. Risks related to the use of forwards include the possible failure of counterparties to meet the terms of the agreements; that anticipated currency movements will not occur, thereby reducing the fund’s total return; and the potential for losses in excess of the fund’s initial investment. During the six months ended April 30, 2021, the volume of the fund’s activity in forwards, based on underlying notional amounts, was generally less than 1% of net assets.
NOTE 4 - OTHER INVESTMENT TRANSACTIONS
Consistent with its investment objective, the fund engages in the following practices to manage exposure to certain risks and/or to enhance performance. The investment objective, policies, program, and risk factors of the fund are described more fully in the fund’s prospectus and Statement of Additional Information.
Securities Lending The fund may lend its securities to approved borrowers to earn additional income. Its securities lending activities are administered by a lending agent in accordance with a securities lending agreement. Security loans generally do not have stated maturity dates, and the fund may recall a security at any time. The fund receives collateral in the form of cash or U.S. government securities. Collateral is maintained over the life of the loan in an amount not less than the value of loaned securities; any additional collateral required due to changes in security values is delivered to the fund the next business day. Cash collateral is invested in accordance with investment
srgve_0421_P4Proof #
37
T. ROWE PRICE GlObal ValuE EquITy FundT. ROWE PRICE GLOBAL VALUE EQUITY FUND
25
guidelines approved by fund management. Additionally, the lending agent indemnifies the fund against losses resulting from borrower default. Although risk is mitigated by the collateral and indemnification, the fund could experience a delay in recovering its securities and a possible loss of income or value if the borrower fails to return the securities, collateral investments decline in value, and the lending agent fails to perform. Securities lending revenue consists of earnings on invested collateral and borrowing fees, net of any rebates to the borrower, compensation to the lending agent, and other administrative costs. In accordance with GAAP, investments made with cash collateral are reflected in the accompanying financial statements, but collateral received in the form of securities is not. At April 30, 2021, the value of loaned securities was $85,000; the value of cash collateral and related investments was $101,000.
Other Purchases and sales of portfolio securities other than short-term securities aggregated $11,559,000 and $4,583,000, respectively, for the six months ended April 30, 2021.
NOTE 5 - FEDERAL INCOME TAXES
No provision for federal income taxes is required since the fund intends to continue to qualify as a regulated investment company under Subchapter M of the Internal Revenue Code and distribute to shareholders all of its taxable income and gains. Distributions determined in accordance with federal income tax regulations may differ in amount or character from net investment income and realized gains for financial reporting purposes. Financial reporting records are adjusted for permanent book/tax differences to reflect tax character but are not adjusted for temporary differences. The amount and character of tax-basis distributions and composition of net assets are finalized at fiscal year-end; accordingly, tax-basis balances have not been determined as of the date of this report.
The fund intends to retain realized gains to the extent of available capital loss carryforwards. Net realized capital losses may be carried forward indefinitely to offset future realized capital gains. As of October 31, 2020, the fund had $339,000 of available capital loss carryforwards.
At April 30, 2021, the cost of investments for federal income tax purposes was $17,777,000. Net unrealized gain aggregated $4,836,000 at period-end, of which $5,057,000 related to appreciated investments and $221,000 related to depreciated investments.
srgve_0421_P4Proof #
38
T. ROWE PRICE GlObal ValuE EquITy FundT. ROWE PRICE GLOBAL VALUE EQUITY FUND
26
NOTE 6 - FOREIGN TAXES
The fund is subject to foreign income taxes imposed by certain countries in which it invests. Additionally, capital gains realized upon disposition of securities issued in or by certain foreign countries are subject to capital gains tax imposed by those countries. All taxes are computed in accordance with the applicable foreign tax law, and, to the extent permitted, capital losses are used to offset capital gains. Taxes attributable to income are accrued by the fund as a reduction of income. Current and deferred tax expense attributable to capital gains is reflected as a component of realized or change in unrealized gain/loss on securities in the accompanying financial statements. To the extent that the fund has country specific capital loss carryforwards, such carryforwards are applied against net unrealized gains when determining the deferred tax liability. Any deferred tax liability incurred by the fund is included in either Other liabilities or Deferred tax liability on the accompanying Statement of Assets and Liabilities.
NOTE 7 - RELATED PARTY TRANSACTIONS
The fund is managed by T. Rowe Price Associates, Inc. (Price Associates), a wholly owned subsidiary of T. Rowe Price Group, Inc. (Price Group). Price Associates has entered into a sub-advisory agreement(s) with one or more of its wholly owned subsidiaries, to provide investment advisory services to the fund. The investment management agreement between the fund and Price Associates provides for an annual investment management fee that is the lesser of (1) 0.65% of the fund’s average daily net assets, and (2) a combined fee that consists of two components – an individual fund fee and a group fee. The individual fund fee is equal to 0.35% of the fund’s average daily net assets. The group fee rate is calculated based on the combined net assets of certain mutual funds sponsored by Price Associates (the group) applied to a graduated fee schedule, with rates ranging from 0.48% for the first $1 billion of assets to 0.260% for assets in excess of $845 billion. The fund’s group fee is determined by applying the group fee rate to the fund’s average daily net assets. The fee is computed daily and paid monthly. At April 30, 2021, the effective annual group fee rate was 0.28%.
The Investor Class is subject to a contractual expense limitation through the expense limitation date indicated in the table below. During the limitation period, Price Associates is required to waive its management fee or pay any expenses (excluding interest; expenses related to borrowings, taxes, and brokerage; and other non-recurring expenses permitted by the investment management agreement) that would otherwise cause the class’s ratio of annualized total expenses to average net assets (net expense ratio) to exceed its expense limitation. The class is required to repay Price Associates for expenses previously waived/paid to the extent the class’s net assets grow or expenses
srgve_0421_P4Proof #
39
T. ROWE PRICE GlObal ValuE EquITy FundT. ROWE PRICE GLOBAL VALUE EQUITY FUND
27
decline sufficiently to allow repayment without causing the class’s net expense ratio (after the repayment is taken into account) to exceed the lesser of: (1) the expense limitation in place at the time such amounts were waived; or (2) the class’s current expense limitation. However, no repayment will be made more than three years after the date of a payment or waiver.
The I Class is also subject to an operating expense limitation (I Class Limit) pursuant to which Price Associates is contractually required to pay all operating expenses of the I Class, excluding management fees; interest; expenses related to borrowings, taxes, and brokerage; and other non-recurring expenses permitted by the investment management agreement, to the extent such operating expenses, on an annualized basis, exceed the I Class Limit. This agreement will continue through the expense limitation date indicated in the table below, and may be renewed, revised, or revoked only with approval of the fund’s Board. The I Class is required to repay Price Associates for expenses previously paid to the extent the class’s net assets grow or expenses decline sufficiently to allow repayment without causing the class’s operating expenses (after the repayment is taken into account) to exceed the lesser of: (1) the I Class Limit in place at the time such amounts were paid; or (2) the current I Class Limit. However, no repayment will be made more than three years after the date of a payment or waiver.
Pursuant to these agreements, expenses were waived/paid by and/or repaid to Price Associates during the six months ended April 30, 2021 as indicated in the table below. Including these amounts, expenses previously waived/paid by Price Associates in the amount of $720,000 remain subject to repayment by the fund at April 30, 2021. Any repayment of expenses previously waived/paid by Price Associates during the period would be included in the net investment income and expense ratios presented on the accompanying Financial Highlights.
Investor Class I Class
Expense limitation/I Class Limit 0.89% 0.05%
Expense limitation date 02/28/22 02/28/22
(Waived)/repaid during the period ($000s) $(38) $(105)
In addition, the fund has entered into service agreements with Price Associates and a wholly owned subsidiary of Price Associates, each an affiliate of the fund (collectively, Price). Price Associates provides certain accounting and administrative services to the fund. T. Rowe Price Services, Inc. provides shareholder and administrative services in its capacity as the fund’s transfer and dividend-disbursing agent. For the six months ended April 30, 2021, expenses incurred pursuant to these service agreements were $34,000 for
srgve_0421_P4Proof #
40
T. ROWE PRICE GlObal ValuE EquITy FundT. ROWE PRICE GLOBAL VALUE EQUITY FUND
28
Price Associates and $3,000 for T. Rowe Price Services, Inc. All amounts due to and due from Price, exclusive of investment management fees payable, are presented net on the accompanying Statement of Assets and Liabilities.
The fund may invest its cash reserves in certain open-end management investment companies managed by Price Associates and considered affiliates of the fund: the T. Rowe Price Government Reserve Fund or the T. Rowe Price Treasury Reserve Fund, organized as money market funds, or the T. Rowe Price Short-Term Fund, a short-term bond fund (collectively, the Price Reserve Funds). The Price Reserve Funds are offered as short-term investment options to mutual funds, trusts, and other accounts managed by Price Associates or its affiliates and are not available for direct purchase by members of the public. Cash collateral from securities lending is invested in the T. Rowe Price Short-Term Fund. The Price Reserve Funds pay no investment management fees.
As of April 30, 2021, T. Rowe Price Group, Inc., or its wholly owned subsidiaries, owned 679,149 shares of the I Class, representing 78% of the I Class's net assets.
The fund may participate in securities purchase and sale transactions with other funds or accounts advised by Price Associates (cross trades), in accordance with procedures adopted by the fund’s Board and Securities and Exchange Commission rules, which require, among other things, that such purchase and sale cross trades be effected at the independent current market price of the security. During the six months ended April 30, 2021, the fund had no purchases or sales cross trades with other funds or accounts advised by Price Associates.
NOTE 8 - OTHER MATTERS
Unpredictable events such as environmental or natural disasters, war, terrorism, pandemics, outbreaks of infectious diseases, and similar public health threats may significantly affect the economy and the markets and issuers in which a fund invests. Certain events may cause instability across global markets, including reduced liquidity and disruptions in trading markets, while some events may affect certain geographic regions, countries, sectors, and industries more significantly than others, and exacerbate other pre-existing political, social, and economic risks. During 2020, a novel strain of coronavirus (COVID-19) resulted in disruptions to global business activity and caused significant volatility and declines in global financial markets.
These types of events, such as the global pandemic caused by COVID-19, may also cause widespread fear and uncertainty, and result in, among other things: enhanced health screenings, quarantines, cancellations, and travel restrictions, including border closings; disruptions to business operations and supply chains and customer activity;
srgve_0421_P4Proof #
41
T. ROWE PRICE GlObal ValuE EquITy FundT. ROWE PRICE GLOBAL VALUE EQUITY FUND
29
exchange trading suspensions and closures, and overall reduced liquidity of securities, derivatives, and commodities trading markets; reductions in consumer demand and economic output; and significant challenges in healthcare service preparation and delivery. The fund could be negatively impacted if the value of a portfolio holding were harmed by such political or economic conditions or events. In addition, the operations of the fund, its investment advisers, and the fund’s service providers may be significantly impacted, or even temporarily halted, as a result of any impairment to their information technology and other operation systems, extensive employee illnesses or unavailability, government quarantine measures, and restrictions on travel or meetings and other factors related to public emergencies.
Governmental and quasi-governmental authorities and regulators have in the past responded to major economic disruptions with a variety of significant fiscal and monetary policy changes, including but not limited to, direct capital infusions into companies, new monetary programs, and dramatically lower interest rates. An unexpected or quick reversal of these policies, or the ineffectiveness of these policies, could negatively impact overall investor sentiment and further increase volatility in securities markets.
srgve_0421_P4Proof #
42
T. ROWE PRICE GlObal ValuE EquITy Fund
INFORMATION ON PROXY VOTING POLICIES, PROCEDURES, AND RECORDS
A description of the policies and procedures used by T. Rowe Price funds to determine how to vote proxies relating to portfolio securities is available in each fund’s Statement of Additional Information. You may request this document by calling 1-800-225-5132 or by accessing the SEC’s website, sec.gov.
The description of our proxy voting policies and procedures is also available on our corporate website. To access it, please visit the following Web page:
Scroll down to the section near the bottom of the page that says, “Proxy Voting Policies.” Click on the Proxy Voting Policies link in the shaded box.
Each fund’s most recent annual proxy voting record is available on our website and through the SEC’s website. To access it through T. Rowe Price, visit the website location shown above, and scroll down to the section near the bottom of the page that says, “Proxy Voting Records.” Click on the Proxy Voting Records link in the shaded box.
HOW TO OBTAIN QUARTERLY PORTFOLIO HOLDINGS
The fund files a complete schedule of portfolio holdings with the Securities and Exchange Commission (SEC) for the first and third quarters of each fiscal year as an exhibit to its reports on Form N-PORT. The fund’s reports on Form N-PORT are available electronically on the SEC’s website (sec.gov). In addition, most T. Rowe Price funds disclose their first and third fiscal quarter-end holdings on troweprice.com.
srgve_0421_P4Proof #
43
T. ROWE PRICE GlObal ValuE EquITy Fund
APPROVAL OF INVESTMENT MANAGEMENT AGREEMENT AND SUBADVISORY AGREEMENT
Each year, the fund’s Board of Directors (Board) considers the continuation of the investment management agreement (Advisory Contract) between the fund and its investment advisor, T. Rowe Price Associates, Inc. (Advisor), as well as the continuation of the investment subadvisory agreement (Subadvisory Contract) that the Advisor has entered into with T. Rowe Price International Ltd (Subadvisor) on behalf of the fund. In that regard, at a meeting held on March 8–9, 2021 (Meeting), the Board, including all of the fund’s independent directors, approved the continuation of the fund’s Advisory Contract and Subadvisory Contract. At the Meeting, the Board considered the factors and reached the conclusions described below relating to the selection of the Advisor and Subadvisor and the approval of the Advisory Contract and Subadvisory Contract. The independent directors were assisted in their evaluation of the Advisory Contract and Subadvisory Contract by independent legal counsel from whom they received separate legal advice and with whom they met separately.
In providing information to the Board, the Advisor was guided by a detailed set of requests for information submitted by independent legal counsel on behalf of the independent directors. In considering and approving the Advisory Contract and Subadvisory Contract, the Board considered the information it believed was relevant, including, but not limited to, the information discussed below. The Board considered not only the specific information presented in connection with the Meeting but also the knowledge gained over time through interaction with the Advisor and Subadvisor about various topics. The Board meets regularly and, at each of its meetings, covers an extensive agenda of topics and materials and considers factors that are relevant to its annual consideration of the renewal of the T. Rowe Price funds’ advisory contracts, including performance and the services and support provided to the funds and their shareholders.
Services Provided by the Advisor and SubadvisorThe Board considered the nature, quality, and extent of the services provided to the fund by the Advisor and Subadvisor. These services included, but were not limited to, directing the fund’s investments in accordance with its investment program and the overall management of the fund’s portfolio, as well as a variety of related activities such as financial, investment operations, and administrative services; compliance; maintaining the fund’s records and registrations; and shareholder communications. The Board also reviewed the background and experience of the Advisor’s and Subadvisor’s senior management teams and investment personnel involved in the management of the fund, as well as the Advisor’s compliance record. The Board concluded that it was satisfied with the nature, quality, and extent of the services provided by the Advisor and Subadvisor.
srgve_0421_P4Proof #
44
T. ROWE PRICE GlObal ValuE EquITy Fund
Investment Performance of the Fund The Board took into account discussions with the Advisor and reports that it receives throughout the year relating to fund performance and compared these returns with the performance of a peer group of funds with similar investment programs and a wide variety of other previously agreed-upon comparable performance measures and market data.
On the basis of this evaluation and the Board’s ongoing review of investment results, and factoring in the relative market conditions during certain of the performance periods, the Board concluded that the fund’s performance was satisfactory.
Costs, Benefits, Profits, and Economies of ScaleThe Board reviewed detailed information regarding the revenues received by the Advisor under the Advisory Contract and other direct and indirect benefits that the Advisor (and its affiliates) may have realized from its relationship with the fund. In considering soft-dollar arrangements pursuant to which research may be received from broker-dealers that execute the fund’s portfolio transactions, the Board noted that the Advisor bears the cost of research services for all client accounts that it advises, including the T. Rowe Price funds. The Board received information on the estimated costs incurred and profits realized by the Advisor from managing the T. Rowe Price funds. While the Board did not review information regarding profits realized from managing the fund in particular because the fund had either not achieved sufficient portfolio asset size or not recognized sufficient revenues to produce meaningful profit margin percentages, the Board concluded that the Advisor’s profits were reasonable in light of the services provided to the T. Rowe Price funds.
The Board also considered whether the fund benefits under the fee levels set forth in the Advisory Contract from any economies of scale realized by the Advisor. Under the Advisory Contract, the fund pays a fee to the Advisor for investment management services composed of two components—a group fee rate based on the combined average net assets of most of the T. Rowe Price funds (including the fund) that declines at certain asset levels and an individual fund fee rate based on the fund’s average daily net assets—and the fund pays its own expenses of operations (subject to contractual expense limitations agreed to by the Advisor with respect to the Investor Class and I Class). Under the Subadvisory Contract, the Advisor may pay the Subadvisor up to 60% of the advisory fee that the Advisor receives from the fund. The Board concluded that the advisory fee structure for the fund continued to provide for a reasonable sharing of benefits from any economies of scale with the fund’s investors.
APPROVAL OF INVESTMENT MANAGEMENT AGREEMENT AND SUBADVISORY AGREEMENT (CONTINUED)
srgve_0421_P4Proof #
45
T. ROWE PRICE GlObal ValuE EquITy Fund
Fees and ExpensesThe Board was provided with information regarding industry trends in management fees and expenses. Among other things, the Board reviewed data for peer groups that were compiled by Broadridge, which compared: (i) contractual management fees, total expenses, actual management fees, and nonmanagement expenses of the Investor Class of the fund with a group of competitor funds selected by Broadridge (Expense Group) and (ii) total expenses, actual management fees, and nonmanagement expenses of the Investor Class of the fund with a broader set of funds within the Lipper investment classification (Expense Universe). The Board considered the fund’s contractual management fee rate, actual management fee rate (which reflect the management fees actually received from the fund by the Advisor after any applicable waivers, reductions, or reimbursements), operating expenses, and total expenses (which reflects the net total expense ratio of the fund after any waivers, reductions, or reimbursements) in comparison with the information for the Broadridge peer groups. Broadridge generally constructed the peer groups by seeking the most comparable funds based on similar investment classifications and objectives, expense structure, asset size, and operating components and attributes and ranked funds into quintiles, with the first quintile representing the funds with the lowest relative expenses and the fifth quintile representing the funds with the highest relative expenses. The information provided to the Board indicated that the fund’s contractual management fee ranked in the first quintile (Expense Group), the fund’s actual management fee rate ranked in the first quintile (Expense Group and Expense Universe), and the fund’s total expenses ranked in the first and second quintiles (Expense Group) and first quintile (Expense Universe).
The Board also reviewed the fee schedules for other investment portfolios with similar mandates that are advised or subadvised by the Advisor and its affiliates, including separately managed accounts for institutional and individual investors; subadvised funds; and other sponsored investment portfolios, including collective investment trusts and pooled vehicles organized and offered to investors outside the United States. Management provided the Board with information about the Advisor’s responsibilities and services provided to subadvisory and other institutional account clients, including information about how the requirements and economics of the institutional business are fundamentally different from those of the proprietary mutual fund business. The Board considered information showing that the Advisor’s mutual fund business is generally more complex from a business and compliance perspective than its institutional account business and considered various relevant factors, such as the broader scope of operations and oversight, more extensive shareholder communication infrastructure, greater asset flows, heightened business risks, and differences in applicable laws and regulations associated with the Advisor’s proprietary mutual fund business. In assessing the reasonableness of the fund’s management fee rate, the Board considered the differences in the nature of the services required for the Advisor to manage its mutual fund business versus managing a discrete pool of assets as a subadvisor to another
APPROVAL OF INVESTMENT MANAGEMENT AGREEMENT AND SUBADVISORY AGREEMENT (CONTINUED)
srgve_0421_P4Proof #
46
T. ROWE PRICE GlObal ValuE EquITy Fund
institution’s mutual fund or for an institutional account and that the Advisor generally performs significant additional services and assumes greater risk in managing the fund and other T. Rowe Price funds than it does for institutional account clients, including subadvised funds.
On the basis of the information provided and the factors considered, the Board concluded that the fees paid by the fund under the Advisory Contract are reasonable.
Approval of the Advisory Contract and Subadvisory ContractAs noted, the Board approved the continuation of the Advisory Contract and Subadvisory Contract. No single factor was considered in isolation or to be determinative to the decision. Rather, the Board concluded, in light of a weighting and balancing of all factors considered, that it was in the best interests of the fund and its shareholders for the Board to approve the continuation of the Advisory Contract and Subadvisory Contract (including the fees to be charged for services thereunder).
APPROVAL OF INVESTMENT MANAGEMENT AGREEMENT AND SUBADVISORY AGREEMENT (CONTINUED)
srgve_0421_P4Proof #
This page intentionally left blank.
srgve_0421_P4Proof #
This page intentionally left blank.
srgve_0421_P4Proof #
This page intentionally left blank.
srgve_0421_P4Proof #
This page intentionally left blank.
srgve_0421_P4Proof #
This page intentionally left blank.
srgve_0421_P4Proof #
This page intentionally left blank.
srgve_0421_P4Proof #
This page intentionally left blank.
srgve_0421_P4Proof #
202106-1608414F1231-051 6/21
You have manyinvestment goals.
Explore products and services that can help you achieve them.Whether you want to put away more money for retirement, for a child’s education, or for other priorities, we have solutions for you. See how we can help you accomplish the investment goals that are important to you.
RETIREMENTn IRAs: Traditional, Roth,
Rollover/Transfer, or Brokerage
n Small Business Plans help minimize taxes, maximize savings
n T. Rowe Price® ActivePlus Portfolios1 for online investing powered by experts
GENERAL INVESTINGn Individual or Joint
Tenantn Brokerage2 offers
access to stocks, ETFs, bonds, and more
n Gifts and transfers to a child (UGMA/UTMAs)
n Trustn Transfer on Death
COLLEGE SAVINGSn T. Rowe Price-managed
529 plans offer tax-advantaged solutions for families saving money for college tuition and education-related expenses
Visit troweprice.com/broadrange
Call 1-800-225-5132 to request a prospectus or summary prospectus; each includes investment objectives, risks, fees, expenses, and other information that you should read and consider carefully before investing.
All mutual funds are subject to market risk, including possible loss of principal. Investing internationally involves special risks including economic and political uncertainty and currency fluctuation.
1 The T. Rowe Price® ActivePlus Portfolios is a discretionary investment management program provided by T. Rowe Price Advisory Services, Inc., a registered investment adviser under the Investment Advisers Act of 1940. Brokerage services are provided by T. Rowe Price Investment Services, Inc., member FINRA/SIPC. Brokerage accounts are carried by Pershing LLC, a BNY Mellon Company, member NYSE/FINRA/SIPC. T. Rowe Price Advisory Services, Inc., and T. Rowe Price Investment Services, Inc., are affiliated companies.
2 Brokerage services are provided by T. Rowe Price Investment Services, Inc., member FINRA/SIPC. Brokerage accounts are carried by Pershing LLC, a BNY Mellon Company, member NYSE/FINRA/SIPC.
T. Rowe Price Investment Services, Inc. | 100 East Pratt Street | Baltimore, MD 21202-1009