** Emeritus Scientist, Bedford Institute of Oceanography, PO Box 1006, Dartmouth,
Nova Scotia, Canada, B2Y 4A2
Abstract
Kuwait Bay, surrounded by arid lands, is shallow (<30m), eutrophic, well mixed and with a high degree of anthropogenic pollution but not well studied. In this unique environment distribution of surface phytoplankton biomass measured as chlorophyll-a concentration, and primary production were studied at six stations during March 1997 through April 1998 in relation to the environmental factors: temperature, salinity, pH, dissolved Oxygen, turbidity, NO3
-, NO2-, NH3, PO4
- and Si(OH)3-. Chlorophyll-a
concentration and primary production ranged from 0.12 to 23.66 µg l-1 and 31.67 to 653.31 µg C l-1 d-1, respectively. Phytoplankton biomass and primary production were significantly lower in the southern waters (1.5 µg l-1, 42.2 µg C l-1 d-1, respectively), which are further away from the river runoff than the northern waters off Kuwait (4.4 µg l-1, and 453.4 µg C l-1 d-1, respectively) based on the Wilcoxon-Rank test. Potential photosynthetic efficiency was high [15 - <25 µg C (µg chl-a) -1 h-1] at most stations with lower values [<10 µg C (µg chl-a) -1 h-1] observed in the highly stressed Kuwait Bay waters [0.4-8.0 µg C (µg chl-a) -1 h-1 at stations K6 and K10]. Southern waters also had low potential photosynthetic efficiency [0.4-10.2 µg C (µg chl-a) -1 h-1]. Levels of phytoplankton biomass, primary production and the potential photosynthetic efficiency are comparable to some of the coastal areas in the world. Temporal and spatial variations for the last two variables are reported here for the first time for the subtidal waters of Kuwait. Principal component analysis (PCA) revealed that underlying hydrodynamic regime might influence phytoplankton primary production in Kuwait’s waters. Key words: Kuwait Bay, Arid zone, primary production, assimilation number, phytoplankton biomass, Arabian Gulf.
68 F. Al-Yamani et al.
Introduction Kuwait is an arid zone maritime nation and has a unique subtropical environment. It has a coastline of 250 km. Kuwait’s deepest waters are 30 m. With tidal amplitude of ±4m the waters are well mixed. The only northern source of freshwater inflow into the Gulf is from the Shatt Al-Arab estuary. The rivers Tigris and Euphrates discharge annually each 45.3 x 10⁶ m3 water, and carry 57.6 x 10⁶ and 4.8 x 10⁶ t sediment, respectively [1]. Nearly 90% of Kuwait's 2.1 x 10⁶ population, projected to increase to 3.8 x 10⁶ by the year 2015, lives within 10-15 km of the coast. Similar to several other regions in the Arabian Gulf, coastal waters off Kuwait are severely stressed due to urbanization, dumping of sewage and wastes from slaughter houses, oil based activities such as petrochemical industries, expansion of harbor and port facilities, shipping, industrialization, channel dredging, power plants, desalination plants, mariculture operations, and increase in marine-based recreation. However, like other areas in the Gulf reviewed earlier [2], studies on the functioning of the pelagic ecosystem, and on primary production, are not systematic in Kuwait’s waters. In discrete samples algal biomass ranged between 0.01 and 12.8 µg chl-a l-1 and in the column from 3.8 to 113.4 mg chl-a m-2 [3]. The haptophyte Phaeocystis sp. [4 and 5] and the photosynthetic ciliate Myrionecta rubra (formerly Mesodinium rubrum) [5] bloomed in Kuwait Bay. Observations on the size-fractionated phytoplankton biomass and primary production during a red tide [6] yielded some of the highest levels of biomass and primary production (55.4 to 262.7 µg chl-a l-1 and 507.9 to 571.2 µg C l-1 d-1). Except for a few descriptive studies 7: [7and 6], our knowledge of the relationship among phytoplankton biomass, primary production and environmental factors in Kuwait’s waters was not well described and established. In this paper, we report annual variations in phytoplankton biomass and primary production in surface waters at six stations covering Kuwait Bay, i.e., Stations K10 and K6; northwest of Failaka Island at Station B; Khor Al-Sabbiya Station A; and farther out off Kuwait Bay Stations 6 and 3 (Fig 1). The results are compared with other regions around the Gulf. The role of controlling variables, including temperature, salinity, turbidity, dissolved oxygen and nutrients, are reported by examining their relationship to phytoplankton biomass (chlorophyll-a) and primary production in Kuwait’s waters. Materials and Methods Sampling conducted on biweekly or monthly basis (weather permitting) was done at six stations, A, B, 3, 6, K10 and K6 (Fig. 1), during 31 March 1997 through to 26 April 1998. Southern stations 12, 18, 23 were also sampled but less frequently. Vertical profiles of temperature, salinity, dissolved oxygen, pH, turbidity and algal fluorescence were obtained with a Sea Bird electronic 25 profiler, which revealed uniform distribution of these properties at most of the stations on any day. On a total of 72 occasions samples were obtained with a Niskin sampler from 1 m depth and were screened through 110 µm Nitex to eliminate microzooplankton. Four aliquots of 100 ml each were drawn into three clear and one dark Pyrex bottles for nutrient analysis. Samples were transported to the laboratory in a cool chest in about three hours and processed for nutrients, including nitrate, nitrite, ammonium, phosphate, and silicate concentrations following the procedures detailed in ROPME Manual [8], for chlorophyll-a (Chl-a) concentration following the procedure in Parsons et al. [9], and for primary production following Strickland and Parsons [10]. Nutrients (ammonium, nitrites, nitrates, phosphates and silicates) were analyzed using the automated Auto-analyzer- Skalar SANplus Segmented Flow Analyzer Model. Certified materials were included during each run of the samples. Limit of detection was between 0 and 0.3 µg-at l-1 (µM). The precision obtained for the different analyses at full scale was better than 0.1% for nitrite, 0.2% for nitrate, 1.1% for phosphate and 0.2% for silicate. In the laboratory, water samples were also measured for turbidity [3] and alkalinity [10].
Primary Production off Kuwait, an Arid Zone Environment 69
Figure 1: Location of sampling stations in Kuwait’s waters To each bottle a known activity of ~5 micro curies of 5 micro liters NaHC14O3 was added, stoppered, and mixed. Aliquots (100 µl) of the labeled sample were added to 5 ml of liquid gold scintillation fluid and used for added activity determinations. Samples were incubated in a Plexiglas incubator for 24 hours under natural light and temperature. Temperature in the incubator was maintained the same as at sea surface by circulating surface bay water. Following incubation, samples were filtered through GF/F filters 0.8 µm nominal pore size, fumigated for 30 minutes over concentrated hydrochloric acid to drive out adsorbed 14CO2. Filters were transferred to vials each containing 5ml of liquid gold scintillation fluid and the activities were determined using a Wallace 1400 TM scintillation counter. Dark count was <10% of the light bottle and therefore no corrections were made. Total carbon dioxide in seawater was determined based on temperature, salinity, pH and alkalinity [10]. Phytoplankton biomass expressed as chlorophyll-a was determined on duplicate samples using fluorometric method [10] utilizing a Turner Design Fluorometer Model 10-AU. Extraction of pigments was in 15 ml 90% acetone +5ml DMSU, in dark at 0ºC for 24h. Daylight period in Kuwait ranges between 10.2-13.6 hours [11]. Assuming a 12 h daily sunshine,
70 F. Al-Yamani et al.
daily production values were divided by 12 to calculate production per hour. Specific production rate (assimilation number) was obtained by dividing production per hour by phytoplankton biomass (chlorophyll-a). Data Analysis Data (72 samples) for the measured variables of chlorophyll-a and primary productivity as well as assimilation number were plotted for each of the six routinely sampled stations (A, B, 3, 6, K6 and K10). Additional stations sampled in the southern waters of Kuwait, i.e., stations 12, 18 and 23 were included in the statistical analysis to compare and describe the difference between the phytoplankton biomass and primary production in northern waters (stations A, B, 3,6 , K6, and K10, and values in southern waters (stations 12, 18 and 23) using Wilcoxon-Rank test. Only complete data sets (39 samples) with available measurements of all 10 physicochemical variables [i.e., seawater temperature, salinity, turbidity, pH, dissolved oxygen, and nutrient concentrations of NO3
-, NO2-, NH3, PO4
-, Si(OH)3], as well as available measurements of chlorophyll-a, and primary productivity were selected for correlation analysis. In an attempt to identify the important factors explaining the phytoplankton biomass and the primary production in the whole study area, we computed non-parametric correlations (Spearman correlation coefficient: strength of the correlation R and significance p < 0.05) between environmental parameters (i.e., physicochemical variables), and phytoplankton biomass and primary production for the period March, May, June, July, September, October, November, December 1997 and January, March and April 1998. Of all environmental parameters, only those that displayed a significant correlation with phytoplankton biomass (chlorophyll-a) and/or the primary production were selected for a further discussion. Multivariate ordination techniques (as implemented by the program CANOCO Version 4.5 [12] were used to explore the spatial-temporal variation of the 39 samples taken at 9 stations around Kuwait’s waters covering northern part of Khor Al-Sabbiya, Kuwait Bay and southern open sea of Kuwait’s waters. The length of the arrow in the biplot graph indicates the importance of each variable (i.e., seawater temperature, salinity, turbidity, pH, dissolved oxygen, and nutrient concentrations of NO3
-, NO2-, NH3, PO4
-, Si(OH)3, chlorophyll and primary production), while the angle between the arrows shows the relationship between these variables. After a preliminary Detrended Correspondence Analysis (DCA) (with detrending by segments) the gradient length in standard deviation (SD) units does not exceed 2SD, a predominance of linear curves could be expected. Therefore, an indirect unconstrained linear ordination method [13 and 14], Principal Component Analysis (PCA) was chosen to determine the relationship between the above measured environmental factors, as well as chlorophyll and primary production. This matrix contained all measured variables as reported in Table 1. Ordination techniques use abundance or presence-absence data of species, and often environmental data, various aspects of community structure, such as ecological gradients and relationships between species and their environment. Principal components analysis was used to select those informative variables, in order to reveal ecological gradients, and relationships between those variables that express a large amount of variation with the phytoplankton biomass and primary production. We focused on the output of the PCA analysis as follow: 1) the eigenvalue for each axis, which is a measure of the importance along the fourth principal components, 2) total inertia which measure the total variance in the variables data and 3) the length –shown in the biplot of the PCA of which the arrow reflects the rate of the change.
Primary Production off Kuwait, an Arid Zone Environment 71
Table 1. Monthly values for all physicochemical and biological variables measured at the sampled stations. Abb. refers to abbreviations for station and date, Temp= temperature (°C), Sal= salinity (psu), DO= dissolved Oxygen (ml/l), Tur= turbidity (NTU), NH3= ammonia (µg-at l-1), NO2= nitrite (µg-at l-1), NO3= nitrate (µg-at l-1), PO4= phosphate (µg-at l-1), SiO3= silicate (µg-at l-1), PP= primary production (µg C l-1 d-1) and Chla = Chlorophyll-a or phytoplankton biomass (µg l-1).
Samples: Station/date Abb. Temp Sal pH DO Tur NH3 NO2 NO3 PO4 SiO3 PP Chla
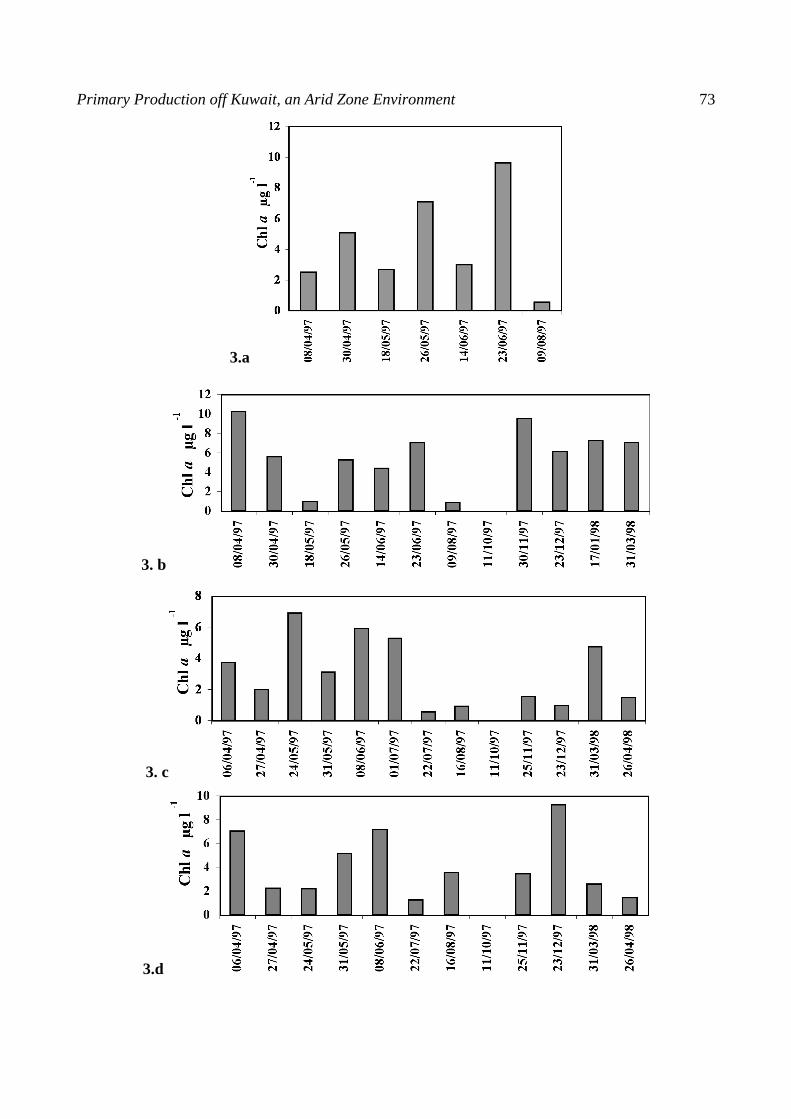
Results Mean annual seawater temperature for Kuwait’s waters is 23.9 °C with minimum temperatures in January and February and maximum in July and August (seasonal range of 18 °C). Salinity (mean of 35.3 psu; seasonal range difference of 22.3 psu) fluctuates in Kuwait’s waters depending on the volume of inflow of nutrient-rich freshwater from the Shatt Al-Arab’s River and rainfall during the winter season. Turbidity (mean of 43.3 NTU; range of 481.6 NTU) is higher in the northern waters affected by river runoff and is much lower (mean of 6 NTU; range of 7.3 NTU) in the open waters and in Kuwait Bay. Nutrients such as nitrates (mean of 1.2 µg-at l-1, range of 14.1 µg-at l-1), phosphates (mean of 0.4 µg-at l-1, range of 5.2 µg-at l-1) and silicates (mean of 9.3 µg-at l-1; range of 51.3 µg-at l-1) are higher in the northern and Kuwait Bay waters and less in the southern offshore waters (farthest from river input). The mean and range for the rest of the variables are respectively as follows: pH (8.5; 0.6), dissolved oxygen (3.8 ml/l; 2.8 ml/l), ammonia (1.2 µg-at l-1,11.4 µg-at l-1), nitrites (0.1 µg-at l-1;0.5 µg-at l-1), Chl-a (4.3 µg l-1; 23.4 µg l-1), and primary productivity (233.8 (µg C l-1 d-1; 641.8 (µg C l-1 d-1). Table 1 presents values of all measured environmental (physicochemical) and biological variables. Phytoplankton biomass The frequency distribution of chlorophyll-a (Fig. 2) is skewed with the mode around 5 µg l-1. Figs. 3a-f display the temporal variation of Chl-a at each sampled station. A wide range of phytoplankton biomass existed (0.12 to 23.66 µg l-1) with the highest at station 6 (Fig. 3e). Most of the values at all stations were <10 µg l-1 and very rarely exceeded 20 µg l-1 (Figs. 3a, b, c, d and f). During this study, chlorophyll-a distribution did not follow any seasonal pattern except for the maximum values, which sometimes occurred during March-July period (peak river discharge). At stations B, 3, and K6 chlorophyll- a registered a second high, sometimes during November to January. At the southern stations 12, 18 and 23, phytoplankton biomass (range of means 1.19-1.73 µg l-1, with minimum of 0.05 and maximum of 5.84 µg l-1), was significantly lower (Wilcoxon-Rank test, p = 0.01, Table 2) than at the northern stations i.e., K10, K6, A, B, 6 and 3 (range of means 3.31-5.41 µg l-1, with minimum of 0.40 and maximum of 23.66 µg l-1). No significant correlation was found between all physicochemical variables and phytoplankton biomass (Spearman, p > 0.05).
0102030405060
5 10 15 20 25
CHL a µg 1 -1
Figure 2. Frequency distribution of chlorophyll a.
Primary Production off Kuwait, an Arid Zone Environment 73
3.a
3. b
3. c
3.d
74 F. Al-Yamani et al.
3. e
3.f
Figure 3. Seasonal distribution of chlorophyll a at stations a. K10, b. K6, c. A, d. B, e. 6, and f.3. Table 2. Results of Wilcoxon-Rank test comparing phytoplankton biomass (Chlorophyll-a) and primary productivity data between northern stations (A, B, K6, K10, 3, 6) and southern stations (12, 18, 23) in Kuwait’s waters.
Variable ⇓/ Stations ⇒
Northern stations
K10, K6, 6, A, B, 3
(n= 39)
Southern stations
12, 18, 23 (n= 17)
P- value
Chlorophyll-a Higher Lower 0.01 Primary Production Higher Lower 0.02
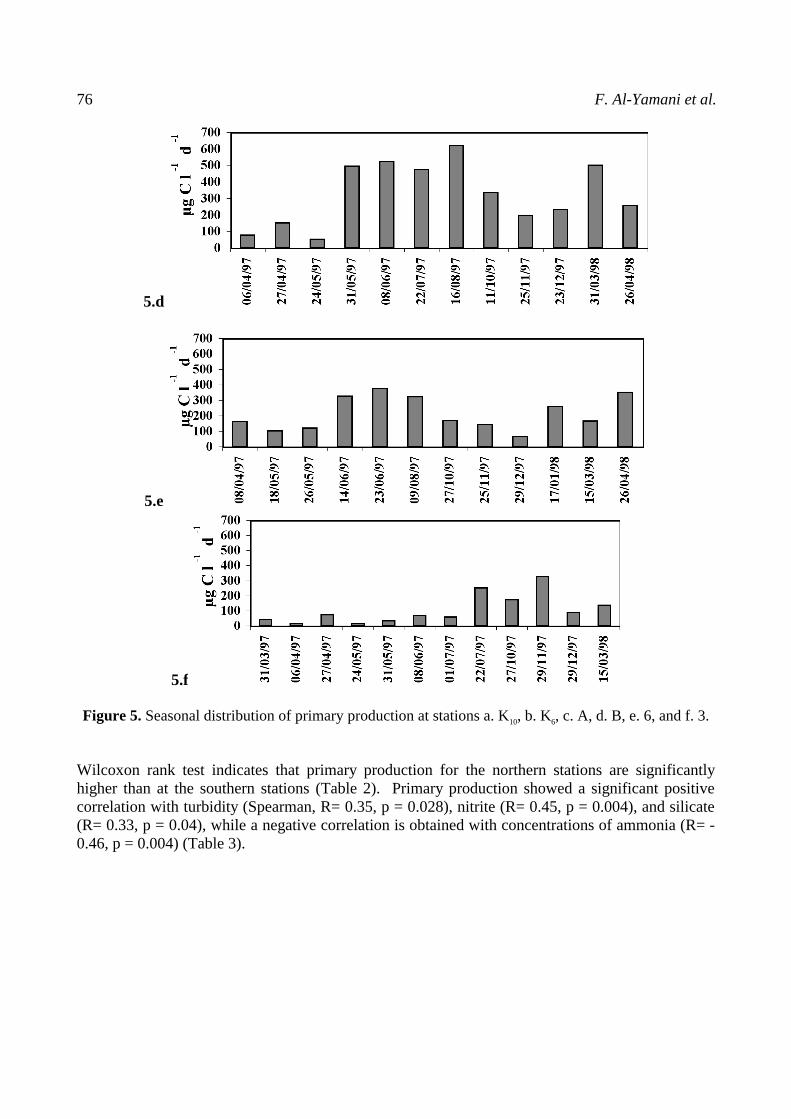
Primary production A frequency distribution of primary production showed a skewed distribution (Fig. 4) with the mode around 100 µg C l-1 d-1 (i.e., 8.33 µg C l-1 h-1; dividing µg C l-1 d-1 by 12 hrs). A wide range of primary production (31.67-653.31 µg C l-1 d-1) was observed (Figs. 5a-f). A gradation was observed with usually high values at Kuwait Bay stations (stations K10 and K6), as well as northern stations A, B (513- 653 µg C l-1 d-1); medium values (250- 397 µg C l-1 d-1) at stations farther out i.e., 3 and 6, and the lowest values (32.6 - 51.70 µg C l-1 d-1) at southern stations 12, 18 and 23. A well defined seasonal pattern in primary production was not observed in the data. However, an increase in primary production occurred during April-July at most stations (Fig. 5).
Primary Production off Kuwait, an Arid Zone Environment 75
Figure 4. Frequency distribution of primary production.
5. a
5.b
5.c
76 F. Al-Yamani et al.
5.d
5.e
5.f Figure 5. Seasonal distribution of primary production at stations a. K10, b. K6, c. A, d. B, e. 6, and f. 3.
Wilcoxon rank test indicates that primary production for the northern stations are significantly higher than at the southern stations (Table 2). Primary production showed a significant positive correlation with turbidity (Spearman, R= 0.35, p = 0.028), nitrite (R= 0.45, p = 0.004), and silicate (R= 0.33, p = 0.04), while a negative correlation is obtained with concentrations of ammonia (R= -0.46, p = 0.004) (Table 3).
Primary Production off Kuwait, an Arid Zone Environment 77
Table 3. Spearman correlation coefficients (R) and significance (p < 0.05) between physicochemical factors (TEMP= temperature, SAL= salinity, DO= dissolved Oxygen, TUR= turbidity, NH3= ammonia, NO2= nitrite, NO3= nitrate, SiO3= silicate, and PO4= phosphate; n refers to the number of samples), and primary production (PP). Phytoplankton biomass or Chlorophyll-a (CHL) displayed insignificant values (p > 0.05) with all measured variables. Only significant correlation results are included in the table below.
Variables n R p-level PP & TUR 39 .35 .027720 PP & NH3 38 -.46 .003572 PP & NO2 39 .45 .003357 PP & SiO3 39 .33 .036016 TUR & NO2 39 .47 .002483 TUR & NO3 39 .64 .000008 TUR & PO4 39 .47 .002285 TUR & SiO3 39 .34 .030425 TUR & SAL 39 -.59 .000063 NO2 & NO3 39 .51 .000780 NO3 & PO4 39 .42 .006730 NO2 & SIO3 39 .38 .015867 NO3 & PO4 39 .35 .028333 NO3 & SIO3 39 .53 .000456 SiO3 & TEMP 39 .56 .000177 SiO3 & DO 39 -.41 .007796
Principal Component Analysis The plot for sample score as a result of the PCA analysis on the 11 factors (9 physicochemical factors plus, phytoplankton biomass and primary production) is shown in Fig. (6). The projections onto the first two axes were found to account for 79.3% and 20.3% of the total variability of the eleven factors. Fig. (6) shows a spatial trend from the most upstream stations (station A for all sampled days and most of samples days for station B) to the stations of Kuwait Bay and to the more offshore stations. The trend seems to be more related to turbidity and nutrients concentrations as judged by their biplot arrows. The correlations between them are rather clear in the biplot by the angles formed between them and the output of the Spearman correlation analysis reported in the Table 3. Figure 6 showed three main groups described as followed:
1. The first group includes upstream station A for all sampled days and to a certain extent station B for most of sampled days, which appear to be related to higher turbidity (Table 1) and nutrient concentrations. These two stations were characterized by high primary production and phytoplankton biomass.
2. The second group includes sampled stations of Kuwait Bay (stations K6 and K10) and the stations off the open mouth of Bay (stations 6 and 3) for the period of late spring-early summer. They were characterized mainly by higher phytoplankton biomass, primary production and temperature.
3. The third group includes the offshore stations for the whole sampled period and stations from the Bay (K6, K10) and in the open waters off Kuwait Bay (stations 6 and 3) for the period of fall-early spring. They were characterized mainly by high salinity and pH values and lower turbidity and nutrient concentrations.
78 F. Al-Yamani et al.
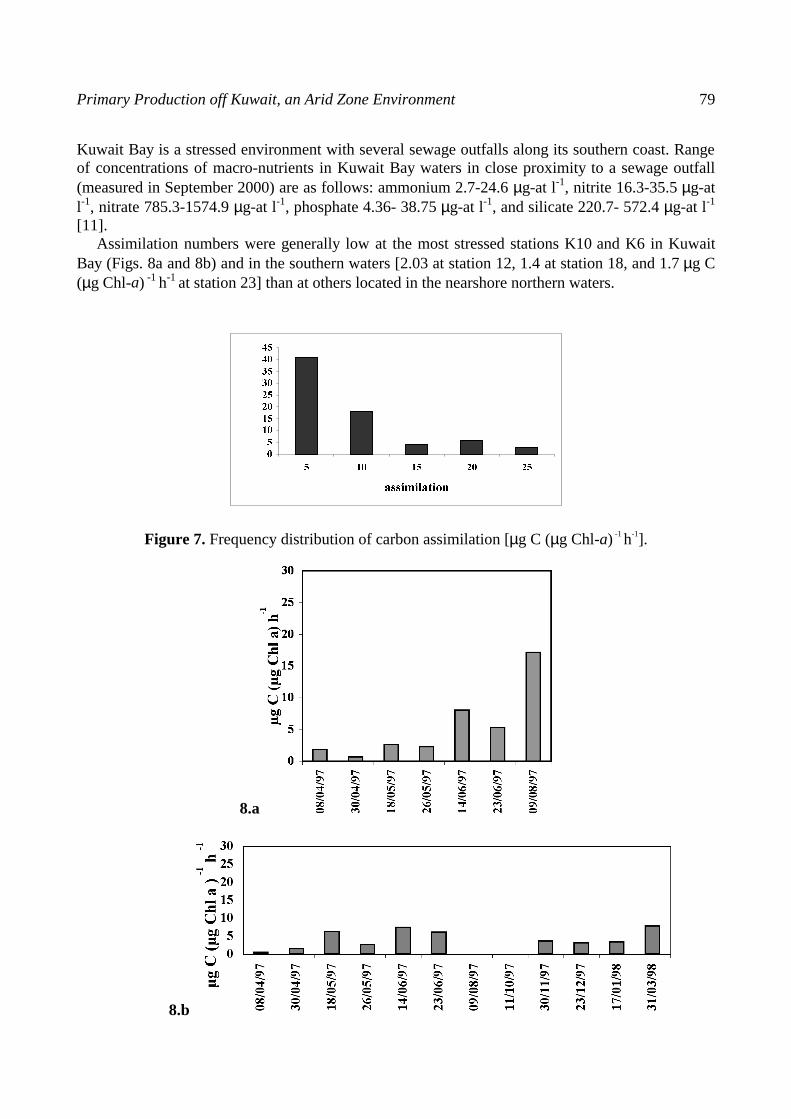
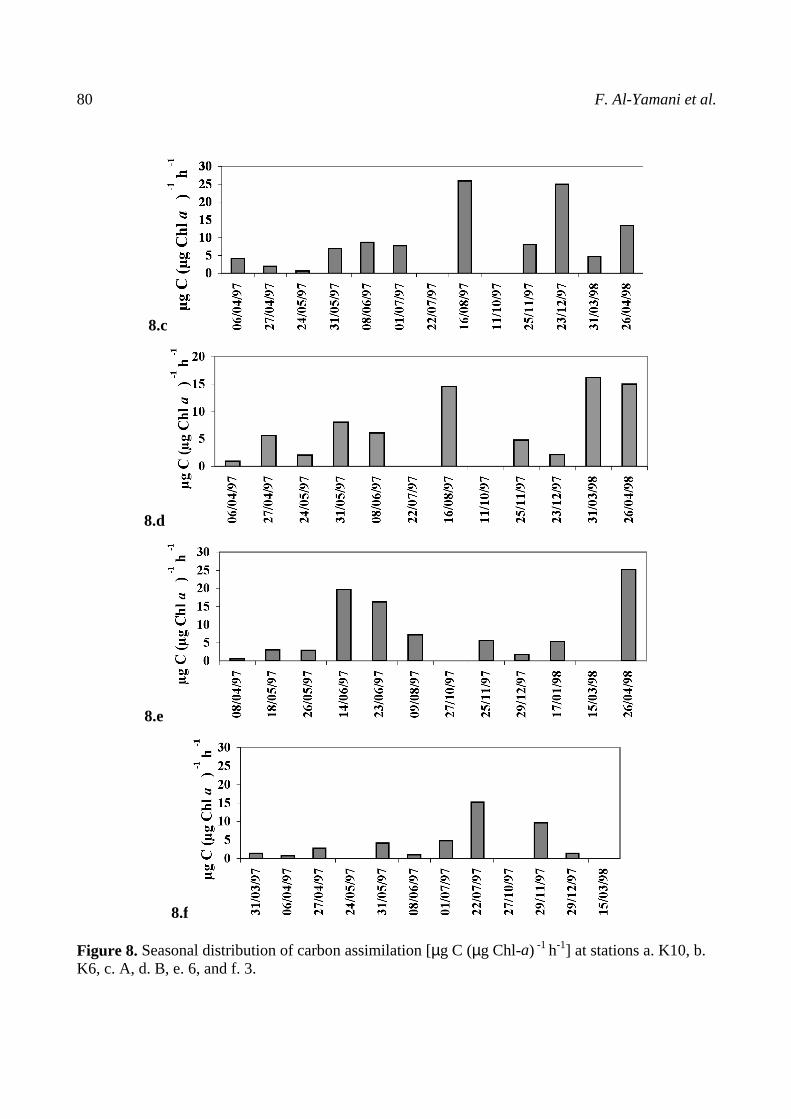
Assimilation numbers (Production/Biomass) Similar to phytoplankton biomass and primary production, a frequency distribution of assimilation number (Fig. 7) is skewed with the mode around 5 µg C (µg Chl-a) -1 h-1. Fig. 8 (a-f) displays the temporal distribution of the assimilation number at each of the six frequently sampled stations. The assimilation numbers ranged between 0.4 at station K6 (Fig. 8b) and 25.8 µg C (µg Chl-a) -1 h-1 at station A (Fig. 8c). There was no seasonal pattern in the assimilation numbers except a suggestion that they were high some time during June, July and August 97 at most stations and also during March and April 98 at stations B, 6 and K6 (Figs. 8b, d, and e). The variation of the assimilation numbers was generally wide in the northern stations, A, B, 3 and 6 [0.6-25.8 µg C (µg Chl-a) -1 h-1]. The range of assimilation number at Kuwait Bay’s stations K6 and K10 was 0.4- 8.0 µg C (µg Chl-a) -1 h-1. At the southern stations (12, 18, 23), the assimilation number varied between 1.40-2.03 µg C (µg Chl-a) -1 h-1.
Figure 6. Biplot based on Principal Component Analysis (PCA) of chlorophyll-a, primary production and 9 environmental parameters for 9 stations for the period March 1997 till April 1998 along Kuwait’s waters. Ordination diagram showing the spatial and temporal variation in the 39 samples. The arrows for the eleven measured variables and the regions where different categories of samples lie jointly display the approximate environmental characteristics in each of the clusters. The diagram accounts for 79% of the variance of the samples data. The first four eigen values are 0.79, 0.203, 0.003 and 0.001. Abreviations for sample codes (stations and dates) and environmental parameters are given in Table 1.
-1.0 1.0
-1.0
1.0
Tem
Sal
pH
DO
Tur
NH3
NO2
NO3PO4
SiO3
PP
Chla
K6 04
K6 05
K6 06
k6 07
k6 11
k6 12k6 198
k6 398
k10 04
k10 05
k10 06
k10 08
st6 04st6 05
st6 06
st6 08
st6 12
st6 398
st6 498
stA 04
stA 05
stA 06
stA 07
stA 12
stA 398
stA 498
stB 04
stB 05
stB 06stB 07
stB 12
stB 398
stB 498
st3 04st3 05
st3 06
st3 11
st3 12
st3 398
s12 597s18 597s23 597
s12 697
s18 697s23 697
s18 n97
s18 d97s18 398
Primary Production off Kuwait, an Arid Zone Environment 79
Kuwait Bay is a stressed environment with several sewage outfalls along its southern coast. Range of concentrations of macro-nutrients in Kuwait Bay waters in close proximity to a sewage outfall (measured in September 2000) are as follows: ammonium 2.7-24.6 µg-at l-1, nitrite 16.3-35.5 µg-at l-1, nitrate 785.3-1574.9 µg-at l-1, phosphate 4.36- 38.75 µg-at l-1, and silicate 220.7- 572.4 µg-at l-1 [11]. Assimilation numbers were generally low at the most stressed stations K10 and K6 in Kuwait Bay (Figs. 8a and 8b) and in the southern waters [2.03 at station 12, 1.4 at station 18, and 1.7 µg C (µg Chl-a) -1 h-1 at station 23] than at others located in the nearshore northern waters.
�
�
��
��
��
��
��
��
��
��
� �� �� �� ��
DVVLPLODWLRQ
Figure 7. Frequency distribution of carbon assimilation [µg C (µg Chl-a) -1 h-1].
8.a
8.b
80 F. Al-Yamani et al.
8.c
8.d
8.e
8.f Figure 8. Seasonal distribution of carbon assimilation [µg C (µg Chl-a) -1 h-1] at stations a. K10, b. K6, c. A, d. B, e. 6, and f. 3.
Primary Production off Kuwait, an Arid Zone Environment 81
Discussion Near-surface phytoplankton biomass in Kuwait’s waters was comparable to some of the coastal waters off the Barrier Island, the southwest coast of India, and Venezuela coastal waters (Table 4). In this shallow tidally well mixed, sub-tropical waters of Kuwait, with sufficient light reaching the bottom and with cultural eutrophication a potential for a build up of high level of biomass exists [3]. However, only on a few occasions there were red tide chlorophyll (chl-a µg l-1) levels. For example, measured chlorophyll-a value of 160 µg l-1 was recorded from a bloom of Myrionecta rubra (formerly Mesodinium rubrum) [5], chlorophyll-a value of 500.7 µg l-1 during May 1997 [6, 15], 265 µg l-1 during September 1999 and > 950 µg l-1 during May 2000 [Al-Yamani unpublished data]) which have lasted for two days. During these red-tides, macronutrients i.e., PO4, SiO2 and NO3 were not exhausted in the column, which is consistent with our 5-year study [3] or with the observations of Hirawake et al. [16] in the ROPME Sea area (the sea area surrounded by the eight Member States of ROPME: Bahrain, I.R. Iran, Iraq, Kuwait, Oman, Qatar, Saudi Arabia and the United Arab Emirates.). The spatial and temporal changes by both univariate and multivariate methods were analyzed. The multivariate method is useful and suggests how the primary production and phytoplankton biomass and phytoplankton biomass could be changing spatially and with time. PCA analysis and the output of the spearman correlation coefficient were used to identify those environmental factors, as well as phytoplankton biomass and primary production that contain the most information. The spatial variation in the environmental factors change is more prominent among turbidity and nutrient concentrations in one hand and salinity in the other hand. Spearman correlation analysis (Table 3) did not yield significant correlation between primary productivity and the two macronutrients nitrate and phosphate, while positive significant relationships were found with ammonia, nitrite and silicate. Moreover, phytoplankton biomass (Chl-a) did not show significant correlation with any of the measured environmental variables including the macronutrients. The results indicate that nutrients, especially nitrate and phosphate, were not limiting at any time in Kuwait’s waters. The northern waters of Kuwait receive nutrient rich waters from the Shatt Al-Arab River as well as the man-made Third River. In addition, Kuwait Bay receives partially treated sewage waters, which are rich in macronutrients, especially nitrates and phosphates [5]. Moreover, the significant positive correlations between the primary production and ammonia, nitrite and silicate may be also an indication of the importance of the effect of the outflow of the Shatt-Al-Arab from the north and be considered as the main nutrient-rich waters supplying the growth and standing stock of phytoplankton and primary production in the northern part of Arabian Gulf [1 and 7]. The offshore stations seem to be less influenced by the outflow of the Shatt-al-Arab fresh waters, which may explain the decrease of phytoplankton biomass and primary productivity in the open sea area of Kuwait’s waters, compared to Kuwait near-coast stations. Similarly in the arid zone Red Sea waters off Jiddah, Saudi Arabia cultural eutrophication was the main nutrient source that sustained a high level of primary production despite the lack of additions due to river run or rain fall [17]. Light energy is an important factor regulating the phytoplankton biomass and algal growth in Kuwait’s coastal waters [3]. Kuwait’s coastal area is characterized by well-mixed sub-tropical shallow waters, which are nutrient rich, and is characterized by the availability of sufficient light for algal growth [3]. The only locality of those sampled that had limited light due to high turbidity values (suspended sediments) is in Khor Al-Sabbiya (station A).
82 F. Al-Yamani et al.
Table 4. Comparison of biomass (µg l-1), primary production (µg C l-1 d-1) and assimilation number [µg C (µg Chl-a) -1 h-1] in selected coastal waters.
Region Chl a (B) Production P:B Reference
Kuwait Waters 0.12-23.66 11.4-610 0.4 – Present
Kuwait Redtide 55.4-262.7 507.9-571.2 2.2-9.2 [6]
Arabian Gulf, ROPME Area 0.44-2.84 2.6-8.5 [16]
Basrah, Shatt Al-Arab 0.52-3.25 6.03-37.02 - [18]
N.W. Arabian Gulf 0.72-9.07 10.7-31.6 1.5-8.2 [19]
Red Sea ~0.2- 1.2 <9.4 1.2-14.6 [17]
Central Red Sea off Jedda 0.02-6.4 0.03- 12 0.87- [20]
Bay of Bengal –Red tide 10.95- 53.7-160.9 4.57- [21]
Gulf of Tehuantepec, Mexico 0.04-11.1 0.21-40.4 1.6-10.8 [32]
Gulf of Thailand 0.12- 1.57 0.54-5.44 0.6-5.6 [33]
Southwest coast of India 0.07-22.51 2.01- 14.23 2.7-4.6 [34]
The lower biomass, production levels, and carbon assimilation ratios obtained during this study as well as lower nutrient concentrations reported by Al-Yamani et al. [5 and 7] in the southern stations i.e., 12, 18 and 23 compared to values in northern nearshore waters referred to earlier warrant further studies and experimental confirmation. Our findings in general are consistent with those reported earlier on a 5-year study [3]. Lack of any pronounced seasonal blooms may be due to lack of stratification and turnover associated with seasons, loss due to lateral advection or grazing by zooplankton including microzooplankton or by the bottom fauna. It is also possible that bacterial activity and the microbial loop may have utilized a substantial proportion of net autotrophic production. In the shallow tropical reservoirs off Ivory Coast, West Africa [35] average bacterial carbon demand was 97% of the net production rendering unproductive net heterotrophic systems [36]. This remains to be established in our waters. Integrated column production in the Gulf ranged between 0.12 and 1.27 gC m-2 d-1 with a mean of 0.51 gC m-2 d-1 [16], comparable with the values reported by Koblenz-Mishke [37] for the Gulf or those from the Gulf of Elat, another desert-enclosed sea [38]. Given an area of 0.226 x 10⁶ km2, utilizing 0.51 gC m-2 d-1 average production the calculated annual production for the Arabian Gulf is 42.07 x 10⁶ tC. If 3 trophic levels are used with 10% efficiency the annual harvestable bound
Primary Production off Kuwait, an Arid Zone Environment 83
carbon would be 0.042 x10⁶ tC, which needs to be revised if precise estimates of macroalgal production, trophodynamics and energy transfer are known. Investigations on the role of heterotrophic activity by bacteria, and grazing by zooplankton, would elucidate mechanisms of transfer of primary production to higher trophic levels or to the benthic system in different locations of Kuwait’s coastal waters. Nutrient and food chain dynamics (including the microbial loop) in Kuwait’s waters need to be understood in order to interpret changes in carbon assimilation number and to predict carbon fluxes to the benthic system.
References [1] Reynolds, M. 1993, “Physical oceanography of the Gulf, Strait of Hormuz, and the Gulf of
Oman: Results from the Mt. Mitchell expedition”, Mar. Pollut. Bull., 27, pp. 35-59. [2] Subba Rao, D.V., and Al-Yamani, F., 1998, “Phytoplankton ecology in the waters between
Shatt al-Arab and Hormuz Strait-Arabian Gulf”, Plank. Biol. Ecol., 45, pp. 101-116. [3] Subba Rao, D.V., and Al-Yamani, F., 1999, “Analysis of the relationship between
phytoplankton biomass and the euphotic layer off Kuwait”, Arabian Gulf. Ind. J. Mar. Sci., 28, pp. 416-423.
[4] Al-Hasan, R.H., Ali, A.M. Radwan, S.S., 1990, “Lipids, and their constituent fatty acids, of Phaeocystis sp. from the Arabian Gulf”, Mar. Biol., 105, pp. 9-14.
[5] Al-Yamani, F.Y., Bishop, J. Al-Rifaie, K. Ismail, W. Al-Yaqout, A., Al-Omran, L., Kwarteng, A., Al-Ghadban, A., Sheppard, C., 1997a,” Assessment of the effects of the Shatt al-Arab's Altered Discharge Regimes on the Ecology of the Northern Arabian Gulf”, Final Report. Kuwait Institute for Scientific Research, Report No. KISR 5174, Kuwait.
[6] Subba Rao, D.V., Al-Yamani, F., Lennox, A., Pan,Y., Al-Said, T., 1999, “Biomass and production characteristics of the first red-tide noticed in Kuwait Bay, Arabian Gulf”, J. Plank. Res., 22, pp. 805-810.
[7] Al-Yamani, F.; Durvasula, R., Ismail, W., Al-Rifaie, K., Al-Saeed, T., Al-Yaqout, A., Al-Omran. L., 1997b,” Dynamic oceanography of the northwestern waters of the Arabian Gulf: Ecological significance of the marine food web. Kuwait Institute for Scientific Research”, Report No. KISR 5173, Kuwait.
[8] ROPME 1989, “Manual of Oceanographic Observations and Pollutant Analysis methods”, Revised edition. Regional Organization for the Protection of the Marine Environment, Kuwait.
[9] Parsons, T.R., Y. Maita, and C.M. Lalli. 1984,” A manual of chemical and biological methods for seawater analysis”, Perg. Press, New York. 173 pp.
[10] Strickland, J.D.H., Parsons, T.R., 1972,” A practical handbook of seawater analysis”, 2nd edition, Bull. Fish. Res. Bd. Canada, 167, 311 pp.
[11] Al-Yamani, F.Y., J. M. Bishop, E. Ramadhan, M. Al-Husaini, and A. Al-Ghadban. 2004," Oceanographic Atlas of Kuwait’s Waters", 202 pp. Kuwait Institute for Scientific Research, Kuwait.
[12] Ter Braak, C.J.F. 1987-1992,” CANOCO- A FORTRAN Program for Canonical Community Ordination”, Cornell University, Ithaca, New York.
[13] Jongman, R.H.G., C.J.F. Ter Braak, and O.F.R. van Togeren 1987,” Data analysis in community and landscape ecology”, Pudoc, Wageningen, 299 pp.
[14] Ter Braak, C.J.F.; and J. Wiertz. 1994,” On the statistical analysis of vegetation change: a wetland affected by water extraction and soil acidification”, J. Vegetat. Sci., 5, pp. 361-372.
84 F. Al-Yamani et al.
[15] Subba Rao, D.V., Al-Hassan, J.M., Al-Yamani, F., Al-Rafaie, K., Ismail, W., Nageswara Rao, C.V., and Al-Hassan, A. 2003,” Elusive red tides in Kuwait coastal waters”, Harmful Algae News, 24:10-13, The IOC of UNESCO.
[16] Hirawake, T., Tobita, K., Ishimaru, T., Satoh,H., Morinaga, T., 1998,” Primary production in the ROPME Area. In: A. Otsuki et al. (Eds.) Offshore Environment of the ROPME Sea Area after the War-Related Oil Spills”, Terra Scientific Publishing Co. (TERRAPUB), Tokyo, pp. 181-191.
[17] Shaikh, E.A., Roff, J.C., Dowidar, N.M., 1986,” Phytopalnkton ecology and production in the Red Sea off Jiddah, Saudi Arabia”, Mar. Biol., 92, pp. 405-416.
[18] Huq, M.F., Al-Saadi, A., Hameed, H.A., 1981,” Studies on the primary production of the river Shatt Al-Arab at Basrah, Iraq”, Hydrobiologia, 77, pp. 25-29.
[19] Huq, M.F., Al-Saadi, A., Hadi, R.A., 1978,” Preliminary studies on the phytoplankton of North-West Persian Gulf during post-monsoon period”, J. Oceanogr. Soc. Jpn., 34, pp. 78-80.
[20] Dowidar, N.M., 1983,” Phytoplankton biomass and primary productivity of the South-Eastern Mediterranean”, In: M.V. Angel (Ed.) Marine Sciences of the North-West Indian Ocean and adjacent waters, Perg. Press, Oxford, pp. 983-1000, U.K.
[21] Subba Rao, D.V., 1969,” Asterionella japonica bloom and discoloration off Waltair, Bay of Bengal”, Limnol. Oceanogr., 14, pp. 632-634.
[22] Moigis, A.G., 2000,” Photosynthetic rates in the surface waters of the Red Sea: the radiocarbon versus the non-isotopic dilution method”, J. Plank. Res., 22, pp. 713-727.
[23] Bhattathiri, P.M., Devassy, V.P., 1979,” Biological characteristics of the Laccadive Sea (Lakshadweep)”, Ind. J. Mar. Sci., 8, pp. 222-226.
[24] Nair, V.R., Mustafa, Mehta, S.P., Govindan, K., Jiyalal, Ram ,M., Gajbhiye, S.N., 1998,” Biological characteristics of the Vashishti estuary, Maharashtra (west coast of India)”, Ind. J. Mar. Sci., 27, pp. 310-316.
[25] Ignatiades, L., 1998,” The productive and optical status of the oligotrophic waters of the Southern Aegean Sea (Cretan Sea), Eastern Mediterranean”, J. Plank. Res., 20 (5), pp. 985-995.
[26] Dowider, N.M. 1976,” Phytoplankton of the Suez Canal”, Acta. Adriat., 18, pp. 241-256. [27] El-Sherif, Z. M. and Ibrahim, A.M. 1993,” Phytoplankton production, diversity and
chlorophyll-a in the Suez Canal, Egypt”, Bull. Nat. Inst. Oceanogr. and Fish., A.R.E, 19, pp. 191-212.
[28] Relevante, N., Gilmartin,M., 1978,” Characteristics of the microplankton and nanoplankton communities of an Australian coastal plain estuary”, Aust. J. Mar. Freshwat. Res., 29, pp. 9-18.
[29] Fernandez, P., Penoth, E., 1994,” Condiciones hidroquimicas de la Laguna de Raya, Isla Margarita, Venezuela, durante el periodo comprendido entre Febrero de 1986 y Febrero de 1987”, Bol. Inst. Oceanogr.Venez,. 33, pp. 5-17.
[30] Le-Borgne, R., 1997,” Plankton biomass and production in an open atoll lagoon: Uvea, New Caledonia”, J. Exp. Mar. Biol. Ecol., 212, pp. 187-210.
[31] Tada, K., Monaka, K. Morishita , M. Hashimoto, T., 1998,” Standing stocks and production rates of phytoplankton and abundance of bacteria in the Seto Inland Sea”, Japan. J. Oceanogr., 54, pp. 285-295.
[32] Robles-Jarero, E.G., Lara-Lara, J.R., 1993,” Phytoplankton biomasss and primary productivity by size classes in the Gulf of Tehuantepec”, Mexico. J. Plank. Res., 15, pp. 1341-1358.
[33] Subba Rao, D.V., 1965,” The measurement of total carbon dioxide in dilute tropical waters”, Aust. J. Mar. Freshw. Res., 16, pp. 273-280.
Primary Production off Kuwait, an Arid Zone Environment 85
[34] Radhakrishna, K., 1969,” Primary productivity studies in the shelf waters off Alleppey, south-west India during the post-monsoon, 1967”, Mar. Biol., 4, pp. 174-181.
[35] Bouvy, M., Arfi, R., Cecchi, P., Corbin, D., Pagano, M., Saint-Jean, L., Thomas, S., 1998,” Trophic coupling between bacterial and phytoplanktyonic compartments in shallow tropical reservoirs (Ivory Coast, West Africa)”, Aquat. Microb.Ecol., 15, pp. 25-37.
[36] del Giorgio, P.A., Cole, J.J., Climbleris, A., 1997,” Respiration rates in bacteria exceed phytoplankton production in unproductive aquatic systems”, Nature, 385, pp. 148-151.
[37] Koblenz-Mishke, O.J., Volkovinsky, V.V., Kabanova, J.G., 1970,” Plankton primary production of the world ocean”,. In: W.S. Wooster (Ed.). Scientific Exploration of the South Pacific. National Academy of Sciences, Washington. 1970, pp. 183-193. USA.
[38] Levanon-Spanier, I., Padan, E., Reiss, Z., 1979,” Primary production of a desert-enclosed sea – the Gulf of Elat (Aqaba), Red Sea”, Deep Sea Res., 26, pp. 673-685.