25
Primary school ( key stage 2 ) Performance tables 2015 Central Bedfordshire 823
Primary school(key stage 2)
Performance tables
2015
Central Bedfordshire
823

1
Introduction
The performance tables give information on the achievements of pupils in local primary schools, and how they compare with other schools in the local authority (LA) area and in England as a whole. This booklet presents a selection of key performance measures, but a wider range of information is available at www.education.gov.uk/schools/performance
2
GeneralThe national curriculum key stage 2 test results for state funded schools in England are provided in these tables along with teacher assessment data. For each LA, schools are listed alphabetically, with special schools shown in a separate section at the end of each list. Schools that do not take pupils up to the age of 11 (e.g. infant schools) are not included. Neither are independent schools as there is no requirement for them to enter their pupils for national curriculum tests.
If your child attends a school listed in the tables, you may be interested to see how its results compare with other schools in the area, and with LA and national averages. To get a more rounded picture, you can also obtain details of the most recent Ofsted judgements of the school.
You may want to discuss the results with teachers at your child’s school. How do they feel their school is performing, and what plans do they have to improve levels of achievement? How can you support the work of the school? What more can you do to help your own child do better?
Choosing a schoolIf using the performance tables to inform your choice of school, be aware that they give only part of the picture of each school and its pupils’ achievements. Schools change from year to year and their future results may difer from those achieved by current pupils.
You should also look at more than one performance measure to get an idea of how latest results for diferent schools compare. For example, while igures for the percentage of pupils achieving level 4+ in reading, writing and maths gives an indication of pupils’ achievements at the end of KS2, it doesn’t tell you how far they have progressed from their starting point.
Expected progress and value added measures give you information to consider alongside attainment data, and an explanation of both can be found in the user guidance section of the website at www.education.gov.uk/schools/performance
You should also consider the data in performance tables and this booklet alongside other important sources of information such as Ofsted reports, visits to the school itself and talking to teachers. Ofsted school inspection reports can be obtained from either the tables website, www.ofsted.gov.uk, or direct from the school on request.
Expected levels of primary school performance at the end of key stage 2 The government assesses mainstream state funded primary schools’ performance against ’loor standards’. Considered against these, a school would be seen as underperforming if:
■ fewer than 65% of pupils at the end of key stage 2 (KS2) achieved level 4 or above in all of reading, writing and maths
■ and below the average percentage of pupils at the end of KS2 made expected progress in reading (2015 national median=94%)
■ and below the average percentage of pupils at the end of KS2 made expected progress in writing (2015 national median =97%)
■ and below the average percentage of pupils at the end of KS2 made expected progress in maths (2015 national median=93%).
What a school’s attainment measures tell you National curriculum tests measure pupils’ attainment against speciied levels. They measure the extent to which pupils have the speciic knowledge, skills and understanding that the national curriculum expects them to have mastered in reading (test), writing (based on teacher assessment) and mathematics (test) by the end of key stage 2.
However, schools’ KS2 test results are largely afected by the prior attainment of their pupils (how well they did at KS1). Therefore, in comparing the efectiveness of two or more primary schools, it is best to also look at their KS1 average points score; the percentage of pupils making expected progress in reading, writing and in maths; and information on achievements and progress of pupils, who at the end of KS1 had been assessed as being either below, at or above level 2.
About the tables in this booklet

How to read the Tables
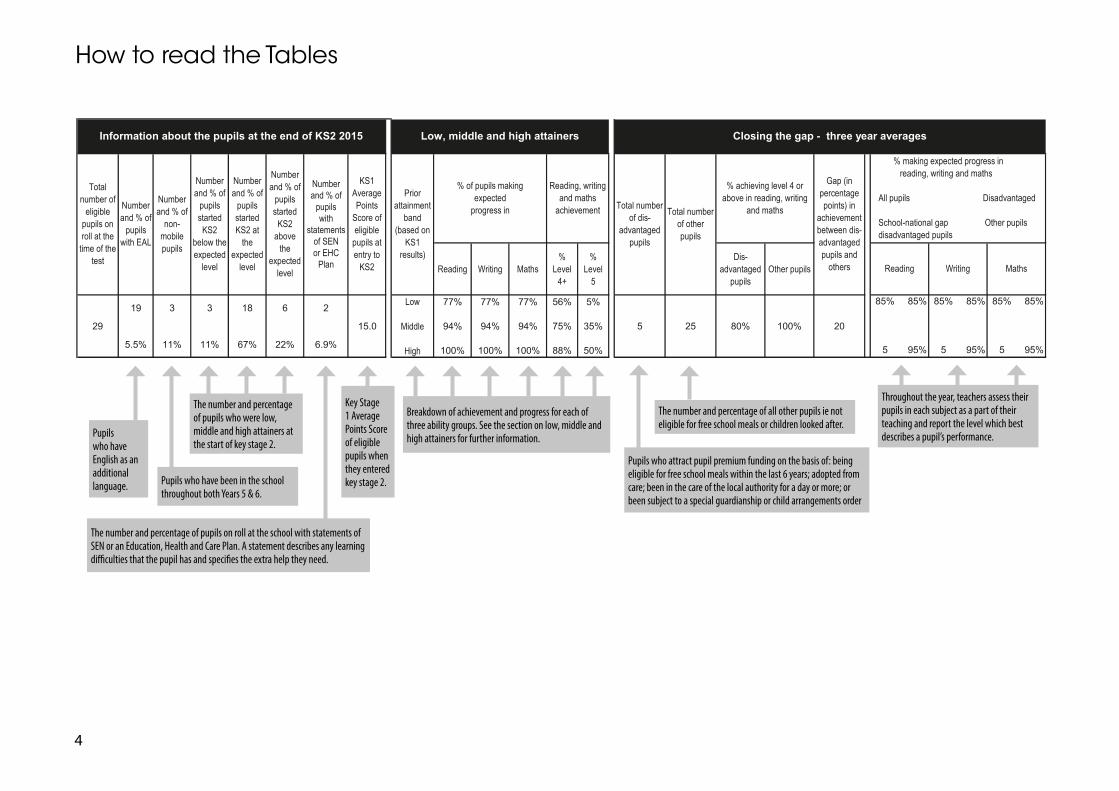
The percentage of pupils absent or unable to access the test.
The percentage of pupils achieving level 5 or above in each of reading and maths tests and in teacher’s assessment of writing.
The average point score is calculated by adding together reading and writing and dividing by two. Then, add the result to maths and then divide that by two.
The percentage of pupils achieving level 4 or above in each of reading and maths tests and in teacher’s assessment of writing.
The number of pupils on roll at the school.
3
number
of pupils
on roll
(all ages)
School name
(New school name if applicable)
Address
Postcode Tel num School Type Age Range
Denomination
233 93% 24%
7%
28%
93%
(0%)
7%
28%
93%
(0%)
7%
62%
93%
(0%)
7%
62%
93%
(0%)
29.1 89% 89% 93%
% making
expected
progress in
maths
% making
expected
progress in
writing
% making
expected
progress in
reading
Key Stage 2 2015
% achieving
Level 5+ in all
of reading,
writing and
maths
% achieving
Level 4+ in all
of reading,
writing and
maths
Reading Maths
Average
Point Score
(based on
reading,
writing and
maths)Grammar,
punctuation and
spelling
Key stage 2 test resultsKey stage 1 to key stage 2
progress measure
Writing teacher
assessment
% achieving Level 3 or below
% achieving Level 5
% achieving Level 4+
( % absent or disapplied )
SCHOOLS
The proportion of pupils who, between KS1 and the end of KS2, have made at least two levels of progress
4
How to read the Tables
Breakdown of achievement and progress for each of three ability groups. See the section on low, middle and high attainers for further information.
Pupils who have English as an additional language.
Pupils who have been in the school throughout both Years 5 & 6.
The number and percentage of pupils on roll at the school with statements of SEN or an Education, Health and Care Plan. A statement describes any learning diiculties that the pupil has and speciies the extra help they need.
Key Stage 1 Average Points Score of eligible pupils when they entered key stage 2.
The number and percentage of pupils who were low, middle and high attainers at the start of key stage 2.
Reading Writing Maths
%
Level
4+
%
Level
5
Dis-
advantaged
pupils
Other pupils
29
19
5.5%
3
11%
3
11%
18
67%
6
22%
2
6.9%
15.0
Low
Middle
High
77%
94%
100%
77%
94%
100%
77%
94%
100%
56%
75%
88%
5%
35%
50%
5 25 80% 100% 20
85%
5
85%
95%
85%
5
85%
95%
85%
5
85%
95%
Number
and % of
pupils
started
KS2
above
the
expected
level
KS1
Average
Points
Score of
eligible
pupils at
entry to
KS2
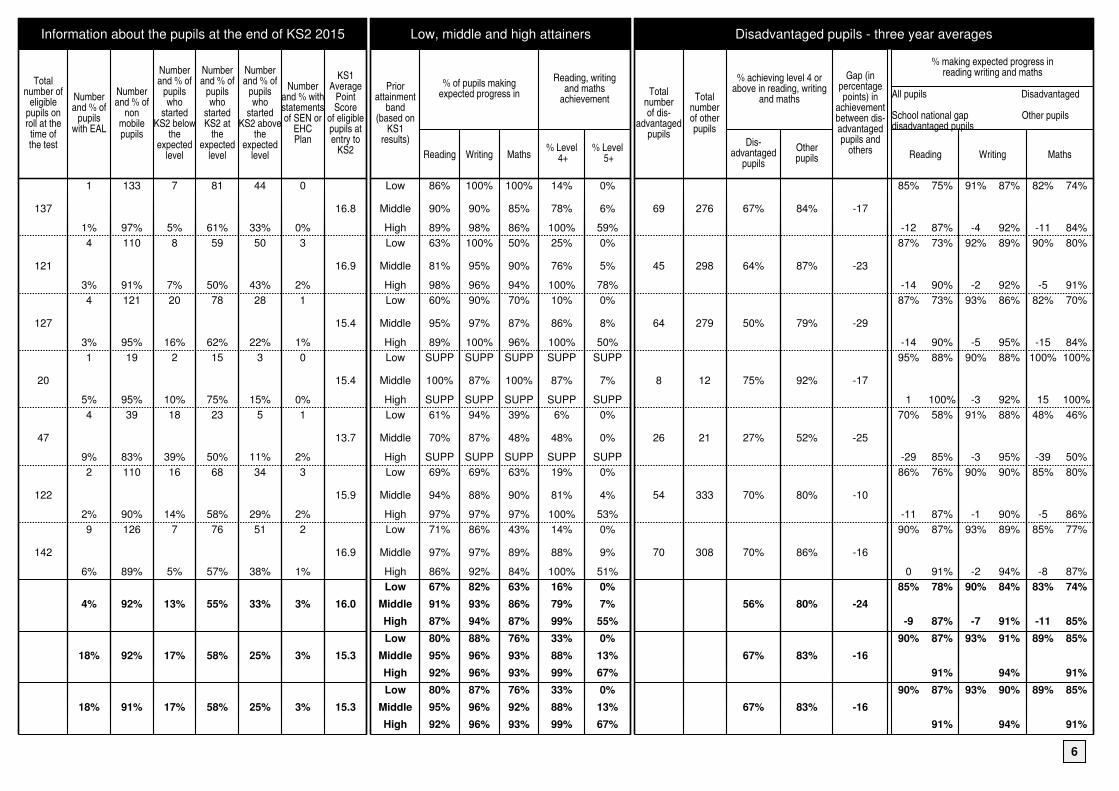
Information about the pupils at the end of KS2 2015
Number
and % of
pupils
started
KS2
below the
expected
level
Number
and % of
pupils
started
KS2 at
the
expected
level
Total
number of
eligible
pupils on
roll at the
time of the
test
Number
and % of
non-
mobile
pupils
Number
and % of
pupils
with EAL
Low, middle and high attainers
Reading, writing
and maths
achievement
Prior
attainment
band
(based on
KS1
results)
Total number
of other
pupils
Reading Writing
% of pupils making
expected
progress inTotal number
of dis-
advantaged
pupils
% achieving level 4 or
above in reading, writing
and maths
Gap (in
percentage
points) in
achievement
between dis-
advantaged
pupils and
others
Closing the gap - three year averages
Maths
% making expected progress in
reading, writing and maths
All pupils Disadvantaged
School-national gap Other pupils
disadvantaged pupils
Number
and % of
pupils
with
statements
of SEN
or EHC
Plan
Throughout the year, teachers assess their pupils in each subject as a part of their teaching and report the level which best describes a pupil’s performance.
Pupils who attract pupil premium funding on the basis of: being eligible for free school meals within the last 6 years; adopted from care; been in the care of the local authority for a day or more; or been subject to a special guardianship or child arrangements order
The number and percentage of all other pupils ie not eligible for free school meals or children looked after.

5
Our calculations of performance measures are based on the results of all pupils at the end of KS2, including those who were absent on the day of the test or working at the level of the tests but unable to access them. This can hap-pen if all, or part, of a test is not suitable for a pupil with particular special educational needs, though the tests are designed to cater for most pupils. Because those pupils are included in the calculations but did not achieve a test level, this may disproportionately afect a school’s results.
To help you take this into account, we show the percentage of eligible pupils who were absent at the time of the tests or working at the level of the tests but unable to access them. The high-er the percentage of those pupils, the more a school’s results may have been afected by pupils with no test results.
Pupils excluded from calculation of performance tables iguresThe government accepts that pupils are unlikely to be able to show what they can do in tests until they have improved their English lan-guage skills and are more familiar with the cur-riculum in this country. Therefore, we accept schools’ requests to remove pupils from our calculation of results where their irst language is not English and they have been admitted to the school in the 2013/14 or 2014/2015 school year from particular countries outside the United Kingdom.
These pupils do not count towards the school’s results but are included in national level igures.
Pupils reported in the tables

6
Description of measures published in the performance tables
Achievements in reading, writing & mathematics The majority of pupils are expected to achieve level 4 or above in reading, writing and maths. The performance measures in this booklet show the percentage of pupils eligible to sit tests who have achieved that level in both reading and maths tests and in writing teach-er assessment. We also show the percentages who have achieved level 3 and below and level 5 or above in all three subjects.
We provide results separately for each of these subjects and for the English grammar, punctuation and spelling test.
Average Point Score (APS)This shows, at school, local authority area and national level, pupils’ average points score achieved. APS is calculated using the following formula:
((a pupil’s reading test score + writing teacher
assessment) divided by 2 + maths)
Divided by 2
If any pupils have no point score for one of more subjects, it will be calculated from the remain-ing subjects. These are then be averaged over all eligible pupils in the school.
While two schools may achieve the same over-all results in the percentage achieving level 4+ in reading, writing and maths measure, APS may show that, on average, pupils in one school scored higher in tests than those in the other.
Key Stage 1 to Key Stage 2 Progress MeasuresThe government expects the majority of pupils to progress by at least two levels of progress between KS1 and KS2 i.e. if a pupil was assessed as being at level 2 in Maths at the end of the KS1, the expectation is that they would have pro-gressed to at least Level 4 in that subject by the end of KS2.
The tables show the proportion of pupils who, by the end of KS2, have made at least minimum expected progress.

7
Teacher Assessment (TA)Schools submit data based on their own assess-ment of their pupils’ levels of ability in a num-ber of subjects. In this booklet, we have given TA results for each of reading, writing and math-ematics. Further information is available on the performance tables website e.g. on English and science TA.
Closing the GapRaising the attainment of children with the most deprived circumstances is a government priority.
The pupil premium guarantees additional fund-ing for schools with children eligible for free school meals at any time within the last six years (FSM); children looked after (CLA) for 1 day or more; those who have been adopted from care; or who have left care under a special guardian-ship order, a residence order or a child arrange-ments order.
These measures show how the performance of disadvantaged pupils (deined here as the children listed above) compares against other pupils in a school. They also the gap in attain-ment and progress between a school’s disad-vantaged pupils and their peers nationally.
Three year rolling averages provide a better pic-ture of performance than a single year’s igures, particularly where small numbers of pupils are involved.
Low, middle and high attainersThis measure highlights any diferences in the performance and progress of pupils who, at the end of KS1 were low attaining, high attaining or performing at expected levels.
Prior attainment deinitions are based on KS1 teacher assessment as follows.
■ Below expected level = those below Level 2 at KS1;
■ At expected level = those at Level 2 at KS1; ■ Above expected level = those above Level 2 at KS1.

2015Primary schoolperformance tables
8
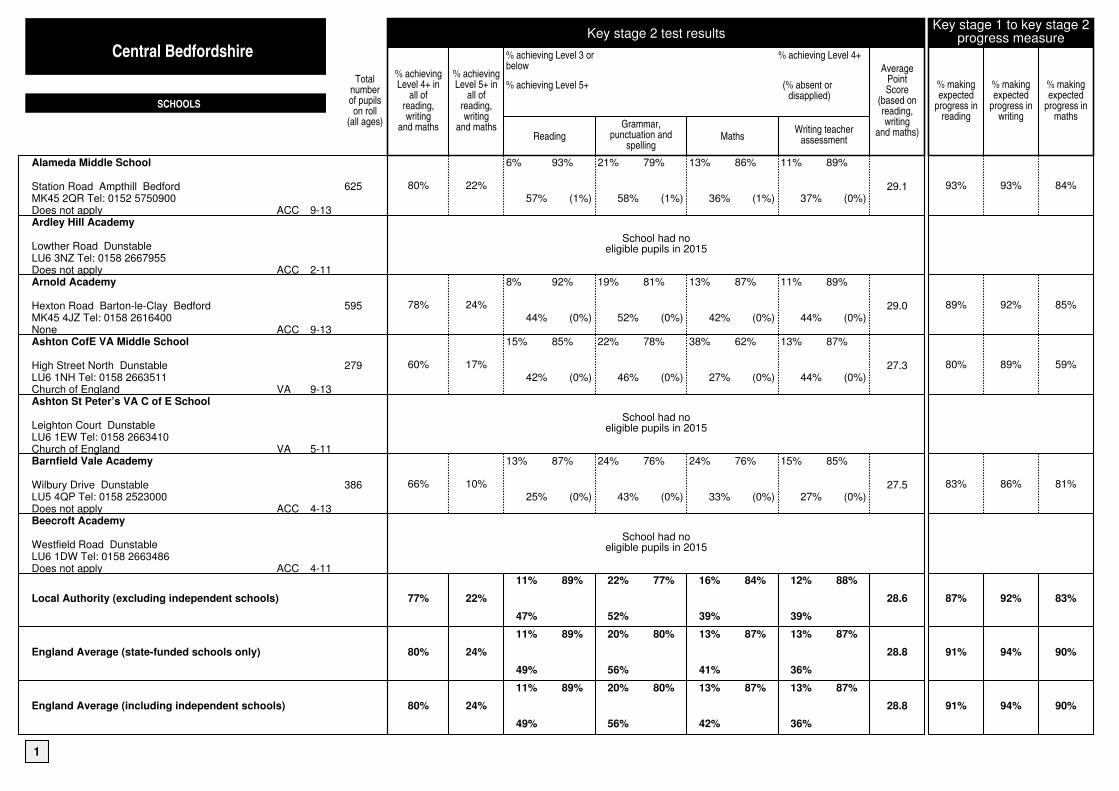
Alameda Middle School
Station Road Ampthill BedfordMK45 2QR Tel: 0152 5750900Does not applyArdley Hill Academy
Lowther Road DunstableLU6 3NZ Tel: 0158 2667955Does not applyArnold Academy
Hexton Road Barton-le-Clay BedfordMK45 4JZ Tel: 0158 2616400NoneAshton CofE VA Middle School
High Street North DunstableLU6 1NH Tel: 0158 2663511Church of EnglandAshton St Peter’s VA C of E School
Leighton Court DunstableLU6 1EW Tel: 0158 2663410Church of EnglandBarnfield Vale Academy
Wilbury Drive DunstableLU5 4QP Tel: 0158 2523000Does not applyBeecroft Academy
Westfield Road DunstableLU6 1DW Tel: 0158 2663486Does not apply
Local Authority (excluding independent schools)
England Average (state-funded schools only)
England Average (including independent schools)
ACC
ACC
ACC
VA
VA
ACC
ACC
9-13
2-11
9-13
9-13
5-11
4-13
4-11
Totalnumberof pupilson roll
(all ages)
625
595
279
386
Key stage 2 test results
% achievingLevel 4+ in
all ofreading,writing
and maths
80%
78%
60%
66%
77%
80%
80%
% achievingLevel 5+ in
all ofreading,writing
and maths
22%
School had noeligible pupils in 2015
24%
17%
School had noeligible pupils in 2015
10%
School had noeligible pupils in 2015
22%
24%
24%
% achieving Level 3 orbelow
% achieving Level 5+
Reading
6%
57%
8%
44%
15%
42%
13%
25%
11%
47%
11%
49%
11%
49%
93%
(1%)
92%
(0%)
85%
(0%)
87%
(0%)
89%
89%
89%
Grammar,punctuation and
spelling
21%
58%
19%
52%
22%
46%
24%
43%
22%
52%
20%
56%
20%
56%
79%
(1%)
81%
(0%)
78%
(0%)
76%
(0%)
77%
80%
80%
Maths
13%
36%
13%
42%
38%
27%
24%
33%
16%
39%
13%
41%
13%
42%
86%
(1%)
87%
(0%)
62%
(0%)
76%
(0%)
84%
87%
87%
% achieving Level 4+
(% absent ordisapplied)
Writing teacherassessment
11%
37%
11%
44%
13%
44%
15%
27%
12%
39%
13%
36%
13%
36%
89%
(0%)
89%
(0%)
87%
(0%)
85%
(0%)
88%
87%
87%
AveragePointScore
(based onreading,writing
and maths)
29.1
29.0
27.3
27.5
28.6
28.8
28.8
Key stage 1 to key stage 2progress measure
% makingexpected
progress inreading
93%
89%
80%
83%
87%
91%
91%
% makingexpected
progress inwriting
93%
92%
89%
86%
92%
94%
94%
% makingexpected
progress inmaths
84%
85%
59%
81%
83%
90%
90%
Central Bedfordshire
SCHOOLS
1
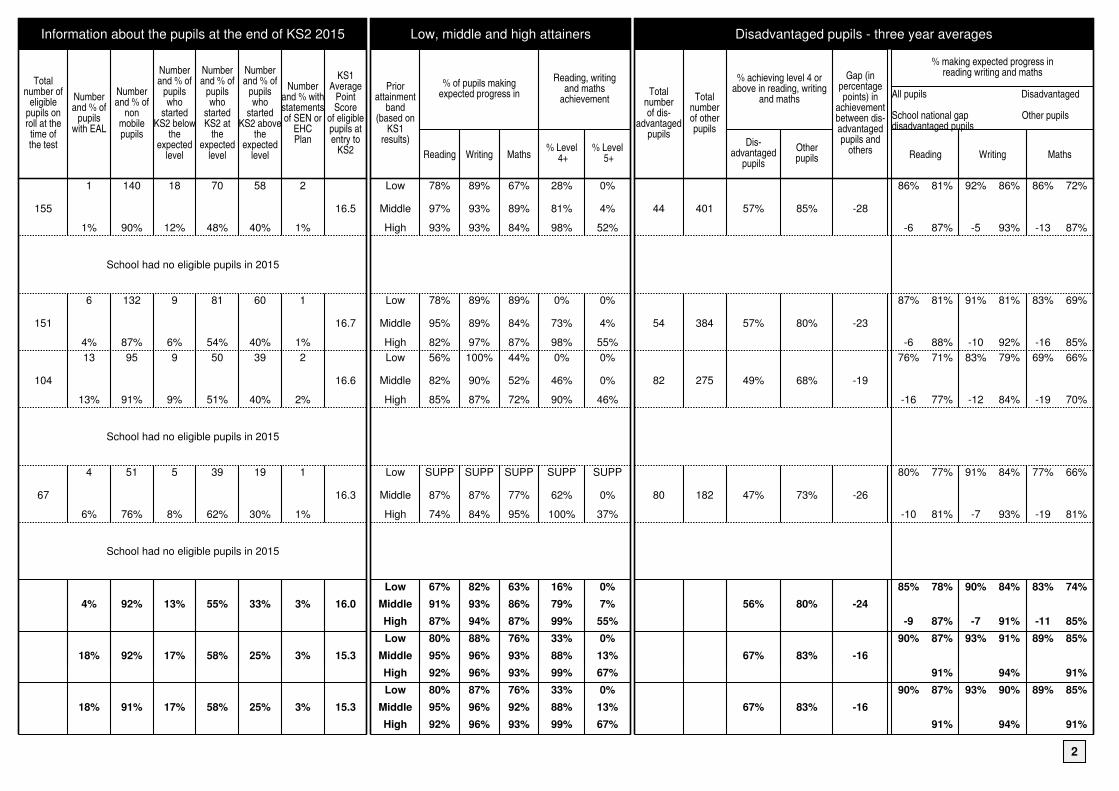
Information about the pupils at the end of KS2 2015
Totalnumber of
eligiblepupils onroll at thetime ofthe test
155
School had no eligible pupils in 2015
151
104
School had no eligible pupils in 2015
67
School had no eligible pupils in 2015
Numberand % of
pupilswith EAL
1
1%
6
4%
13
13%
4
6%
4%
18%
18%
Numberand % of
nonmobilepupils
140
90%
132
87%
95
91%
51
76%
92%
92%
91%
Numberand % of
pupilswho
startedKS2 below
theexpected
level
18
12%
9
6%
9
9%
5
8%
13%
17%
17%
Numberand % of
pupilswho
startedKS2 at
theexpected
level
70
48%
81
54%
50
51%
39
62%
55%
58%
58%
Numberand % of
pupilswho
startedKS2 above
theexpected
level
58
40%
60
40%
39
40%
19
30%
33%
25%
25%
Numberand % withstatementsof SEN or
EHCPlan
2
1%
1
1%
2
2%
1
1%
3%
3%
3%
KS1Average
PointScore
of eligiblepupils atentry to
KS2
16.5
16.7
16.6
16.3
16.0
15.3
15.3
Low, middle and high attainers
Priorattainment
band(based on
KS1results)
Low
Middle
High
Low
Middle
High
Low
Middle
High
Low
Middle
High
Low
Middle
High
Low
Middle
High
Low
Middle
High
% of pupils makingexpected progress in
Reading
78%
97%
93%
78%
95%
82%
56%
82%
85%
SUPP
87%
74%
67%
91%
87%
80%
95%
92%
80%
95%
92%
Writing
89%
93%
93%
89%
89%
97%
100%
90%
87%
SUPP
87%
84%
82%
93%
94%
88%
96%
96%
87%
96%
96%
Maths
67%
89%
84%
89%
84%
87%
44%
52%
72%
SUPP
77%
95%
63%
86%
87%
76%
93%
93%
76%
92%
93%
Reading, writingand maths
achievement
% Level 4+
28%
81%
98%
0%
73%
98%
0%
46%
90%
SUPP
62%
100%
16%
79%
99%
33%
88%
99%
33%
88%
99%
% Level 5+
0%
4%
52%
0%
4%
55%
0%
0%
46%
SUPP
0%
37%
0%
7%
55%
0%
13%
67%
0%
13%
67%
Disadvantaged pupils - three year averages
Totalnumberof dis-
advantagedpupils
44
54
82
80
Totalnumberof otherpupils
401
384
275
182
% achieving level 4 orabove in reading, writing
and maths
Dis-advantaged
pupils
57%
57%
49%
47%
56%
67%
67%
Otherpupils
85%
80%
68%
73%
80%
83%
83%
Gap (inpercentagepoints) in
achievementbetween dis-advantagedpupils and
others
-28
-23
-19
-26
-24
-16
-16
% making expected progress inreading writing and maths
All pupils Disadvantaged
School national gap Other pupilsdisadvantaged pupils
Reading
86%
-6
87%
-6
76%
-16
80%
-10
85%
-9
90%
90%
81%
87%
81%
88%
71%
77%
77%
81%
78%
87%
87%
91%
87%
91%
Writing
92%
-5
91%
-10
83%
-12
91%
-7
90%
-7
93%
93%
86%
93%
81%
92%
79%
84%
84%
93%
84%
91%
91%
94%
90%
94%
Maths
86%
-13
83%
-16
69%
-19
77%
-19
83%
-11
89%
89%
72%
87%
69%
85%
66%
70%
66%
81%
74%
85%
85%
91%
85%
91%
2
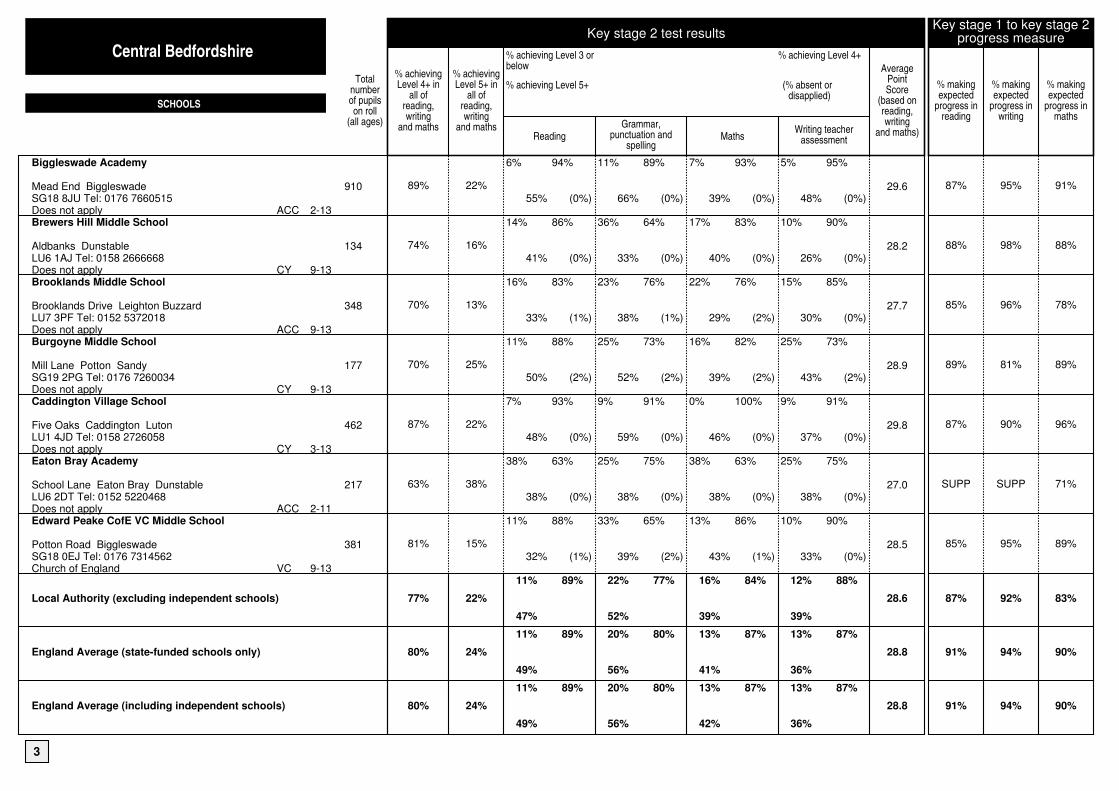
Biggleswade Academy
Mead End BiggleswadeSG18 8JU Tel: 0176 7660515Does not applyBrewers Hill Middle School
Aldbanks DunstableLU6 1AJ Tel: 0158 2666668Does not applyBrooklands Middle School
Brooklands Drive Leighton BuzzardLU7 3PF Tel: 0152 5372018Does not applyBurgoyne Middle School
Mill Lane Potton SandySG19 2PG Tel: 0176 7260034Does not applyCaddington Village School
Five Oaks Caddington LutonLU1 4JD Tel: 0158 2726058Does not applyEaton Bray Academy
School Lane Eaton Bray DunstableLU6 2DT Tel: 0152 5220468Does not applyEdward Peake CofE VC Middle School
Potton Road BiggleswadeSG18 0EJ Tel: 0176 7314562Church of England
Local Authority (excluding independent schools)
England Average (state-funded schools only)
England Average (including independent schools)
ACC
CY
ACC
CY
CY
ACC
VC
2-13
9-13
9-13
9-13
3-13
2-11
9-13
Totalnumberof pupilson roll
(all ages)
910
134
348
177
462
217
381
Key stage 2 test results
% achievingLevel 4+ in
all ofreading,writing
and maths
89%
74%
70%
70%
87%
63%
81%
77%
80%
80%
% achievingLevel 5+ in
all ofreading,writing
and maths
22%
16%
13%
25%
22%
38%
15%
22%
24%
24%
% achieving Level 3 orbelow
% achieving Level 5+
Reading
6%
55%
14%
41%
16%
33%
11%
50%
7%
48%
38%
38%
11%
32%
11%
47%
11%
49%
11%
49%
94%
(0%)
86%
(0%)
83%
(1%)
88%
(2%)
93%
(0%)
63%
(0%)
88%
(1%)
89%
89%
89%
Grammar,punctuation and
spelling
11%
66%
36%
33%
23%
38%
25%
52%
9%
59%
25%
38%
33%
39%
22%
52%
20%
56%
20%
56%
89%
(0%)
64%
(0%)
76%
(1%)
73%
(2%)
91%
(0%)
75%
(0%)
65%
(2%)
77%
80%
80%
Maths
7%
39%
17%
40%
22%
29%
16%
39%
0%
46%
38%
38%
13%
43%
16%
39%
13%
41%
13%
42%
93%
(0%)
83%
(0%)
76%
(2%)
82%
(2%)
100%
(0%)
63%
(0%)
86%
(1%)
84%
87%
87%
% achieving Level 4+
(% absent ordisapplied)
Writing teacherassessment
5%
48%
10%
26%
15%
30%
25%
43%
9%
37%
25%
38%
10%
33%
12%
39%
13%
36%
13%
36%
95%
(0%)
90%
(0%)
85%
(0%)
73%
(2%)
91%
(0%)
75%
(0%)
90%
(0%)
88%
87%
87%
AveragePointScore
(based onreading,writing
and maths)
29.6
28.2
27.7
28.9
29.8
27.0
28.5
28.6
28.8
28.8
Key stage 1 to key stage 2progress measure
% makingexpected
progress inreading
87%
88%
85%
89%
87%
SUPP
85%
87%
91%
91%
% makingexpected
progress inwriting
95%
98%
96%
81%
90%
SUPP
95%
92%
94%
94%
% makingexpected
progress inmaths
91%
88%
78%
89%
96%
71%
89%
83%
90%
90%
Central Bedfordshire
SCHOOLS
3

Information about the pupils at the end of KS2 2015
Totalnumber of
eligiblepupils onroll at thetime ofthe test
110
58
86
56
54
8
113
Numberand % of
pupilswith EAL
4
4%
1
2%
3
3%
2
4%
3
6%
0
0%
4
4%
4%
18%
18%
Numberand % of
nonmobilepupils
106
96%
54
93%
76
88%
49
88%
50
93%
3
38%
103
91%
92%
92%
91%
Numberand % of
pupilswho
startedKS2 below
theexpected
level
14
13%
14
24%
13
15%
7
13%
5
10%
0
0%
17
15%
13%
17%
17%
Numberand % of
pupilswho
startedKS2 at
theexpected
level
61
56%
30
52%
56
67%
28
52%
26
50%
5
83%
67
60%
55%
58%
58%
Numberand % of
pupilswho
startedKS2 above
theexpected
level
33
31%
14
24%
15
18%
19
35%
21
40%
1
17%
27
24%
33%
25%
25%
Numberand % withstatementsof SEN or
EHCPlan
4
4%
0
0%
1
1%
0
0%
0
0%
0
0%
2
2%
3%
3%
3%
KS1Average
PointScore
of eligiblepupils atentry to
KS2
16.0
14.7
15.1
15.9
16.8
16.0
15.6
16.0
15.3
15.3
Low, middle and high attainers
Priorattainment
band(based on
KS1results)
Low
Middle
High
Low
Middle
High
Low
Middle
High
Low
Middle
High
Low
Middle
High
Low
Middle
High
Low
Middle
High
Low
Middle
High
Low
Middle
High
Low
Middle
High
% of pupils makingexpected progress in
Reading
71%
95%
79%
86%
93%
79%
69%
89%
80%
100%
86%
89%
SUPP
88%
81%
NA
SUPP
SUPP
71%
94%
70%
67%
91%
87%
80%
95%
92%
80%
95%
92%
Writing
93%
98%
91%
100%
100%
93%
100%
95%
100%
71%
71%
100%
SUPP
92%
86%
NA
SUPP
SUPP
76%
99%
100%
82%
93%
94%
88%
96%
96%
87%
96%
96%
Maths
93%
95%
82%
64%
97%
93%
62%
82%
80%
100%
79%
100%
SUPP
100%
90%
NA
SUPP
SUPP
71%
91%
96%
63%
86%
87%
76%
93%
93%
76%
92%
93%
Reading, writingand maths
achievement
% Level 4+
43%
93%
100%
7%
93%
100%
8%
77%
100%
14%
64%
100%
SUPP
88%
100%
SUPP
SUPP
29%
87%
100%
16%
79%
99%
33%
88%
99%
33%
88%
99%
% Level 5+
0%
15%
42%
0%
3%
57%
0%
7%
47%
0%
11%
58%
SUPP
8%
48%
SUPP
SUPP
0%
3%
56%
0%
7%
55%
0%
13%
67%
0%
13%
67%
Disadvantaged pupils - three year averages
Totalnumberof dis-
advantagedpupils
62
79
90
24
32
7
65
Totalnumberof otherpupils
304
82
147
133
147
1
220
% achieving level 4 orabove in reading, writing
and maths
Dis-advantaged
pupils
61%
62%
57%
63%
59%
SUPP
69%
56%
67%
67%
Otherpupils
81%
74%
69%
77%
86%
SUPP
82%
80%
83%
83%
Gap (inpercentagepoints) in
achievementbetween dis-advantagedpupils and
others
-20
-12
-12
-14
-27
SUPP
-13
-24
-16
-16
% making expected progress inreading writing and maths
All pupils Disadvantaged
School national gap Other pupilsdisadvantaged pupils
Reading
85%
-1
82%
-2
83%
-7
85%
-4
85%
0
SUPP
SUPP
83%
-7
85%
-9
90%
90%
86%
84%
85%
80%
80%
86%
83%
85%
87%
85%
SUPP
SUPP
80%
85%
78%
87%
87%
91%
87%
91%
Writing
94%
0
91%
0
87%
-8
88%
-8
90%
-4
SUPP
SUPP
95%
-3
90%
-7
93%
93%
91%
95%
91%
91%
83%
89%
83%
89%
87%
91%
SUPP
SUPP
88%
97%
84%
91%
91%
94%
90%
94%
Maths
82%
-6
82%
-8
85%
-4
84%
2
90%
-6
71%
SUPP
86%
-2
83%
-11
89%
89%
79%
83%
77%
86%
81%
87%
87%
83%
79%
92%
SUPP
SUPP
83%
86%
74%
85%
85%
91%
85%
91%
4
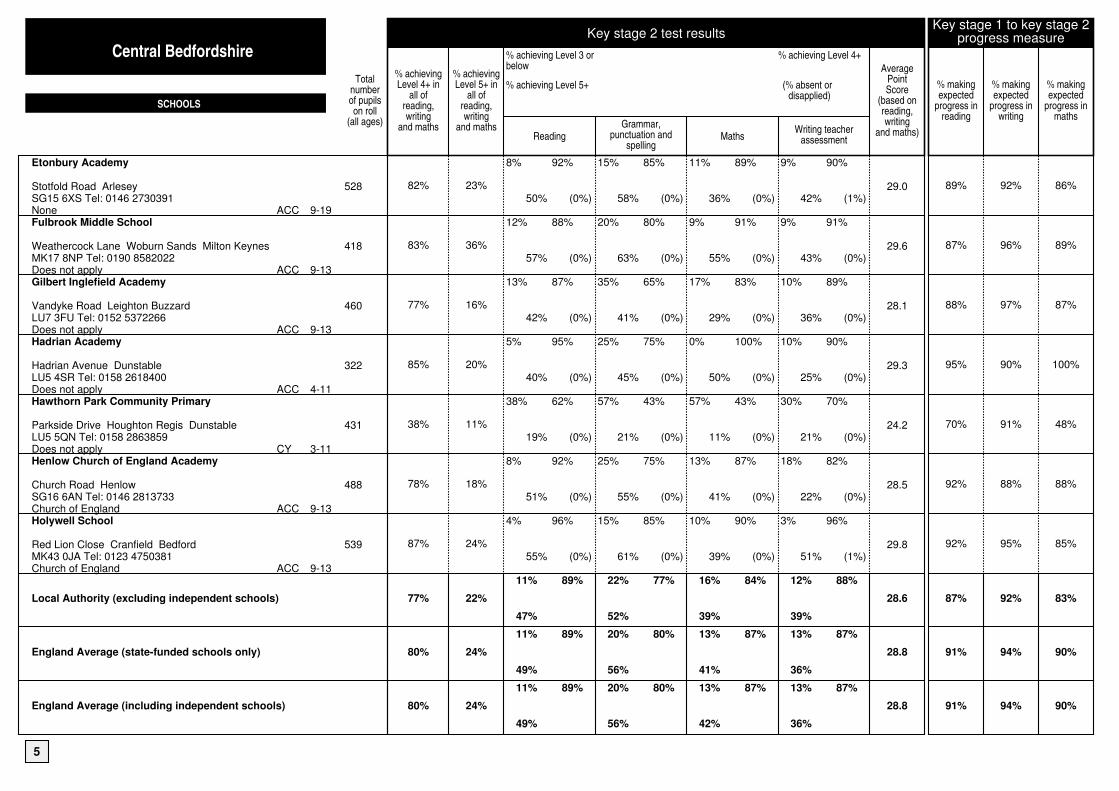
Etonbury Academy
Stotfold Road ArleseySG15 6XS Tel: 0146 2730391NoneFulbrook Middle School
Weathercock Lane Woburn Sands Milton KeynesMK17 8NP Tel: 0190 8582022Does not applyGilbert Inglefield Academy
Vandyke Road Leighton BuzzardLU7 3FU Tel: 0152 5372266Does not applyHadrian Academy
Hadrian Avenue DunstableLU5 4SR Tel: 0158 2618400Does not applyHawthorn Park Community Primary
Parkside Drive Houghton Regis DunstableLU5 5QN Tel: 0158 2863859Does not applyHenlow Church of England Academy
Church Road HenlowSG16 6AN Tel: 0146 2813733Church of EnglandHolywell School
Red Lion Close Cranfield BedfordMK43 0JA Tel: 0123 4750381Church of England
Local Authority (excluding independent schools)
England Average (state-funded schools only)
England Average (including independent schools)
ACC
ACC
ACC
ACC
CY
ACC
ACC
9-19
9-13
9-13
4-11
3-11
9-13
9-13
Totalnumberof pupilson roll
(all ages)
528
418
460
322
431
488
539
Key stage 2 test results
% achievingLevel 4+ in
all ofreading,writing
and maths
82%
83%
77%
85%
38%
78%
87%
77%
80%
80%
% achievingLevel 5+ in
all ofreading,writing
and maths
23%
36%
16%
20%
11%
18%
24%
22%
24%
24%
% achieving Level 3 orbelow
% achieving Level 5+
Reading
8%
50%
12%
57%
13%
42%
5%
40%
38%
19%
8%
51%
4%
55%
11%
47%
11%
49%
11%
49%
92%
(0%)
88%
(0%)
87%
(0%)
95%
(0%)
62%
(0%)
92%
(0%)
96%
(0%)
89%
89%
89%
Grammar,punctuation and
spelling
15%
58%
20%
63%
35%
41%
25%
45%
57%
21%
25%
55%
15%
61%
22%
52%
20%
56%
20%
56%
85%
(0%)
80%
(0%)
65%
(0%)
75%
(0%)
43%
(0%)
75%
(0%)
85%
(0%)
77%
80%
80%
Maths
11%
36%
9%
55%
17%
29%
0%
50%
57%
11%
13%
41%
10%
39%
16%
39%
13%
41%
13%
42%
89%
(0%)
91%
(0%)
83%
(0%)
100%
(0%)
43%
(0%)
87%
(0%)
90%
(0%)
84%
87%
87%
% achieving Level 4+
(% absent ordisapplied)
Writing teacherassessment
9%
42%
9%
43%
10%
36%
10%
25%
30%
21%
18%
22%
3%
51%
12%
39%
13%
36%
13%
36%
90%
(1%)
91%
(0%)
89%
(0%)
90%
(0%)
70%
(0%)
82%
(0%)
96%
(1%)
88%
87%
87%
AveragePointScore
(based onreading,writing
and maths)
29.0
29.6
28.1
29.3
24.2
28.5
29.8
28.6
28.8
28.8
Key stage 1 to key stage 2progress measure
% makingexpected
progress inreading
89%
87%
88%
95%
70%
92%
92%
87%
91%
91%
% makingexpected
progress inwriting
92%
96%
97%
90%
91%
88%
95%
92%
94%
94%
% makingexpected
progress inmaths
86%
89%
87%
100%
48%
88%
85%
83%
90%
90%
Central Bedfordshire
SCHOOLS
5
Information about the pupils at the end of KS2 2015
Totalnumber of
eligiblepupils onroll at thetime ofthe test
137
121
127
20
47
122
142
Numberand % of
pupilswith EAL
1
1%
4
3%
4
3%
1
5%
4
9%
2
2%
9
6%
4%
18%
18%
Numberand % of
nonmobilepupils
133
97%
110
91%
121
95%
19
95%
39
83%
110
90%
126
89%
92%
92%
91%
Numberand % of
pupilswho
startedKS2 below
theexpected
level
7
5%
8
7%
20
16%
2
10%
18
39%
16
14%
7
5%
13%
17%
17%
Numberand % of
pupilswho
startedKS2 at
theexpected
level
81
61%
59
50%
78
62%
15
75%
23
50%
68
58%
76
57%
55%
58%
58%
Numberand % of
pupilswho
startedKS2 above
theexpected
level
44
33%
50
43%
28
22%
3
15%
5
11%
34
29%
51
38%
33%
25%
25%
Numberand % withstatementsof SEN or
EHCPlan
0
0%
3
2%
1
1%
0
0%
1
2%
3
2%
2
1%
3%
3%
3%
KS1Average
PointScore
of eligiblepupils atentry to
KS2
16.8
16.9
15.4
15.4
13.7
15.9
16.9
16.0
15.3
15.3
Low, middle and high attainers
Priorattainment
band(based on
KS1results)
Low
Middle
High
Low
Middle
High
Low
Middle
High
Low
Middle
High
Low
Middle
High
Low
Middle
High
Low
Middle
High
Low
Middle
High
Low
Middle
High
Low
Middle
High
% of pupils makingexpected progress in
Reading
86%
90%
89%
63%
81%
98%
60%
95%
89%
SUPP
100%
SUPP
61%
70%
SUPP
69%
94%
97%
71%
97%
86%
67%
91%
87%
80%
95%
92%
80%
95%
92%
Writing
100%
90%
98%
100%
95%
96%
90%
97%
100%
SUPP
87%
SUPP
94%
87%
SUPP
69%
88%
97%
86%
97%
92%
82%
93%
94%
88%
96%
96%
87%
96%
96%
Maths
100%
85%
86%
50%
90%
94%
70%
87%
96%
SUPP
100%
SUPP
39%
48%
SUPP
63%
90%
97%
43%
89%
84%
63%
86%
87%
76%
93%
93%
76%
92%
93%
Reading, writingand maths
achievement
% Level 4+
14%
78%
100%
25%
76%
100%
10%
86%
100%
SUPP
87%
SUPP
6%
48%
SUPP
19%
81%
100%
14%
88%
100%
16%
79%
99%
33%
88%
99%
33%
88%
99%
% Level 5+
0%
6%
59%
0%
5%
78%
0%
8%
50%
SUPP
7%
SUPP
0%
0%
SUPP
0%
4%
53%
0%
9%
51%
0%
7%
55%
0%
13%
67%
0%
13%
67%
Disadvantaged pupils - three year averages
Totalnumberof dis-
advantagedpupils
69
45
64
8
26
54
70
Totalnumberof otherpupils
276
298
279
12
21
333
308
% achieving level 4 orabove in reading, writing
and maths
Dis-advantaged
pupils
67%
64%
50%
75%
27%
70%
70%
56%
67%
67%
Otherpupils
84%
87%
79%
92%
52%
80%
86%
80%
83%
83%
Gap (inpercentagepoints) in
achievementbetween dis-advantagedpupils and
others
-17
-23
-29
-17
-25
-10
-16
-24
-16
-16
% making expected progress inreading writing and maths
All pupils Disadvantaged
School national gap Other pupilsdisadvantaged pupils
Reading
85%
-12
87%
-14
87%
-14
95%
1
70%
-29
86%
-11
90%
0
85%
-9
90%
90%
75%
87%
73%
90%
73%
90%
88%
100%
58%
85%
76%
87%
87%
91%
78%
87%
87%
91%
87%
91%
Writing
91%
-4
92%
-2
93%
-5
90%
-3
91%
-3
90%
-1
93%
-2
90%
-7
93%
93%
87%
92%
89%
92%
86%
95%
88%
92%
88%
95%
90%
90%
89%
94%
84%
91%
91%
94%
90%
94%
Maths
82%
-11
90%
-5
82%
-15
100%
15
48%
-39
85%
-5
85%
-8
83%
-11
89%
89%
74%
84%
80%
91%
70%
84%
100%
100%
46%
50%
80%
86%
77%
87%
74%
85%
85%
91%
85%
91%
6
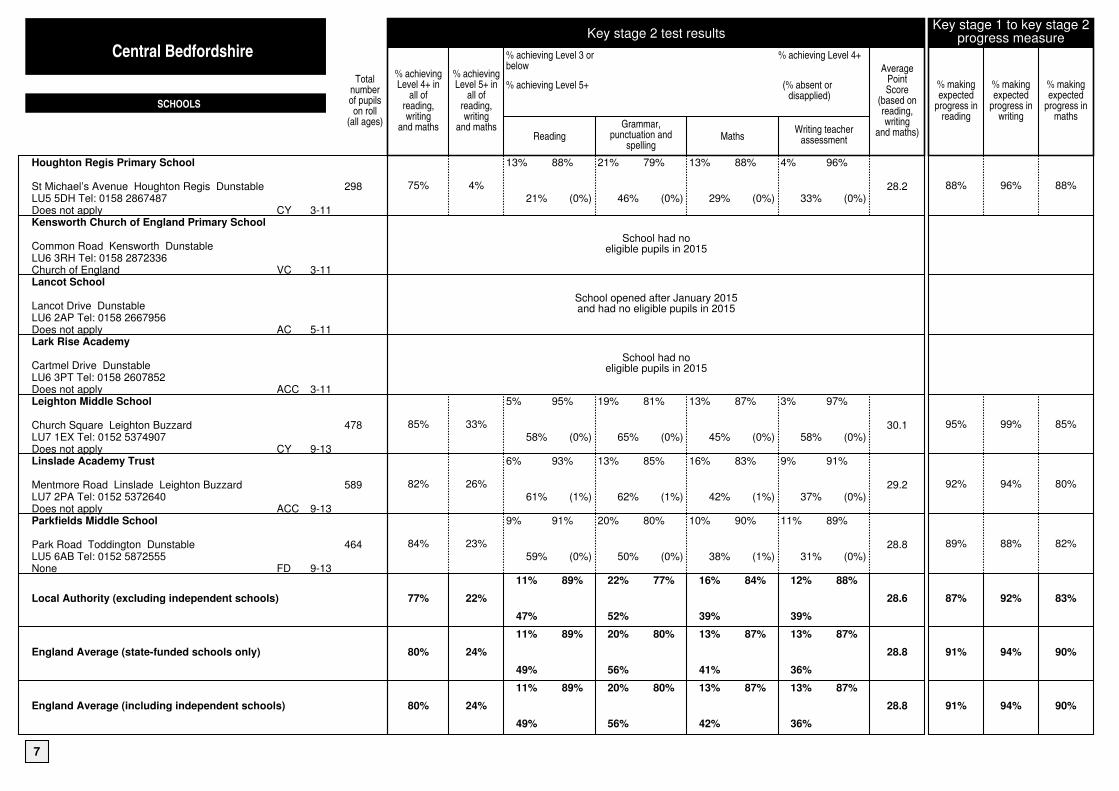
Houghton Regis Primary School
St Michael’s Avenue Houghton Regis DunstableLU5 5DH Tel: 0158 2867487Does not applyKensworth Church of England Primary School
Common Road Kensworth DunstableLU6 3RH Tel: 0158 2872336Church of EnglandLancot School
Lancot Drive DunstableLU6 2AP Tel: 0158 2667956Does not applyLark Rise Academy
Cartmel Drive DunstableLU6 3PT Tel: 0158 2607852Does not applyLeighton Middle School
Church Square Leighton BuzzardLU7 1EX Tel: 0152 5374907Does not applyLinslade Academy Trust
Mentmore Road Linslade Leighton BuzzardLU7 2PA Tel: 0152 5372640Does not applyParkfields Middle School
Park Road Toddington DunstableLU5 6AB Tel: 0152 5872555None
Local Authority (excluding independent schools)
England Average (state-funded schools only)
England Average (including independent schools)
CY
VC
AC
ACC
CY
ACC
FD
3-11
3-11
5-11
3-11
9-13
9-13
9-13
Totalnumberof pupilson roll
(all ages)
298
478
589
464
Key stage 2 test results
% achievingLevel 4+ in
all ofreading,writing
and maths
75%
85%
82%
84%
77%
80%
80%
% achievingLevel 5+ in
all ofreading,writing
and maths
4%
School had noeligible pupils in 2015
School opened after January 2015and had no eligible pupils in 2015
School had noeligible pupils in 2015
33%
26%
23%
22%
24%
24%
% achieving Level 3 orbelow
% achieving Level 5+
Reading
13%
21%
5%
58%
6%
61%
9%
59%
11%
47%
11%
49%
11%
49%
88%
(0%)
95%
(0%)
93%
(1%)
91%
(0%)
89%
89%
89%
Grammar,punctuation and
spelling
21%
46%
19%
65%
13%
62%
20%
50%
22%
52%
20%
56%
20%
56%
79%
(0%)
81%
(0%)
85%
(1%)
80%
(0%)
77%
80%
80%
Maths
13%
29%
13%
45%
16%
42%
10%
38%
16%
39%
13%
41%
13%
42%
88%
(0%)
87%
(0%)
83%
(1%)
90%
(1%)
84%
87%
87%
% achieving Level 4+
(% absent ordisapplied)
Writing teacherassessment
4%
33%
3%
58%
9%
37%
11%
31%
12%
39%
13%
36%
13%
36%
96%
(0%)
97%
(0%)
91%
(0%)
89%
(0%)
88%
87%
87%
AveragePointScore
(based onreading,writing
and maths)
28.2
30.1
29.2
28.8
28.6
28.8
28.8
Key stage 1 to key stage 2progress measure
% makingexpected
progress inreading
88%
95%
92%
89%
87%
91%
91%
% makingexpected
progress inwriting
96%
99%
94%
88%
92%
94%
94%
% makingexpected
progress inmaths
88%
85%
80%
82%
83%
90%
90%
Central Bedfordshire
SCHOOLS
7

Information about the pupils at the end of KS2 2015
Totalnumber of
eligiblepupils onroll at thetime ofthe test
24
School had no eligible pupils in 2015
School opened after January 2015and had no eligible pupils in 2015
School had no eligible pupils in 2015
117
130
115
Numberand % of
pupilswith EAL
1
4%
4
3%
2
2%
0
0%
4%
18%
18%
Numberand % of
nonmobilepupils
22
92%
111
95%
123
95%
115
100%
92%
92%
91%
Numberand % of
pupilswho
startedKS2 below
theexpected
level
1
4%
12
10%
12
9%
8
7%
13%
17%
17%
Numberand % of
pupilswho
startedKS2 at
theexpected
level
20
83%
55
48%
62
48%
57
50%
55%
58%
58%
Numberand % of
pupilswho
startedKS2 above
theexpected
level
3
13%
48
42%
54
42%
48
42%
33%
25%
25%
Numberand % withstatementsof SEN or
EHCPlan
0
0%
1
1%
1
1%
3
3%
3%
3%
3%
KS1Average
PointScore
of eligiblepupils atentry to
KS2
15.5
16.7
16.6
16.9
16.0
15.3
15.3
Low, middle and high attainers
Priorattainment
band(based on
KS1results)
Low
Middle
High
Low
Middle
High
Low
Middle
High
Low
Middle
High
Low
Middle
High
Low
Middle
High
Low
Middle
High
% of pupils makingexpected progress in
Reading
SUPP
95%
SUPP
100%
95%
94%
75%
95%
93%
38%
95%
92%
67%
91%
87%
80%
95%
92%
80%
95%
92%
Writing
SUPP
95%
SUPP
100%
98%
100%
92%
95%
93%
75%
93%
83%
82%
93%
94%
88%
96%
96%
87%
96%
96%
Maths
SUPP
85%
SUPP
92%
87%
81%
50%
81%
85%
50%
88%
81%
63%
86%
87%
76%
93%
93%
76%
92%
93%
Reading, writingand maths
achievement
% Level 4+
SUPP
75%
SUPP
17%
87%
100%
0%
81%
100%
13%
81%
100%
16%
79%
99%
33%
88%
99%
33%
88%
99%
% Level 5+
SUPP
0%
SUPP
0%
18%
58%
0%
8%
54%
0%
7%
44%
0%
7%
55%
0%
13%
67%
0%
13%
67%
Disadvantaged pupils - three year averages
Totalnumberof dis-
advantagedpupils
12
63
76
39
Totalnumberof otherpupils
12
292
358
310
% achieving level 4 orabove in reading, writing
and maths
Dis-advantaged
pupils
75%
57%
47%
62%
56%
67%
67%
Otherpupils
75%
86%
80%
87%
80%
83%
83%
Gap (inpercentagepoints) in
achievementbetween dis-advantagedpupils and
others
0
-29
-33
-25
-24
-16
-16
% making expected progress inreading writing and maths
All pupils Disadvantaged
School national gap Other pupilsdisadvantaged pupils
Reading
88%
13
91%
-5
87%
-3
87%
-20
85%
-9
90%
90%
100%
75%
82%
93%
84%
88%
67%
90%
78%
87%
87%
91%
87%
91%
Writing
96%
1
95%
1
82%
-11
88%
1
90%
-7
93%
93%
92%
100%
92%
95%
80%
82%
92%
87%
84%
91%
91%
94%
90%
94%
Maths
88%
-2
87%
-4
82%
-13
88%
0
83%
-11
89%
89%
83%
92%
81%
89%
72%
84%
85%
88%
74%
85%
85%
91%
85%
91%
8

Priory Academy
Britain Street DunstableLU5 4JA Tel: 0158 2661158Does not applyRobert Bloomfield Academy
Bloomfield Drive SheffordSG17 5BU Tel: 0146 2628800NoneSt Christophers Academy
Gorham Way DunstableLU5 4NJ Tel: 0158 2500960Does not applySt Mary’s Catholic Primary School
Dunstable Road Caddington LutonLU1 4BB Tel: 0158 2602420Roman CatholicSt Vincent’s Catholic Primary School
Hammersmith Gardens Houghton Regis DunstableLU5 5RG Tel: 0158 2862456Roman CatholicSandye Place Academy
Park Road SandySG19 1JD Tel: 0176 7680420Does not applyStreetfield Middle School
Dunstable Road Caddington LutonLU1 4BB Tel: 0158 2661342Does not apply
Local Authority (excluding independent schools)
England Average (state-funded schools only)
England Average (including independent schools)
ACC
ACC
ACC
VA
VA
ACC
CY
9-16
9-13
2-11
3-11
3-11
9-13
9-13
Totalnumberof pupilson roll
(all ages)
537
916
268
206
225
484
199
Key stage 2 test results
% achievingLevel 4+ in
all ofreading,writing
and maths
94%
87%
85%
47%
73%
78%
57%
77%
80%
80%
% achievingLevel 5+ in
all ofreading,writing
and maths
37%
38%
19%
16%
12%
19%
8%
22%
24%
24%
% achieving Level 3 orbelow
% achieving Level 5+
Reading
2%
60%
7%
57%
7%
67%
16%
37%
15%
23%
19%
37%
13%
31%
11%
47%
11%
49%
11%
49%
98%
(1%)
93%
(0%)
93%
(0%)
84%
(0%)
85%
(0%)
81%
(0%)
88%
(0%)
89%
89%
89%
Grammar,punctuation and
spelling
6%
72%
13%
60%
15%
63%
42%
37%
19%
38%
30%
44%
26%
29%
22%
52%
20%
56%
20%
56%
94%
(0%)
87%
(0%)
85%
(0%)
58%
(0%)
81%
(0%)
70%
(0%)
74%
(0%)
77%
80%
80%
Maths
2%
73%
2%
58%
4%
37%
47%
16%
19%
19%
13%
31%
32%
14%
16%
39%
13%
41%
13%
42%
98%
(0%)
98%
(0%)
96%
(0%)
53%
(0%)
81%
(0%)
87%
(0%)
68%
(0%)
84%
87%
87%
% achieving Level 4+
(% absent ordisapplied)
Writing teacherassessment
4%
48%
7%
55%
7%
44%
26%
42%
8%
27%
12%
43%
14%
18%
12%
39%
13%
36%
13%
36%
96%
(0%)
93%
(0%)
93%
(0%)
74%
(0%)
92%
(0%)
88%
(0%)
86%
(0%)
88%
87%
87%
AveragePointScore
(based onreading,writing
and maths)
30.9
30.4
29.6
25.5
27.5
28.3
26.7
28.6
28.8
28.8
Key stage 1 to key stage 2progress measure
% makingexpected
progress inreading
94%
87%
88%
84%
88%
78%
87%
87%
91%
91%
% makingexpected
progress inwriting
96%
96%
100%
84%
100%
93%
93%
92%
94%
94%
% makingexpected
progress inmaths
98%
95%
96%
53%
92%
85%
72%
83%
90%
90%
Central Bedfordshire
SCHOOLS
9

Information about the pupils at the end of KS2 2015
Totalnumber of
eligiblepupils onroll at thetime ofthe test
124
215
27
19
26
118
72
Numberand % of
pupilswith EAL
5
4%
3
1%
4
15%
4
21%
10
38%
2
2%
3
4%
4%
18%
18%
Numberand % of
nonmobilepupils
121
98%
201
93%
25
93%
14
74%
24
92%
113
96%
67
93%
92%
92%
91%
Numberand % of
pupilswho
startedKS2 below
theexpected
level
7
6%
17
8%
3
12%
6
32%
4
16%
14
12%
20
28%
13%
17%
17%
Numberand % of
pupilswho
startedKS2 at
theexpected
level
61
50%
105
51%
15
58%
12
63%
18
72%
65
56%
38
54%
55%
58%
58%
Numberand % of
pupilswho
startedKS2 above
theexpected
level
54
44%
85
41%
8
31%
1
5%
3
12%
38
32%
13
18%
33%
25%
25%
Numberand % withstatementsof SEN or
EHCPlan
2
2%
4
2%
0
0%
0
0%
1
4%
1
1%
3
4%
3%
3%
3%
KS1Average
PointScore
of eligiblepupils atentry to
KS2
17.1
17.0
16.1
13.4
14.2
16.4
14.4
16.0
15.3
15.3
Low, middle and high attainers
Priorattainment
band(based on
KS1results)
Low
Middle
High
Low
Middle
High
Low
Middle
High
Low
Middle
High
Low
Middle
High
Low
Middle
High
Low
Middle
High
Low
Middle
High
Low
Middle
High
Low
Middle
High
% of pupils makingexpected progress in
Reading
86%
98%
91%
71%
89%
88%
SUPP
93%
88%
67%
92%
SUPP
SUPP
83%
SUPP
50%
80%
84%
95%
87%
77%
67%
91%
87%
80%
95%
92%
80%
95%
92%
Writing
86%
98%
94%
94%
95%
96%
SUPP
100%
100%
67%
92%
SUPP
SUPP
100%
SUPP
71%
94%
100%
95%
95%
85%
82%
93%
94%
88%
96%
96%
87%
96%
96%
Maths
86%
98%
98%
88%
99%
91%
SUPP
100%
88%
17%
67%
SUPP
SUPP
89%
SUPP
64%
89%
87%
70%
71%
77%
63%
86%
87%
76%
93%
93%
76%
92%
93%
Reading, writingand maths
achievement
% Level 4+
43%
95%
100%
35%
86%
99%
SUPP
93%
100%
17%
58%
SUPP
SUPP
83%
SUPP
7%
82%
100%
15%
63%
100%
16%
79%
99%
33%
88%
99%
33%
88%
99%
% Level 5+
0%
11%
70%
6%
16%
71%
SUPP
13%
25%
0%
17%
SUPP
SUPP
6%
SUPP
0%
2%
58%
0%
3%
38%
0%
7%
55%
0%
13%
67%
0%
13%
67%
Disadvantaged pupils - three year averages
Totalnumberof dis-
advantagedpupils
62
88
6
10
12
100
92
Totalnumberof otherpupils
306
580
21
9
67
271
154
% achieving level 4 orabove in reading, writing
and maths
Dis-advantaged
pupils
84%
68%
67%
40%
75%
63%
49%
56%
67%
67%
Otherpupils
95%
89%
90%
56%
75%
80%
70%
80%
83%
83%
Gap (inpercentagepoints) in
achievementbetween dis-advantagedpupils and
others
-11
-21
-23
-16
0
-17
-21
-24
-16
-16
% making expected progress inreading writing and maths
All pupils Disadvantaged
School national gap Other pupilsdisadvantaged pupils
Reading
95%
5
87%
-1
88%
-4
84%
3
83%
-5
85%
-7
81%
-7
85%
-9
90%
90%
92%
95%
86%
87%
83%
90%
90%
78%
82%
83%
80%
87%
80%
81%
78%
87%
87%
91%
87%
91%
Writing
97%
-1
93%
1
100%
9
84%
-11
99%
9
91%
-8
83%
-11
90%
-7
93%
93%
90%
98%
92%
93%
100%
100%
80%
89%
100%
98%
83%
94%
80%
84%
84%
91%
91%
94%
90%
94%
Maths
98%
12
95%
11
96%
15
53%
-35
80%
-12
80%
-9
76%
-15
83%
-11
89%
89%
97%
98%
96%
95%
100%
95%
50%
56%
73%
81%
76%
82%
70%
79%
74%
85%
85%
91%
85%
91%
10
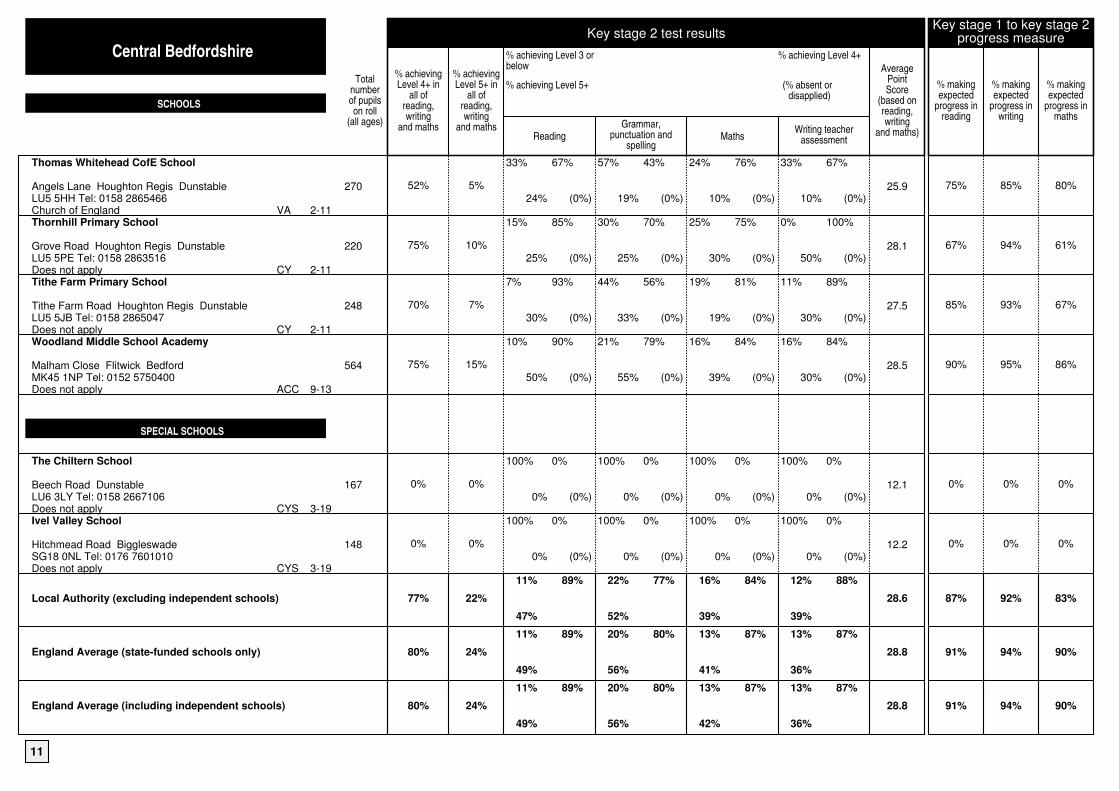
Thomas Whitehead CofE School
Angels Lane Houghton Regis DunstableLU5 5HH Tel: 0158 2865466Church of EnglandThornhill Primary School
Grove Road Houghton Regis DunstableLU5 5PE Tel: 0158 2863516Does not applyTithe Farm Primary School
Tithe Farm Road Houghton Regis DunstableLU5 5JB Tel: 0158 2865047Does not applyWoodland Middle School Academy
Malham Close Flitwick BedfordMK45 1NP Tel: 0152 5750400Does not apply
The Chiltern School
Beech Road DunstableLU6 3LY Tel: 0158 2667106Does not applyIvel Valley School
Hitchmead Road BiggleswadeSG18 0NL Tel: 0176 7601010Does not apply
Local Authority (excluding independent schools)
England Average (state-funded schools only)
England Average (including independent schools)
VA
CY
CY
ACC
CYS
CYS
2-11
2-11
2-11
9-13
3-19
3-19
Totalnumberof pupilson roll
(all ages)
270
220
248
564
167
148
Key stage 2 test results
% achievingLevel 4+ in
all ofreading,writing
and maths
52%
75%
70%
75%
0%
0%
77%
80%
80%
% achievingLevel 5+ in
all ofreading,writing
and maths
5%
10%
7%
15%
0%
0%
22%
24%
24%
% achieving Level 3 orbelow
% achieving Level 5+
Reading
33%
24%
15%
25%
7%
30%
10%
50%
100%
0%
100%
0%
11%
47%
11%
49%
11%
49%
67%
(0%)
85%
(0%)
93%
(0%)
90%
(0%)
0%
(0%)
0%
(0%)
89%
89%
89%
Grammar,punctuation and
spelling
57%
19%
30%
25%
44%
33%
21%
55%
100%
0%
100%
0%
22%
52%
20%
56%
20%
56%
43%
(0%)
70%
(0%)
56%
(0%)
79%
(0%)
0%
(0%)
0%
(0%)
77%
80%
80%
Maths
24%
10%
25%
30%
19%
19%
16%
39%
100%
0%
100%
0%
16%
39%
13%
41%
13%
42%
76%
(0%)
75%
(0%)
81%
(0%)
84%
(0%)
0%
(0%)
0%
(0%)
84%
87%
87%
% achieving Level 4+
(% absent ordisapplied)
Writing teacherassessment
33%
10%
0%
50%
11%
30%
16%
30%
100%
0%
100%
0%
12%
39%
13%
36%
13%
36%
67%
(0%)
100%
(0%)
89%
(0%)
84%
(0%)
0%
(0%)
0%
(0%)
88%
87%
87%
AveragePointScore
(based onreading,writing
and maths)
25.9
28.1
27.5
28.5
12.1
12.2
28.6
28.8
28.8
Key stage 1 to key stage 2progress measure
% makingexpected
progress inreading
75%
67%
85%
90%
0%
0%
87%
91%
91%
% makingexpected
progress inwriting
85%
94%
93%
95%
0%
0%
92%
94%
94%
% makingexpected
progress inmaths
80%
61%
67%
86%
0%
0%
83%
90%
90%
Central Bedfordshire
SCHOOLS
SPECIAL SCHOOLS
11
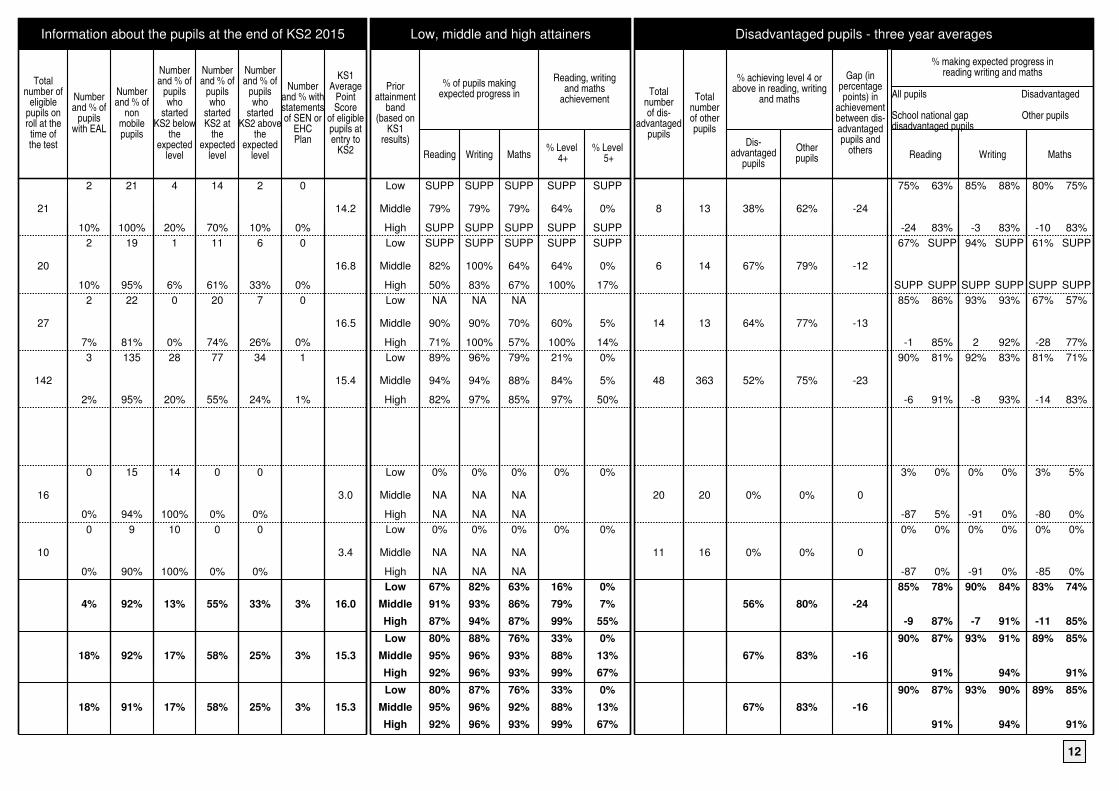
Information about the pupils at the end of KS2 2015
Totalnumber of
eligiblepupils onroll at thetime ofthe test
21
20
27
142
16
10
Numberand % of
pupilswith EAL
2
10%
2
10%
2
7%
3
2%
0
0%
0
0%
4%
18%
18%
Numberand % of
nonmobilepupils
21
100%
19
95%
22
81%
135
95%
15
94%
9
90%
92%
92%
91%
Numberand % of
pupilswho
startedKS2 below
theexpected
level
4
20%
1
6%
0
0%
28
20%
14
100%
10
100%
13%
17%
17%
Numberand % of
pupilswho
startedKS2 at
theexpected
level
14
70%
11
61%
20
74%
77
55%
0
0%
0
0%
55%
58%
58%
Numberand % of
pupilswho
startedKS2 above
theexpected
level
2
10%
6
33%
7
26%
34
24%
0
0%
0
0%
33%
25%
25%
Numberand % withstatementsof SEN or
EHCPlan
0
0%
0
0%
0
0%
1
1%
3%
3%
3%
KS1Average
PointScore
of eligiblepupils atentry to
KS2
14.2
16.8
16.5
15.4
3.0
3.4
16.0
15.3
15.3
Low, middle and high attainers
Priorattainment
band(based on
KS1results)
Low
Middle
High
Low
Middle
High
Low
Middle
High
Low
Middle
High
Low
Middle
High
Low
Middle
High
Low
Middle
High
Low
Middle
High
Low
Middle
High
% of pupils makingexpected progress in
Reading
SUPP
79%
SUPP
SUPP
82%
50%
NA
90%
71%
89%
94%
82%
0%
NA
NA
0%
NA
NA
67%
91%
87%
80%
95%
92%
80%
95%
92%
Writing
SUPP
79%
SUPP
SUPP
100%
83%
NA
90%
100%
96%
94%
97%
0%
NA
NA
0%
NA
NA
82%
93%
94%
88%
96%
96%
87%
96%
96%
Maths
SUPP
79%
SUPP
SUPP
64%
67%
NA
70%
57%
79%
88%
85%
0%
NA
NA
0%
NA
NA
63%
86%
87%
76%
93%
93%
76%
92%
93%
Reading, writingand maths
achievement
% Level 4+
SUPP
64%
SUPP
SUPP
64%
100%
60%
100%
21%
84%
97%
0%
0%
16%
79%
99%
33%
88%
99%
33%
88%
99%
% Level 5+
SUPP
0%
SUPP
SUPP
0%
17%
5%
14%
0%
5%
50%
0%
0%
0%
7%
55%
0%
13%
67%
0%
13%
67%
Disadvantaged pupils - three year averages
Totalnumberof dis-
advantagedpupils
8
6
14
48
20
11
Totalnumberof otherpupils
13
14
13
363
20
16
% achieving level 4 orabove in reading, writing
and maths
Dis-advantaged
pupils
38%
67%
64%
52%
0%
0%
56%
67%
67%
Otherpupils
62%
79%
77%
75%
0%
0%
80%
83%
83%
Gap (inpercentagepoints) in
achievementbetween dis-advantagedpupils and
others
-24
-12
-13
-23
0
0
-24
-16
-16
% making expected progress inreading writing and maths
All pupils Disadvantaged
School national gap Other pupilsdisadvantaged pupils
Reading
75%
-24
67%
SUPP
85%
-1
90%
-6
3%
-87
0%
-87
85%
-9
90%
90%
63%
83%
SUPP
SUPP
86%
85%
81%
91%
0%
5%
0%
0%
78%
87%
87%
91%
87%
91%
Writing
85%
-3
94%
SUPP
93%
2
92%
-8
0%
-91
0%
-91
90%
-7
93%
93%
88%
83%
SUPP
SUPP
93%
92%
83%
93%
0%
0%
0%
0%
84%
91%
91%
94%
90%
94%
Maths
80%
-10
61%
SUPP
67%
-28
81%
-14
3%
-80
0%
-85
83%
-11
89%
89%
75%
83%
SUPP
SUPP
57%
77%
71%
83%
5%
0%
0%
0%
74%
85%
85%
91%
85%
91%
12

Oak Bank School
Sandy Lane Leighton BuzzardLU7 3BE Tel: 0152 5374559Does not applyWeatherfield School
Brewers Hill Road DunstableLU6 1AF Tel: 0158 2605632Does not apply
Local Authority (excluding independent schools)
England Average (state-funded schools only)
England Average (including independent schools)
ACCS
ACCS
9-16
7-19
Totalnumberof pupilson roll
(all ages)
61
116
Key stage 2 test results
% achievingLevel 4+ in
all ofreading,writing
and maths
SUPP
0%
77%
80%
80%
% achievingLevel 5+ in
all ofreading,writing
and maths
SUPP
0%
22%
24%
24%
% achieving Level 3 orbelow
% achieving Level 5+
Reading
SUPP
SUPP
100%
0%
11%
47%
11%
49%
11%
49%
SUPP
SUPP
0%
(0%)
89%
89%
89%
Grammar,punctuation and
spelling
SUPP
SUPP
100%
0%
22%
52%
20%
56%
20%
56%
SUPP
SUPP
0%
(0%)
77%
80%
80%
Maths
SUPP
SUPP
90%
0%
16%
39%
13%
41%
13%
42%
SUPP
SUPP
10%
(0%)
84%
87%
87%
% achieving Level 4+
(% absent ordisapplied)
Writing teacherassessment
SUPP
SUPP
100%
0%
12%
39%
13%
36%
13%
36%
SUPP
SUPP
0%
(0%)
88%
87%
87%
AveragePointScore
(based onreading,writing
and maths)
SUPP
14.0
28.6
28.8
28.8
Key stage 1 to key stage 2progress measure
% makingexpected
progress inreading
SUPP
0%
87%
91%
91%
% makingexpected
progress inwriting
SUPP
10%
92%
94%
94%
% makingexpected
progress inmaths
SUPP
10%
83%
90%
90%
Central Bedfordshire
SPECIAL SCHOOLS
13

Information about the pupils at the end of KS2 2015
Totalnumber of
eligiblepupils onroll at thetime ofthe test
5
10
Numberand % of
pupilswith EAL
SUPP
SUPP
1
10%
4%
18%
18%
Numberand % of
nonmobilepupils
SUPP
SUPP
7
70%
92%
92%
91%
Numberand % of
pupilswho
startedKS2 below
theexpected
level
SUPP
SUPP
9
100%
13%
17%
17%
Numberand % of
pupilswho
startedKS2 at
theexpected
level
SUPP
SUPP
0
0%
55%
58%
58%
Numberand % of
pupilswho
startedKS2 above
theexpected
level
SUPP
SUPP
0
0%
33%
25%
25%
Numberand % withstatementsof SEN or
EHCPlan
3%
3%
3%
KS1Average
PointScore
of eligiblepupils atentry to
KS2
SUPP
5.0
16.0
15.3
15.3
Low, middle and high attainers
Priorattainment
band(based on
KS1results)
Low
Middle
High
Low
Middle
High
Low
Middle
High
Low
Middle
High
Low
Middle
High
% of pupils makingexpected progress in
Reading
SUPP
SUPP
SUPP
0%
NA
NA
67%
91%
87%
80%
95%
92%
80%
95%
92%
Writing
SUPP
SUPP
SUPP
11%
NA
NA
82%
93%
94%
88%
96%
96%
87%
96%
96%
Maths
SUPP
SUPP
SUPP
11%
NA
NA
63%
86%
87%
76%
93%
93%
76%
92%
93%
Reading, writingand maths
achievement
% Level 4+
SUPP
SUPP
SUPP
0%
16%
79%
99%
33%
88%
99%
33%
88%
99%
% Level 5+
SUPP
SUPP
SUPP
0%
0%
7%
55%
0%
13%
67%
0%
13%
67%
Disadvantaged pupils - three year averages
Totalnumberof dis-
advantagedpupils
11
18
Totalnumberof otherpupils
2
17
% achieving level 4 orabove in reading, writing
and maths
Dis-advantaged
pupils
SUPP
0%
56%
67%
67%
Otherpupils
SUPP
0%
80%
83%
83%
Gap (inpercentagepoints) in
achievementbetween dis-advantagedpupils and
others
SUPP
0
-24
-16
-16
% making expected progress inreading writing and maths
All pupils Disadvantaged
School national gap Other pupilsdisadvantaged pupils
Reading
17%
SUPP
6%
-76
85%
-9
90%
90%
SUPP
SUPP
11%
0%
78%
87%
87%
91%
87%
91%
Writing
25%
SUPP
9%
-74
90%
-7
93%
93%
SUPP
SUPP
17%
0%
84%
91%
91%
94%
90%
94%
Maths
17%
SUPP
17%
-68
83%
-11
89%
89%
SUPP
SUPP
17%
18%
74%
85%
85%
91%
85%
91%
14

Glossary
Type Of School
AcademyAcademies are state funded schools that are independent of local authorities. Academies are primarily all-ability schools and beneit from greater freedoms and lexibilities which help them to innovate and raise standards.
Community SchoolCommunity schools are maintained by the local authority (LA). The LA is the admissions authority - it has main responsibility for deciding arrangements for admitting pupils.
Community Special SchoolCommunity Special Schools are maintained by the LA, and make provision for pupils with special educational needs.
Foundation SchoolFoundation Schools are maintained by the LA. The governing body is the admissions authority - it has main responsibility for deciding arrangements for admitting pupils.
Foundation Special SchoolFoundation Special Schools are maintained by the LA, and make provision for pupils with special educational needs.
Free SchoolsFree Schools are all-ability state-funded schools set up in response to what local people say they want and need in order to improve education for children in their community. They have the same legal requirements as academies and enjoy the same freedoms and lexibilities.
Special AcademySpecial Academies are academies organised to make provision for pupils with special educational needs.
Voluntary Aided schoolVoluntary Aided schools are maintained by the LA, with a foundation (generally religious) that appoints most of the governing body. The governing body is the admissions authority.
Voluntary Controlled schoolVoluntary Controlled schools are maintained by the LA, with a foundation (generally religious) which appoints some - but not most - of the governing body. The LA is the admissions authority.
Other Information in the Tables
Children Looked After (CLA)This refers to children for whose care the local authority is responsible i.e. it is the ‘corporate parent’
Key Stage 1 (KS1)Key stage 1 tasks and tests are taken at the end of the key stage 1 programme of study, normally in Year 2, when children are seven years old. Towards the end of KS1, teachers complete assessments of each child’s level of ability in each subject.
Key Stage 2 (KS2) Key stage 2 tests in reading, mathematics are taken at the end of the key stage 2 programme of study, normally in Year 6 when children are 11 years old. Teachers also submit assessments of pupils’ levels of achievement in English, writing and science.
Eligible pupilsAll pupils, including those with special educational needs, are eligible for assessment under the national curriculum when they reach the end of key stage 2. Most will be aged 11 by the end of the school year, but some will be older or younger. This number includes all eligible pupils on the school roll at the time of the tests, regardless of whether or not they sat the tests (some pupils may have been absent or working at the level of the tests but unable to access them).
About This Booklet
SENSpecial Educational Needs
LALocal Authority.
SUPPInformation has been suppressed because the underlying numbers are too small
FSMPupils eligible for Free School Meals at any time within the last 6 years
Teacher Assessments (TA)The tests are marked internally by teachers. The results, together with other information, are used by teachers to produce teacher assessments in each subject.
How the Tables were compiledKey stage 2 results were supplied by the Standards and Testing Agency following completion of the marking of test papers, and again after STA’s consideration of marking review applications.
Individual pupil details were checked with or provided by schools in September 2014.
Further InformationIf you have any questions about the information in the Tables, you should irst contact the school concerned.
Printable versions of the School Performance Tables for local authority areas (listing all schools in the area) are available at: www.education.gov.uk/schools/performance
© Crown copyright 2015
Published December 2015


