Primer on Minnesota Energy March 11, 2016 Minnesota Energy Generation and Use .............................................................................................................. 2 Total Energy Consumption ..................................................................................................................... 2 Electricity ................................................................................................................................................ 3 Heating ................................................................................................................................................... 5 Utilities ................................................................................................................................................... 6 Pipelines ................................................................................................................................................. 7 Minnesota Energy Policy ..................................................................................................................................... 7 General Overview ................................................................................................................................... 7 Energy Conservation............................................................................................................................... 8 Energy and Electricity Supply ................................................................................................................. 9 Renewable Energy Standard and Solar Energy Standard .......................................................... 9 Other Solar Energy Policies ..................................................................................................... 10 Nuclear Plant Moratorium ...................................................................................................... 12 Net Metering ........................................................................................................................... 12 Fuels ........................................................................................................................................ 12 Other Renewable Energy Policies............................................................................................ 14 Greenhouse Gas Emission Reductions ................................................................................................. 15 Emissions Goals ....................................................................................................................... 15 Coal Plant Moratorium ............................................................................................................ 15 About the Legislative Energy Commission ........................................................................................................ 16 Establishment and Duties ..................................................................................................................... 16 Energy Future Planning ........................................................................................................................ 16 References ......................................................................................................................................................... 17 Legislative Energy Commission State Office Building, Room 65 100 Rev. Dr. Martin Luther King Jr. Blvd. St. Paul, MN 55155 www.lec.leg.mn 651-297-7137, [email protected]Annie Levenson-Falk, Executive Director This document is made available electronically by the Minnesota Legislative Reference Library as part of an ongoing digital archiving project. http://www.leg.state.mn.us/lrl/lrl.asp
Transcript
Primer on Minnesota Energy
March 11, 2016
Minnesota Energy Generation and Use .............................................................................................................. 2
Total Energy Consumption ..................................................................................................................... 2
Minnesota Energy Policy ..................................................................................................................................... 7
General Overview ................................................................................................................................... 7
Energy Conservation............................................................................................................................... 8
Energy and Electricity Supply ................................................................................................................. 9
Renewable Energy Standard and Solar Energy Standard .......................................................... 9
Other Solar Energy Policies ..................................................................................................... 10
This document is made available electronically by the Minnesota Legislative Reference Library as part of an ongoing digital archiving project. http://www.leg.state.mn.us/lrl/lrl.asp
2
Minnesota Energy Generation and Use
Total Energy Consumption
Figure 1 shows total energy use in Minnesota by source. This includes energy used for electricity transportation, heating, and all other purposes. More than half of energy is lost due to inefficiencies in its generation, delivery, and use. Much of this waste occurs in the form of heat escaping power plants and vehicle engines. The largest share of Minnesota energy is used in buildings (residential and commercial). About a quarter of total energy goes to transportation. However, because transportation fuel is relatively expensive, transportation accounts for half of spending on energy in Minnesota.
3
Electricity Electricity generation
Minnesota wind generation has increased dramatically in the past decade, and coal’s portion of generation has declined by nearly the same amount. Minnesota natural gas generation is considerably lower than the national average. Natural gas generation in Minnesota is largely used to back up wind power; gas generators ramp down when the wind is blowing and back up when more power is needed. Xcel Energy’s two nuclear plants, Monticello and Prairie Island, make up nearly 25% of Minnesota’s generation. Their operating licenses expire in 2030 and 2033/34, respectively.i Minnesota solar generation, listed at zero in 2007, increased to 21,000 megawatt-hours (MWh) in 2014. This represents less than 1% of the total, but solar power is expected to grow rapidly in the next few years. 2012-13 were anomalous because Unit 3 of Xcel’s Sherburne County (Sherco) plant was out of service until 2013, after suffering a massive failure in late 2011. A coal-powered generator with a capacity of 860 megawatts, Sherco 3 is Minnesota’s largest generating unit.ii Its shutdown is reflected in the relatively lower share of coal power during these years. Utilities both own generation resources (power plants, wind farms, etc.) and buy power from third parties in power purchase agreements (PPAs). Some utility customers also own on-site
4
generation, ranging from large industrial customers with combined heat and power facilities to residential rooftop solar photovoltaic. Regardless of whether a customer has on-site generation, they almost universally remain connected to and dependent on the grid. Figure 5 shows only electricity generated in Minnesota; however, approximately 30% of the electricity used in Minnesota is imported from other states or Canada.iii
The grid and the Midcontinent Independent System Operator (MISO) Minnesota is part of a regional, national, and international electricity grid. In much of the U.S., regional transmission organizations (RTOs) exist to ensure the efficient and reliable transmission of power. Minnesota is covered by an RTO called the Midcontinent Independent System Operator (MISO), a nonprofit organization that coordinates electricity transmission in an area from Manitoba to the Gulf of Mexico. MISO and other RTOs are comparable to air traffic controllers for electricity. MISO does not own any wires or electricity generation, but it manages the transmission system, coordinates maintenance of generation and transmission, and plans for transmission expansion in order to ensure reliability. MISO works on the transmission level – the high-voltage lines that carry electricity from where it’s generated. Minnesota’s distribution grids – the lower-voltage local power lines – are managed by local utilities. MISO also operates competitive energy markets, on which power producers and utilities buy and sell electricity. Participation in MISO is voluntary; utilities and power generators participate because regional coordination increases reliability and efficiency.
Figure 6. Transmission and distribution
Source: Dominion. “Comparison of Transmission and Distribution Lines.” http://bit.ly/220DfP0. Accessed March 9, 2016.
Figure 7. Map of Regional Transmission Organizations
Source: Federal Energy Regulatory Commission, http://www.ferc.gov/industries/electric/indus-act/rto.asp
5
Heating Heating fuel use varies greatly by geography. Natural gas is the most common source of home heating in Minnesota, but it is not available in all areas. These charts show primary heating fuel for Minnesota households, though many households use two or more fuels.
Figure 9. Primary household heating fuel by county, 2010-2014
Utility gas Bottled, tank, or LP gas Electricity Other fuel* * Other fuels include fuel oil,
kerosene, wood, coke, or solar energy
Source: U.S. Census Bureau. American Community Survey, 2010-2014 (5-year estimates).
6
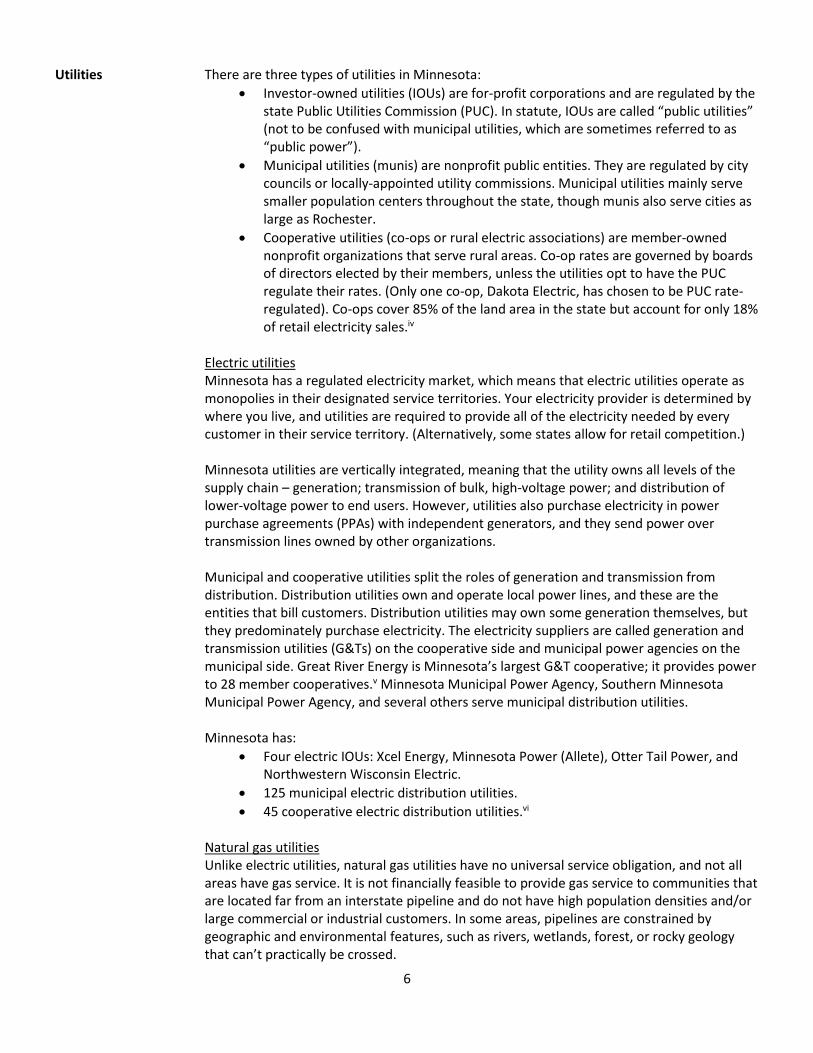
Utilities There are three types of utilities in Minnesota:
Investor-owned utilities (IOUs) are for-profit corporations and are regulated by the state Public Utilities Commission (PUC). In statute, IOUs are called “public utilities” (not to be confused with municipal utilities, which are sometimes referred to as “public power”).
Municipal utilities (munis) are nonprofit public entities. They are regulated by city councils or locally-appointed utility commissions. Municipal utilities mainly serve smaller population centers throughout the state, though munis also serve cities as large as Rochester.
Cooperative utilities (co-ops or rural electric associations) are member-owned nonprofit organizations that serve rural areas. Co-op rates are governed by boards of directors elected by their members, unless the utilities opt to have the PUC regulate their rates. (Only one co-op, Dakota Electric, has chosen to be PUC rate-regulated). Co-ops cover 85% of the land area in the state but account for only 18% of retail electricity sales.iv
Electric utilities Minnesota has a regulated electricity market, which means that electric utilities operate as monopolies in their designated service territories. Your electricity provider is determined by where you live, and utilities are required to provide all of the electricity needed by every customer in their service territory. (Alternatively, some states allow for retail competition.) Minnesota utilities are vertically integrated, meaning that the utility owns all levels of the supply chain – generation; transmission of bulk, high-voltage power; and distribution of lower-voltage power to end users. However, utilities also purchase electricity in power purchase agreements (PPAs) with independent generators, and they send power over transmission lines owned by other organizations. Municipal and cooperative utilities split the roles of generation and transmission from distribution. Distribution utilities own and operate local power lines, and these are the entities that bill customers. Distribution utilities may own some generation themselves, but they predominately purchase electricity. The electricity suppliers are called generation and transmission utilities (G&Ts) on the cooperative side and municipal power agencies on the municipal side. Great River Energy is Minnesota’s largest G&T cooperative; it provides power to 28 member cooperatives.v Minnesota Municipal Power Agency, Southern Minnesota Municipal Power Agency, and several others serve municipal distribution utilities. Minnesota has:
Four electric IOUs: Xcel Energy, Minnesota Power (Allete), Otter Tail Power, and Northwestern Wisconsin Electric.
125 municipal electric distribution utilities.
45 cooperative electric distribution utilities.vi Natural gas utilities Unlike electric utilities, natural gas utilities have no universal service obligation, and not all areas have gas service. It is not financially feasible to provide gas service to communities that are located far from an interstate pipeline and do not have high population densities and/or large commercial or industrial customers. In some areas, pipelines are constrained by geographic and environmental features, such as rivers, wetlands, forest, or rocky geology that can’t practically be crossed.
7
Minnesota’s natural gas distribution companies include:
Five investor-owned utilities: CenterPoint Energy, Great Plains Natural Gas Company, Greater Minnesota Gas, Minnesota Energy Resources Corporation (MERC), and Xcel Energy.vii
31 municipal gas utilities.viii
A number of small companies. Companies serving fewer than 650 customers on a system, with fewer than 2,000 customers among all systems, are not required to be regulated.ix
There are no cooperative natural gas utilities in Minnesota.
Pipelines In Minnesota, 65,000 miles of pipelines transport natural gas, propane, anhydrous ammonia, crude oil, and refined oil products, such as gasoline and diesel. These products are imported from oil and natural gas fields in North Dakota, Alberta, and other areas for use in state, and they are pipe through Minnesota to customers in other states. Pipelines generally require two approvals from the Public Utilities Commission. A Certificate of Need determines the need for a large energy project, and whether the size, type and timing of the proposed pipeline will meet that need. A route permit is required for pipelines over 6 inches in diameter pumping hazardous liquids and pipelines designed to transport natural gas at a pressure exceeding 275 pounds per square inch. Additional state and federal permits may also be required, such as permits related to water quality. In its role as public advocate, the Department of Commerce’s Division of Energy Resources evaluates all pipelines requiring a Certificate of Need.x
Minnesota Energy Policy
General Overview The major areas of energy law are:
Minnesota Statutes, Chapter § 216A: Public utility regulators
Minnesota Statutes, Chapter § 216B: Public utilities
Minnesota Statutes, Chapter § 216C: Energy planning and conservation
Minnesota Statutes, Chapter § 216E: Electric power facility permits
Minnesota Statutes, Chapter § 216F: Wind energy conversion systems
Minnesota Statutes, Chapter § 216G: Pipelines
Minnesota Statutes, Chapter § 216H: Greenhouse gas emissions The following sections provide more detail on some of the statutes that are frequently discussed at the legislature. This is not comprehensive of Minnesota energy policy. Some of Minnesota’s energy policies are standards (or mandates), while others are goals. Generally, standards call for an entity or entities to be accountable for meeting certain requirements, whereas goals set a policy directions for the state but hold no particular entities responsible for meeting targets.
8
Energy Conservation Energy Savings Goal (M.S. § 216C.05, subd. 2) Establishes a state goal of annual energy savings equal to at least 1.5% of annual retail electricity and natural gas sales, to be achieved through cost-effective energy efficiency. Energy Conservation Improvement (M.S. § 216B.241) The Conservation Improvement Program (CIP) requires each utility to meet energy savings goals of 1.5% of annual retail sales per year. Utilities may request this goal be adjusted as low as 1% per year based on their experience, customer types, and other factors, and utilities are not required to achieve the goal if it is not cost-effective. For electric utilities, at least 1% energy savings must come from customer-side efficiency improvements; the remaining 0.5% may come from electric utility infrastructure projects. CIP also includes a requirement for minimum utility spending, but since the energy savings requirement was added in 2007, it is the savings requirement that drives utility action.xi Spending requirements are 0.5% of gross operating revenues for a natural gas utility, 1.5% for an electric utility, and 2% for a public electric utility that operates a nuclear plant (Xcel). Utilities meet their energy savings goals by offering Conservation Improvement Programs to their customers, with incentives such as rebates on high-efficiency appliances, building envelope improvements, and process efficiency upgrades. Utilities must offer low-income programs and spend a minimum on these programs (0.2% of gross operating revenue for an electric utility or a municipal gas utility; 0.4% for a public gas utility). Programs are approved by the Department of Commerce. The Public Utilities Commission must allow the utilities they regulate to recover their expenses related to the program plus a financial performance incentive. Large customers may be exempted from the Conservation Improvement Program – and from financial contributions to the program – if they demonstrate that they are taking conservation measures in their facilities. According to a Department of Commerce report, from 2007-2014, CIP saved more than 55 billion kilowatt-hours at a cost of $0.018 per kWh, and 206 trillion cubic feet of natural gas at $1.64 per million cubic feet – significantly less than the cost of electricity or gas that would have otherwise been used. Combined, Commerce found the electric and natural gas conservation programs had a net benefit of more than $3.4 billion over this period.xii
9
Energy and Electricity Supply
Renewable Energy
Standard and Solar Energy Standard
Renewable Energy Objectives and Solar Energy Standard (M.S. § 216B.1691) The Renewable Energy Standard (RES) requires that each electric utility generate or procure a portion of their total retail electric sales from eligible renewable sources, increasing incrementally until 2025 (see Figure 11). The RES applies to all Minnesota utilities and is higher and accelerated for Xcel, as the owner of nuclear generation. Eligible renewable sources are: solar, wind, small hydroelectric (capacity of less than 100 MW), hydrogen generated from a renewable resource, and biomass. Note that electricity from large hydroelectric dams does not qualify as renewable. Investor-owned utilities are also required to meet an additional solar energy standard (SES) of 1.5% by 2020, with at least 10% of that amount coming from small solar photovoltaic systems (capacity of 20 kW of less). The SES was passed in 2013. Utilities are on track to meet the renewable energy standard. Twenty-one percent of the electricity generated in Minnesota in 2014 was renewable, up from just 8% in 2007. Solar power comprised less than 1% of generation in 2014 but is growing quickly, and progress toward the SES will become clearer over the next couple years.
Renewable Energy Certificates (RECs): Once electricity is put onto power lines, there is no way to distinguish renewably generated electrons from any other power on the grid. For that reason, renewable generation is measured with RECs. One REC represents the environmental attributes of one megawatt-hour of renewable power. Utilities demonstrate they are meeting the RES by retiring RECs. Utilities can get RECs from renewable generation they own or purchase, or they can buy RECs from other power generators “unbundled” from
power purchases. Tracking RECs prevents any unit of renewable power from being double-counted even as the actual electricity may be bought and sold independently. The Department of Commerce submits an RES compliance report to the Legislature in January of each odd-numbered year.
Other Solar Energy Policies
Solar Energy Goal (M.S. § 216B.1691, subd. 2f) Establishes a goal that 10% of retail electric sales in Minnesota be generated by solar energy by 2030. Made in Minnesota Solar Incentive Program (M.S.§ 216C.411-416) $15 million per year is available for 10 years for incentives to install Minnesota-made solar thermal or solar electric photovoltaic (PV) systems with a capacity of under 40 kW. $250,000 of the total funds incentives for solar thermal systems, which convert sunlight directly to thermal energy for heating or cooling. The remainder goes to solar PV, which uses sunlight to generate electricity. The incentive is financed from two sources:
1. Investor-owned electric utilities contribute 5% of the minimum they are statutorily required to spend on energy conservation programs.
2. The balance comes from Xcel’s Renewable Development Fund.
Owners of qualifying solar PV systems receive a production incentive (per kilowatt-hour generated) at amounts determined by the Department of Commerce. The incentive amount is based on several factors, including the installed cost of the system, and may be revised annually. The 2016 incentives range from $0.13/kWh to $0.30/kWh depending on the manufacturer and whether the installation will be residential, commercial for-profit, or tax exempt/nonprofit/government. Applicants enter a lottery to receive incentives, and only electric customers of Xcel, Minnesota Power and Otter Tail Power are eligible to apply. As of March 2016, five manufacturers have been certified for the program: tenKsolar, Silicon Energy, itek Energy, Heliene, and Saga Solar.xiii The solar thermal rebate amounts are set in statute: 25% of the installed cost up to a maximum of $2,500 for residential systems, $5,000 for multifamily systems, and $25,000 for commercial systems. It is open to utility customers throughout the state, with preference given to customers of the investor-owned utilities.
Figure 14. Solar thermal systems
Source: RREAL, www.real.org
Figure 13. Solar PV systems
Source: tenKsolar, http://tenksolar.com/wp-
content/uploads/2016/01/Ten-K-
Solar_AllianceProgramOverview_ebook.pdf;
Silicon Energy, http://silicon-energy.com/.
11
Community Solar Gardens (M.S. § 216B.1641) A community solar garden sells solar-generated electricity to subscribers who purchase a portion of its output. It allows access to solar energy by renters and property owners who cannot afford to install their own solar systems or whose property may be unsuitable for a solar installation. To date, community solar gardens have been most often owned by private developers, though some are utility-owned. Under this statute, which passed in 2013, Xcel Energy is required to have a community solar program; other utilities may offer programs by choice. Xcel Energy’s program is required to purchase electricity from community solar gardens that meet certain criteria, including having a capacity of no more than one megawatt and having at least 5 subscribers, with no single subscriber taking more than 40% of the garden’s output, and no subscriber purchasing more than 120% of their average annual electricity consumption. The solar gardens can be owned by Xcel or any other entity that contracts to sell the electricity to Xcel. There is no limit on the number of generation capacity or solar gardens in the program. Xcel’s community solar garden program must be approved by the Public Utilities Commission. The number and cumulative capacity of gardens proposed for Xcel’s program to date has far surpassed expectations. Xcel began accepting applications on December 12, 2014; by June 23, 2015, it had received applications for projects totaling 912 MW.xiv The program has been slow to start, as details were worked out in PUC proceedings, but is expected to be a significant source of solar power in coming years. House Research published a brief with updates on Xcel’s community solar program in February 2016: http://www.house.leg.state.mn.us/hrd/pubs/solargarden.pdf. Value of Solar Tariff (M.S. § 216B.164, subd. 10) The value of solar (VOS) tariff is a per-kilowatt-hour rate that a public utility may use to compensate its customers who have solar generation. The VOS is set according to a PUC-approved methodology that reflects the value that solar energy represents to the utility, its customers and society, incorporating savings that accrue from avoiding construction of new power plants and transmission lines, reducing power line losses, and many other factors. A utility that uses the VOS tariff plugs the applicable values for its system into the approved methodology, resulting in a tariff that is unique to that utility. If a utility chooses the VOS tariff, customers with solar generation are charged the applicable retail rate for all electricity consumed, then given a bill credit for solar power generated at the VOS rate. Utilities that use the VOS must recalculate it each year according to the established methodology – but the utility generally must contract with solar generators for at least 20 years, using the per-kilowatt-hour rate from Year 1 for the life of the contract. If a utility does not choose the VOS, customers with power generation are compensated according to the net metering statute (see below). To date, no utility has elected to offer a tariff based on the value of solar.
12
Xcel Solar Energy Incentive Program (M.S. § 116C.7792) For five years beginning in 2014, Xcel Energy must provide production incentives for small solar energy systems. $5 million per year is allocated from the Renewable Development Fund for this program. Qualifying solar energy systems have a capacity of no more than 20 kW, are sized to less than 120% of the customer’s on-site energy consumption, and are not receiving an incentive through the Made in Minnesota program. The incentive is paid for 10 years.
Nuclear Plant Moratorium
Nuclear Plant Moratorium (M.S. § 216B.243, subd. 3b) The Public Utilities Commission is prohibited from issuing a certificate of need for the construction of a new nuclear power plant. Any certificate of need for additional storage of spent nuclear fuel for a facility seeking a license extension shall address the impacts of continued operations over the period for which approval is sought.
Net Metering Net Energy Metering (M.S. § 216B.164) “Net metering” is a method of compensating utility customers for electricity they generate and feed into the utility’s grid – for example, rooftop solar panels or a small wind turbine. Under net metering, the amount of electricity a customer generates is subtracted from the amount of power the customer uses, and the customer is billed for that net energy use.1 Minnesota law provides for net metering of facilities up to 40 kW capacity for cooperative and municipal utilities and up to 1,000 kW capacity for investor-owned utilities. If a customer produces more electricity than they use, they are compensated at a rate reflecting the utility’s avoided cost that is set by the Public Utilities Commission or, for qualifying facilities under 40 kW capacity, at the average utility retail rate. Cooperative and municipal utilities are permitted to charge an additional fee to recover fixed costs not already paid for through a customer’s existing billing arrangement, under a provision that passed in 2015. The fee must be “reasonable and appropriate” based on the utility’s most recent cost of service study, and this study must be made available for review by a customer upon request. This fee is intended to protect the economic health of utilities when customers’ bills are less than the cost of electric service provided to their properties. This can occur because a portion of the utility’s fixed costs are covered by customers’ per-kilowatt-hour electric rates, and customers’ power generation reduces their usage charges.
Fuels Biofuel Content Mandate (M.S. § 239.791) Under this statute, gasoline for sale in Minnesota must contain either:
The greater of (a) 10% conventional biofuel (derived from cornstarch) or (b) the maximum percent of conventional biofuel authorized by the U.S. EPA., or
10% of a non-conventional biofuel (not derived from cornstarch). Conventional biofuel must comprise no less than the portion specified below: July 1, 2013 90% January 1, 2015 80% January 1, 2017 70% January 1, 2020 60% January 1, 2025 no minimum
1 Under the federal Public Utility Regulatory Policy Act (PURPA, 1978), utilities must purchase electricity from cogeneration facilities and from
facilities with capacity of 80 MW or less that are primarily fueled by biomass or other renewables, waste, or geothermal.
13
Biodiesel Content Mandate (M.S. § 239.77) With a few exceptions, diesel for sale in Minnesota for use in internal combustion engines must contain an increasing portion of biodiesel. September 29, 2005 2% May 1, 2009 5% May 1, 2012 10% May 1, 2018 20% The above minimums apply to April-September; in October-March, the minimum is 5%. A lower biodiesel content is used in colder months to avoid the fuel gelling. The above minimums become effective on the date specified only if the commissioners of agriculture, commerce and pollution control publish a notice at least 270 days in advance; testing, supply and infrastructure needs have been met; and at least 5% of the necessary biodiesel will be produced from a biological resource other than an agricultural resource traditionally grown or raised in Minnesota (for example algae, waste oil, or tallow). The 2012 increase went into effect in 2014. It was delayed due to inadequate blending infrastructure in the southwestern area of the state and inadequate regulatory protocol for Minnesota Weights and Measures enforcement.xv Petroleum Replacement Goal (M.S. § 239.7911, subd. 1) Establishes a goal that biofuel comprise an increasing portion of total gasoline for sale in the state: 2015 14% 2017 18% 2020 25% 2025 30% Fossil Fuel Reduction Goal (M.S. § 216C.05, subd. 2) Establishes a goal of reducing per capita fossil fuel use 15% by 2015. The statute does not specify a baseline year, but it passed in 2007.
0
50
100
150
200
250
300
350
2005 2006 2007 2008 2009 2010 2011 2012 2013
MM
Btu
/per
son
Figure 15. Fossil Fuel Use Per Capita
Minnesota United States
14.7% reduction from 2007
Source: LHB, Inc., from U.S. Energy Information Administration. “Table CT3. Total End-Use Energy Consumption Estimates, 1960-2012, Minnesota”. http://www.eia.gov/state/seds/data.cfm?incfile=/state/seds/sep_use/tx/use_tx_MN.html&sid=MN
14
Other Renewable Energy Policies
Renewable Development Fund (M.S. § 116C.779, subd.1) Xcel Energy must set aside money for the Renewable Development Fund (RDF) each year in exchange for storing spent nuclear fuel: $500,000 per dry cask stored at its Prairie Island nuclear plant and $350,000 per dry cask at its Monticello plant. When the nuclear plants are no longer in operation, the Public Utilities Commission can require Xcel to contribute $7.5 million (for Prairie Island) or $5.2 million (for Monticello) per year if it finds that Xcel has not made a good faith effort to remove the spent fuel to a site out of state. As of August 2014, Xcel stored 38 casks at Prairie Island and 15 casks at Monticello; it plans to eventually store 64 and 30, respectively.xvi The RDF can provide funds for the following purposes:
To increase the market penetration within the state of renewable electric energy resources at reasonable costs.
To promote the start-up, expansion, and attraction of renewable electric energy projects and companies within the state.
To stimulate research and development within the state into renewable electric energy technologies.
To develop near-commercial and demonstration scale renewable electric projects or electric infrastructure delivery projects if those delivery projects enhance the delivery of renewable electric energy.
The RDF account is managed by Xcel. Funding is provided in an RFP process, with recommendations from an Advisory Committee. Funding cycles have occurred every 2-6 years since 2001. Additionally, the legislature has from time to time allocated a portion of RDF funds directly, including for the Made in Minnesota solar incentive program. Since the fund’s inception, Xcel has contributed more than $280 million. In 2015, this cost customers $0.000563 per kWh, or about $0.42 per month for an average customer using 750 kWh per month.xvii Renewable Energy Goal (M.S. § 216C.05, subd. 2) Establishes a goal that 25% of the total energy used in the state be derived from renewable energy resources by the year 2025. Twenty-five by twenty-five goal (M.S. § 41A.11) Establishes a goal that by January 1, 2025, the state’s agricultural, forestry and working lands provide from renewable resources at least 25% of the total energy consumed in the state while continuing to produce safe, abundant and affordable food, feed and fiber. Property-Assessed Clean Energy (M.S. § 216C.435-436) The PACE program allows cities and counties to make clean energy financing available to property owners so that property owners repay the loan through their property tax bills. Renewable Energy Equipment Grant Program (Laws of MN 2015 1st spec. session, ch. 1, art. 1, sec. 8, subd. 7) For fiscal years 2016 and 2017, $150,000 per year is available to providers of low-income weatherization services to install renewable energy equipment in households that are eligible for weatherization assistance under Minnesota’s weatherization assistance program state plan.
15
Greenhouse Gas Emissions Reductions
Emissions Goals
Greenhouse Gas Emissions-Reduction Goal (M.S. § 216H.02) Establishes goals to reduce total greenhouse gas emissions across all sectors in Minnesota: 2015 15% below 2005 levels 2025 30% below 2005 levels 2050 80% below 2005 levels Data is only available up to 2012, but Minnesota is not believed to have met the 2015 goal, and the state is even farther off track for 2025. Between 2005 and 2012, greenhouse gas emissions declined 7%. Electricity and transportation are the largest sources of greenhouse gas emissions, at 31% and 25% respectively. However, the electric sector has also seen the largest proportional reduction of emissions.xviii The Pollution Control Agency reports to the Legislature on progress toward these goals in January of each odd-numbered year.
Coal Plant Moratorium
Long-term increased emissions from power plants prohibited (M.S. § 216H.03, subd. 3) This statute prohibits the construction of new coal power plants in Minnesota, the importation of power from new coal plants located out of state, and new long-term power purchase agreements for coal power. The state of North Dakota has taken Minnesota to court over this law. In 2014, a federal court declared the law unconstitutional, finding that it violates the U.S. Constitution’s Commerce Clause by regulating power generation in other states. Minnesota has appealed this ruling.xix
Whether or not the law stands may not have a large effect on new coal power. Since the law passed in 2007, U.S. EPA issued a rule limiting carbon emissions from new coal plants. The EPA rule would basically require carbon capture and storage to be part of any newly constructed coal plant, and this technology has not yet proven commercially viable.
16
About the Legislative Energy Commission
Establishment and Duties
Legislative Energy Commission (M.S. § 3.8851) The Legislative Energy Commission (LEC) consists of 10 members of the House of Representatives and 10 members of the Senate, including the energy policy committee chairs; members from the committees on environmental policy, agriculture policy, and transportation policy; and members of the NextGen Energy Board. According to this statute, the commission:
“Shall continuously evaluate the energy policies of the state and the degree to which
they promote an environmentally and economically sustainable energy future.”
“Shall monitor the state’s progress in achieving [the Renewable Energy Standard and
greenhouse gas goals].”
“May review proposed energy legislation and may recommend legislation.”
“Shall when feasible solicit and consider public testimony regarding the economic,
environmental, and social implications of state energy plans and policies.”
The commission’s evaluations and reviews “shall include new and existing technologies for nuclear power.” The commission may “study, analyze, hold hearings, and make legislative recommendations regarding” electricity generation, transmission, and distribution; greenhouse gas emissions reduction; energy conservation; alternative and renewable energy; related economic development; and “other energy-related subjects the commission finds significant.” To fund the commission’s operations, its co-chairs may request that the commissioner of commerce issue an assessment split equally between Minnesota utilities and bulk terminals from which petroleum products and liquid petroleum gas are dispensed. The assessment may not exceed $250,000 in a fiscal year.
Energy Future Planning
Planning Strategy for Sustainable Energy Future (M.S. § 3.8852) This statute requires the Legislative Energy Commission, “in consultation with the commissioner of commerce and other state agencies, [to] develop a framework for the state of Minnesota to transition to a renewable energy economy that ends Minnesota’s contribution to greenhouse gases from burning fossil fuels within the next few decades.” The commission must consult with stakeholders in developing this framework. The statute was passed in 2013. The commission is required to report on progress annually by January 15 to the legislative committees and divisions with jurisdiction over energy policy.
17
References i Minnesota House Research. “Resources on Minnesota Issues: Nuclear Waste Storage in Minnesota.” November
2013. ii Xcel Energy. “Sherburne County (Sherco) Generating Station.”
http://www.xcelenergy.com/Energy_Portfolio/Electricity/Sherburne_County_(Sherco)_Generating_Station. Accessed March 9, 2016.
Shaffer, David. “Sherco 3, Minnesota’s largest power generating unit, is back in full service.” Minneapolis Star Tribune. February 5, 2014.
iii U.S. Energy Information Administration. “Table 10. Supply and disposition of electricity, 1990 through 2013.” http://www.eia.gov/electricity/state/minnesota/. Accessed March 9, 2016.
iv Horan, Jim. “Rate Trends for Minnesota Electric Cooperatives.” Presentation to the Legislative Energy Commission. January 28, 2016.
v Great River Energy. “Company.” http://greatriverenergy.com/company/. Accessed March 9, 2016. vi Minnesota Public Utilities Commission. “Find a Utility Company.” https://mn.gov/puc/consumers/find-a-utility-
company.jsp. Accessed March 9, 2016. vii Ibid. viii Minnesota Municipal Utilities Association. “Meet Minnesota’s Municipal Utilities.”
http://www.mmua.org/about/about-mns-municipal-utilities. Accessed March 9, 2016. ix M.S. § 216B.16, subd. 12. x Minnesota Environmental Quality Board. “Interagency Report on Oil Pipelines.” December 2015. Minnesota House of Representatives Research Department. “Minnesota’s Petroleum Infrastructure: Pipelines,
Refineries, Terminals.” June 2013. xi Minnesota Department of Commerce, Division of Energy Resources. “Energy Savings Goal Study & Stakeholder
Process: Legislative Report.” April 10, 2014. xii Minnesota Department of Commerce. “A Report on the Impacts of the 2010-2014 Shared Savings Demand-Side
Management (DSM) Financial Incentive on Investor-Owned Utility Conservation Achievements and Customers Costs.” Docket No. E.G999/CI-08-133. July 1, 2015.
xiii Minnesota Department of Commerce. “Solar modules from two manufacturers certified for the MiM Solar PV Incentive Program.” Renewable News. March 3, 2016.
xiv Minnesota House of Representatives Research Department. “Xcel Energy’s Solar Community Garden Program.” January 2016.
xv Minnesota Department of Agriculture. “About the Minnesota Biodiesel Program.” http://www.mda.state.mn.us/renewable/biodiesel/aboutbiodiesel.aspx. Accessed March 10, 2016.
xvi Winner, Danielle. “Memo: Renewable Development Fund.” Prepared for the Legislative Energy Commission, March 17, 2015.
xvii Ibid. xviii Minnesota Pollution Control Agency. “Greenhouse Gas Emission Reduction: Biennial Report to the Minnesota
Legislature.” January 2015. xix Shaffer, David. “North Dakota and Minnesota face off over coal power in federal appeals court.” Minneapolis Star