Principal Financial Advisors, Inc. Investment Advisory Report South Dakota Department of Labor Contract No. 4-15193 July 01, 2008 - September 30, 2008 Contents Page 1 2 10 11 Principal Financial Advisors, Inc. Overview Portfolio and Strategic Asset Allocation Review Portfolio Performance Review Investment Option Performance
Transcript
Principal Financial Advisors, Inc.
Investment Advisory ReportSouth Dakota Department of LaborContract No. 4-15193July 01, 2008 - September 30, 2008
ContentsPage
1 21011
Principal Financial Advisors, Inc. OverviewPortfolio and Strategic Asset Allocation ReviewPortfolio Performance ReviewInvestment Option Performance
Principal Financial Advisors, Inc. OverviewMaking informed and effective asset allocation decisions may be one of the most important – and challenging – endeavors an employerundertakes for their retirement plan. This decision is key in determining whether the plan will meet its long-term investment goals and objectives.At the Principal Financial Group® (The Principal®), we understand the challenges and pressures employers face as a retirement plan sponsor,including the selection of optimal investment options.
For over 20 years, Principal Financial Advisors, Inc., a registered investment advisor, and a member company of the Principal Financial Group®has been providing asset allocation solutions for clients. Today, we manage over $5.9 billion in assets overall and have over 400 clients using ouradvisory services for retirement plans.
Our mission is to provide high quality investment advisory and consulting services to help clients meet their goals and objectives by offeringpremier investment managers and customized asset allocation solutions.
The investment advisory services of Principal Financial Advisors, Inc., are consistent with the following core beliefs:
1) Strategic asset allocation decisions are key determinants of investor success.2) Liability analysis and plan sponsor attributes dictate asset allocation decisions for defined benefit plans.3) Diversification by asset class, style, and manager is the primary tool for limiting investment risk.4) Value is added through manager selection.
Principal Financial Advisors, Inc., provides:
1) Benefits of the Principal Due Diligence ProgramSM provided by Principal Life Insurance Company.2) Asset liability analysis for defined benefit plans and scenerios to help meet your plan's goals.3) Assumption of fiduciary responsibility for asset allocation decisions.*4) Experienced investment personnel.5) Comprehensive reporting and top-tier client service.
Principal Financial Advisors, Inc., focuses on long-term asset allocation strategies with the goal of providing optimal return and riskscenarios to help meet your defined benefit plan’s goals.
* The plan sponsor remains the named fiduciary of the plan, but Principal Financial Advisors, Inc., has been selected as the plan's investment advisor.
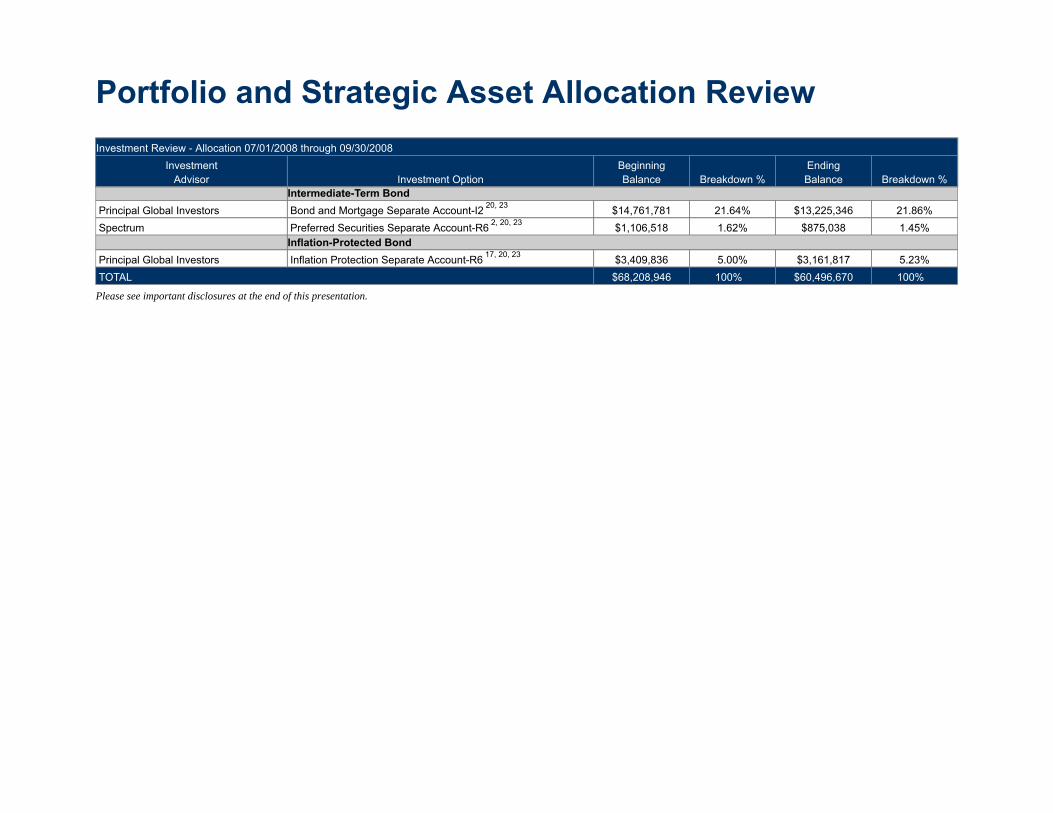
Portfolio and Strategic Asset Allocation ReviewInvestment Review - Allocation 07/01/2008 through 09/30/2008
InvestmentAdvisor Investment Option
BeginningBalance Breakdown %
EndingBalance Breakdown %
Large U.S. EquityLarge Value
AllianceBernstein / Westwood LargeCap Value III Separate Account-R6 2, 19, 24, 35 $3,054,431 4.48% $2,787,338 4.61%UBS Global Asset Mgmt (NY) LargeCap Value I Separate Account-R6 17 $6,224,799 9.13% $5,802,453 9.59%
Large BlendGoldman Sachs Asset Mgt LargeCap Blend I Separate Account-R6 9 $6,047,628 8.87% $5,496,461 9.09%
Large GrowthColumbus Circle Investors LargeCap Growth Separate Account-R6 13, 26 $4,994,222 7.32% $4,321,897 7.14%T. Rowe Price Associates, Inc. LargeCap Growth I Separate Account-R6 2, 11 $5,043,328 7.39% $4,270,661 7.06%
Small/Mid U.S. EquityMid Cap Value
Principal Global/Barrow Hanley MidCap Value III Separate Account-R6 1, 15, 27 $1,236,962 1.81% $1,124,090 1.86%Mid Cap Growth
Turner Investment Partners MidCap Growth III Separate Account-R6 1, 14, 29 $1,286,456 1.89% $1,022,275 1.69%Small Value
JP Morgan/Mellon Capital Mgmt SmallCap Value I Separate Account-R6 1, 2, 18 $1,227,392 1.80% $1,239,478 2.05%Small Growth
UBS/Emerald/Essex SmallCap Growth II Separate Account-R6 1, 2, 7 $1,315,137 1.93% $1,198,311 1.98%International EquityDiversified Emerging Markets
Principal Global Investors International Emerging Markets Separate Account-R6 3 $945,067 1.39% $668,217 1.10%Foreign Large Blend
Fidelity (Pyramis Global Adv) International I Separate Account-R6 3, 17, 21, 33 $4,377,375 6.42% $3,464,317 5.73%Foreign Large Growth
Principal Global Investors International Growth Separate Account-R6 2, 3 $4,418,911 6.48% $3,278,567 5.42%Real EstateOwned Real Estate
Principal Real Estate Inv U.S. Property Separate Account-R6 5 $4,152,425 6.09% $4,060,417 6.71%Specialty-Real Estate
Principal Real Estate Inv Real Estate Securities Separate Account-R6 2, 8 $1,477,353 2.17% $1,558,357 2.58%Fixed IncomeHigh Yield Bond
JP Morgan/Lehman Brothers High Yield I Separate Account-R6 4, 17, 20, 22, 23, 34 $3,129,325 4.59% $2,941,630 4.86%
Intermediate-Term BondPrincipal Global Investors Bond and Mortgage Separate Account-I2 20, 23 $14,761,781 21.64% $13,225,346 21.86%Spectrum Preferred Securities Separate Account-R6 2, 20, 23 $1,106,518 1.62% $875,038 1.45%
Inflation-Protected BondPrincipal Global Investors Inflation Protection Separate Account-R6 17, 20, 23 $3,409,836 5.00% $3,161,817 5.23%TOTAL $68,208,946 100% $60,496,670 100%
Please see important disclosures at the end of this presentation.
Portfolio and Strategic Asset Allocation ReviewInvestment Review - Allocation 07/01/2008 through 09/30/2008
InvestmentAdvisor Investment Option
BeginningBalance Breakdown %
EndingBalance Breakdown %
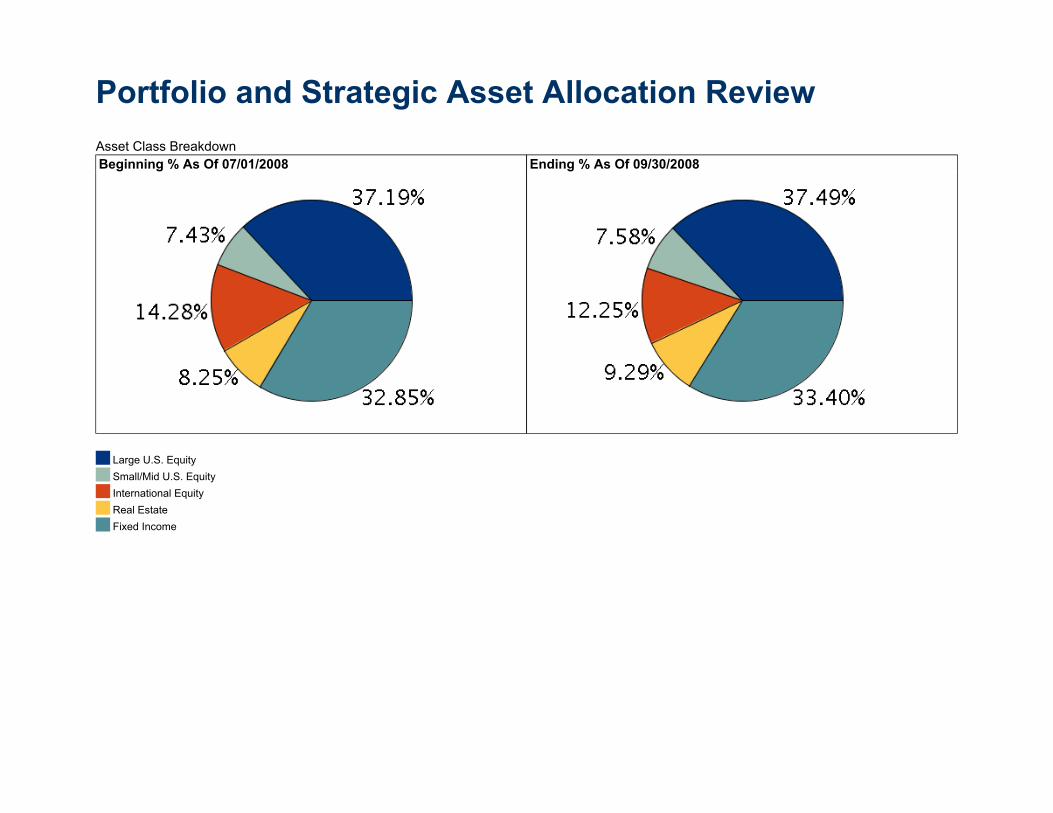
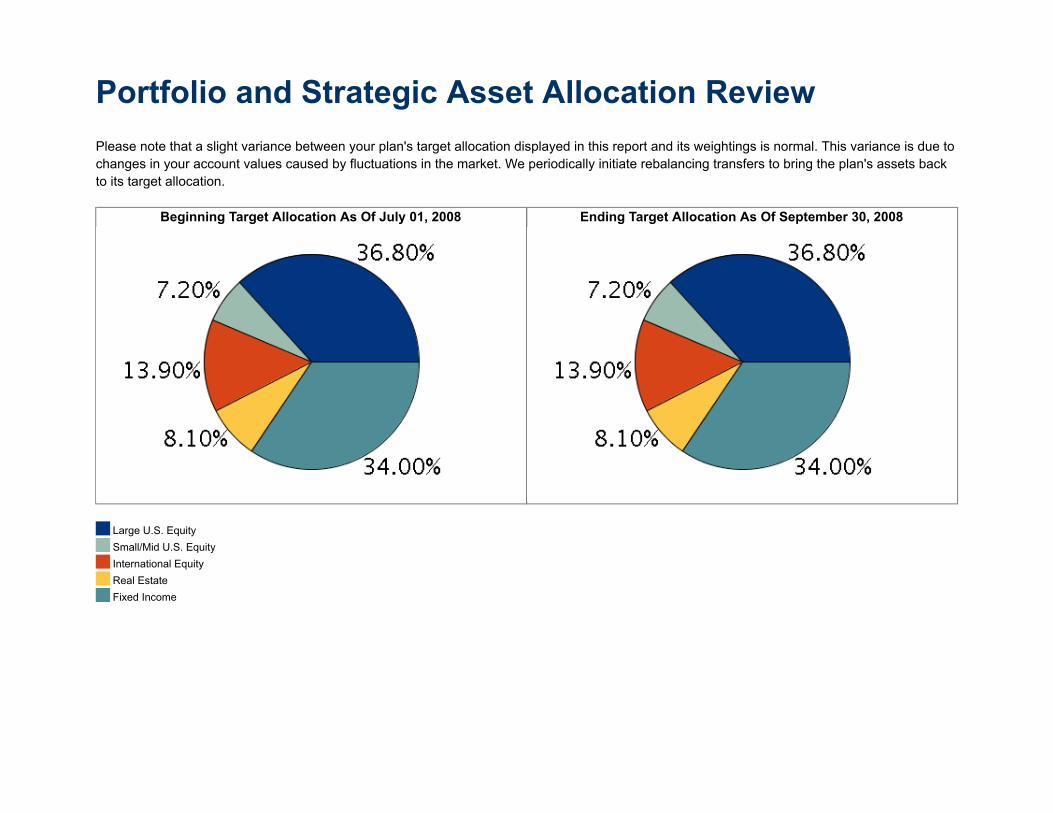
Portfolio and Strategic Asset Allocation ReviewAsset Class BreakdownBeginning % As Of 07/01/2008 Ending % As Of 09/30/2008
Large U.S. EquitySmall/Mid U.S. EquityInternational EquityReal EstateFixed Income
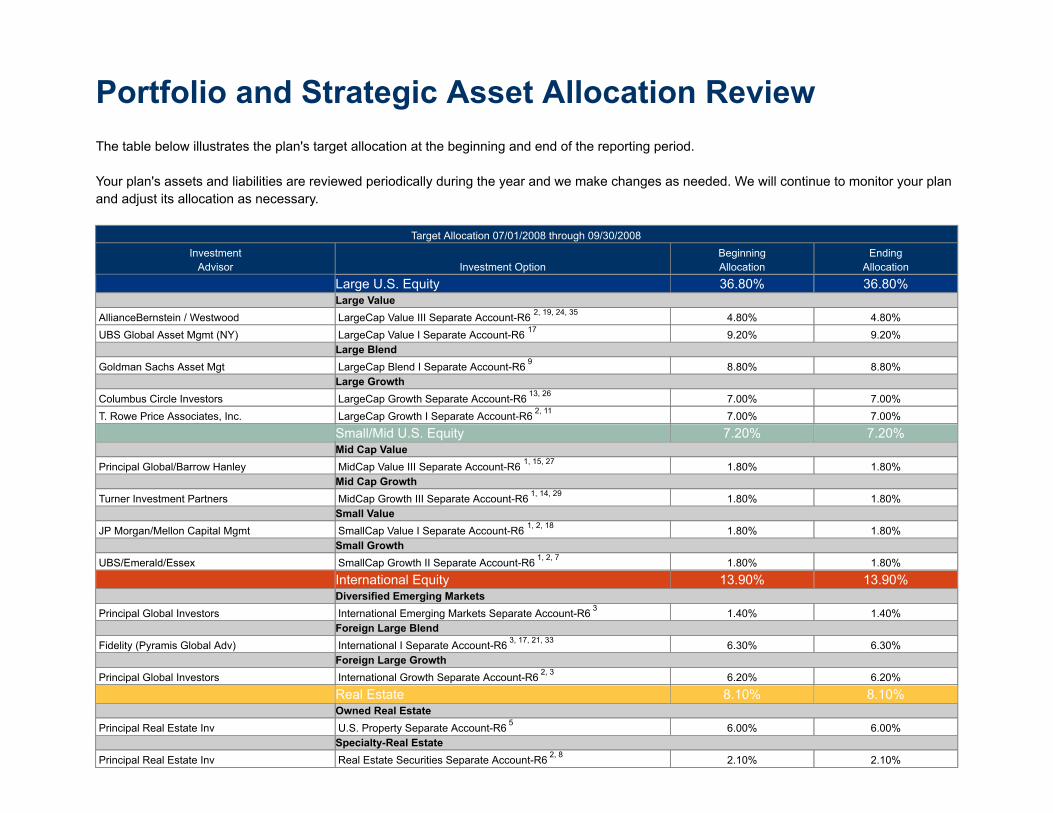
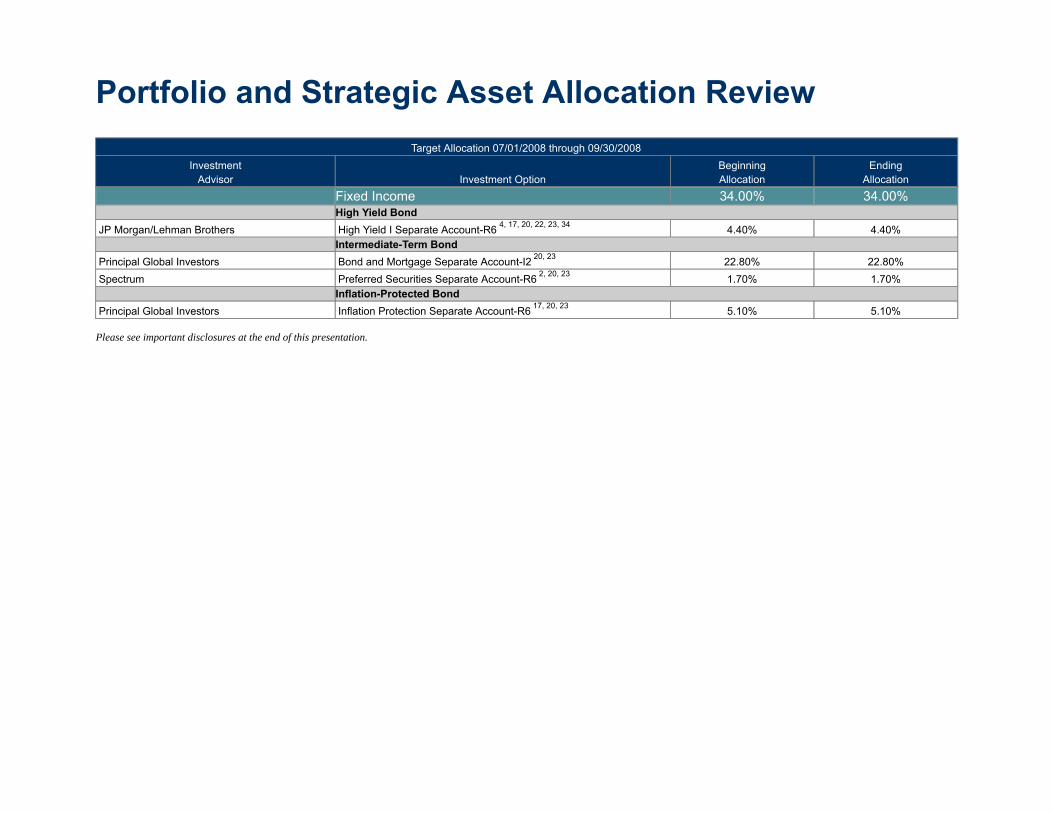
Portfolio and Strategic Asset Allocation ReviewThe table below illustrates the plan's target allocation at the beginning and end of the reporting period.
Your plan's assets and liabilities are reviewed periodically during the year and we make changes as needed. We will continue to monitor your planand adjust its allocation as necessary.
Target Allocation 07/01/2008 through 09/30/2008Investment
Advisor Investment OptionBeginningAllocation
EndingAllocation
Large U.S. Equity 36.80% 36.80%Large Value
AllianceBernstein / Westwood LargeCap Value III Separate Account-R6 2, 19, 24, 35 4.80% 4.80%UBS Global Asset Mgmt (NY) LargeCap Value I Separate Account-R6 17 9.20% 9.20%
Large BlendGoldman Sachs Asset Mgt LargeCap Blend I Separate Account-R6 9 8.80% 8.80%
Large GrowthColumbus Circle Investors LargeCap Growth Separate Account-R6 13, 26 7.00% 7.00%T. Rowe Price Associates, Inc. LargeCap Growth I Separate Account-R6 2, 11 7.00% 7.00%
Small/Mid U.S. Equity 7.20% 7.20%Mid Cap Value
Principal Global/Barrow Hanley MidCap Value III Separate Account-R6 1, 15, 27 1.80% 1.80%Mid Cap Growth
Turner Investment Partners MidCap Growth III Separate Account-R6 1, 14, 29 1.80% 1.80%Small Value
JP Morgan/Mellon Capital Mgmt SmallCap Value I Separate Account-R6 1, 2, 18 1.80% 1.80%Small Growth
UBS/Emerald/Essex SmallCap Growth II Separate Account-R6 1, 2, 7 1.80% 1.80%International Equity 13.90% 13.90%Diversified Emerging Markets
Principal Global Investors International Emerging Markets Separate Account-R6 3 1.40% 1.40%Foreign Large Blend
Fidelity (Pyramis Global Adv) International I Separate Account-R6 3, 17, 21, 33 6.30% 6.30%Foreign Large Growth
Principal Global Investors International Growth Separate Account-R6 2, 3 6.20% 6.20%Real Estate 8.10% 8.10%Owned Real Estate
Principal Real Estate Inv U.S. Property Separate Account-R6 5 6.00% 6.00%Specialty-Real Estate
Principal Real Estate Inv Real Estate Securities Separate Account-R6 2, 8 2.10% 2.10%
Fixed Income 34.00% 34.00%High Yield Bond
JP Morgan/Lehman Brothers High Yield I Separate Account-R6 4, 17, 20, 22, 23, 34 4.40% 4.40%Intermediate-Term Bond
Principal Global Investors Bond and Mortgage Separate Account-I2 20, 23 22.80% 22.80%Spectrum Preferred Securities Separate Account-R6 2, 20, 23 1.70% 1.70%
Inflation-Protected BondPrincipal Global Investors Inflation Protection Separate Account-R6 17, 20, 23 5.10% 5.10%
Please see important disclosures at the end of this presentation.
Portfolio and Strategic Asset Allocation ReviewTarget Allocation 07/01/2008 through 09/30/2008
InvestmentAdvisor Investment Option
BeginningAllocation
EndingAllocation
Portfolio and Strategic Asset Allocation ReviewPlease note that a slight variance between your plan's target allocation displayed in this report and its weightings is normal. This variance is due tochanges in your account values caused by fluctuations in the market. We periodically initiate rebalancing transfers to bring the plan's assets backto its target allocation.
Beginning Target Allocation As Of July 01, 2008 Ending Target Allocation As Of September 30, 2008
Large U.S. EquitySmall/Mid U.S. EquityInternational EquityReal EstateFixed Income
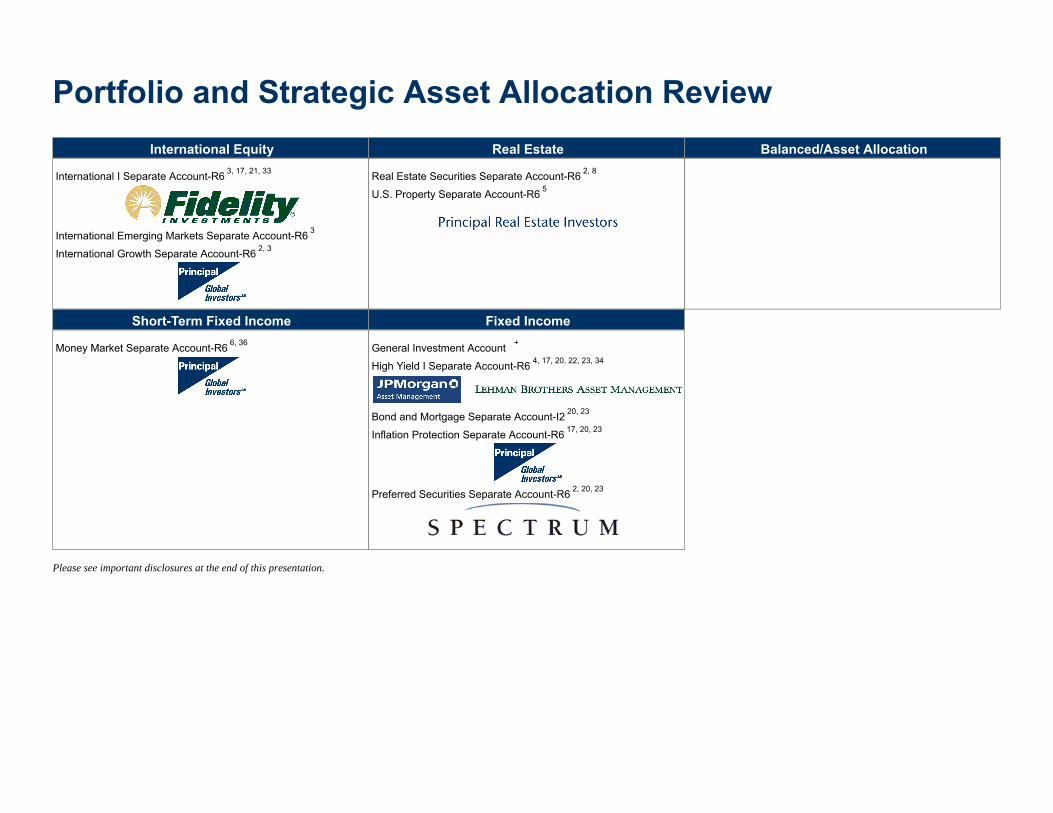
Portfolio and Strategic Asset Allocation ReviewThis section of your report includes all investment options with plan assets as of the end of the reporting period.
Large U.S. EquityLarge Value Large Blend Large Growth
LargeCap Value III Separate Account-R6 2, 19, 24, 35
LargeCap Value I Separate Account-R6 17
LargeCap Blend I Separate Account-R6 9 LargeCap Growth Separate Account-R6 13, 26
LargeCap Growth I Separate Account-R6 2, 11
Small/Mid U.S. EquityMid Cap Value Mid Cap Blend Mid Cap Growth
MidCap Value III Separate Account-R6 1, 15, 27 MidCap Growth III Separate Account-R6 1, 14, 29
Small Value Small Blend Small Growth
SmallCap Value I Separate Account-R6 1, 2, 18 SmallCap Growth II Separate Account-R6 1, 2, 7
Portfolio and Strategic Asset Allocation ReviewInternational Equity Real Estate Balanced/Asset Allocation
International I Separate Account-R6 3, 17, 21, 33
International Emerging Markets Separate Account-R6 3
International Growth Separate Account-R6 2, 3
Real Estate Securities Separate Account-R6 2, 8
U.S. Property Separate Account-R6 5
Short-Term Fixed Income Fixed Income
Money Market Separate Account-R6 6, 36 General Investment Account +
High Yield I Separate Account-R6 4, 17, 20, 22, 23, 34
Bond and Mortgage Separate Account-I2 20, 23
Inflation Protection Separate Account-R6 17, 20, 23
Preferred Securities Separate Account-R6 2, 20, 23
Please see important disclosures at the end of this presentation.
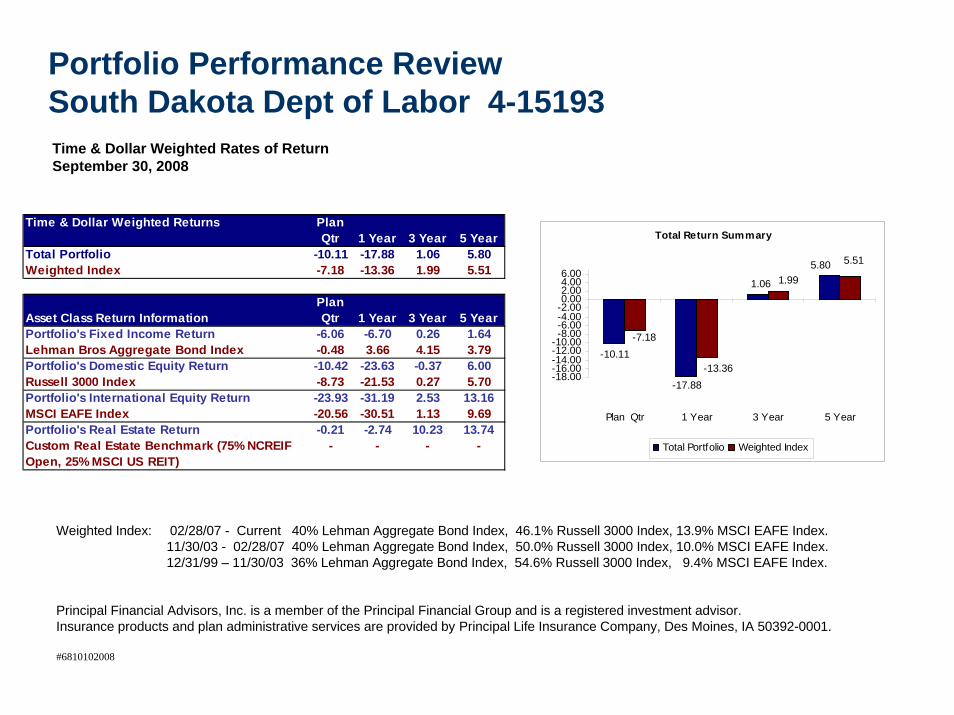
Portfolio Performance ReviewSouth Dakota Dept of Labor 4-15193Time & Dollar Weighted Rates of ReturnSeptember 30, 2008
Time & Dollar Weighted Returns
Total Portfolio -10.11 -17.88 1.06 5.80Weighted Index -7.18 -13.36 1.99 5.51
Asset Class Return Information 1 Year 3 Year 5 YearPortfolio's Fixed Income Return -6.06 -6.70 0.26 1.64Lehman Bros Aggregate Bond Index -0.48 3.66 4.15 3.79Portfolio's Domestic Equity Return -10.42 -23.63 -0.37 6.00Russell 3000 Index -8.73 -21.53 0.27 5.70Portfolio's International Equity Return -23.93 -31.19 2.53 13.16MSCI EAFE Index -20.56 -30.51 1.13 9.69Portfolio's Real Estate Return -0.21 -2.74 10.23 13.74Custom Real Estate Benchmark (75% NCREIF - - - -Open, 25% MSCI US REIT)
Plan Qtr
Plan Qtr 1 Year 3 Year 5 Year Total Return Summary
Weighted Index: 02/28/07 - Current 40% Lehman Aggregate Bond Index, 46.1% Russell 3000 Index, 13.9% MSCI EAFE Index.11/30/03 - 02/28/07 40% Lehman Aggregate Bond Index, 50.0% Russell 3000 Index, 10.0% MSCI EAFE Index.12/31/99 – 11/30/03 36% Lehman Aggregate Bond Index, 54.6% Russell 3000 Index, 9.4% MSCI EAFE Index.
Principal Financial Advisors, Inc. is a member of the Principal Financial Group and is a registered investment advisor.Insurance products and plan administrative services are provided by Principal Life Insurance Company, Des Moines, IA 50392-0001.
#6810102008
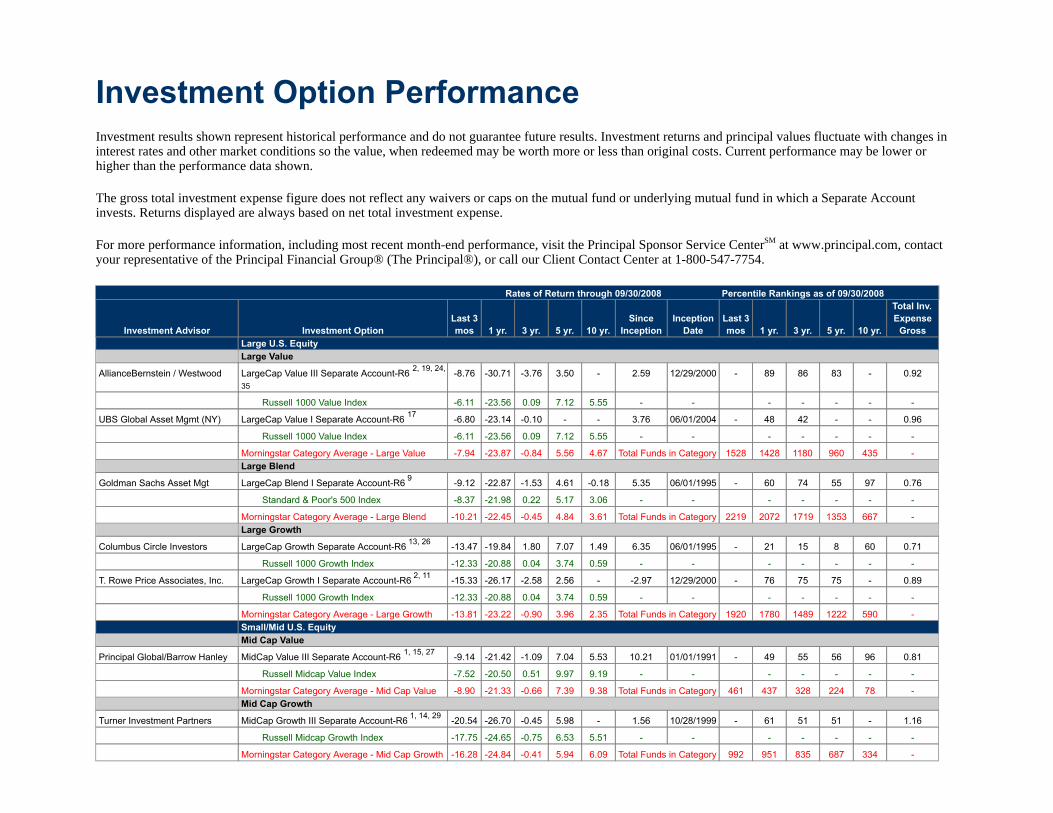
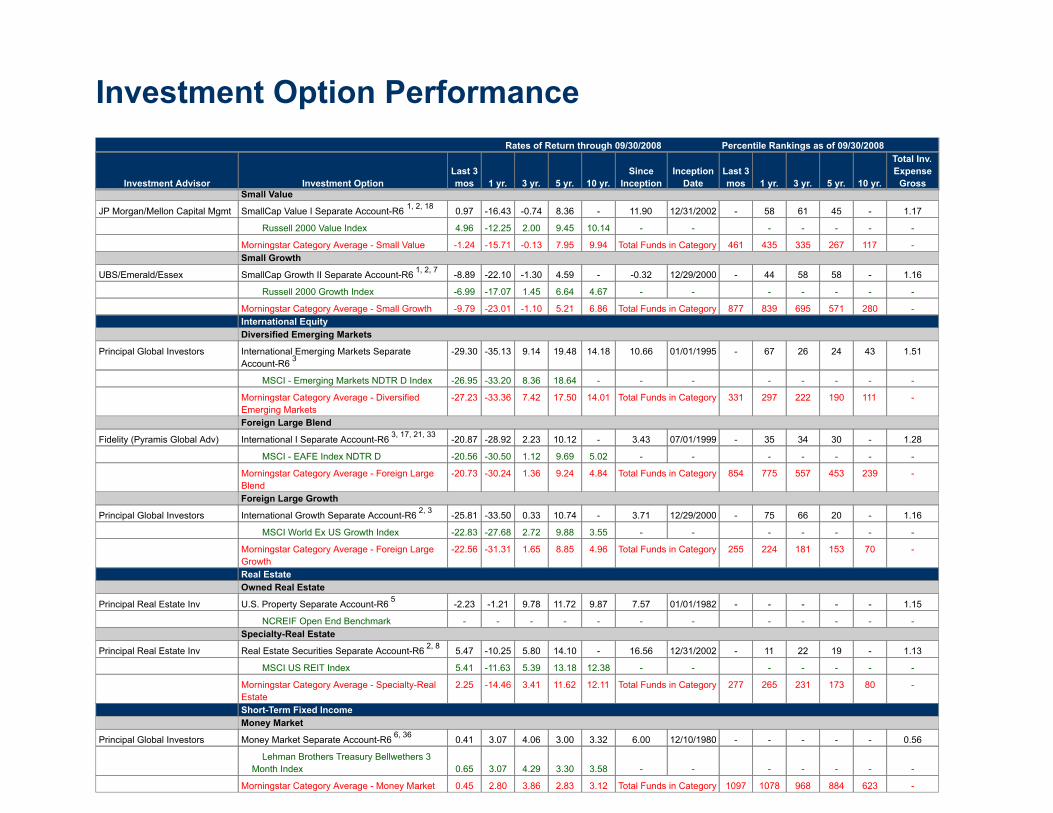
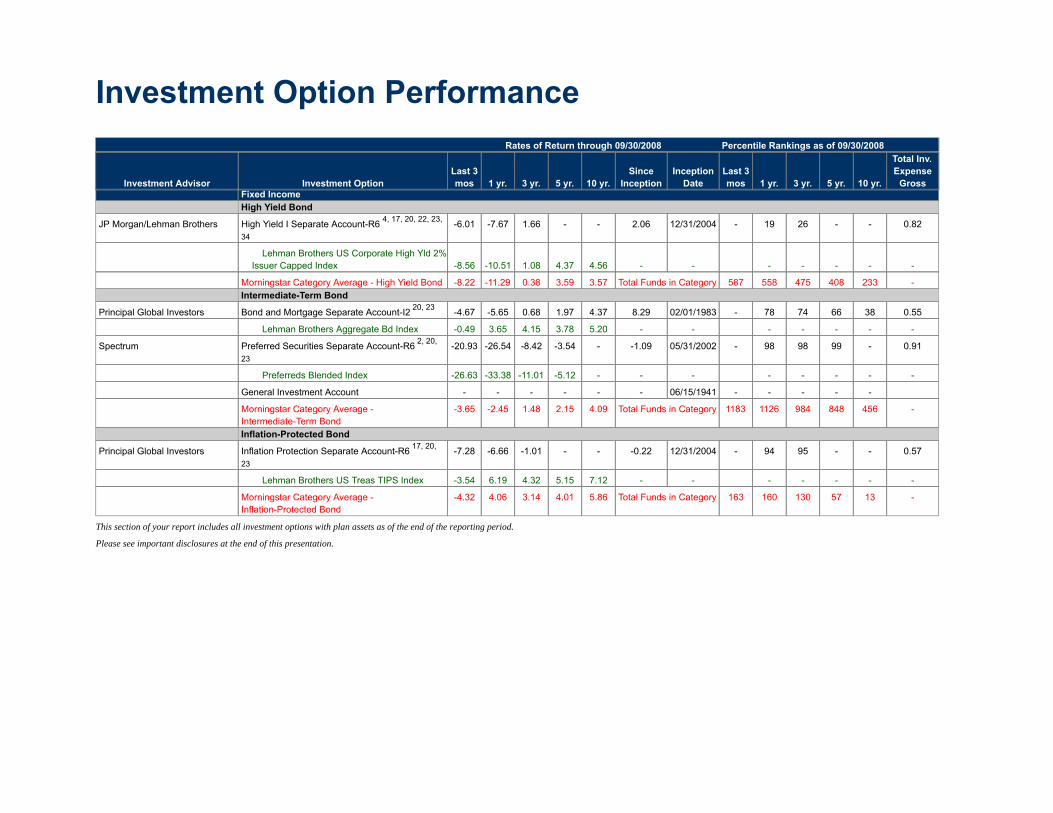
Investment Option PerformanceInvestment results shown represent historical performance and do not guarantee future results. Investment returns and principal values fluctuate with changes ininterest rates and other market conditions so the value, when redeemed may be worth more or less than original costs. Current performance may be lower orhigher than the performance data shown.
The gross total investment expense figure does not reflect any waivers or caps on the mutual fund or underlying mutual fund in which a Separate Accountinvests. Returns displayed are always based on net total investment expense.
For more performance information, including most recent month-end performance, visit the Principal Sponsor Service CenterSM at www.principal.com, contactyour representative of the Principal Financial Group® (The Principal®), or call our Client Contact Center at 1-800-547-7754.
Rates of Return through 09/30/2008 Percentile Rankings as of 09/30/2008
Russell 1000 Growth Index -12.33 -20.88 0.04 3.74 0.59 - - - - - - -
T. Rowe Price Associates, Inc. LargeCap Growth I Separate Account-R6 2, 11 -15.33 -26.17 -2.58 2.56 - -2.97 12/29/2000 - 76 75 75 - 0.89
Russell 1000 Growth Index -12.33 -20.88 0.04 3.74 0.59 - - - - - - -
Morningstar Category Average - Large Growth -13.81 -23.22 -0.90 3.96 2.35 Total Funds in Category 1920 1780 1489 1222 590 -Small/Mid U.S. EquityMid Cap Value
Principal Global/Barrow Hanley MidCap Value III Separate Account-R6 1, 15, 27 -9.14 -21.42 -1.09 7.04 5.53 10.21 01/01/1991 - 49 55 56 96 0.81
Russell Midcap Value Index -7.52 -20.50 0.51 9.97 9.19 - - - - - - -
Morningstar Category Average - Mid Cap Value -8.90 -21.33 -0.66 7.39 9.38 Total Funds in Category 461 437 328 224 78 -Mid Cap Growth
DisclosuresSeparate Accounts are available through a group annuity contract with the Principal Life Insurance Company. Insurance products and plan administrativeservices are provided by Principal Life Insurance Company a member of the Principal Financial Group, Des Moines, IA 50392. See the group annuity contractfor the full name of the Separate Account. Certain investment options may not be available in all states or U.S. commonwealths.
Investment Advisory Services are provided by Principal Financial Advisors, Inc., a registered investment advisor and wholly owned subsidiary of the PrincipalFinancial Group®.
+ This is not a foundation option. Guarantees are backed by all the assets in the Principal Life general account.
(C) 2008 Morningstar, Inc. All Rights Reserved. Part of the mutual fund data contained herein: (1) is proprietary to Morningstar and/or its content providers:(2) may not be copied or distributed; and (3) is not warranted to be accurate, complete, or timely. Neither Morningstar nor its content providers are responsiblefor any damages or losses arising from any use of this information.
1. Small-cap and mid-cap investment options are subject to more fluctuation in value and may have additional risks than other investment options with stocksof larger, more stable companies.
2. This Separate Account invests solely in the Institutional class shares of the Principal Funds. All voting rights associated with ownership of shares in themutual fund are the rights of the Separate Account, not of contract holders investing in the Separate Account. For further information on the underlying mutualfund, see the prospectus of the fund.
3. International and global investment options are subject to additional risk due to fluctuating exchange rates, foreign accounting and financial policies, andother economic and political environments.
4. High yield investment options are subject to greater credit risk associated with high yield bonds.
5. This investment option is subject to investment and liquidity risk and other risks inherent in real estate such as those associated with general and localeconomic conditions. Payment of principal and earnings may be delayed.
6. This investment option is not guaranteed by the Federal Deposit Insurance Corporation (FDIC), or any other government agency. Although this investmentoption seeks to preserve the value of an investment, it is possible to lose money by investing in this portfolio.
7. Effective May 1, 2002, this portfolio was sub-advised solely by UBS Global Asset Management. Effective September 1, 2004, Emerald Advisers was added asan additional sub-advisor. Effective June 30, 2006, Essex was added as an additional sub-advisor. Performance results displayed reflect all sub-advisorsmanaging this portfolio during the time periods displayed.
8. Real estate investment options are subject to some risks inherent in real estate and Real Estate Investment Trusts, such as risks associated with general andlocal economic conditions.
9. Effective November 13, 2006, this portfolio is sub-advised by Goldman Sachs Asset Management. From November 18, 2002, to November 16, 2006, theportfolio was sub-advised by Goldman Sachs Asset Management and Wellington Management Company, LLP. The portfolio has had various sub-advisorssince its inception. Performance results displayed reflect all sub-advisors managing this portfolio during the time periods displayed.
11. Effective August 24, 2004, this portfolio is sub-advised by T. Rowe Price Associates, Inc. Prior to August 24, 2004, the portfolio was sub-advised byMorgan Stanley Investment Management Inc.
13. Effective January 5, 2005, this portfolio is sub-advised by Columbus Circle Investors. Prior to January 5, 2005, the portfolio was sub-advised by PrincipalGlobal Investors.
14. This Separate Account invests solely in the Institutional class shares of the Principal Funds. All voting rights associated with ownership of shares in themutual fund are the rights of the Separate Account, not of contract holder investing in the Separate Account. For further information on the underlying mutualfund see the prospectus of the fund.
15. Effective July 12, 2005, Barrow Hanley was added as an additional sub-advisor. Performance results displayed reflect all sub-advisors managing thisportfolio during the time periods displayed.
17. This Separate Account invests solely in the Institutional class shares of the Principal Funds. All voting rights associated with ownership of shares in themutual fund are the rights of the Separate Account, not of contract holders investing in the Separate Account. For further information on the underlying mutualfund, see the prospectus of the fund.
18. Effective August 8, 2005, Mellon Capital Management was added as an additional sub-advisor. Performance results displayed reflect all sub-advisorsmanaging this portfolio during the time periods displayed.
19. From March 1, 2006 to December 31, 2007, Bank of New York served as a sub-advisor for managing the cash portion of this investment option.
20. Fixed-income investment options are subject to interest rate risk, and their value will decline as interest rates rise. Neither the principal of bond investmentoptions nor their yields are guaranteed by the U.S. government.
21. Effective March 31, 2007, references to Fidelity Management & Research as investment advisor were replaced with Fidelity (Pyramis Global Adv). This is aname change only and does not affect the management, objective, or strategy of this investment option.
22. Effective January 2, 2008, this portfolio is co-sub-advised by JP Morgan and Lehman Brothers. Prior to January 2, 2008 Post Advisory Group was a thirdsub-advisor for this portfolio. Performance results displayed reflect all sub-advisors managing this portfolio during the time periods displayed.
23. Fixed-income and asset allocation investment options that invest in mortgage securities are subject to increased risk due to real estate exposure.
24. Formerly known as Large-Cap Value Separate Account.
26. Formerly known as Large Company Growth Separate Account.
27. Formerly known as Medium Company Value Separate Account.
29. Formerly known as Mid-Cap Growth Separate Account.
33. Formerly known as International Separate Account.
34. Formerly known as High Yield Separate Account.
35. Effective July 15, 2008, Westwood Management Corp. was added as an additional sub-advisor. Performance results displayed reflect all sub-advisorsmanaging this portfolio during the time periods displayed.
36. Principal Life is voluntarily waiving a portion of its fees collected from the Money Market Separate Account through December 31, 2008. This waiver isequal to .10% annually.
Benchmark Descriptions
Blended Real Estate Index is composed of 75% NCREIF Open End Index and 25% MSCI US REIT Index. The NCREIF Open-end Benchmark is the open-endfund component of the NCREIF Property Index that consists of U.S. commercial real estate properties that have been acquired, at least in part, on behalf oftax-exempt institutions and are held in a fiduciary environment. The universe of properties includes wholly owned and joint venture investments, operatingproperties only (no development projects) and investment grade (no-agricultural) income-producing properties in the Multi-family, Industrial, Office andRetail sectors. The MSCI US REIT Index is a capitalization-weighted benchmark index of most actively traded Real Estate Investment Trusts (REITs), designedto measure real estate performance.
Lehman Brothers Aggregate Bd Index represents securities that are domestic, taxable, and dollar denominated. The index covers the U. S. investment grade fixedrate bond market, with index components for government and corporate securities, mortgage pass-through securities, and asset-backed securities. These majorsectors are subdivided into more specific indices that are calculated and reported on a regular basis.
Lehman Brothers Treasury Bellwethers 3 Month Index is composed of public obligations of the U. S. Treasury with a maturity of three months.
Lehman Brothers US Corporate High Yld 2% Issuer Capped Index is an unmanaged index comprised of fixed rate, non-investment grade debt securities that aredollar denominated. The index limits the maximum exposure to any one issuer to 2%.
Lehman Brothers US Treas TIPS Index consists of inflation-protected securities issued by the U.S. Treasury.
MSCI - EAFE Index NDTR D is listed for foreign stock funds (EAFE refers to Europe, Australia, and Far East). Widely accepted as a benchmark forinternational stock performance, the EAFE Index is an aggregate of 21 individual country indexes.
MSCI - Emerging Markets NDTR D Index measures equity market performance in the global emerging markets. It consists of 26 emerging market countries inEurope, Latin America and the Pacific Basin.
MSCI US REIT Index is a capitalization-weighted benchmark index of most actively traded Real Estate Investment Trusts (REITs), designed to measure realestate performance.
NCREIF Open End Benchmark is the open-end fund component of the NCREIF Property Index that consists of U.S. commercial real estate properties that havebeen acquired, at least in part, on behalf of tax-exempt institutions and are held in a fiduciary environment. The universe of properties includes wholly ownedand joint venture investments, operating properties only (no development projects) and investment grade (no-agricultural) income-producing properties in theMulti-family, Industrial, Office and Retail sectors.
Preferreds Blended Index is composed of 65% Merrill Lynch Fixed Rate Preferred Securities Index and 35% Lehman Brothers U.S. Tier I Capital SecuritiesIndex.
Russell 1000 Growth Index is a market-capitalization weighted index of those firms in the Russell 1000 with higher price-to-book ratios and higher forecastedgrowth values.
Russell 1000 Value Index is a market-capitalization weighted index of those firms in the Russell 1000 with lower price-to-book ratios and lower forecastedgrowth values.
Russell 2000 Growth Index is a market-weighted total return index that measures the performance of companies within the Russell 2000 Index having higherprice-to-book ratio and higher forecasted growth values.
Russell 2000 Value Index is a market-weighted total return index that measures the performance of companies within the Russell 2000 Index having lowerprice-to-book ratios and lower forecasted growth values.
Russell Midcap Growth Index is a market-weighted total return index that measures the performance of companies within the Russell Midcap Index havinghigher price-to-book ratios and higher forecasted growth values.
Russell Midcap Value Index is a market-weighted total return index that measures the performance of companies within the Russell Midcap index having lowerprice-to-book ratios and lower forecasted growth values.
Standard & Poor's 500 Index is a market capitalization-weighted index of 500 widely held stocks often used as a proxy for the stock market.
The MSCI World Ex US Growth Index measures global developed market equity performance of growth securities outside of the United States. It is comprised ofhalf the securities in the MSCI World Ex US Index, with half of the market capitalization of each country index in the Growth Index (the other half is in the ValueIndex).