+ All Categories
Home > Documents > PRINCIPLES AND PROSPECTS FOR BIOREMEDIATION … · PRINCIPLES AND PROSPECTS FOR BIOREMEDIATION OF...

PRINCIPLES AND PROSPECTS FOR BIOREMEDIATION … · PRINCIPLES AND PROSPECTS FOR BIOREMEDIATION OF...

Date post: 21-Aug-2018
Category:
Upload: hakhanh
View: 218 times
Download: 0 times
Share this document with a friend
47
1 PRINCIPLES AND PROSPECTS FOR BIOREMEDIATION OF PCBs IN SOILS AND SEDIMENTS James M. TIEDJE Distinguished Professor and Director Center For Microbial Ecology Michigan State University [email protected] 1
Transcript

1

PRINCIPLES AND PROSPECTS FOR BIOREMEDIATION OF PCBs IN SOILS AND

SEDIMENTS

James M. TIEDJEDistinguished Professor and

DirectorCenter For Microbial EcologyMichigan State University

[email protected]

1

2

Current Biological Principles For Bioremediation Of PCBs

• Highly chlorinated PCBs (Aroclors) can be reduced to a lesser chlorinatedspecies by anaerobic dehalogenating communities

• The lesser chlorinated PCB species can be oxidized by aerobic biphenyl degraders yielding chlorinated benzoates, pentadienes and HOPDAs

• Chlorobenzoates can be mineralized by yet another group of bacteria

• These three independently occurring processes can be combined in a singular two-phase anaerobic-aerobic remediation scheme

2

3

Rationale for anaerobic/aerobic biotreatment

Cl -

Cl

Cl

Cl

Cl

Cl

Cl

Cl

Cl

Cl

Cl

Cl

Cl

Cl

Cl

Cl

Cl

Cl

ClCl

Cl

Cl

Cl

Cl

Cl

Cl

Cl

ClCl

Cl

Cl

Cl -

Cl

Cl

Cl

ortho

meta

para

Less aerobically degradable More aerobically degradable

3

Some componentsof Aroclor 1242

(commercial PCB mixture)

Intermediatedechlorination products

Advanceddechlorination products

4

Chromatographic Profiles - Pattern

Peak Number0 10 20 30 40 50

0

10

20

30

40

0

5

10

15

Mol

e Pe

rcen

t

0

5

10

15

20

Aroclor 1242

Patten M

Pattern C

4

5

Congener SpecificityDechlorination Activity Susceptible Chlorines

M Flanked & unflanked meta

Q Flanked & unflanked para

H Flanked paraDoubly flanked meta

H� Flanked paraMeta of 2,3- & 2,3,4- groups

P Flanked para

N Flanked meta

T Meta of hepta- & octa-CBs

LP Unflanked para

5

6

Evaluation of in situ PCB Dechlorination

1221

1242

1248

1254

1260

Average Number of ortho Chlorines0 1 2 3

Ave

rage

Num

ber o

f met

a pl

us p

ara

Chl

orin

es

0

1

2

3

4

5Aroclors

Hudson RiverRiver RaisinSaginaw RiverSheboygan River

Aroclor Mixtures

6

7

Occurrence of PCB Dechlorination

� Acushnet Estuary (MA)� Hudson River� Industrial lagoons� River Raisin (MI)� Sheboygan River (WI)� Silver Lake (MA)

� Escambia Bay (FL)� Hoosic River (MA)� Lake Ketelmeer/Rhine

River (Netherlands)� Waukegan Harbor (IL)� Wood's Pond (MA)

7

Observed extent of dechlorination tends to taper off below 50 to 100 ppm.

8

FeSO4 AmendmentExtent of Dechlorination

Incubation Time (Weeks)0 5 10 15 20 25 30 35

met

a +

para

Chl

orin

es /

Bip

heny

l

0.00.20.40.60.81.01.21.41.61.82.0

ControlUnamaended FeSO4

8

9

Effect of FeSO4 on Aroclor 1242 Dechlorinationby Hudson River Microorganisms

0 10 20 30 40 50

Mol

e Pe

rcen

t

0

5

10

0 10 20 30 40 50

Mol

e Pe

rcen

t

0

5

10

15

20

Peak Number0 10 20 30 40 50

Mol

e Pe

rcen

t

0

10

20

30

AutoclavedControl

10 mM FeSO4

No Amendment

No amendment:Process M (meta) dechlorination25% of Cl removedOrtho & para substituted products:

2-CB, 2,2�-CB, 26-CB, 2,4�-CB,2,2�,4-CB, 2,4,4�-CB

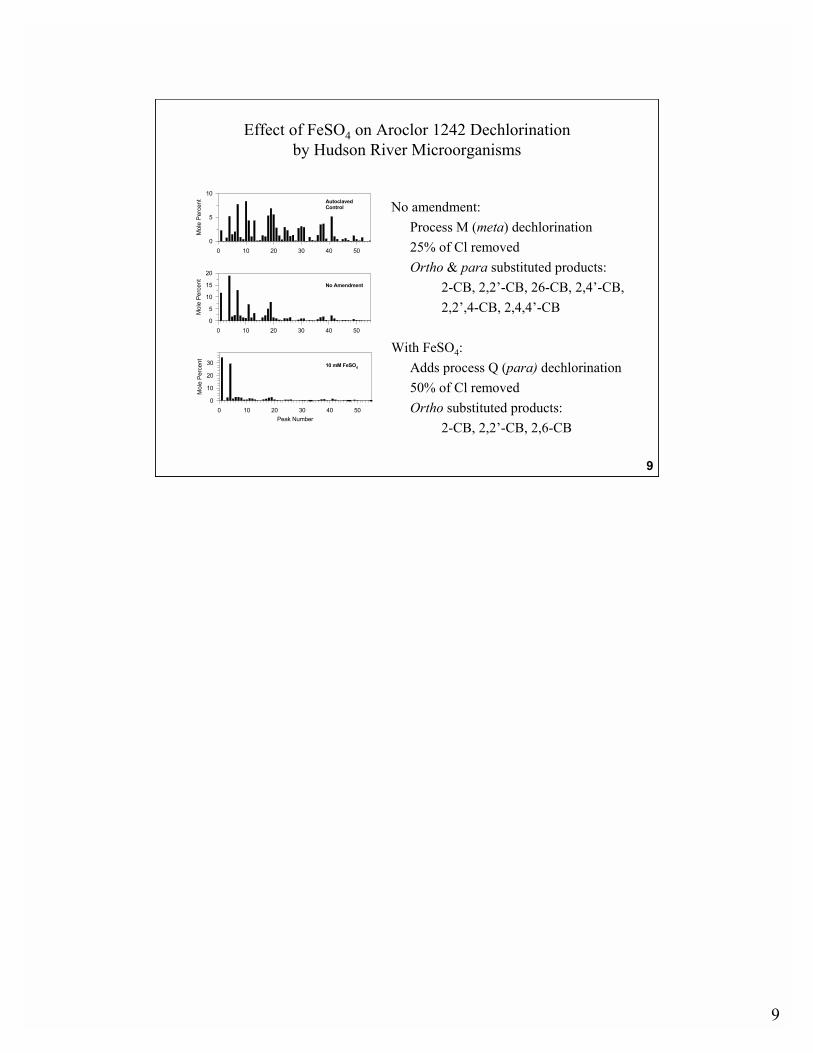
With FeSO4:Adds process Q (para) dechlorination50% of Cl removedOrtho substituted products:

2-CB, 2,2�-CB, 2,6-CB

9

10

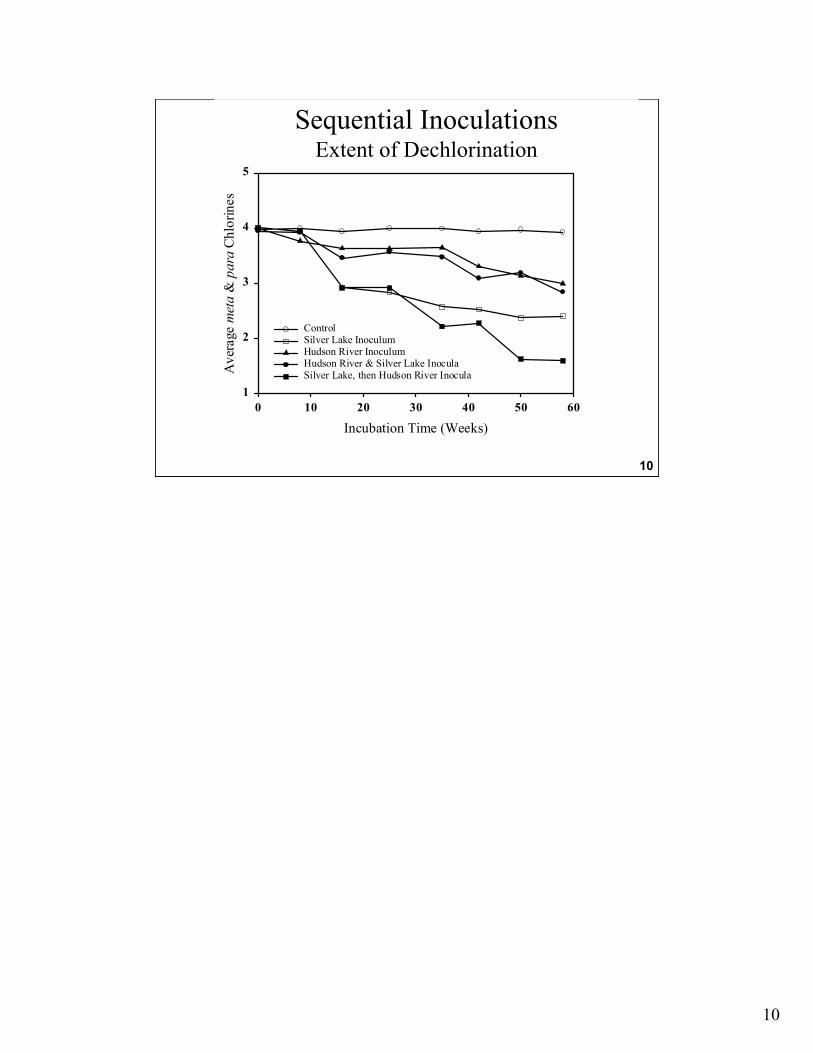
Sequential InoculationsExtent of Dechlorination

10

Incubation Time (Weeks)0 10 20 30 40 50 60

Ave

rage

met

a &

par

a Ch

lorin

es

1

2

3

4

5

ControlSilver Lake InoculumHudson River InoculumHudson River & Silver Lake InoculaSilver Lake, then Hudson River Inocula

11

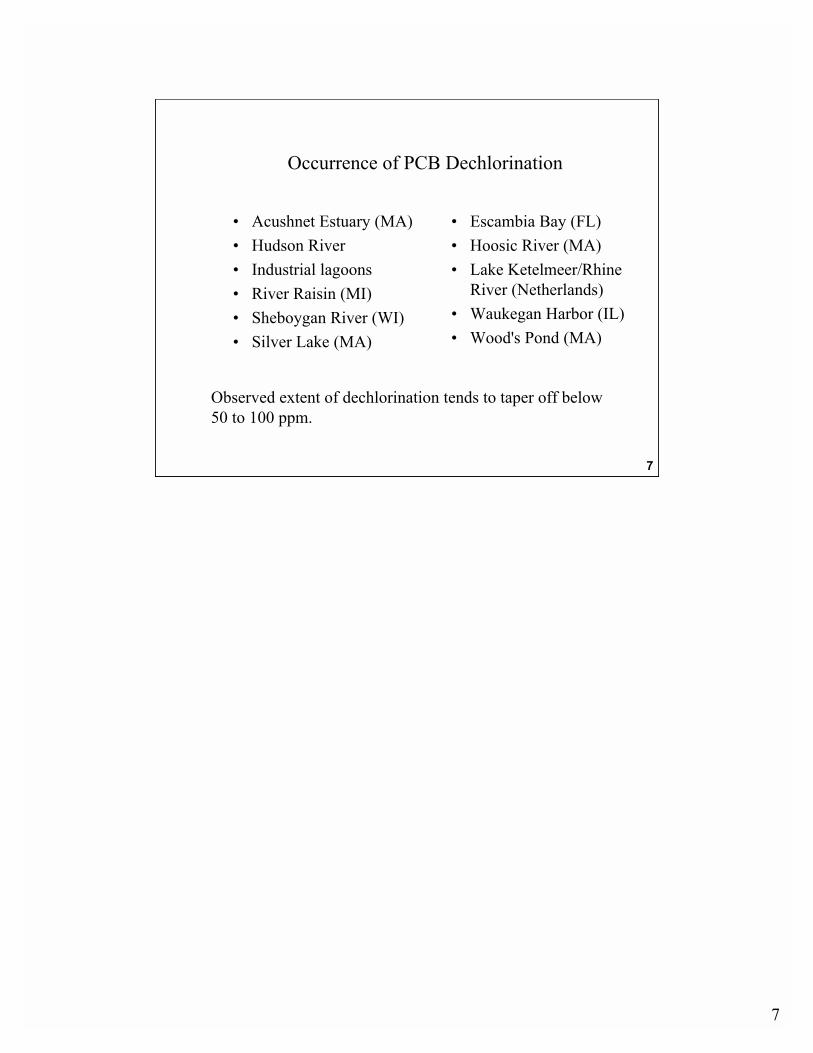
Importance of PCB Dechlorination

� Is an intrinsic process� Has potential for bioremediation� Products are more aerobically degradable� Products are generally less toxic� But, degradation is usually incomplete with

especially ortho-PCBs remaining, hence, an aerobic phase is needed

11

12

Barriers to Aerobic Biodegradation

� Limited to lesser chlorinated congeners� Co-metabolic

� Requires induction� Yields no growth

� Incomplete - accumulates potentially problematic compounds

12

13

Recombinant PCB degradation Pathways

13

14

COOH

OHCOOH

Cl

OH

OH

ClbphABCD

+5-C aliphatichydrocarbons

Central pathways

rod/cat+fcb genes

ohb genes

rodB catA fcbB24dCBA 4CBA 4HBA 24dCBA 4CBA 4HBA 24dCBA 4CBA 4HBA

RTRT RT RT RT RT RT RTRT+ + + + + + + + +- - - - - - - - -

100 bp

200 bp300 bp400 bp500 bp600 bp

1.5 Kb2.0 Kb

Differential expression of dehalogenases in response to CBAs.Reverse transcription (RT)-PCR of total RNA from Nocardioides sp. KZ4N.

♦ Halohydroxyperoxidase/catalase (catA) to use for upgrading pathway for ortho + para-PCBs

♦ The catA is related to (bromo)hydroxyperoxidases for anoxicchlorination/dechlorination ofchloramphenicol

♦ The laboratory evolution to target enzyme(s) forreductive dechlorination ofboth CBAs and PCBs

♦ The catA family members touse for the combinatorial mutagenesis

14

15

� ExEx--Situ Situ BioReactorBioReactor--low, medium, high low, medium, high --density solidsdensity solids

PCB Remediation ToolboxPCB Remediation Toolbox

Aerobic PCB Dechlorination And Growth

GenesOrganisms- ohb, fcb, rod, clc

- G+/- Cassette

- Mixed culture

Surfactants- Toxicity/Growth Inocula Technology

- Carrier Media

Anaerobic Reductive Dechlorination

FeSO4

SurfactantsSeed Inoculum

- Burkholderia sp. LB400(ohb) (G-)

- Rates/Conc.

- Sorption/Availability

-Rhodococcus erythropolis RHA1(fcb) (G+)

15

16

Schematic Representation of the Sediment Experiment

Whole cell PCR for isolated colonies (fcb and ohb primers)

Serial dilution

Luria-Bertani Medium with Rifampicin 50 µg/mlPCB extraction and analysis

1 g of soil1 g of soil

106 cells/g 104 cells/g Non-inoculated Non-contaminated

0.25 g of soil

DNA extraction

Real Time PCR

16

17

Molecular Tracking of RHA 1 (fcbB) inPicatinny Arsenal Soil Using Real Time PCR

R2 = 0.9964

R2 = 0.9816

R2 = 0.9984

0

5

10

15

20

25

30

35

40

-4 1 6 11 16 21 26 31

ln CFUS or Copy Number

Ct

RHA 1 in Soil (CFUs)

Plasmid pRHD34 (copy #)

RHA1 Whole Cell DNA (copy #)

17

18

Population dynamics of RHA1(fcb) and LB400(ohb) during aerobic treatment of Aroclor 1242 anaerobic dechlorination products

(Red Cedar River sediment)

0 5 10 15 20 25 30 35104

105

106

107

108

0 5 10 15 20 25 30 35104

105

106

107

108

Time (days)

0 5 10 15 20 25 30 35CFU

s/g

of s

edim

ent (

coun

ted

or c

alcu

late

d)

104

105

106

107

108

0 5 10 15 20 25 30 35104

105

106

107

108

RHA1(fcb) plate counts

TaqMan-16S rDNA probeTaqMan-fcb probe

LB400(ohb) plate counts

106 cells/g of sediment 104 cells/g of sediment

Non-contaminated Non-inoculated

18

19

Aroclor 124270 µg/g

0 10 20 30 40 50 60

µg per g sediment

0

5

10

15

Dechlorinated 124260 µg/g

0 10 20 30 40 50 60

µg per g sediment

0

5

10

15

Dechlorinated &Aerobically Degraded16 µg/g

Peak Number0 10 20 30 40 50 60

µg per g sediment

0

5

10

15

Anaerobic/Aerobic Degradation of Aroclor 1242

Laboratory scale two-phase PCB remediation(Red Cedar River sediment)

• Enhanced anaerobic dechlorination of Aroclor resulted in shifting from highly to lower chlorinated congeners

• Bioaugmentation with engineered aerobic G+/G- GEM cassette LB400(ohb)+RHA1(fcb) resulted in efficient degradation of the remaining PCBs

19

20

Effect of the ohb (pRO41) and fcb(pRHD34) genes on PCB degradation

Mix M, nom. 1mM Mix C, nom. 1 mM

% PCBdegraded

OD600

Cl -

Release,mM

HOPDAλ=394

Cl-Release,

mM

LB400(pRT1)Bph 83.8 0.19 1.33 0.476 93.7 0.21 0.91 0.066

LB400(pRO41)25CBA 75 0.24 1.98 0.164 93.2 0.35 1.47

Notdetected

LB400(pRO41)25CBA

+ RHA1(pRHD34)4CBA

67.6 0.19 1.5 0.139 91.3 0.30 1.42 0.069

PCB-growing Dechlorinating GEM Advantages

♦ Increased biomasssmaller inoculum

♦ Reduced HOPDAdiminished toxicity

♦ Issues remaining: Still incomplete mineralization of higherchlorinated PCB species

lower degradation rates, incomplete Cl-HOPDA removal

Strain(plasmid)/inducer % PCB

degradedOD

600HOPDA

=394λ

20

21

Biological ActivityDechlorination of Congeners with AhR-Mediated Activity

Aroclor 1242

117

110 81 77 123

118

114

105

126

157

156/

167

167/

156

169

189

Con

cent

ratio

n (n

mol

/ml)

0.001

0.01

0.1

1

10

100AutoclavedSL LiveRR Live

***

21

22

AhR Mediated Toxicity Reduction

Sample TEQassay* TEQcalc*

Non-dechlorinated 1242 3.1 5.7

SL dechlorinated 1242 <6 X 10⁻²** 7.8 X 10⁻²

RR dechlorinated 1242 <6 X 10⁻²** 4.7 X 10⁻²

*Units are pmole TEQ/Σ µmoles of PCBs.**TEQassay was less than the MDL.

22

23

Biological Activity Summary

Biological ActivityAnaerobicDechlorination

AerobicDi-OHs

AhR mediated Reduced/eliminated Inactive

AP-transcription Reduced/eliminated Inactive

Fertilization Reduced/eliminated ----------

Neutrophil activation Unaffected Inactive

Insulin release Reduced/eliminated Decreased

Estrogenicity ----------- Inactive

Uterine contractility Increased ----------Uterin c ontractility

23

24

24

Genome of Burkholderia Strain LB400

� Best known PCB degrader sequenced� 9.5 Megabases, largest bacterial genome yet

sequenced� Has multiple chromosomes� Has many aromatic degradation genes

25

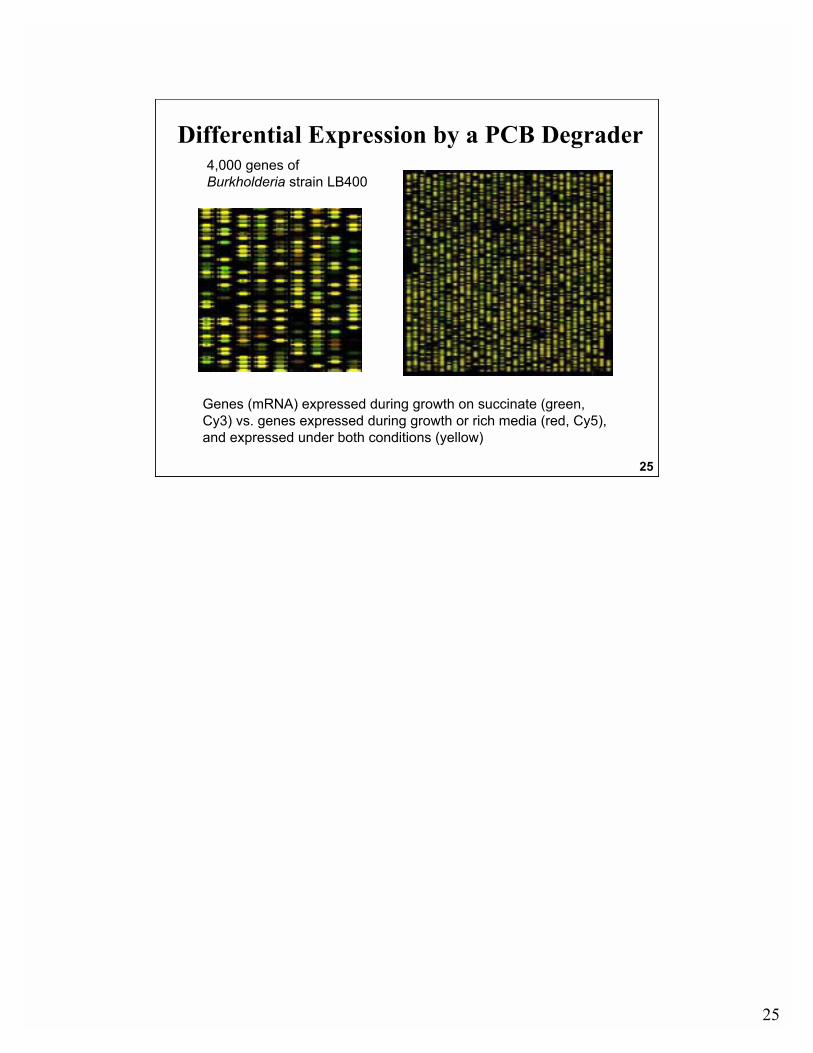
Differential Expression by a PCB Degrader

Genes (mRNA) expressed during growth on succinate (green, Cy3) vs. genes expressed during growth or rich media (red, Cy5),and expressed under both conditions (yellow)

4,000 genes of Burkholderia strain LB400

25

26

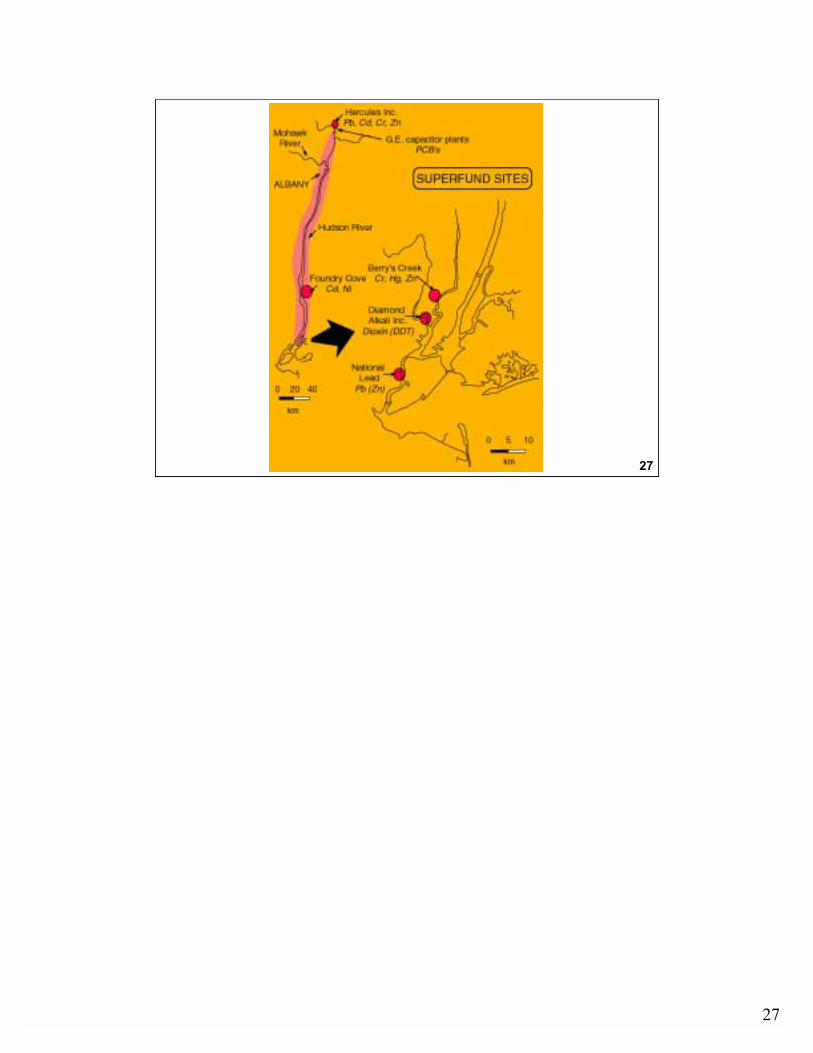
Hudson River PCBs: Lessons from Dated Sediment Cores

Richard Bopp and Edward Shuster, Rensselaer Polytechnic Institute

Steven Chillrud, Lamont Doherty Earth Observatory of Columbia University

Frank Estabrooks, New York State Department of Environmental Conservation

NIEHS Superfund Basic Research Program

Grant to Mount Sinai Medical Center

Philip J. Landrigan, P.I.

OCTOBER 2002 26

27

27

28

28

29

29

30

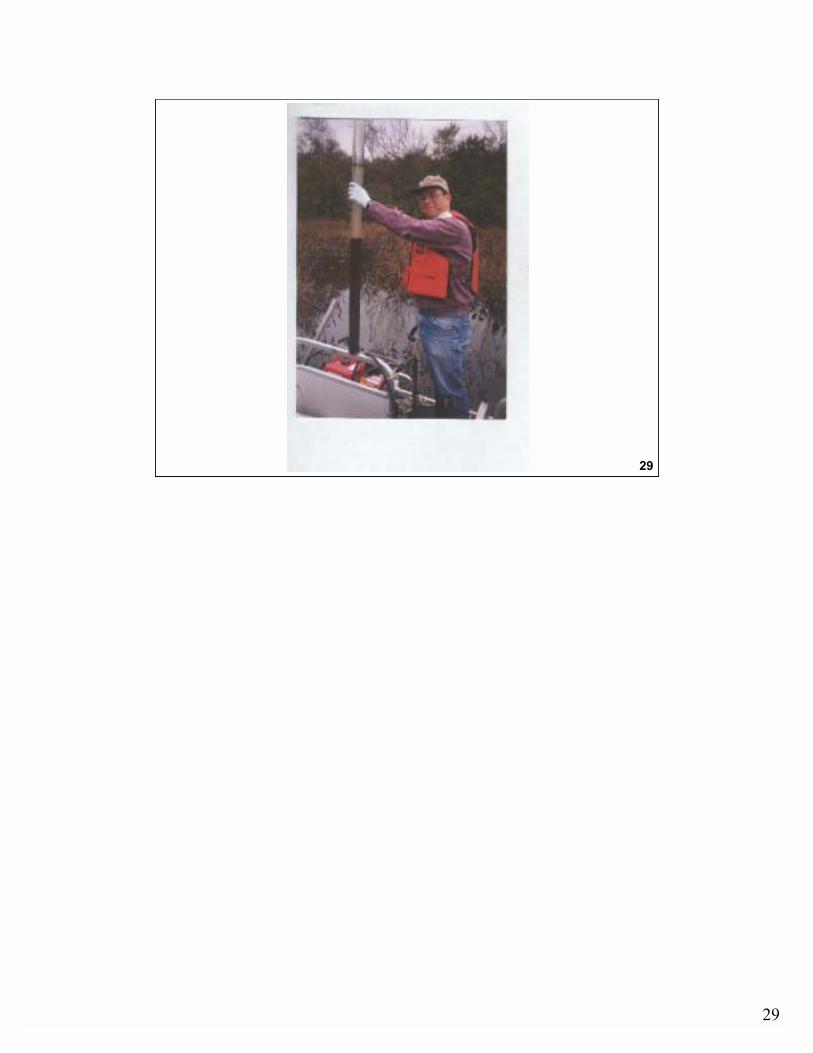
Basics of Our Radionuclide Dating of Sediment Cores

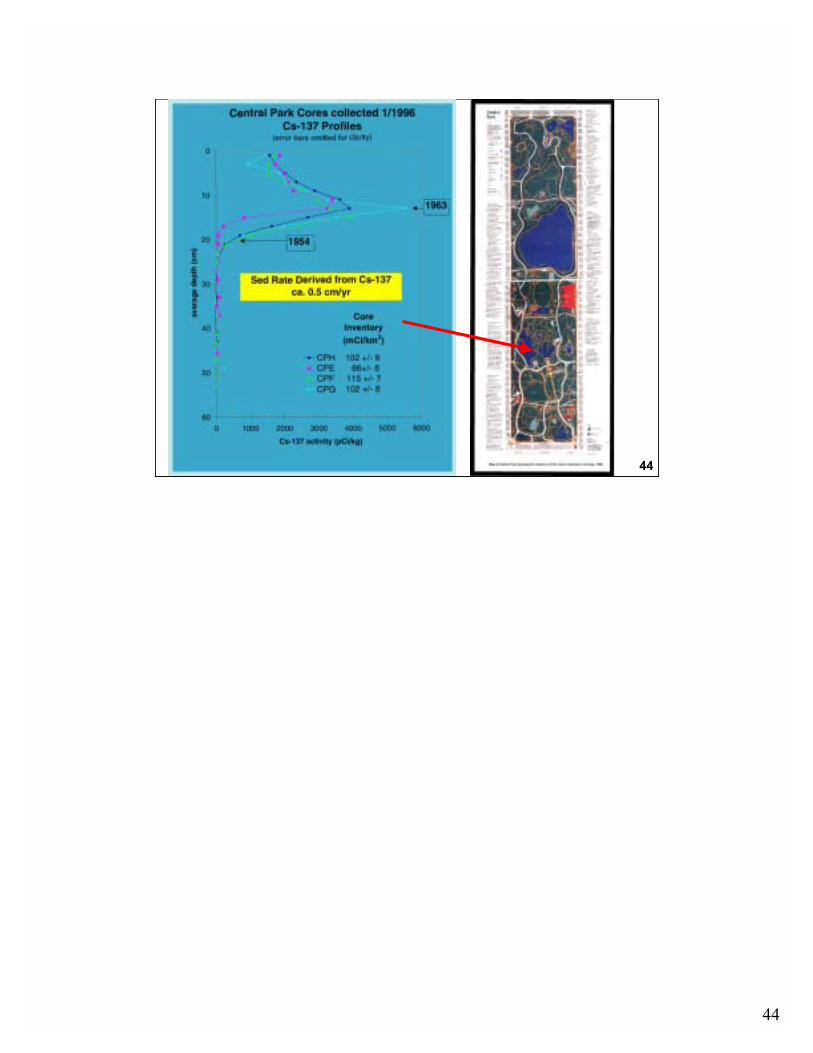
�Cs-137 - supplied by global fallout from atmospheric testing of nuclear weapons. In �ideal� sediment cores the Cs-137 profile provides at least two time horizons - a �first appearance� in about 1954 and a maximum activity in 1963-64.

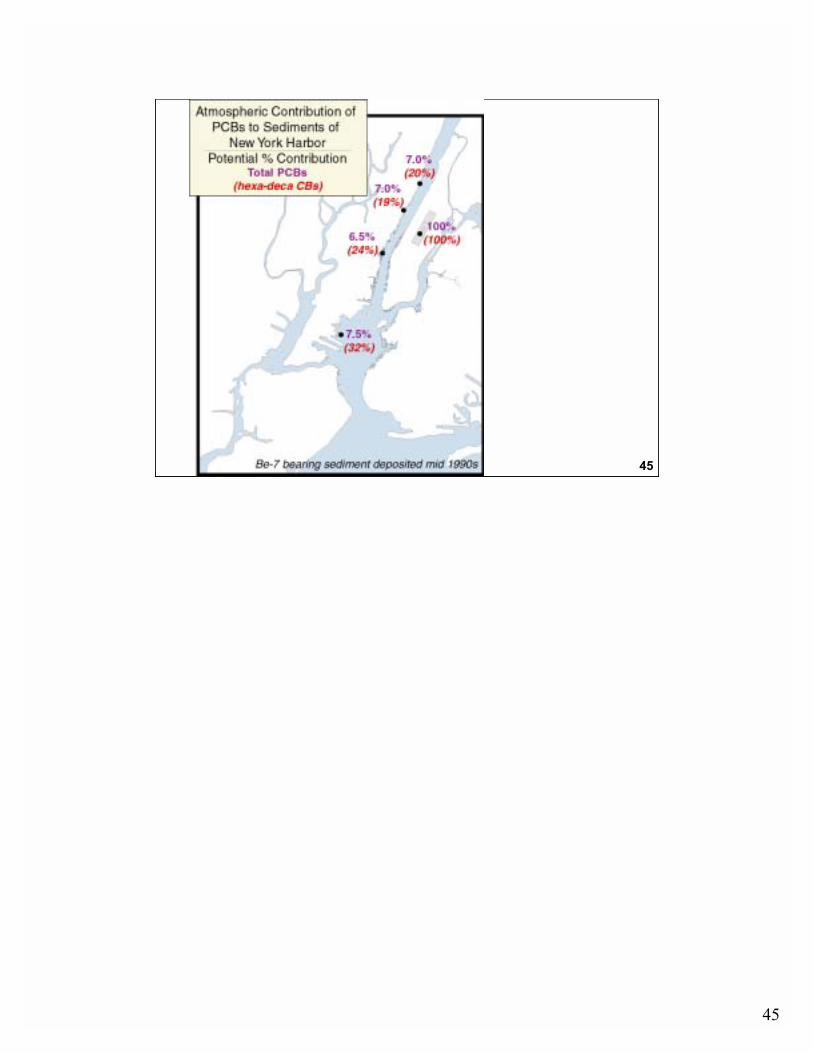
�Be-7 - a short-lived natural radionuclide (half life = 53 days). Detection of Be-7 in near surface sections of sediment cores confirms the presence of a significant component of particles deposited within about a year of core collection.

30

31

-16

-8

0

8

16

24

32

40

48

0 5000 10000 15000 20000 25000

Cs-137 (pCi/kg)

Depth(cm)

188.5collected May, 1983

31

32

�Well-dated� cores have been collected from the Hudson at mile points 203, 193.8, 188.5, 177.6, 163.6, 152.7, 91.8, 88.6, 59, 54, 43, 21.6, 3.0, and -1.7. Samples of all core sections have been archived.

32

33

0 5000 10000 15000 200000

8

16

24

32

40

48

56

64

Depth(cm)

Cesium-137 and Total PCB ProfilesCore 188.6 - Collected 1991

137Cs (pCi/kg)

0 2500 5000 7500 10000

Total PCBs (nmol/g)

Cesium-137

Total PCBs

~1954

~1963

1991Despite major �dilution� with cleaner particles from tributaries, the early 1970s peak in PCB levels can be traced downstream to the NY/NJ Harbor.

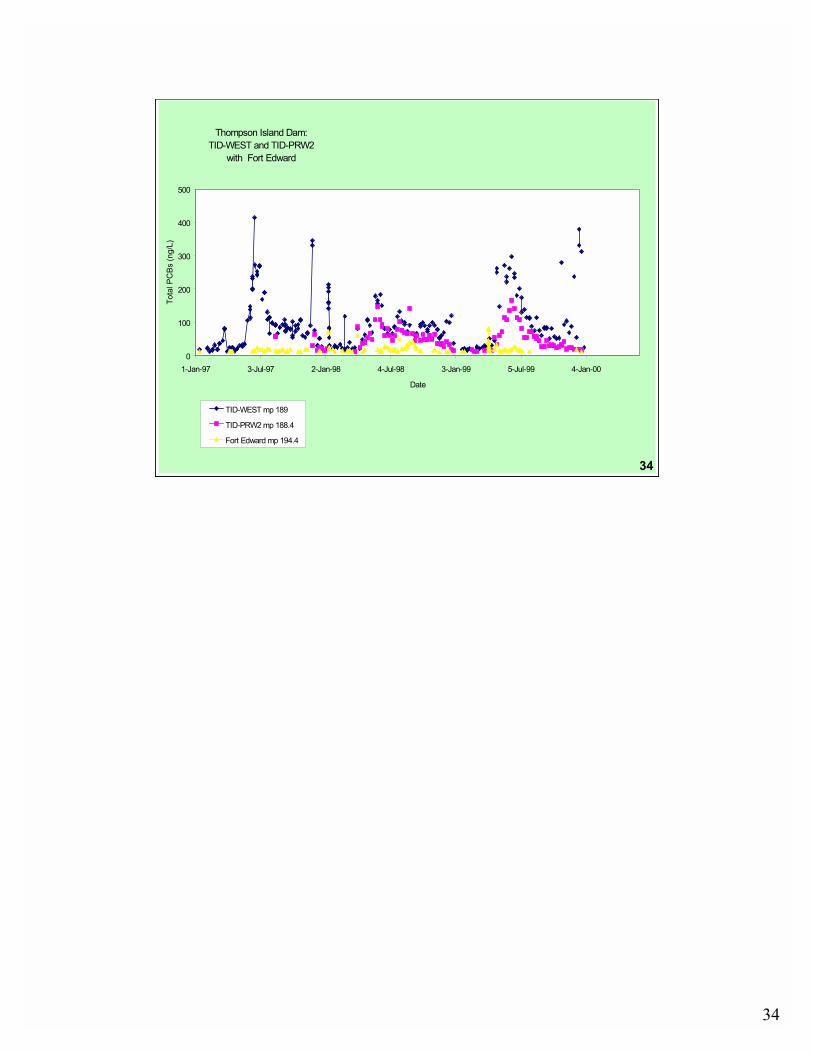
The best evidence for continuing transport of PCBs from sediments of the Thompson Island Pool was provided by weekly water column monitoring.

33

34

Thompson Island Dam: TID-WEST and TID-PRW2

with Fort Edward

0

100

200

300

400

500

1-Jan-97 3-Jul-97 2-Jan-98 4-Jul-98 3-Jan-99 5-Jul-99 4-Jan-00

Date

Tota

l PC

Bs (n

g/L)

TID-WEST mp 189

TID-PRW2 mp 188.4

Fort Edward mp 194.4

34

35

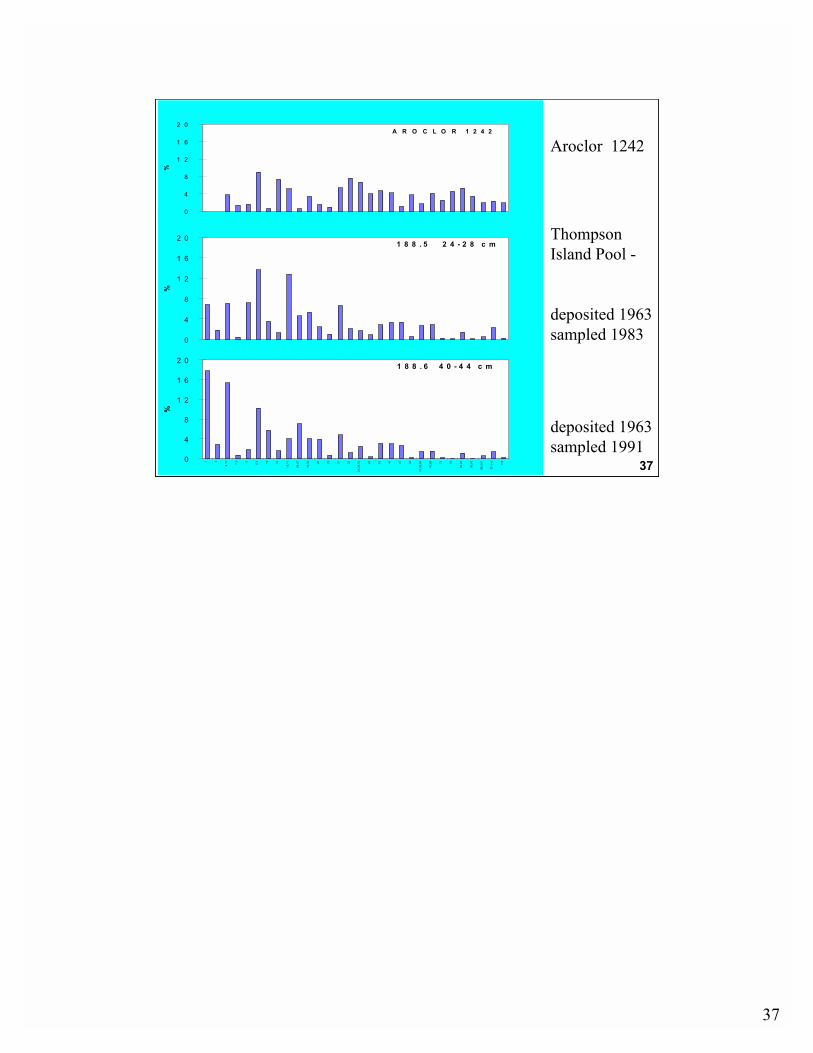
In situ reductive dechlorination of PCBs has been studied using paired samples from co-located sediment cores.

�This process results in dramatic alteration of PCB composition in upper Hudson sediments, but has not progressed as far as lab studies would suggest.

�In sediments from the freshwater reach of the tidal Hudson, reductive dechlorination can be easily detected, but the overall effect on PCB composition has been minor.

35

36

Matching contaminant profiles in paired, co-located cores

36

37

1 8 8 . 6 4 0 - 4 4 c m

0

4

8

1 2

1 6

2 0

1 3

4,10 7,

9 6

5,8 19 18

15,1

7

24,2

7

16,3

2 26 25 31 28

20,3

3,53 22 52 49 47 44

37,4

2,59

41,6

4 74 70

66,9

5

56,6

0

90,1

01

77,1

10 118

%

1 8 8 . 5 2 4 - 2 8 c m

0

4

8

1 2

1 6

2 0

%

A R O C L O R 1 2 4 2

0

4

8

1 2

1 6

2 0

%

Aroclor 1242

Thompson Island Pool -

deposited 1963 sampled 1983

deposited 1963 sampled 1991

37

38

9 1 . 8 4 - 8 c m

0

4

8

1 2

1 6

2 0%

8 8 . 6 2 0 - 2 4 c m

0

4

8

1 2

1 6

2 0

1 3

4,10 7,9 6

5,8 19 18

15,1

7

24,2

7

16,3

2 26 25 31 28

20,3

3,53 22 52 49 47 44

37,4

2,59

41,6

4 74 70

66,9

5

56,6

0

90,1

01

77,1

10 118

%Tidal Hudson -

deposited 1973 sampled 1977

deposited 1973 sampled 1986

38

39

Comparison of Chlorine per Biphenyl LossesIn-Situ versus Laboratory Incubation Studies

0

0.5

1

1.5

2

2.5

3

3.5

4

0 50 100 150 200 250 300 350 400 450 500 550 600 650Incubation Time (Weeks)

Chl

orin

es p

er B

iphe

nyl

In-Situ -Upper Hudson - 1982 Sediment (336 umol/kg) In-Situ - Upper Hudson - 1980 Sediment (706 umol/kg)

In Situ - Upper Hudson - 1979 Sediment (1679 umol/kg) Abramowicz, 1993 (400 umol/kg)

Abramowicz, 1993 (1000 umol/kg) Abramowicz, 1993 (5116 umol/kg)

Abramowicz, 1993 (20,000 umol/kg) Rhee, 1993 (448 umol/kg)

Rhee, 1993 (1120 umol/kg) Rhee, 1993 (2986 umol/kg)

Fish, 1996 (37.3 umol/kg) Fish, 1996 (933 umol/kg)

Fish, 1994 (64.8 umol/kg) Quensen, 1988 (2613 umol/kg)

39

40

0 5000 10000 15000 200000

10

20

30

40

50

60

70

DEPTH(cm)

Cs-137 (pCi/kg)

0 1000 2000Pb (ppm)

188.6collected 1991

1954

1963

Pb vs depth

Cs-137 vs depth

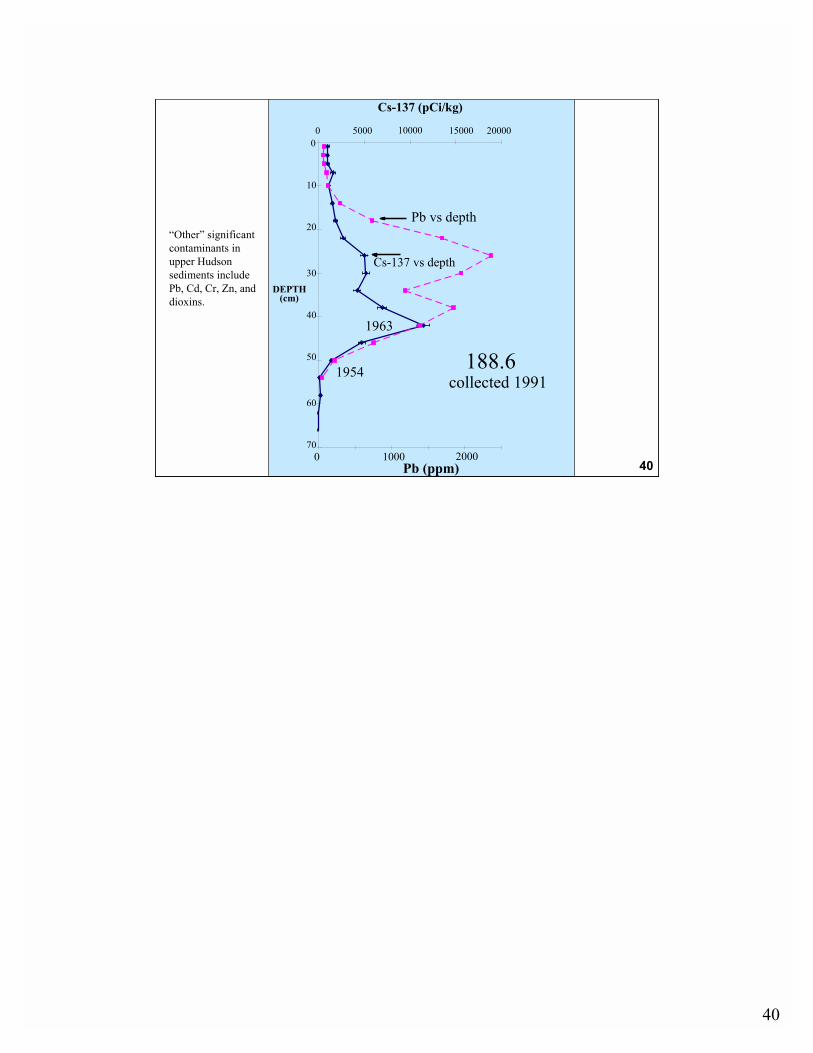
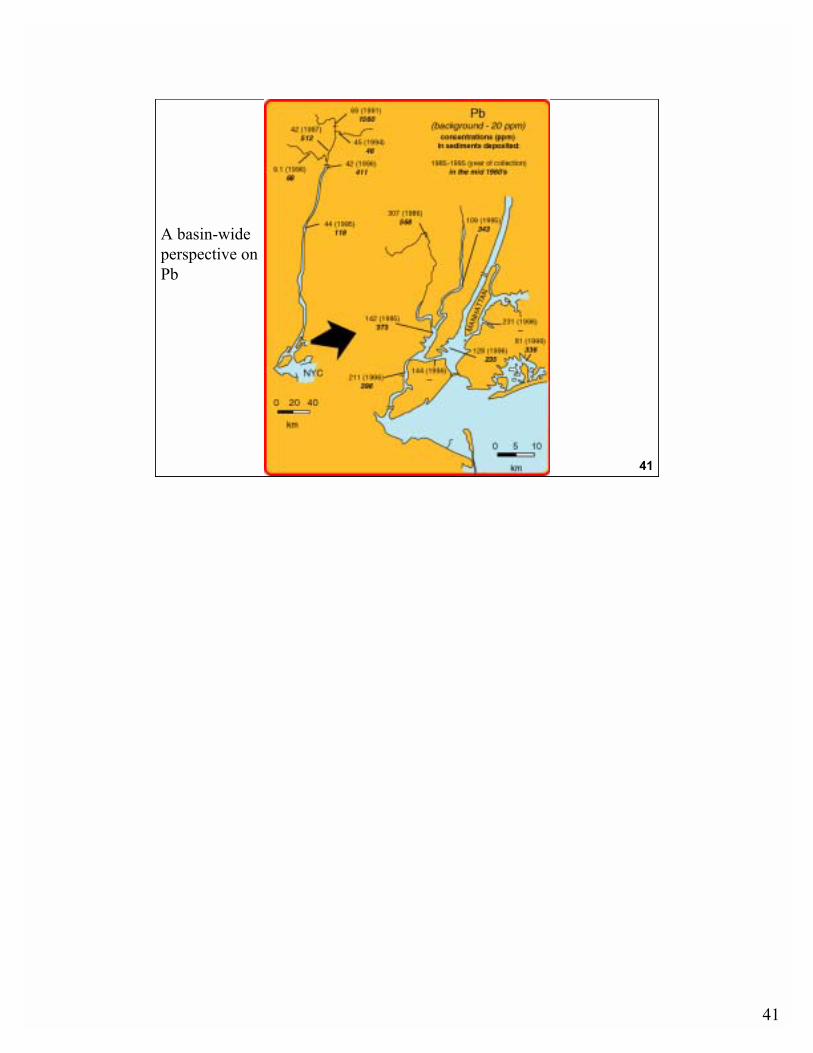
�Other� significantcontaminants in upper Hudson sediments include Pb, Cd, Cr, Zn, and dioxins.

40

41

A basin-wideperspective onPb

41

42

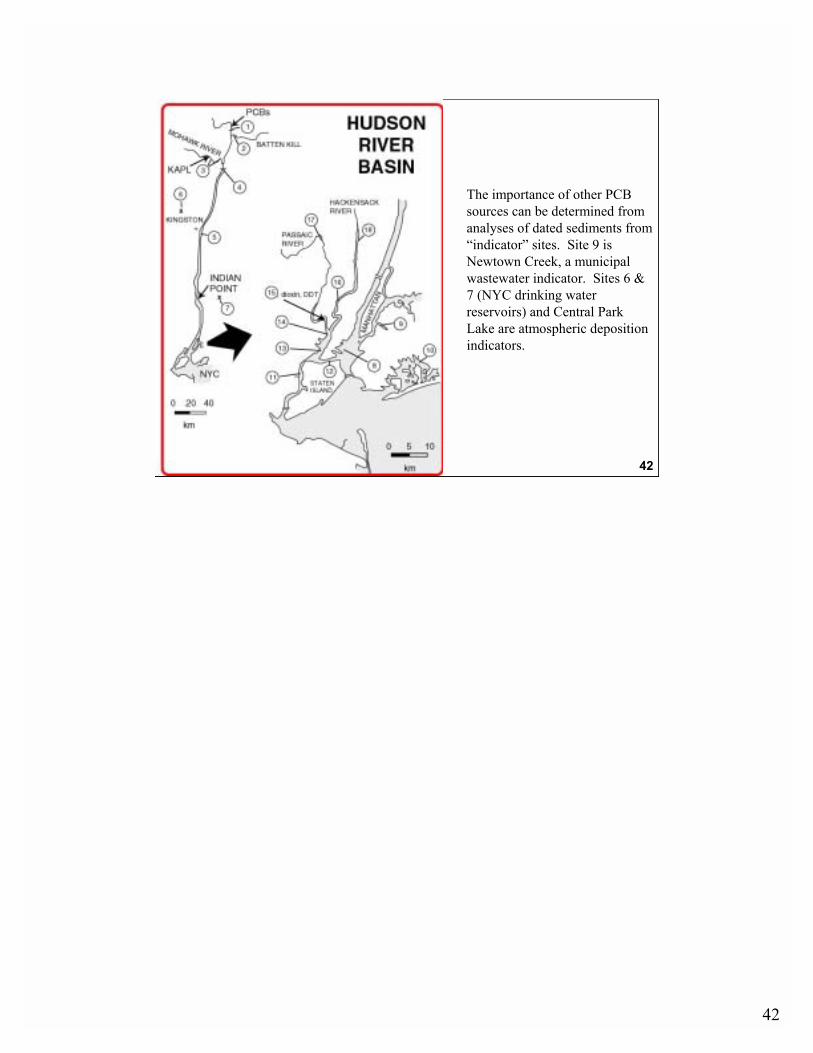
The importance of other PCB sources can be determined from analyses of dated sediments from �indicator� sites. Site 9 is Newtown Creek, a municipal wastewater indicator. Sites 6 & 7 (NYC drinking water reservoirs) and Central Park Lake are atmospheric deposition indicators.

42

43

Table 1. Contaminant levels in sediment samples deposited in the mid 1980s.

Newtown Creek NY/NJ harbor Kingstonsite 9 site 8 site 5

Organic matter (%)a 12.8 9.5 (64%)b 3.6

pp�-DDD (ppb) 62 35 (52%) 6.2

γ-chlordane (ppb) 28 16 (57%) <1

total PCBS (ppm) 1.91 1.47 (61%) 0.79

copper (ppm) 604 207 (31%) 31

lead (ppm) 466 223 (41%) 53

zinc (ppm) 748 358 (35%) 145

cadmium (ppm) 10.5 4.03 (31%) 1.12

aBased on weight loss on ignition at 375°C overnight.

bValues in parentheses represent the sewage contribution to contaminant levels in thissample calculated as ((NY/NJ harbor � Kingston)/ (Newtown Creek � Kingston)) x 100.

43

44

44

45

45

46

Conclusions:

�Analyses of sections from dated sediment cores is the single most efficient means of understanding the sources, distribution, and fate of particle-associated contaminants in natural water systems. (So I�m biased.)

�A multi-contaminant/tracer approach provides critical support for any interpretation of the behavior of any specific particle-associated contaminant (PCBs) in a natural water system (the Hudson).

Recent significant developments in the Hudson River PCB story include stable lead isotopes as tracers of upper Hudson particles; plutonium isotopes as tracers of Mohawk River particles; and stable isotopes as tracers of reductive dechlorination of PCBs.

46

47

Thank You

After viewing the links to additional resources, please complete our online feedback form.

Thank You

Links to Additional Resources


Recommended