82
Principles Of Principles Of Economics Economics Power Point Presentation Chapter 16 History of International Trade ©J. Patrick Gunning November 13, 2007
| Date post: | 19-Dec-2015 |
| Category: |
Documents |
| View: | 216 times |
| Download: | 0 times |

Principles Of EconomicsPrinciples Of Economics
Power Point Presentation
Chapter 16
History of International Trade
©J. Patrick Gunning
November 13, 2007

Introduction: World Trade Since 1850Introduction: World Trade Since 1850 The modern era of international trade began in
the 19th century, especially during the second half.
Trade as a percent of GDP quadrupled between 1850 and 1913.
Growth was interrupted and disrupted by two world wars and the great depression of the 1930s.
Over the two centuries, world trade has grown from about 5 per cent of global GDP to about 40 per cent.

The Two Eras Of World Trade Growth The Two Eras Of World Trade Growth (Figure 12-1)(Figure 12-1)

A Corresponding Growth inA Corresponding Growth inPer Capita GDP Per Capita GDP

What Causes What?What Causes What? Did the increase in global trade cause an increase
in global GDP per capita? Or did the increase in global GDP per capita
cause an increase in global trade? Remember that global trade rose as a per cent of
GDP. So it seems reasonable, as a first approximation
at least, to suggest that the increase in trade played a part in global GDP per capita growth.

Plan of the ChapterPlan of the Chapter Purpose: To present a brief history of world
trade. Three parts:
1. Ancient and pre-modern trade. 2. The first golden age of international trade. 3. The second golden age of international trade.

New Topic:New Topic: Ancient and Ancient and Pre-modern TradePre-modern Trade

Ancient and Pre-Modern Trade (1)Ancient and Pre-Modern Trade (1) International trade began before the modern
nation state. Characteristics of trade prior to the 15th
century: Large distances between markets. High transport costs. Absence of a commonly accepted money (so much
of the international trade was barter trade. Trade was not significant by modern standards.

Ancient and Pre-Modern Trade (2)Ancient and Pre-Modern Trade (2) Major trade routes were the Caravan Routes of the
Middle East and Africa and the Silk Road stretching from the Middle East to China (see maps).
The major traders were the Persians (today’s Iranians) and Arabs. Trade was over land largely by caravan, with goods carried on the backs of animals.
During the first half of the second millennium, 1000-1500, Europe was behind China and the Arab empires in technology, human capital, and trade.

The Silk Road (Figure 16-2)The Silk Road (Figure 16-2)

The Silk Road (2)The Silk Road (2)

Trade and Waterways Trade and Waterways The major seafaring traders of the pre-
modern era were:
1. Jewish Arabs who had settled in the towns of Northern Africa.
2. Italians from Genoa and Venice in the 14th and 15th centuries.

Trade in the MediterraneanTrade in the Mediterranean(Figure 16-3)(Figure 16-3)

Institutions in Italian Port CitiesInstitutions in Italian Port Cities The growth of international seafaring trade was
accompanied by the growth of institutions in Genoa and Venice that supported trade.
1. Mints for gold and silver coins 2. Banks to pool the funds of savers and to guarantee
loans. 3. Merchant law to adjudicate trade disputes and to
punish defrauders. Birth of private property rights in medieval Europe. Beginning of free enterprise in medieval Europe.
4. Development of insurance.
Shift from Italy to European Cities Shift from Italy to European Cities with Ports on the Atlantic Oceanwith Ports on the Atlantic Ocean
As shipping technology improved, the Mediterranean port cities were replaced in importance by cities with easy access to the Atlantic ocean: London, Paris, Lisbon, Amsterdam, and Barcelona.
As Italy faded, the Atlantic sea-faring nations of Spain, Portugal, England, the Netherlands, and France emerged as the most powerful nation-states of Europe.
From these cities, merchants set out for the Americas, Africa, India, and even East Asia and the South Pacific.

Trade In The Mediterranean Was Trade In The Mediterranean Was LimitedLimited

Trade In The North And Central Trade In The North And Central Atlantic Came To Dominate Atlantic Came To Dominate
Mediterranean TradeMediterranean Trade

Trade From Around 1500 Trade From Around 1500 To Around 1850 (1)To Around 1850 (1)
Atlantic trade gradually came to dwarf Mediterranean trade.
The new Atlantic port cities followed the Italian cities by expanding their banking facilities. They also adopted a gold or silver-based currency, merchant law, greater private property rights, and greater free enterprise.
Ultimately, the rise of the middle class challenged the power of kings and helped lead to democratic thinking and, ultimately, to democracy.

North Atlantic Gyre (Figure 16-4)North Atlantic Gyre (Figure 16-4)
Trade From Around 1500 Trade From Around 1500 To Around 1850 (2)To Around 1850 (2)
Triangle trade originating in England: “Ships from English ports carried metal, glass and textile manufactures to west Africa, helped along by the northeast trade[wind]s; slaves from Africa to the West Indies and North America, pushed along by the general westward drift of the equatorial currents; sugar, rum, cotton, rice, indigo, tobacco from the West Indies and the Carolinas and Virginia, speeded on by the Gulf Stream; then flour and timber from New England back to England, propelled by prevailing westerlies and the North Atlantic Drift” (Couper, 1972, p.50 and Fig. 1. p.53, as reported in Fleming, p.8).

Satellite Wind PhotoSatellite Wind Photo

Trade From Around 1500 Trade From Around 1500 To Around 1850 (3)To Around 1850 (3)
Prior to 1850, the security of shipping lanes depended on the strength of a particular government’s navy.
Some governments employed privateers, who were basically government-sanctioned robbers.
(New London and Groton privateers) http://www.billmemorial.org/griswold.htm

Trade From Around 1500 Trade From Around 1500 To Around 1850 (4)To Around 1850 (4)
Transoceanic trade was hindered by: High transport costs. Inadequate finance and insurance. Risks of predation by privateers or pirates. Fear of natural peril.
An agreement to end privateering and to track down pirates was made among the major countries in 1856. (Reducing piracy was made easier by the emergence of steam-power ships.

Note on U.S.Note on U.S. The U.S. refused to join, claiming that such an
agreement would discriminate against smaller powers.
But when faced with confederate privateers in 1861, the Union government of the U.S. begged to join.
England and France agreed but would not permit the agreement to go into effect until after the Civil War (Lowe).

Factors That Led to Economic Growth Factors That Led to Economic Growth in the 19in the 19thth Century Century
1. An international agreement on privateering and piracy.
2. Improved shipping technology. 3. Improved communication. 4. The international gold standard.

Golden Age Of Maritime International Trade
By 1913 trade had expanded to twenty times its level in 1800.
There was a fundamental international division of labor that had not been seen before on such a scale.
Steam power and the telegraph linked markets in different countries.
http://www.pbs.org/wgbh/amex/cable/index.html http://www.atlantic-cable.com/Article/1858Leslies/
index.htm

Price ConvergencePrice Convergence Before 1800, the average prices of commodities
in importing countries were as high as 20 times those in exporting countries. Why? High transport cost, accident risk, piracy, etc.
After 1815, the price differentials, on average, fell to 2 or 3 times as high.
By 1900, the price differentials had fallen to 2 times, on average.

The Great Retreat In TradeThe Great Retreat In TradeFrom 1913 To 1945From 1913 To 1945
World War I: 1913 – 1919. The Great Depression: 1929 – 1935. World War II: 1939 – 1945.
International trade was severely disrupted.

Contraction in World Trade (1929-33)Contraction in World Trade (1929-33)

ProtectionismProtectionism Protectionism: an ideology that views international
trade as threatening to a nation and that promotes the adoption of protectionist policies – i.e., policies that restrict trade.
Ways of restricting trade in material goods or resources: 1. Tariff: either a specific tax per unit of the good (a per
unit tariff) or a fixed percent of its price (ad valorem tariff). 2. Quota: a limit on the amount of a particular good that
can be imported during a given period of time. 3. Quality standards.

Use of Quality StandardsUse of Quality Standards Quality standards are often used to assure
safety. Examples: imported foods and medicines; children’s toys.
They may also be used to discriminate: 1. Discriminatory standards may be applied to
imports. 2. Discriminatory inspections.
The potential for bribery and corruption.

New TopicNew Topic:: The Second Age of International The Second Age of International Trade Growth (1945 to the present)Trade Growth (1945 to the present)
Four major independent actions by sovereign nations contributed greatly to the increase in world trade.
Four major multinational agreements.

The Major Independent ActionsThe Major Independent Actions 1. Marshall Plan. 2. U.S. policy toward Asian Nations. 3. Economic liberalization in China and
India. 4. Breakup of the Soviet Union.

1. The Marshall Plan1. The Marshall Plan After WWII, the victors, led by the U.S., sought to help
create an environment that would gradually reduce restrictions on trade in practically all countries.
After the war, the U.S. accounted for ½ of the world’s production.
The Marshall plan (1947-1951), instituted by the U.S., extended “credit” for post-war reconstruction and required borrowing nations to permit free trade.

How the Money Was SpentHow the Money Was Spent Of the some $13 billion allotted by mid-1951. $3.4 billion had been spent on imports of raw
materials and semi-manufactured products. $3.2 billion on food, feed, and fertilizer. $1.9 billion on machines, vehicles, and equipment. $1.6 billion on fuel.
Most of the goods were bought from U.S. firms.

The AftermathThe Aftermath At the end of the period (by 1951) all of the
assisted European nations except for West Germany had reached their prewar levels of production.
The free trade policy left the European nations poised to begin a European economic unification.

2. U.S. Policy Toward Asia (1)2. U.S. Policy Toward Asia (1) The post-World War II decision by the U.S.
1. to provide aid to Japan’s reconstruction. 2. to help selected Asian nations (South Korea,
Taiwan) by: A. transferring technology. B. allow free imports of goods.

2. U.S. Policy Toward Asia (2)2. U.S. Policy Toward Asia (2) In the 1950s, the U. S. brought South Korea and Taiwan
under the anti-communist defense umbrella and began to buy industrial products from Japan.
Japan’s capacity to export was helped by U.S. insistence that it be included as a member of GATT.
As a condition for assistance, Japan, Korea and Taiwan had to develop internal market economies (private property rights, free enterprise, and a stable money).

Technology Contributions From Asia Technology Contributions From Asia (Figure 16-5)(Figure 16-5)
Note: Foreign patents account for about 35% of all US patents.
3. Economic Liberalization of 3. Economic Liberalization of Populous NationsPopulous Nations
Economic liberalization began in Mainland China in the early 1980s.
Economic liberalization began in India in the late 1990s.
The “freeing of the masses” in these three former communist or socialist states has had a major influence on trade in the last decade or so and is destined to have an even greater impact in the future.

The Population Map (Figure 16-6)The Population Map (Figure 16-6)

Explanation of theExplanation of the Population Map (1) Population Map (1)
The map expands or contracts the size of the country in accord with its population. Thus the largest nation in the map is China and the second largest is India.
Note that the populations of China and India are substantially larger than those of the U.S. Europe, Japan, South Korea, Taiwan, and Singapore, which now is responsible for the vast majority of the research and development.

Explanation of theExplanation of the Population Map (2) Population Map (2)
If China and India follow the development path of South Korea and Taiwan, we can expect the citizens of these countries to greatly contribute to future economic growth. Their GDPs and trade are likely to exceed the GDPs and trade of the others.

4. Soviet Union Breakup4. Soviet Union Breakup Break up of the former Soviet Union in 1991. Initial effects have been an increase in world
trade involving mostly eastern European nations. These nations have been admitted to the
European Union and World Trade Organization (see below).
Others have been slower to follow.

Fate of Soviet Bloc Nations (16-7)Fate of Soviet Bloc Nations (16-7)

Explanation of Figure 16-7Explanation of Figure 16-7 The nations closest to Europe have, for the
most part, joined the European Union and the World Trade Organization (WTO) – see below.
The nations closest to Russia and Russia itself are, for the most part, observers at the WTO and have not yet been admitted.

The Major Trade AgreementsThe Major Trade Agreements After World War II, the relatively free nations of
the world gradually moved toward making agreements and associations that set the framework for increasing world trade.
Types of decisions: Multilateral: many nations agree. Unilateral decisions: one nation decides. Bilateral agreements: two nations agree. Plurilateral: a subset of a multilateral group agrees.

The Major Trade AgreementsThe Major Trade Agreements 1. The general agreement on tariffs
and trade. 2. The European Union. 3. The north American free trade
agreement. 4. The Bretton Woods agreement on a
new monetary system.

1. GATT and WTO1. GATT and WTO Twenty-three nations in 1949 reached the
General Agreement on Tariff and Trade (GATT). The nations agreed:
1. To gradually, through a series of expected future agreements, reduce tariffs and other international trade barriers. In other words, they agreed to meet and talk about these things.
2. To develop a means through which nations could settle disputes over trade without imposing barriers or threatening war.

GATT Changes into the WTOGATT Changes into the WTO As the years passed,
1. The barriers to trade became smaller and smaller. 2. More and more nations joined the agreement.
In 1995, the members formed a new international organization called the World Trade Organization (WTO).

Duties of the WTODuties of the WTO 1. To help members reach agreements by
arranging for meetings and doing the clerical work required to record and publish the proceedings.
2. To help members enforce agreements by helping them resolve disputes.
3. To assist applicants for WTO membership prepare to meet the qualifications that other nations require for admission.
4. To educate the public about the reasons for making the agreements and about trade agreement history.

The WTO TodayThe WTO Today The WTO not only “administers” agreements
relating to trade in commodities (materials). Today it also administers agreements to trade in
services and agreements relating to intellectual property rights.
http://www.wto.org/

Who Is Missing From the WTO?Who Is Missing From the WTO? Of the approximately 194 nations of the
world, 149 are members. Who are absent? 1. North Korea.
2. Religious dictatorships. 3. Nations with insufficient control over the
military or police to enforce agreements.

Who Is MissingWho Is Missing

2. European Union: It Starts With 2. European Union: It Starts With An Economic CommunityAn Economic Community
European members of GATT formed the European Economic Community in 1957. Members: Belgium, West Germany, Luxembourg, France,
Italy and the Netherlands Members agreed to eliminate tariffs.
Growth: 1973: Denmark, Ireland, UK. 1981: Greece. 1986: Spain and Portugal.

EU Is Created and GrowsEU Is Created and Grows By 1992, this had grown into the European Union (EU).
Members agreed, in principle, to tariff-free trade in goods and services, freedom of capital movements, and elimination of barriers to immigration with EU member countries.
More growth: 1995: Austria, Finland, Sweden. 2004: Cyprus, Czech Republic, Estonia, Hungary, Latvia,
Lithuania, Malta, Poland, Slovakia and Slovenia. Potential future members: Bulgaria, Romania, Croatia, Turkey
and Macedonia. Common currency: The euro was instituted in 2002.

The EU TodayThe EU Today

EU ExpansionEU Expansion
3. North American 3. North American Free Trade AssociationFree Trade Association
The North American Free Trade Association (NAFTA) was formed in 1994 between the U.S., Mexico, and Canada.
The goal of the agreement is to phase out practically all tariffs over a fifteen year period.

Two Peculiar AspectsTwo Peculiar Aspects of the Agreement of the Agreement
Because of U.S. dominance, politically sensitive goods were omitted from the agreement: dairy products, poultry, eggs, and sugar.
The U.S. and Canada demanded that Mexico not be a transshipment point for goods produced in non-member countries.
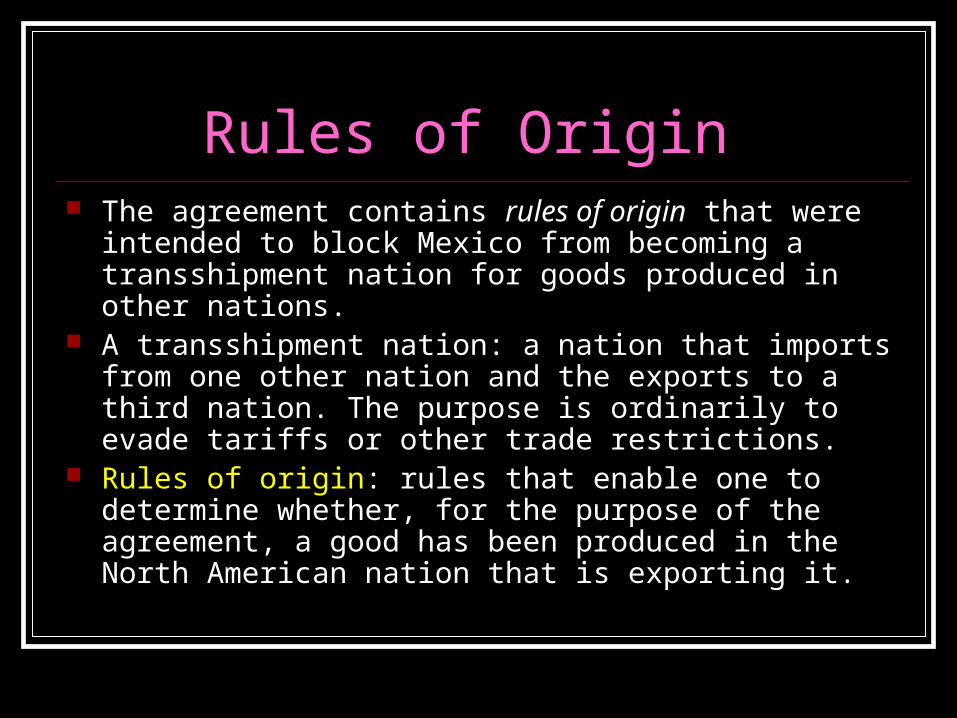
Rules of Origin Rules of Origin The agreement contains rules of origin that were intended to
block Mexico from becoming a transshipment nation for goods produced in other nations.
A transshipment nation: a nation that imports from one other nation and the exports to a third nation. The purpose is ordinarily to evade tariffs or other trade restrictions.
Rules of origin: rules that enable one to determine whether, for the purpose of the agreement, a good has been produced in the North American nation that is exporting it.

4.4. Bretton Woods Monetary Bretton Woods Monetary SystemSystem

The Gold Standard (1)The Gold Standard (1) The first golden age of international trade took
place under the gold standard. When nations abided by the rules, Each government exchanged gold for its currency at a
fixed rate. Gold flowed in and out of countries based on their imports
and exports. Rules of the gold standard:
Nations that lost gold had to reduce their quantity of money.
Nations that gained gold had to raise their quantity of money.

The Gold Standard (2)The Gold Standard (2) Under the gold standard, the amount of gold held
by the people in a nation was roughly proportional to its GDP.
The U.S. was growing faster in the late 19th and early 20th century than other major nations; gold was flowing in.
After the war broke out in Europe in 1913, gold flowed into the US and out of Europe faster.

Disruption of the Gold StandardDisruption of the Gold Standard During WWI, nations stopped trading and went
off the gold standard. Afterwards, the gold standard could not be
properly restored. Nations were unwilling to adjust their exchange rates of gold for their currency to reflect changes in the distribution of gold after WWI.

The Situation in 1944The Situation in 1944 There was no good international monetary
standard from 1913 to 1944, when the Bretton Woods meeting took place.
That is a major reason why international trade had fallen after 1913 (see chart).

GDP/Capita (Figure 16-1)GDP/Capita (Figure 16-1)
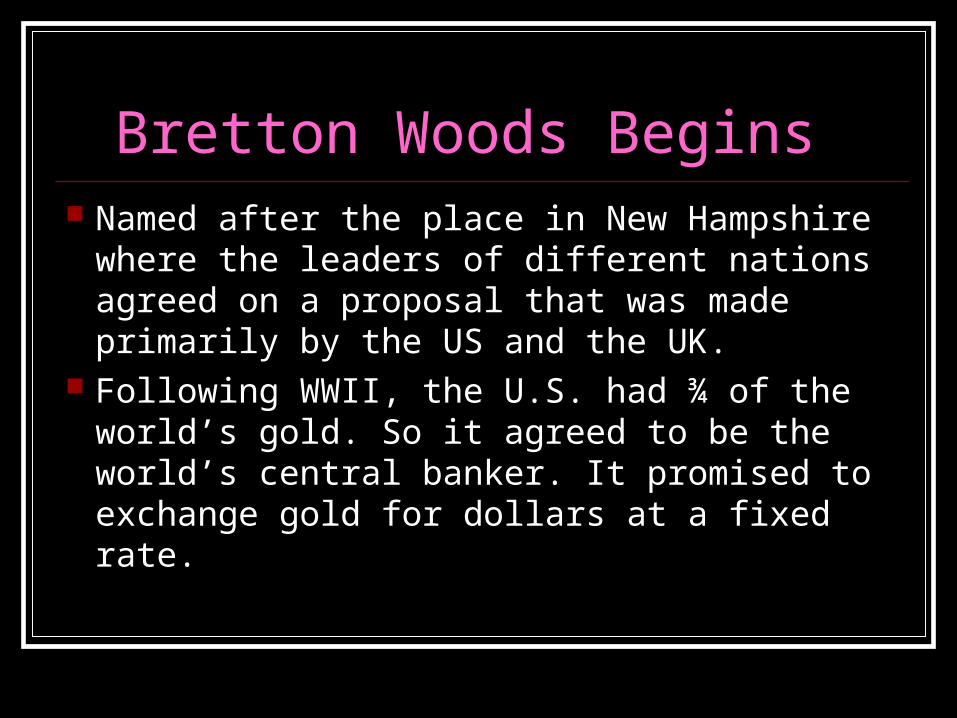
Bretton Woods Begins Bretton Woods Begins Named after the place in New Hampshire
where the leaders of different nations agreed on a proposal that was made primarily by the US and the UK.
Following WWII, the U.S. had ¾ of the world’s gold. So it agreed to be the world’s central banker. It promised to exchange gold for dollars at a fixed rate.

Overview Overview Other nations agreed to use dollars as
reserves for their currency. They agreed to trade their currencies for
the dollar at a fixed rate. The dollar standard was intended to
replace the gold standard of the first golden age.

Rules of the Dollar Standard Rules of the Dollar Standard 1. Nations that lost dollars had to reduce
their quantity of money. 2. Nations that gained dollars had to raise
their quantity of money. 3. The U.S. should exchange gold at a fixed
rate for dollars.
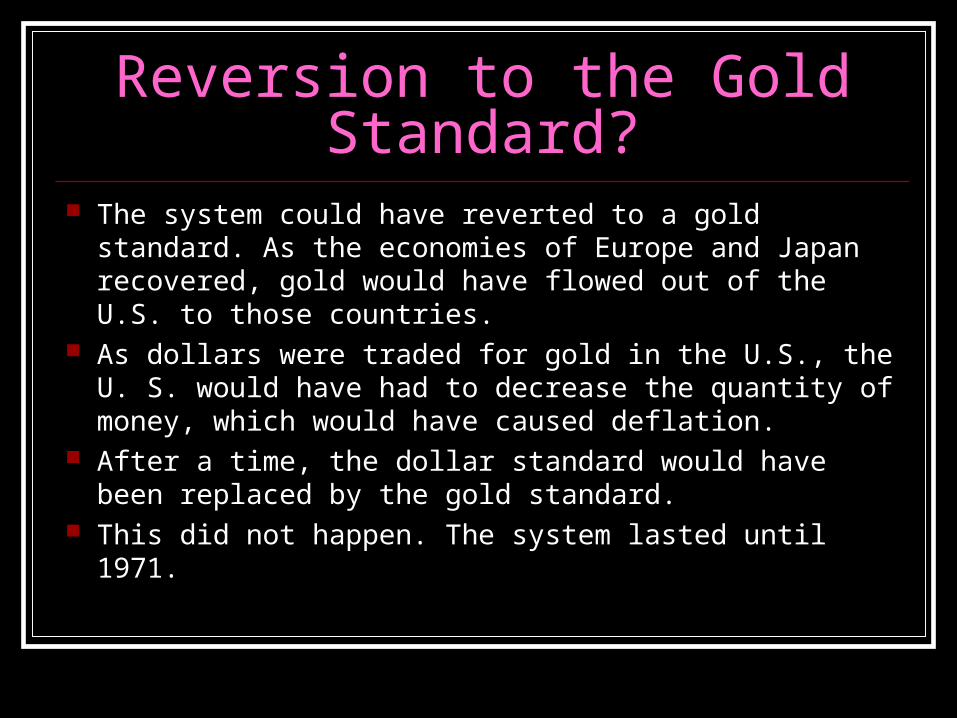
Reversion to the Gold Standard?Reversion to the Gold Standard? The system could have reverted to a gold standard. As
the economies of Europe and Japan recovered, gold would have flowed out of the U.S. to those countries.
As dollars were traded for gold in the U.S., the U. S. would have had to decrease the quantity of money, which would have caused deflation.
After a time, the dollar standard would have been replaced by the gold standard.
This did not happen. The system lasted until 1971.

Economic Power Changes and Economic Power Changes and Keynesian Expansionary PoliciesKeynesian Expansionary Policies
As other nations recovered from WWII, they grew faster than the US.
So dollars started to flow out of the U.S. The US should have reduced its quantity of
money. In the 1960s, the U.S. began to follow Keynesian
expansionary policy, causing an increase in its money quantity. It created dollars instead of reducing them.
U.S. Response to ForeignU.S. Response to ForeignDemands for DollarsDemands for Dollars
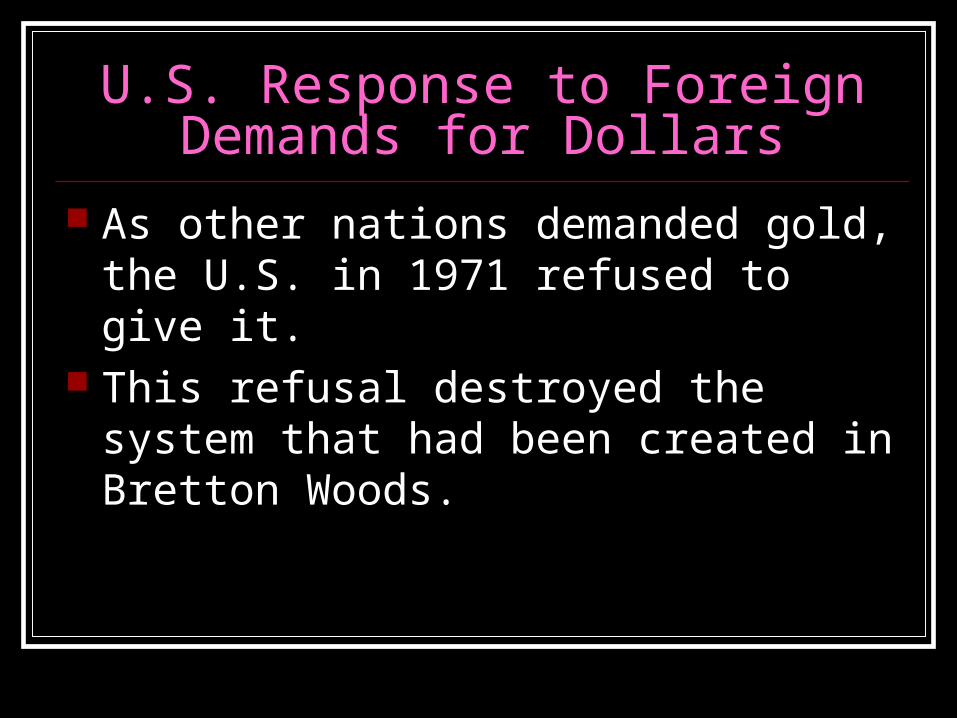
As other nations demanded gold, the U.S. in 1971 refused to give it.
This refusal destroyed the system that had been created in Bretton Woods.

What the U.S. Should What the U.S. Should Have Done and Didn’t DoHave Done and Didn’t Do
Other nations began to demand gold. At first, the US allowed gold to flow out of the country.
It should have been reducing its money quantity. It did not do so.
Later it hesitated to allow gold to flow out. In 1971, the U.S. refused to convert gold into dollars. (It
reneged on its agreement to exchange dollars for gold.) The system collapsed as other nations left the dollar
standard.

Flexible Exchange Rates Flexible Exchange Rates The system gradually evolved into one of
flexible exchange rates, where the exchange rate of one nation’s currency in terms another nation’s is established by the forces of demand and supply.
After a brief disruption, this system has gradually stabilized, as most nations have adopted an inflation targeting monetary policy.

Consequences of the GrowthConsequences of the Growthin World Tradein World Trade
How to measure the consequences Growth in US real GDP per capita Growth in the Human Development Index (HDI):
The HDI takes account of life expectancy and literacy.
Growth of population

Growth in US Per Capita GDPGrowth in US Per Capita GDP

Human Development Index (HDI) Human Development Index (HDI) Over Two CenturiesOver Two Centuries
In addition to GDP/capita, the HDI factors in life expectancy and literacy.

Infant Mortality Over Four DecadesInfant Mortality Over Four Decades

Life Expectancy at BirthLife Expectancy at BirthOver Five DecadesOver Five Decades

Literacy Rates Over Three Literacy Rates Over Three DecadesDecades

Population Growth Over Two MilleniaPopulation Growth Over Two Millenia


