23
| Date post: | 31-Dec-2015 |
| Category: |
Documents |
| Upload: | iona-daniel |
| View: | 16 times |
| Download: | 2 times |

Principles of
Engineering System Design
Dr T Asokan
Principles of
Engineering System Design
Dr T Asokan
Bond Graph Modelling of Dynamic systems

Physical System Modelling
• Bond Graph Method• The exchange of power between two parts of a
system has an invariant characteristic.• The flow of power is represented by a Bond• Effort and Flow are the two components of
power.

Physical System
Engineering Model
Differential Equations
Output
Simulation Language
Block Diagrams
Physical System
Engineering Model
Bond Graph
Output
Software(Computer Generated Differential Equations)
Classical approach for modeling of physical system Bond Graph Modeling

Generalised Variables
p = e · dt
q = f · dt
Power variables: Effort, denoted as e(t); Flow, denoted as f(t)Energy variables: Momentum, denoted as p(t); Displacement, denoted as q(t)
The following relations can be derived:Power = e(t) * f(t)

October 2, 2008
Energy FlowThe modeling of physical systems by means of bond graphs
operates on a graphical description of energy flows.
The energy flows are represented as directed harpoons. The two adjugate variables, which are responsible for the energy flow, are annotated above (intensive: potential variable, “e”) and below (extensive: flow variable, “f”) the harpoon.
The hook of the harpoon always points to the left, and the term “above” refers to the side with the hook.
e
f P = e · f e: Effortf: Flow

Modeling: Bond Graph Basics
• effort/flow definitions in different engineering domains
Effort e Flow f
Electrical Voltage [V] Current [A]
Translational Force [N] Velocity [m/s]
Rotational Torque [N*m] Angular Velocity[rad/sec]
Hydraulic Pressure [N/m2] Volumetric Flow[m3/sec]
Chemical Chemical Potential[J/mole]
Molar Flow[mole/sec]
Thermodynamic Temperature[K]
Entropy FlowdS/dt [W/K]
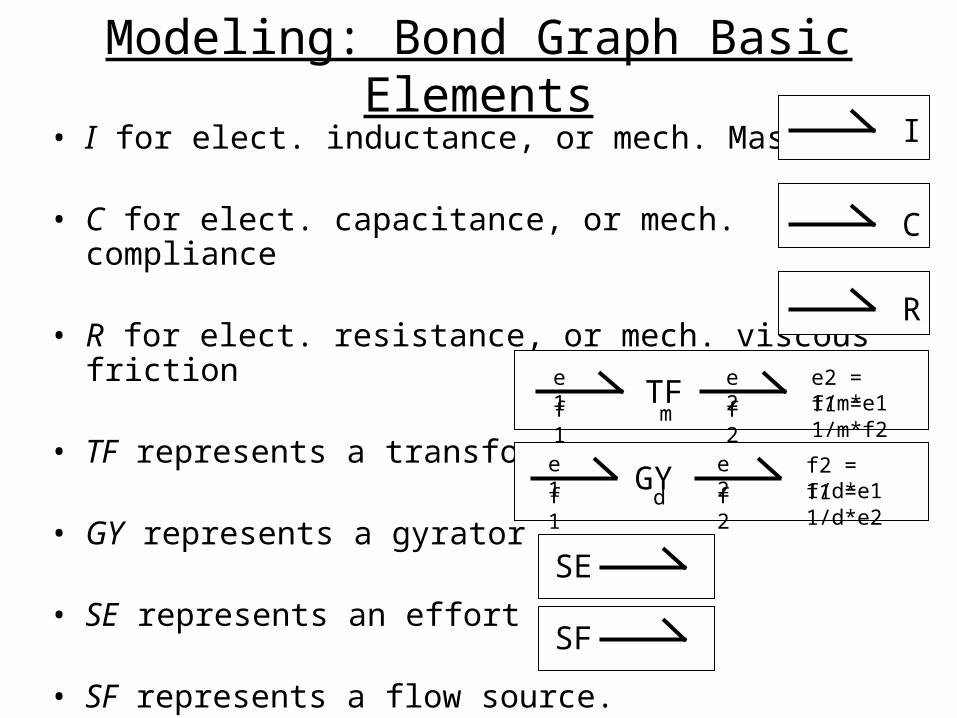
• I for elect. inductance, or mech. Mass
• C for elect. capacitance, or mech. compliance
• R for elect. resistance, or mech. viscous friction
• TF represents a transformer
• GY represents a gyrator
• SE represents an effort source.
• SF represents a flow source.
Modeling: Bond Graph Basic ElementsI
C
R
TFm
e1f1
e2f2
e2 = 1/m*e1f1 = 1/m*f2
GYe1f1
e2f2d
f2 = 1/d*e1f1 = 1/d*e2
SESF

Modeling: Bond Graph Basic Elements• Power Bonds Connect at Junctions.• There are two types of junctions, 0 and 1.
0 11
2
3
45
11
12
13
Efforts are equale1 = e2 = e3 = e4 = e5
Flows sum to zerof1+ f2 = f3 + f4 + f5
Flows are equalf11 = f12 = f13
Efforts sum to zeroe11+ e12 = e13
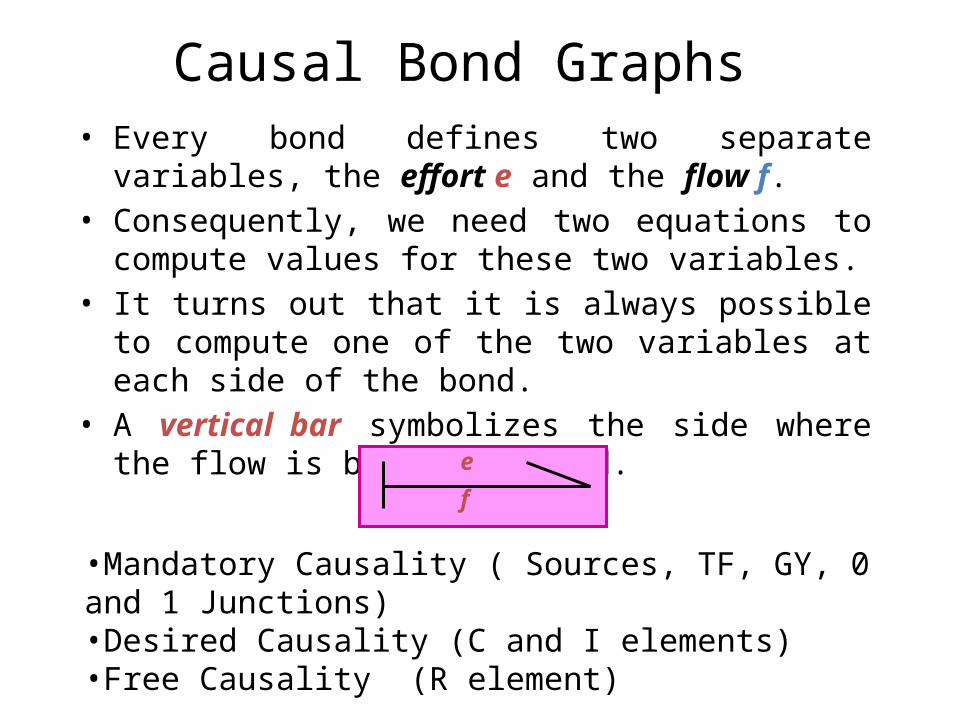
Causal Bond Graphs • Every bond defines two separate variables, the effort e and
the flow f.• Consequently, we need two equations to compute values
for these two variables.• It turns out that it is always possible to compute one of the
two variables at each side of the bond.• A vertical bar symbolizes the side where the flow is being
computed.e
f
•Mandatory Causality ( Sources, TF, GY, 0 and 1 Junctions)•Desired Causality (C and I elements)•Free Causality (R element)
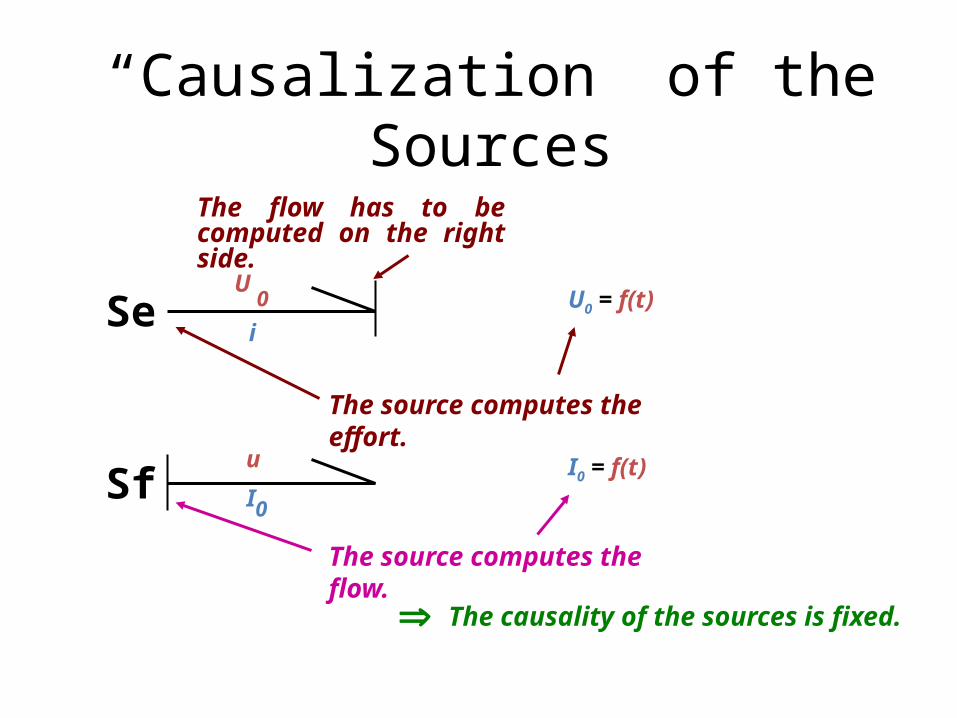
“Causalization” of the Sources
U0 = f(t)
I0 = f(t)
U0
iSe
Sfu
I0
The source computes the effort.
The flow has to be computed on the right side.
The source computes the flow.
The causality of the sources is fixed.

“Causalization” of the Passive Elements
u
iR
u = R · i
u
iR
i = u / R
u
iC
du/dt = i / C
u
iI
di/dt = u / I
The causality of resistors is free.
The causality of the storage elements is determined by the desire to use integrators instead of differentiators.

Integral Causality (desired Causality)
e
fI
e
f sI
1
fe C
f
e
sC
1
Integral causality is preferred when given a choice.
edtI
f1
maF
fdtC
e1

“Causalization” of the Junctions
0e1
e2
e3f1
f2
f3
e2 = e1
e3 = e1
f1 = f2 + f3
1e1
e2
e3f1
f2
f3
f2 = f1
f3 = f1
e1 = e2+ e3
Junctions of type 0 have only one flow equation, and therefore, they must have exactly one causality bar.
Junctions of type 1 have only one effort equation, and therefore, they must have exactly (n-1) causality bars.

Modelling Example Mechanical Systems
R
C
mx 0x
MF
FKxxRxM mmm
Equation Governing the system F
FR
Fm
Fk
Mass, Spring and Damper Syetms

C
R1Se
I
Final Bond Graph
e1
em
ec
f1
fmeR
fcfR mc
mmcc
cRm
KxF
xdtxKdtfC
e
FFFF
1
System Equations
Bond Graph model
Sf1
C
1
01Se
R
IReference Velocity=0 for this case
Velocity Junction
DamperSpring
Mass

Simulation-Second order system
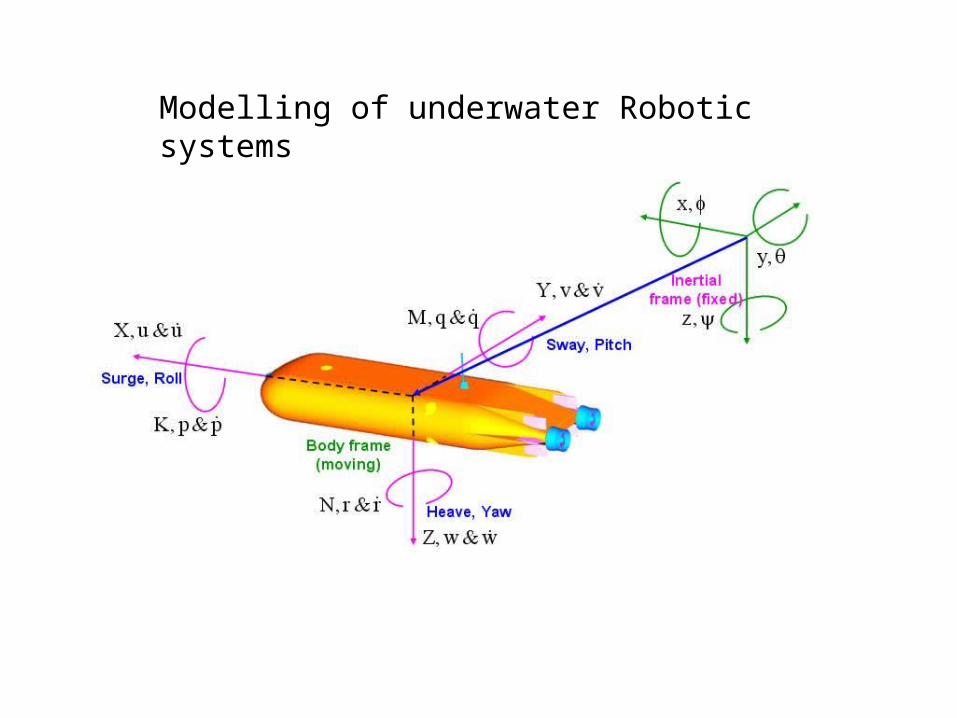
Modelling of underwater Robotic systems

Euler angles
Linear velocity of the base point w.r.t Inertial frame
TzTy
Tx
Ixx+Iax
wx*(Ixx+Iax)
wz*(Izz+Iaz)wy*(Iyy+Iay)
wz
wx
wyIzz+IazIyy+Iay
PV TFMV TFMV
Body fixedangularvelocity
Body fixedlinearvelocity
m+max
m+may m+maz
Euler angleTransformationmatrix
wx*(m+max)
wy*(m+may)wz*(m+maz)
Vx
Vy Vz
Angular velocity to first link of themanipulator
Tbx
TbyTbz FzFy
Fx Fbx
FbzFby
MTF0MTF MGY MGY
MGYI I
I
11
1
MSe
MSeMSe
MTF
MSe
MSe
MGY MGY
MGYI I
I
11
1
MSe
MSeMSe
MSe
1
MTF
1
1
ò
MSeMSeMSe
1
MR
MRMR
MR
MRMR
1

Angular velocityfrom previous link
Joint velocity
angular velocityof the manipulator
PV1 TFM1
TFM1PVM1
Ix1+Iax1Iy1+Iay1
Iz1+Iaz1
m1+ma1
Tip velocityof link1
TF1
TF2
TF3
Pad
Pad
Euler angles
Linear velocity of the base point w.r.t Inertial frame
TzTy
Tx
Ixx+Iax
wx*(Ixx+Iax)
wz*(Izz+Iaz)
wy*(Iyy+Iay)wz
wx
wyIzz+IazIyy+Iay
PV TF TF
Body fixedangularvelocity
Body fixedlinearvelocity
m+max
m+may m+maz
Euler angleTransformationmatrix
wx*(m+max)
wy*(m+may)wz*(m+maz)
Vx
Vy Vz
Angular velocity to first link of themanipulator
Tbx
TbyTbz FzFy
Fx Fbx
FbzFby
Wx1*(Ixx1+Iax1)
Wz1*(Izz1+Iaz1) Wy1*(Iyy1+Iay1)
Wz1
Wx1
Wy1
Angular velocityfrom previous link
Joint velocity
angular velocityof the manipulator
PV2 TFM2
TFM2PVM2 m2+ma2
Tip velocityof Link2
TF1
TF2
TF3Pad
Pad
Joint velocityPV3 TFM3
TFM3PVM3 m3+ma3
Tip velocityof the manipulator
TF1
TF2
TF3
Pad
Se 1
R
I
1
TF
TF
TF
0
1MGY MGY
MGY
I I
I
11
1
1
MTF MTF
MTF MTF
0
0 I0
MTF
1
1
Se
SeMR
MR
MR
MR
MTF0MTF MGY MGY
MGYI I
I
11
1
MSe
MSeMSe
MTF
MSe
MSe
MGY MGY
MGYI I
I
11
1
MSe
MSeMSe
MSe
1
MTF
1
1
ò
MSeMSeMSe
MR
MRMR
MR
MRMR
1 1
Se 1
R
I
1
TF
TF
TF
0 1 1
MTF MTF
MTF MTF
0
0 I0
MTF
1
1
Se
SeMR
ADL2
Se 1
R
I
1
TF
TF
TF
0 1 1
MTF MTF
MTF MTF
0
0 I0
MTF
1
1
Se
SeMR
Pad
ADL3
Link1 1111asffa11
Link 2 221
Link 3 221

Advantages and disadvantages of modelling and simulation
Advantages• Virtual experiments (i.e. simulations) require less resources• Some system states cannot be brought about in the real
system, or at least not in a non-destructive manner ( crash test, deformations etc.)
• All aspects of virtual experiments are repeatable, something that either cannot be guaranteed for the real system or would involve considerable cost.
• Simulated models are generally fully monitorable. All output variables and internal states are available.
• In some cases an experiment is ruled out for moral reasons, for example experiments on humans in the field of medical technology.

Disadvantages:
•Each virtual experiment requires a complete, validated and verified modelling of the system.
•The accuracy with which details are reproduced and the simulation speed of the models is limited by the power of the computer used for the simulation.
SUMMARY Modelling and simulation plays a vital role in various stages of the system design
Data Modelling, Process Modelling and Behavior modelling helps in the early stages to understand the system behavior and simulate scenarios
Dynamic system models help in understanding the dynamic behavior of hardware systems and their performance in the time domain and frequency domain.
Physical system based methods like bond graph method helps in modelling and simulation of muti-domain engineering systems.


