46
Principles of Phased Array Systems A graduate course in Electronics Tutorial II Dr. Mohammad Fakharzadeh [email protected] Room 511 Sharif University of Technology Tehran, Iran

Principles of Phased Array SystemsA graduate course in Electronics
Tutorial II
Dr. Mohammad [email protected]
Room 511
Sharif University of Technology
Tehran, Iran

Phased Array Applications
2/8/20152012 IEEE APS Chicago 2

Phased Array Applications
A system not an antenna
6 Decades of service
Military & civil applications
Surveillance
Target Tracking
Missile Guidance
Target Identification
Multi-function System
ECM, ECCM
Civil Applications:
Meteorology
Air Traffic Control
Mobile Satellite Systems
Radar and Imaging
Radio Astronomy
Smart Antenna for WLAN or Cellular networks
Millimeter-wave wireless networks
2/8/20152012 IEEE APS Chicago 3

Mobile Satellite Systems
Conformal and Flexible
Low Profile
Signal Processing Power
h > 40 cm
h~5-6 cm
Mobile Ku-band Satellite Rx
Developed at Intelwaves Technologies
– University of Waterloo, Canada 2/8/20152012 IEEE APS Chicago 4

Agile or Shaped BeamMultifunction Radar Interference Cancellation
Phased Array Applications (2)
30
210
240
270
300330
0
Phased array provides a high Effective Isotropic Radiated Power (EIRP)
2/8/20152012 IEEE APS Chicago 5

NEXRAD-PAR Reflectivity Comparison
NWRT Volume Scan in less than 1 min. KTLX Volume Scan took 4.2 mins.
2nd Trip
NWRT
Phased Array Radar
KTLX
WSR-88D

Composite Reflectivity: SPY-1 v. WSR-88DHurricane Fran Remnants
SPY-1 NEXRAD
Note heavy
rain areas
several second
volume scan
5 minute
volume scan

Spatial Power Combination
Spatial Power Combination 20 log10 (N)
– CMOS/SiGe Technology
– At mm-wave Pout,PA<10dBm, GLNA<14dB
Pow
er
(dB
m)
UCSD2/8/20152012 IEEE APS Chicago 8

Phased array spike sorting
0.139
0.544
Ey1n t( )
1.2 104
0 t
0.056
0.205
Ey2n t( )
1.2 104
0 t
0.042
0.187
Ey3n t( )
1.2 104
0 t
Sorted
Spike of
individual
neurons.
12
34
1 65
67
89
1 4
1 5
1 3
1 2
1 1
1 0
0.139
0.534
Rn 3 t( )
1.2 104
0 t
0.183
0.539
Rn 5 t( )
1.2 104
0 t
0.147
0.534
Rn 7 t( )
1.2 104
0 t
0.147
0.534
Rn 9 t( )
1.2 104
0 t
0.183
0.539
Rn 11 t( )
1.2 104
0 t
0.139
0.534
Rn 13 t( )
1.2 104
0 t
0.14
0.534
Rn 1 t( )
1.2 104
0 t
0.148
0.534
Rn 15 t( )
1.2 104
0 t
Neuronal
spikes
recorded by
electrode
array
Ph
ased
arr
ay s
pik
e s
ort
ing
syste
m
Center for Computational Biology, MSU

10
BLINDSPOT
DETECTION
ADAPTIVE CRUISE
CONTROL
PARKING
ASSISTANCE
Automotive Radar
24GHz 60GHz 77GHz
Vehicular RadarWireless Communications
Fully-integrated silicon-based multiple-antenna systems enable
widespread commercial applications at high frequencies.
Complex, novel architectures can be realized on silicon
with greater reliability and lower cost.

Cost and Complexity
Bandwidth
Calibration
Beamforming
Phased Array Drawbacks
Pave Paws
PATRIOT
2/8/20152012 IEEE APS Chicago 11

Bose before Marconi
2/8/20152012 IEEE APS Chicago 12
THE WORK OF JAGADIS CHANDRA BOSE:
100 YEARS OF MM-WAVE RESEARCH
(last revised February 1998) D.T. Emerson National Radio Astronomy
Observatory(1)
949 N. Cherry Avenue Tucson, Arizona 85721
E-mail: [email protected]

2/8/20152012 IEEE APS Chicago 13

2/8/20152012 IEEE APS Chicago 14

2/8/20152012 IEEE APS Chicago 15

2/8/20152012 IEEE APS Chicago 16

2/8/20152012 IEEE APS Chicago 17

2/8/20152012 IEEE APS Chicago 18

2/8/20152012 IEEE APS Chicago 19
60-GHz PA and LNA in 90-nm RF-CMOS 20
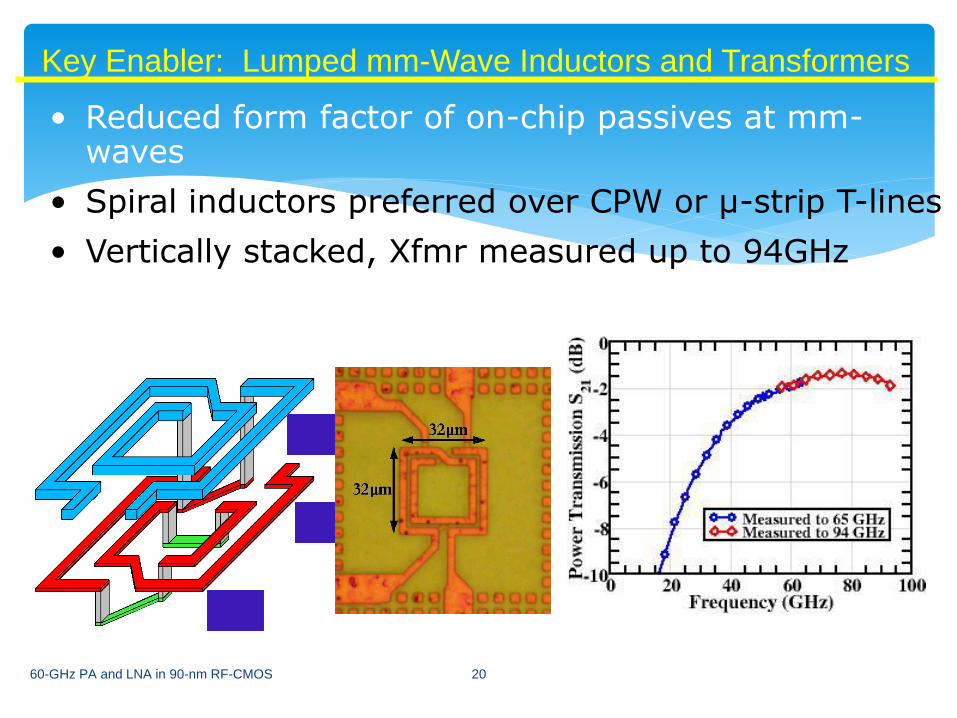
Key Enabler: Lumped mm-Wave Inductors and Transformers
• Reduced form factor of on-chip passives at mm-waves
• Spiral inductors preferred over CPW or µ-strip T-lines
• Vertically stacked, Xfmr measured up to 94GHz
• Inductors and Xfmrs modeled using ASITIC® >90% accuracy
Measured transformer power transfer up to 94GHz
1:1 vertically stacked transformer in 90-nm CMOS

November 11, 200321
60 GHz Band
57 GHz 64 GHz
Unlicensed band governed by Part 15.225
15 dB/Km of O2 absorption
Robust PHY layer security
High frequency reuse
Connectivity up to 10 Gbps
Currently used in MAN and campus networks
New commercial applications: mmwLAN and PAN

November 11, 200322
70 & 80 GHz Allocation
71 GHz 76 GHz
72.25 73.50 74.75
81 GHz 86 GHz
82.25 83.50 84.75
FCC opened these bands for commercial use in October 2003
Divided into 4 unpaired segments per band
Segments may be aggregated
Cross band aggregation permitted with some restriction
“Pencil-beam” applications
License based on interference protection on a link-by-link basis

November 11, 200323
90 GHz Allocation
92 GHz
94.0 94.1
95 GHz
FCC opened these bands for commercial use in October 2003
Divided into 2 unpaired segments
94 GHz to 94.1 GHz allocated for exclusive Federal use
Segments may be aggregated
License based on interference protection on a link-by-link basis
for outdoor use
No license required for indoor use
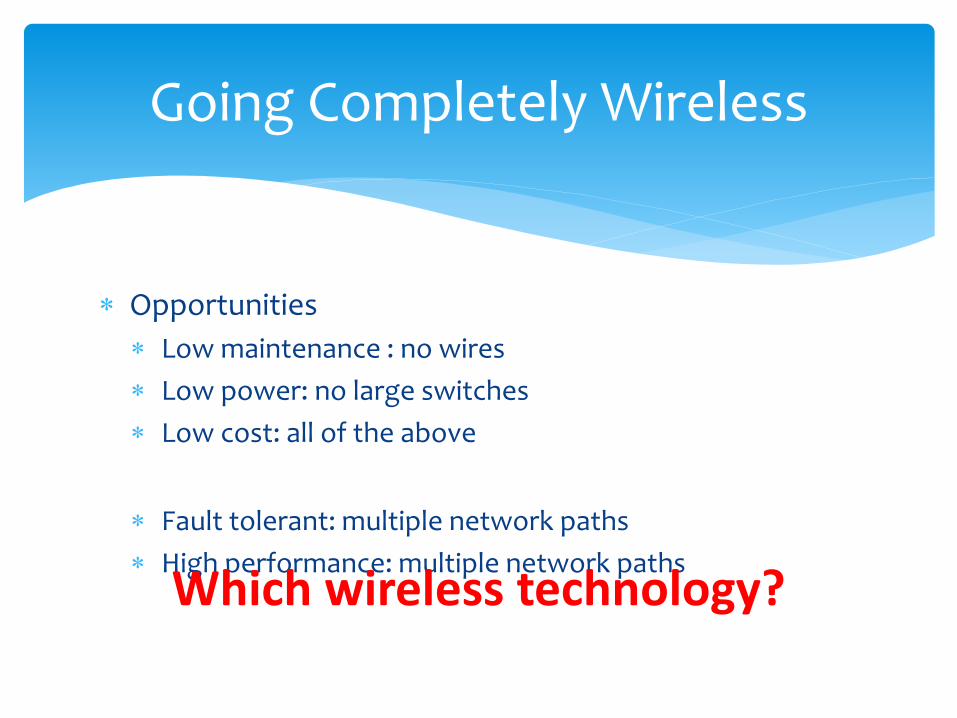
Going Completely Wireless
Opportunities
Low maintenance : no wires
Low power: no large switches
Low cost: all of the above
Fault tolerant: multiple network paths
High performance: multiple network pathsWhich wireless technology?

60GHz Wireless Technology Short range
Attenuated by oxygen molecules
Directional
Narrow beam
High bandwidth
Several to over 10Gbps
License free
Has been available for many years
25
Why now?• CMOS Integration
- Size < dime
- Manufacturing cost < $1
[Pinel ‘09]
7 m
m
5 mm
Rx Tx

60 GHz Antenna Model One directional
Signal angle between 25°and 45°
Maximum range < 10 m
No beam steering
Bandwidth < 15Gbps
TDMA (TDD)
FDMA (FDD)
Power at 0.1 – 0.3W
How to integrate to datacenters?

Relationship Between Wavelength and Frequency
Speed of light: 3e8 m/s
(Speed of light) = (Wavelength) x (Frequency)
c = ln
1 GHz 30 cm
30 GHz 10 mm
60 GHz 5 mm
300 GHz 1mm

Microwave and mm-Wave Band
Designations

Millimeter Telescopes
MOPRA
Australia
22m
LMT
Mexic
o
50m
APEX
Chile
12m
IRAM
30m
Spain
Nobeyaa
Japan
45m
CSO
Hawaii
10.4m
JCMT
Hawa
ii 15m
SMT
Arizona
10m
Onsala
Sweden
20m
GBT
West
Virginia
100m
ASTE
Chile
10m
ARO
12m
Arizona
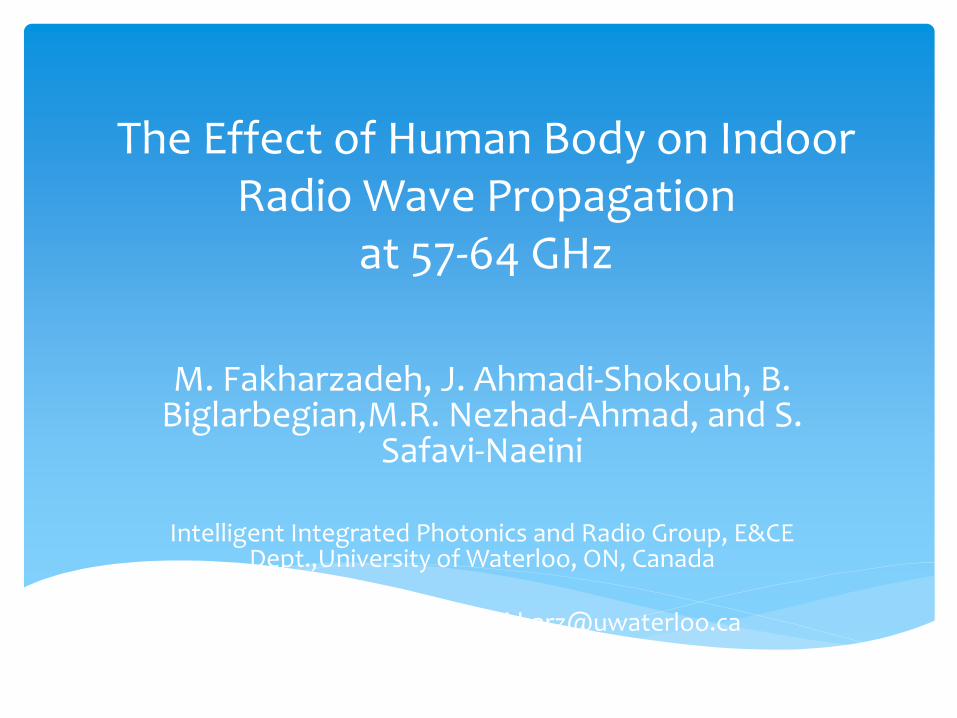
The Effect of Human Body on Indoor Radio Wave Propagation
at 57-64 GHz
M. Fakharzadeh, J. Ahmadi-Shokouh, B. Biglarbegian,M.R. Nezhad-Ahmad, and S.
Safavi-Naeini
Intelligent Integrated Photonics and Radio Group, E&CE Dept.,University of Waterloo, ON, Canada
Tel. +1(519) 721-5551, Email: [email protected]

Outline
Introduction
Ray-tracing Analysis
Experimental Results
Conclusion

Motivation Seven GHz bandwidth around 60 GHz frequencies has been
released to develop high-rate short-range wireless data communication.
A regular propagation phenomenon is the shadowing of the Line-of-Sight (LOS) link caused by moving people.
One research shows this phenomenon disconnects the LOS link for 2% of the time [1].
It must be determined that how much attenuation is caused by a human body obscuring the LOS path.

A
B
C
D
1.17cm
2m
1m
TX
RX1.2cm
Ray-tracing analysisIn this work, a 3-D ray-tracing modeling, Geometrical Optics plus diffraction, is employed to evaluate the signal coverage at 60GHz frequency range for a regular office area. Test Area
Tx
Rx
1m
1.17m
1.2m
Win
do
w
Win
do
w
Wh
ite
bo
ard
Whiteboard
Window
do
or
Simplified map of a seminar room used to study
the human body effects on wave propagation.

A
B
C
D
1.17cm
2m
1m
TX
RX1.2cm
Simulation Environments Size of the room was 7.42m ×
6.25m × 2.73 (l×w×h). A and B in were partially covered
by whiteboards ( high reflection coefficient)
Two layer windows had been installed on wall C and parts of the wall B and D.
A big conference table and large-screen TV .
The floor was covered by carpet.
The top left corner of the room, in proximity to whiteboards, was designated to the test area.

Ray-Tracing Modeling The empirical data reported in [2] and [3]
was used to calculate the reflection coefficients of the material in the room.
Measured permittivity data for biological tissues in [4] was used.
Two horn antennas with 24dB gain at 60GHz and roughly 10° beamwidth were used as the transmitter and receiver antennas.
Such directive antennas are used To provide the radiation gain required
to combat high path loss at mm-wave range
To attenuate the multipath components from Non-Line-Of-Sight (NLOS) directions.
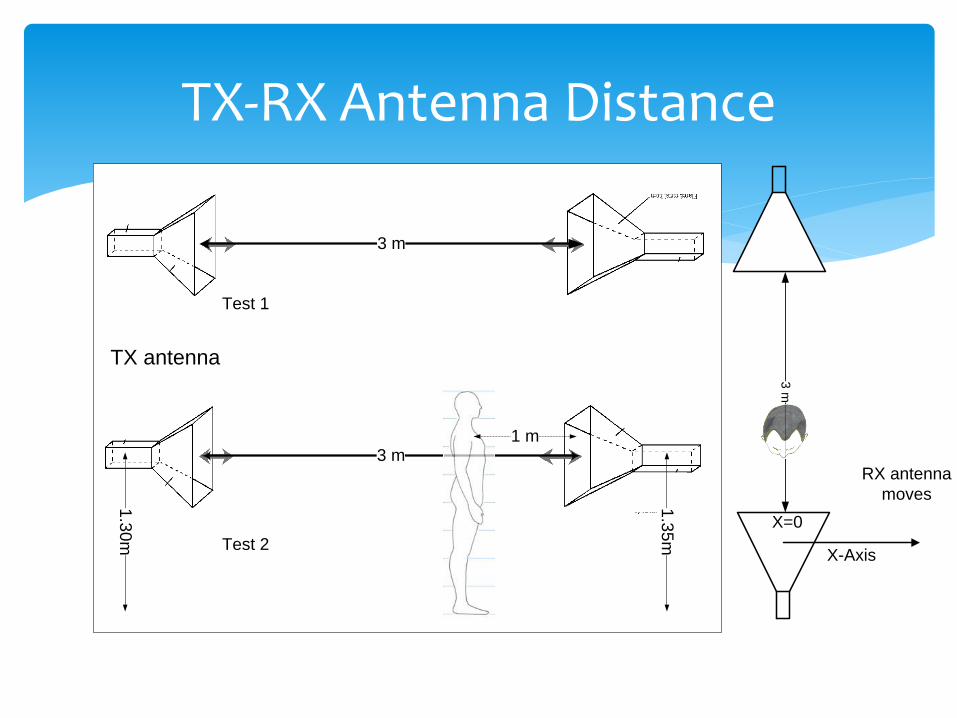
TX-RX Antenna Distance
3 m
3 m1 m
Test 1
Test 2X-Axis
3 m
X=0
RX antenna
moves
1.3
5m
1.3
0m
TX antenna

Ray-Tracing Scenario
The RX antenna was moved along a horizontal line, in steps of 1mm, to cover a distance of ±60cm around the initial position.
The total received power of all rays was calculated at each RX antenna position.
This procedure was repeated at three frequencies, 57, 60 and 64GHz, with and without human body to find the shadowing loss.

-60 -40 -20 0 20 40 60-50
-45
-40
-35
-30
-25
-20
-15
-10
-5
0
X distance, cm
Lo
ss, d
B
f=64 GHz
f=60 GHz
f=57 GHz
Ray-tracing Results
Maximum attenuation occurs around x=0cm (> 40dB).
The attenuation is larger for higher frequencies.
Received power is almost symmetrical around x=0.
Maximum attenuation varies from 45 to 50 dB for different frequencies.

Test Set-up
Fig. 5 Left: Test set-up. Top-Right: Source
and transmitter antenna. Bottom-Right:
Receiver antenna and spectrum analyzer.

Measured Spectrum (LOS)
To measure the shadowing
loss of the human body, the
RX antenna was moved in
steps of 5cm.
At each point the received
power spectrum was
measured at 57, 60 and
64GHz.

Experimental Results
-60 -40 -20 0 20 40 60-50
-40
-30
-20
-10
0
10
X distance, cm
Loss,
dB
Comparison of RT and Measured results at 57-64 GHz
f=64, RT
f=60,RT
f=57,Rt
f=57, M
f=60,M
f=64,M
Measurements
Ray-tracing
There is a good
agreement between the
simulation and
measurement results
from x=-10 to x=60cm.
Maximum measured
loss is around 40dB
which occurs when the
human body blocks the
LOS path completely.

Conclusion
In conclusion, it was shown that the shadowing loss of the human body at 57-64GHz can exceed 40dB.
Ray-tracing analysis provides good approximation of the wave propagation at this frequency range.
These results are of crucial importance for link budget design of 60 GHz indoor wireless networks.

2/8/20152012 IEEE APS Chicago 43
Multi-Gigabit/sec Data Transmission
Article of month Feb 2014
2/8/20152012 IEEE APS Chicago 44

2/8/20152012 IEEE APS Chicago 45
802.11AD

2/8/20152012 IEEE APS Chicago 46


