Page 1
January 8, 2017 Analyst: Depesh Kashyap,CFA [email protected] (+91-7228934327) Page 1 of 35
Before reading this report, you must refer to the disclaimer on the last page.
© 2017 Equirus All rights reserved
Print Media
Overweight
Initiating coverage: India still waking up to newspapers
S
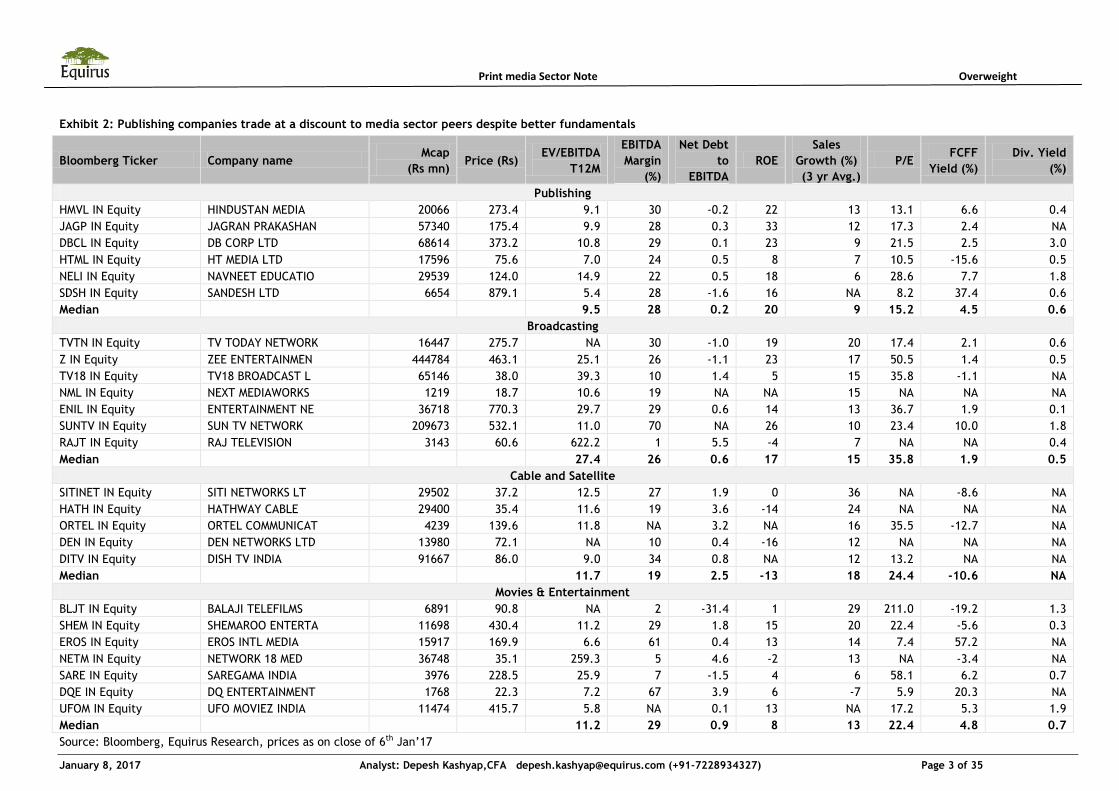
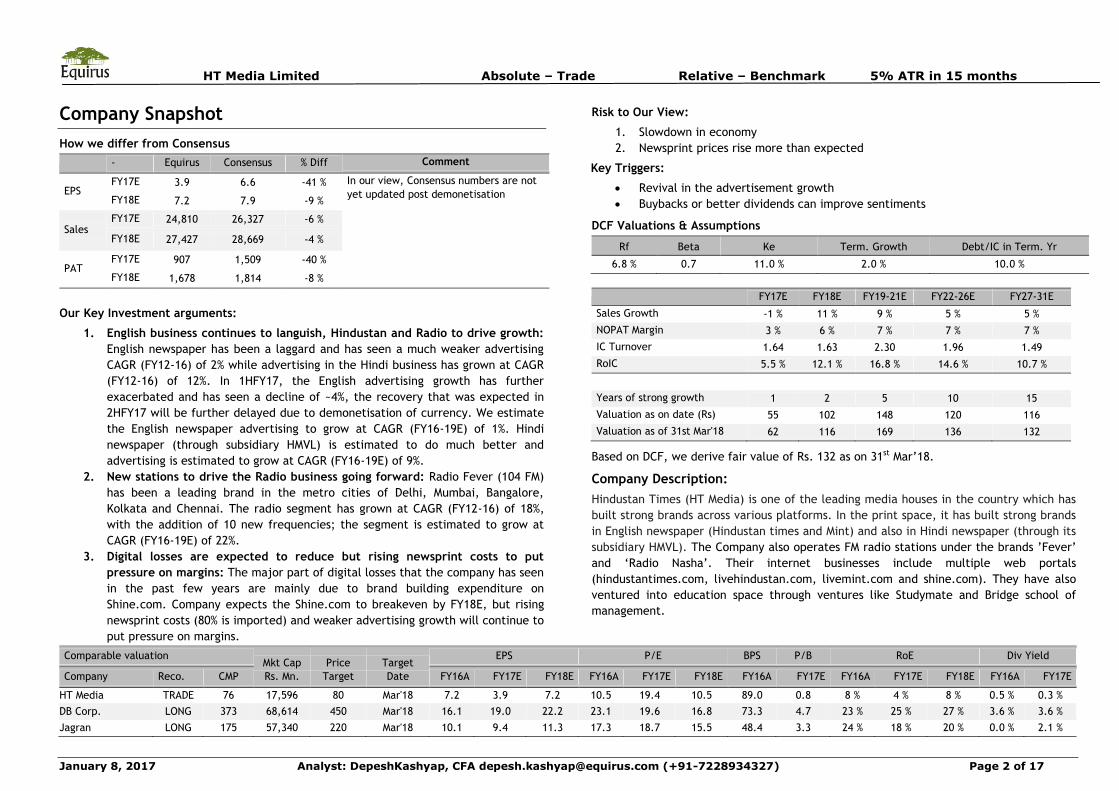
Publishing companies’ trade at a discount to other media companies despite better
fundamentals: Despite having better profitability, stronger balance sheets and higher
cash flow generation, print media companies trade at a discount to other media
companies. Due to the decline of newspaper industry in the West, market doubts the
longevity of the business in India as well. The demonetisation of currency has hurt the
advertising revenues and rising newsprint costs has further added to the worries. We
contend that unlike West, print industry is still emerging in India and the newsprint costs
may not rise more than 5-6%, but if they do, companies are in a better position to handle
the costs. We initiate our coverage on print media stocks with Long rating on DB Corp,
Jagran Prakashan, HMVL and Trade rating on HT Media. DB Corp (on the back of dominant
position and strong election pipeline) and HMVL (most attractively valued) are our top
picks in the sector.
Structural headwinds pose no immediate threats; Print is still emerging in India: We
argue that print sector in India is at a different stage as compared to the West mainly
because:
1. Far from being mature, Print is still emerging: Print media is estimated to
grow at a CAGR (FY15-20E of ~8%) and Hindi/Vernacular media is estimated to
grow even better at a CAGR (FY15-20E) of ~10%.
2. Less dependence on classified advertisement: It forms only 8-10% of Indian
newspaper revenues as compared to the US where it was a major contributor to
ad revenues (~ 40%).
3. Cost advantage: In the US, daily cost of newspaper is around USD 3-5, which is
the monthly cost of newspapers in India.
4. Low internet penetration in India: Internet penetration in India currently
stands at only 27% whereas in US/UK, it is around 90%, which has given
Companies time to diversify into radio businesses and develop their digital
portfolios.
Exhibit 1: Initiating coverage on DB Corp, Jagran Prakashan, HMVL and HT Media
Question that matters: “Where are we in the cycle?” High dependence on advertising
revenues makes newspaper business highly dependent on economic cycles. We argue that
the advertisement cycle in India continues to remain favourable on the back of:
1. Increasing consumption in tier 2 & 3 cities
2. Implementation of 7th pay commission
3. Easing of policy rates
4. Pipeline of elections in the states of UP & Punjab in FY17, Gujarat in FY18, and
MP & Rajasthan elections expected in FY19
Newsprint costs may increase by 5-6% but not more: With declining demand of
newsprint from publishing companies in the West, we see a structural reason why
newsprint cost may not see its previous highs. Even if it rises, there are various tools in
the hands of publishing companies like reducing the pagination, using paper of lower
grammage, reducing subscription discounts, using more of domestic paper, increasing ad-
edit ratio, through which they can manage the costs. Higher growth in advertising
revenues will provide positive leverage which will support the margins.
Differentiating factors: Our comparative analysis of the business segments across
companies suggests that in Print segment: DB Corp is our marginal favourite over Jagran.
Radio segment: With the acquisition of Radio city, Jagran has leaped ahead of peers.
Digital segment: HT Media with much higher investments in the digital space is ahead of
the pack in our view.
Initiating coverage on print media sector with Long rating on DB Corp, Jagran
Prakashan, HMVL and trade rating on HT Media. DB Corp (on the back of dominant
position and strong election pipeline) and HMVL (most attractively valued) are our top
picks in the sector.
Company Rating Mkt cap (Rs
mn)
Current Price
(Rs)
Target Price
(Rs) Upside(%)
P/E
(FY18e)
EV/EBITDA
(FY18e)
P/B
(FY18e)
EBITDA CAGR
(FY16-19e)
RoE
(FY18e)
Core RoIC
(FY18e)
Div.Yield(%)
(FY18e)
FCF Yield(%)
(FY18e)
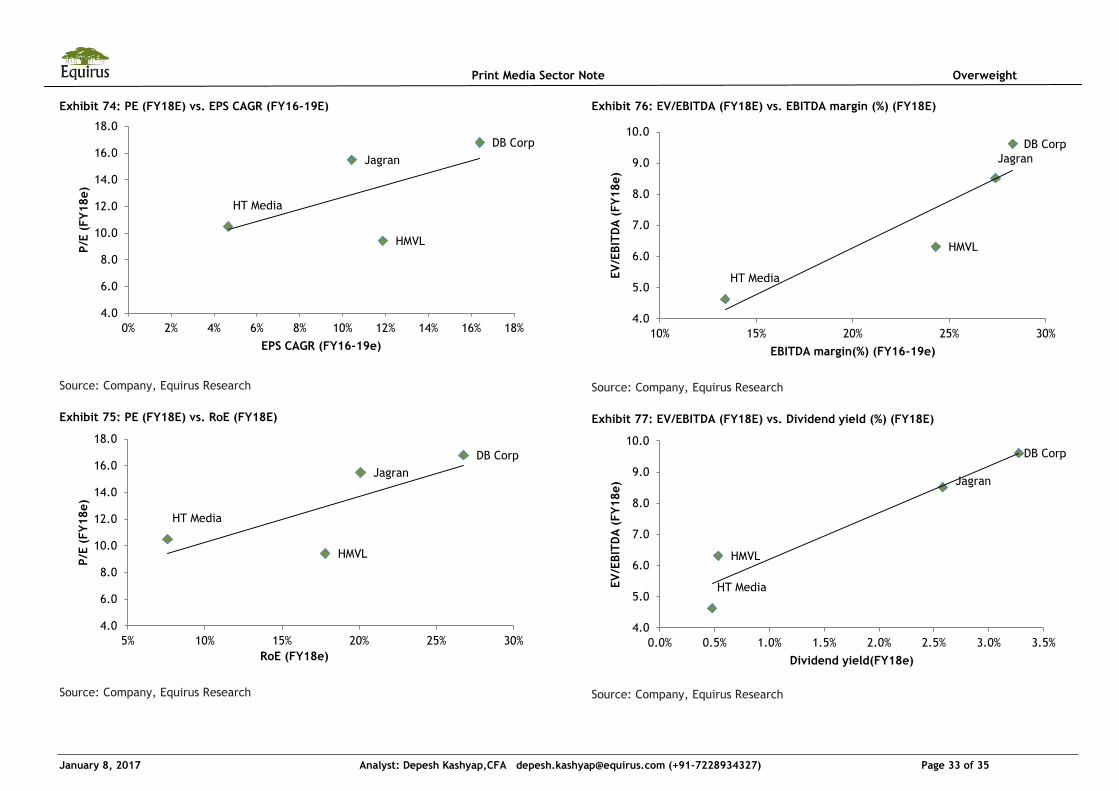
DB Corp Long 68,614 373 450 21% 16.8 9.6 4.3 14% 27% 28% 3.3% 6.1%
Jagran Long 57,340 175 220 25% 15.5 8.5 3.0 9% 20% 20% 2.6% 7.6%
HMVL Long 20,066 273 370 35% 9.4 6.3 1.5 11% 18% 46% 0.5% 7.4%
HTML Trade 17,596 76 80 6% 10.5 4.6 0.8 9% 8% 12% 0.5% 14.2%
Source: Equirus Research
Page 2
Print media Sector Note Overweight
January 8, 2017 Analyst: Depesh Kashyap,CFA [email protected] (+91-7228934327) Page 2 of 35
Contents
Structural downturn argument poses no immediate concerns ........................... 4
Threat of Digital: How are we placed vs. Developed world? ................................ 4 What led to decline of newspapers in developed world?: US Case study ....... 4 Why Indian print sector is different from the developed world? ..................... 6
Print media in India is still emerging ....................................................................... 8
Mind the language: Regional to outperform English on the back of large
untapped rural population .......................................................................................... 9
Future ready: Diversifying business ........................................................................ 12 Expanding the digital bouquet ............................................................................. 12 Emergence of radio as “Reach” platform .......................................................... 13
Question that matters: “Where are we in the cycle”? .......................................15
Business economics: How do newspapers make money? ...................................... 15
Print advertisement cycle: Remains favourable? ................................................. 17
Newsprint cycle: Rising costs a concern… .............................................................. 21
…but margins may not have much effect ............................................................... 22 1. Decreasing demand from the global publishing companies: ................. 22 2. Few tools in the hands of newspaper companies .................................... 23 3. Case of positive operating leverage .......................................................... 24
Differentiating factors: A bare comparison ...........................................................24
Dainik Bhaskar has the most diversified print business ................................... 25 Jagran clearly leads the pack with its Radio business ..................................... 27 HT media is way ahead with its Digital strategy .............................................. 29
Valuation: EV/EBITDA is our preferred methodology ..........................................31
Valuation summary ..................................................................................................... 31
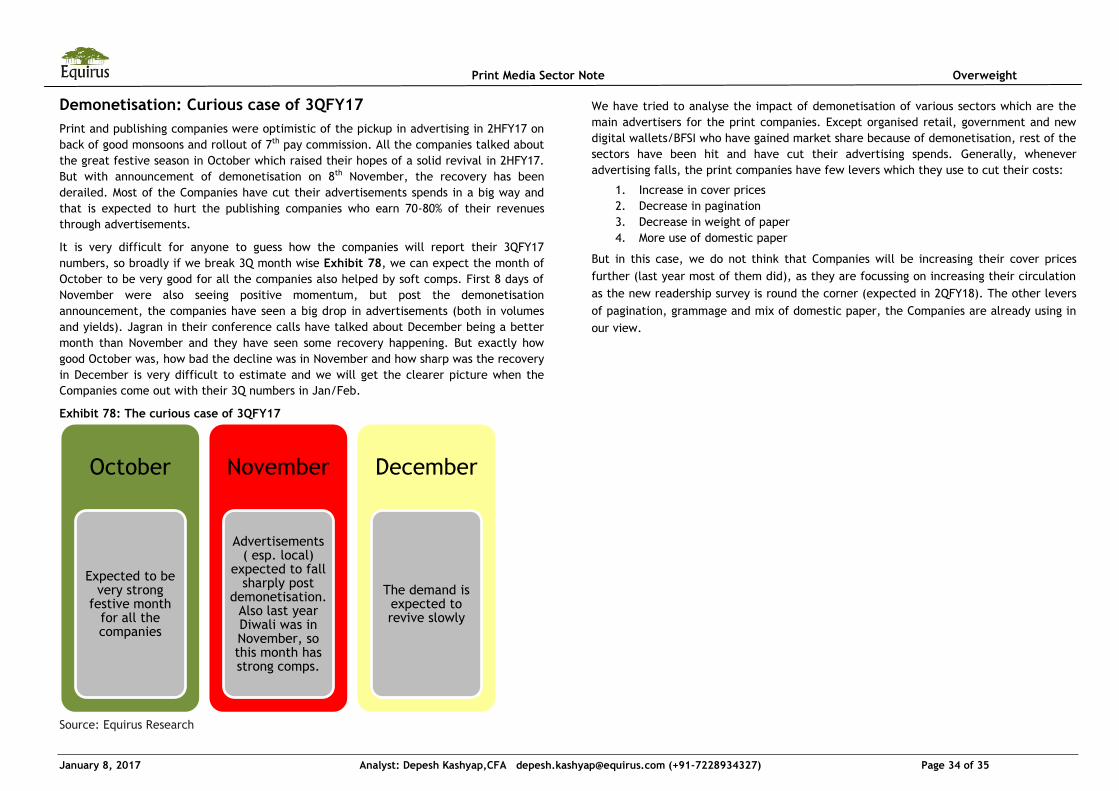
Demonetisation: Curious case of 3QFY17 .............................................................34
Company Sections DB Corp: Diversified play on India’s print story....................................36
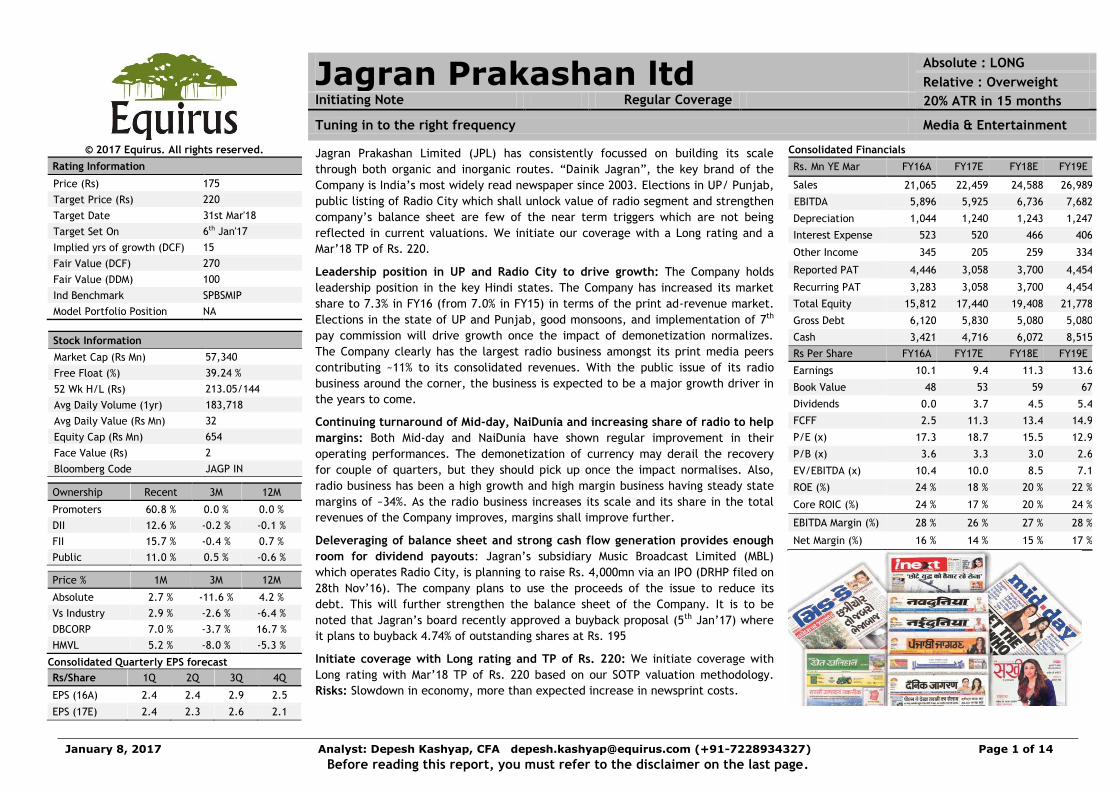
Jagran Prakashan: Tuning in to the right frequency................................50
HMVL: Watch out for ’Money in the Bank’...........................................64
HT Media: Still time before it Shines.................................................77
Page 3
Print media Sector Note Overweight
January 8, 2017 Analyst: Depesh Kashyap,CFA [email protected] (+91-7228934327) Page 3 of 35
Exhibit 2: Publishing companies trade at a discount to media sector peers despite better fundamentals
Bloomberg Ticker Company name Mcap
(Rs mn) Price (Rs)
EV/EBITDA
T12M
EBITDA
Margin
(%)
Net Debt
to
EBITDA
ROE
Sales
Growth (%)
(3 yr Avg.)
P/E FCFF
Yield (%)
Div. Yield
(%)
Publishing
HMVL IN Equity HINDUSTAN MEDIA 20066 273.4 9.1 30 -0.2 22 13 13.1 6.6 0.4
JAGP IN Equity JAGRAN PRAKASHAN 57340 175.4 9.9 28 0.3 33 12 17.3 2.4 NA
DBCL IN Equity DB CORP LTD 68614 373.2 10.8 29 0.1 23 9 21.5 2.5 3.0
HTML IN Equity HT MEDIA LTD 17596 75.6 7.0 24 0.5 8 7 10.5 -15.6 0.5
NELI IN Equity NAVNEET EDUCATIO 29539 124.0 14.9 22 0.5 18 6 28.6 7.7 1.8
SDSH IN Equity SANDESH LTD 6654 879.1 5.4 28 -1.6 16 NA 8.2 37.4 0.6
Median
9.5 28 0.2 20 9 15.2 4.5 0.6
Broadcasting
TVTN IN Equity TV TODAY NETWORK 16447 275.7 NA 30 -1.0 19 20 17.4 2.1 0.6
Z IN Equity ZEE ENTERTAINMEN 444784 463.1 25.1 26 -1.1 23 17 50.5 1.4 0.5
TV18 IN Equity TV18 BROADCAST L 65146 38.0 39.3 10 1.4 5 15 35.8 -1.1 NA
NML IN Equity NEXT MEDIAWORKS 1219 18.7 10.6 19 NA NA 15 NA NA NA
ENIL IN Equity ENTERTAINMENT NE 36718 770.3 29.7 29 0.6 14 13 36.7 1.9 0.1
SUNTV IN Equity SUN TV NETWORK 209673 532.1 11.0 70 NA 26 10 23.4 10.0 1.8
RAJT IN Equity RAJ TELEVISION 3143 60.6 622.2 1 5.5 -4 7 NA NA 0.4
Median
27.4 26 0.6 17 15 35.8 1.9 0.5
Cable and Satellite
SITINET IN Equity SITI NETWORKS LT 29502 37.2 12.5 27 1.9 0 36 NA -8.6 NA
HATH IN Equity HATHWAY CABLE 29400 35.4 11.6 19 3.6 -14 24 NA NA NA
ORTEL IN Equity ORTEL COMMUNICAT 4239 139.6 11.8 NA 3.2 NA 16 35.5 -12.7 NA
DEN IN Equity DEN NETWORKS LTD 13980 72.1 NA 10 0.4 -16 12 NA NA NA
DITV IN Equity DISH TV INDIA 91667 86.0 9.0 34 0.8 NA 12 13.2 NA NA
Median
11.7 19 2.5 -13 18 24.4 -10.6 NA
Movies & Entertainment
BLJT IN Equity BALAJI TELEFILMS 6891 90.8 NA 2 -31.4 1 29 211.0 -19.2 1.3
SHEM IN Equity SHEMAROO ENTERTA 11698 430.4 11.2 29 1.8 15 20 22.4 -5.6 0.3
EROS IN Equity EROS INTL MEDIA 15917 169.9 6.6 61 0.4 13 14 7.4 57.2 NA
NETM IN Equity NETWORK 18 MED 36748 35.1 259.3 5 4.6 -2 13 NA -3.4 NA
SARE IN Equity SAREGAMA INDIA 3976 228.5 25.9 7 -1.5 4 6 58.1 6.2 0.7
DQE IN Equity DQ ENTERTAINMENT 1768 22.3 7.2 67 3.9 6 -7 5.9 20.3 NA
UFOM IN Equity UFO MOVIEZ INDIA 11474 415.7 5.8 NA 0.1 13 NA 17.2 5.3 1.9
Median
11.2 29 0.9 8 13 22.4 4.8 0.7
Source: Bloomberg, Equirus Research, prices as on close of 6th Jan’17
Page 4
Print media Sector Note Overweight
January 8, 2017 Analyst: Depesh Kashyap,CFA [email protected] (+91-7228934327) Page 4 of 35
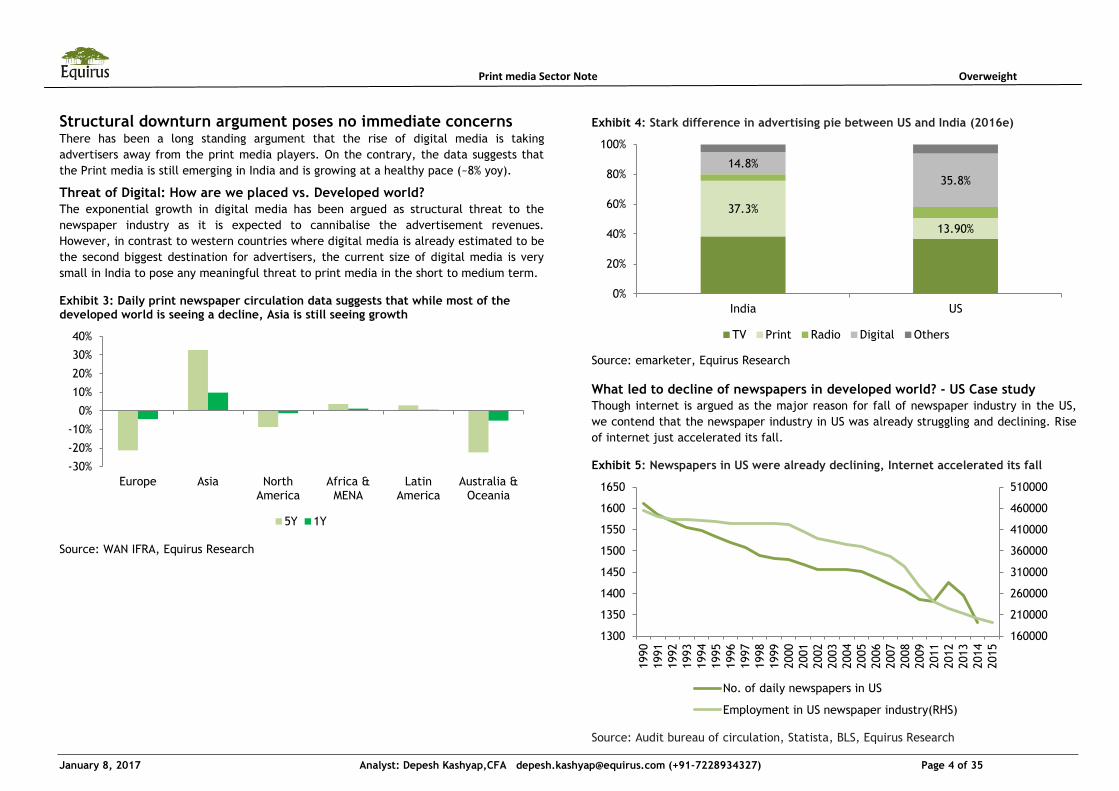
Structural downturn argument poses no immediate concerns There has been a long standing argument that the rise of digital media is taking
advertisers away from the print media players. On the contrary, the data suggests that
the Print media is still emerging in India and is growing at a healthy pace (~8% yoy).
Threat of Digital: How are we placed vs. Developed world?
The exponential growth in digital media has been argued as structural threat to the
newspaper industry as it is expected to cannibalise the advertisement revenues.
However, in contrast to western countries where digital media is already estimated to be
the second biggest destination for advertisers, the current size of digital media is very
small in India to pose any meaningful threat to print media in the short to medium term. Exhibit 3: Daily print newspaper circulation data suggests that while most of the developed world is seeing a decline, Asia is still seeing growth
Source: WAN IFRA, Equirus Research
Exhibit 4: Stark difference in advertising pie between US and India (2016e)
Source: emarketer, Equirus Research
What led to decline of newspapers in developed world? - US Case study
Though internet is argued as the major reason for fall of newspaper industry in the US,
we contend that the newspaper industry in US was already struggling and declining. Rise
of internet just accelerated its fall. Exhibit 5: Newspapers in US were already declining, Internet accelerated its fall
Source: Audit bureau of circulation, Statista, BLS, Equirus Research
-30%
-20%
-10%
0%
10%
20%
30%
40%
Europe Asia North America
Africa & MENA
Latin America
Australia & Oceania
5Y 1Y
37.3%
13.90%
14.8%
35.8%
0%
20%
40%
60%
80%
100%
India US
TV Print Radio Digital Others
160000
210000
260000
310000
360000
410000
460000
510000
1300
1350
1400
1450
1500
1550
1600
1650
1990
1991
1992
1993
1994
1995
1996
1997
1998
1999
2000
2001
2002
2003
2004
2005
2006
2007
2008
2009
2011
2012
2013
2014
2015
No. of daily newspapers in US
Employment in US newspaper industry(RHS)
Page 5
Print Media Sector Note Overweight
January 8, 2017 Analyst: Depesh Kashyap,CFA [email protected] (+91-7228934327) Page 5 of 35
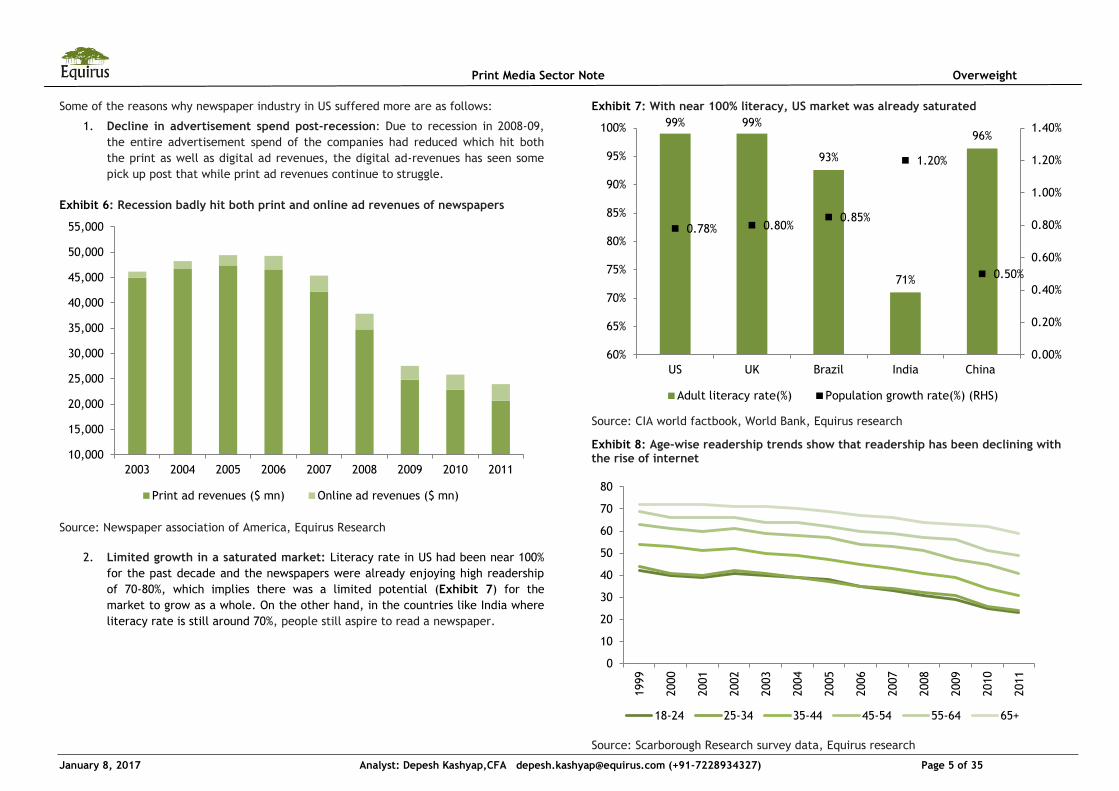
Some of the reasons why newspaper industry in US suffered more are as follows:
1. Decline in advertisement spend post-recession: Due to recession in 2008-09,
the entire advertisement spend of the companies had reduced which hit both
the print as well as digital ad revenues, the digital ad-revenues has seen some
pick up post that while print ad revenues continue to struggle.
Exhibit 6: Recession badly hit both print and online ad revenues of newspapers
Source: Newspaper association of America, Equirus Research
2. Limited growth in a saturated market: Literacy rate in US had been near 100%
for the past decade and the newspapers were already enjoying high readership
of 70-80%, which implies there was a limited potential (Exhibit 7) for the
market to grow as a whole. On the other hand, in the countries like India where
literacy rate is still around 70%, people still aspire to read a newspaper.
Exhibit 7: With near 100% literacy, US market was already saturated
Source: CIA world factbook, World Bank, Equirus research
Exhibit 8: Age-wise readership trends show that readership has been declining with the rise of internet
Source: Scarborough Research survey data, Equirus research
10,000
15,000
20,000
25,000
30,000
35,000
40,000
45,000
50,000
55,000
2003 2004 2005 2006 2007 2008 2009 2010 2011
Print ad revenues ($ mn) Online ad revenues ($ mn)
99% 99%
93%
71%
96%
0.78% 0.80% 0.85%
1.20%
0.50%
0.00%
0.20%
0.40%
0.60%
0.80%
1.00%
1.20%
1.40%
60%
65%
70%
75%
80%
85%
90%
95%
100%
US UK Brazil India China
Adult literacy rate(%) Population growth rate(%) (RHS)
0
10
20
30
40
50
60
70
80
1999
2000
2001
2002
2003
2004
2005
2006
2007
2008
2009
2010
2011
18-24 25-34 35-44 45-54 55-64 65+
Page 6
Print Media Sector Note Overweight
January 8, 2017 Analyst: Depesh Kashyap,CFA [email protected] (+91-7228934327) Page 6 of 35
3. High dependence on classified revenues: Revenues from classified
advertisements contributed nearly 40% to the total revenues of the newspaper
company, with main contributions from recruitment, real estate and auto
advertisements. With the rise of free classified sites like Craigslist.org,
Realtor.com, Monster.com etc all these advertisements shifted to various
job/housing portals which led to significant decline in revenues (see Exhibit 9).
Exhibit 9: Internet hurt classified revenues the most
Source: Newspaper association of America, Equirus Research
4. Limited number of large national players: Of the large number of US dailies,
there are only 3 major newspapers (The Wall Street Journal, The New York
Times and USA Today) which circulate at national level. Most of the other
newspapers serve local communities and generally have monopoly in their
localities. So, this was the main reason, why various newspapers were not able
to grow their circulation levels beyond a certain level and were heavily
dependent on the advertisement revenues.
Why Indian print sector is different from the developed world?
The major reason for difference in India and other western countries is low internet
penetration in India (see Exhibit 10). Exhibit 10: Internet penetration is very low in India as compared to rest of the world
Source: FICCI KPMG, Equirus Research
Though internet penetration is increasing rapidly, there are few structural factors which
give us confidence that digital media will not be able to disrupt Indian print media in the
medium term:
i) Classified ads have a very small share: Before the digital era, Classified
ads used to constitute 40% of total ad revenues in US which has depleted to
18% as most of the classified ads have shifted to digital media. In India,
however, classified ads constitute only 7-8% of total ad revenue, so even if
that shifts to digital, the impact will not be big. The diversion of the
revenues in India started with the job market when a lot of jobs classified
had moved to digital medium like Naukri.com, Shine.com etc. Housing and
matrimonial ads are also getting threatened by the new housing/matrimony
portals.
ii) Cost advantage: Newspapers in India are priced very low, which make them
very affordable. They cost no more than Rs. 200 per month (roughly USD 3)
which is close to the cost of a single newspaper per day in the US.
0.0
5.0
10.0
15.0
20.0
25.0
2000 2001 2002 2003 2004 2005 2006 2007 2008 2009 2010 2011
Total classified ad revenues ( $bn) Auto classifieds($bn)
Real estate classifieds ($bn) Recruitment classifieds ($bn)
Other classifieds ($ bn)
90% 87% 86%
60% 53%
46%
27%
10%
20%
30%
40%
50%
60%
70%
80%
90%
100%
UK US Japan Russia Brazil China India
Internet penetration
Page 7
Print Media Sector Note Overweight
January 8, 2017 Analyst: Depesh Kashyap,CFA [email protected] (+91-7228934327) Page 7 of 35
Exhibit 11: Cover prices in India are very affordable as compared to other countries
Source: FICCI-KPMG, Equirus Research
iii) Easy availability: Most of the newspapers in India are delivered to
customer’s home every morning, which makes it very accessible whereas in
the West, people generally buy newspapers from the stands or the metro
stations.
iv) Readership habits of the people: Most of the people start their day reading
a newspaper (see Exhibit 12: Indians start their day by reading a
newspaperExhibit 12); it has become a habit which is not easy to break.
While the youth in a household might have shifted to digital media, but the
members aged 35 years and above still prefer a physical copy.
Exhibit 12: Indians start their day by reading a newspaper
Source: FICCI KPMG report, Equirus Research
v) Just like TV, Digital media may end up complementing Print: Few years
back, most of the people argued that TV will take away the revenues from
Print media, but in hindsight, TV news channels, especially in regional
languages, have had a positive impact on newspaper circulation, as people
often turn to newspapers for elaborate analysis of the facts they see on TV.
In a similar manner, we digital news websites may end up complementing
newspapers.
It remains to be seen how the future pans out but one thing is certain that due to low
internet penetration, unlike the West, the disruption of print media will not be a near
term event. In the following section, we will see how the existing players in the print
media are already making huge investments to build a strong online presence and are
getting ready for the future.
2-3
4-6
18-20
22-24 23-25
0
5
10
15
20
25
30
India Pakistan Malaysia Hong Kong Singapore
Average monthly cover price ( in USD)
0%
2%
4%
6%
8%
10%
12%
14%
16%
6am
to 7
am
7am
to 8
am
8am
to 9
am
9am
to 1
0am
10am
to 1
1am
11am
to 1
2pm
12pm
to 1
pm
1pm
to 2
pm
2pm
to 3
pm
3pm
to 4
pm
4pm
to 5
pm
5pm
to 6
pm
6pm
to 7
pm
7pm
to 8
pm
Avg. consumption of newspaper by hour (%)
Page 8
Print Media Sector Note Overweight
January 8, 2017 Analyst: Depesh Kashyap,CFA [email protected] (+91-7228934327) Page 8 of 35
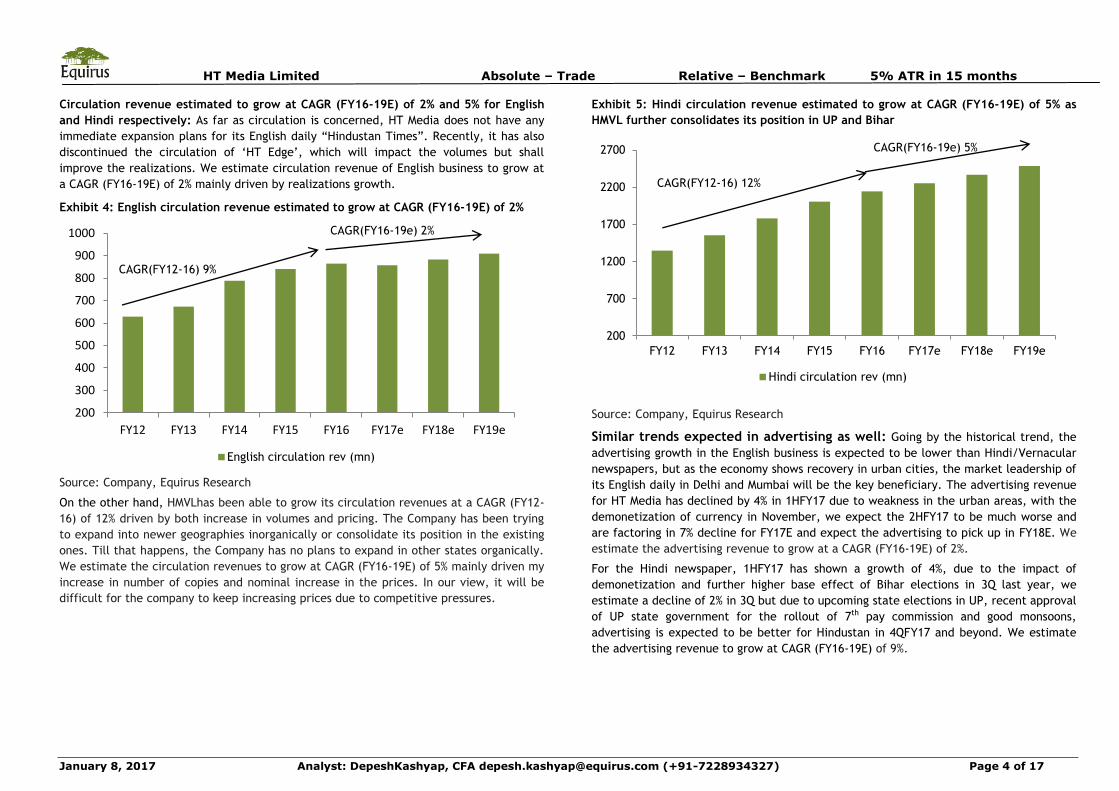
Print media in India is still emerging
The total media and entertainment industry in India has grown at a CAGR 12% in the last
5 years, and according to FICCI estimates, the industry as a whole is expected to grow at
CAGR 14% for the next 5 years. Exhibit 14 suggests that the media spend as % of GDP is
one of the lowest in India at 0.3%, so there remains a huge potential to grow in the long
term. The gap between ‘can read’ and ‘do read’ categories in the regional markets also
remain supportive of the growth of newspapers.
Exhibit 13: Indian M&E industry has grown at a CAGR of 12% in the last 5 years and is expected to grow at faster pace in the next 5 years
Source: FICCI-KPMG report 2016, Equirus Research
Exhibit 14: Media spend in India has a huge upside potential
Source: Group M estimates, Equirus Research
Exhibit 15: Number of registered newspapers and periodicals (‘000s) are still rising
Source: The registrar of newspaper in India, Equirus Research
As Exhibit 16 depicts, print media is still the largest component of advertising as a % of
overall ad pie at 40%. According to FICCI-KPMG estimates, print media is likely to lose its
leadership position to TV in the next 5 years and closely followed by the Digital media.
We argue that digital media is most likely to disrupt the English print space the most
while the regional print is likely to see strong growth in the years to come. We discuss
this in detail in the following section.
Exhibit 16: Print media still has the largest share in the advertising pie
Rs. bn 2012 2013 2014 2015 2016e 2017e 2018e 2019e 2020e CAGR(12-
15)
CAGR(15-
20e)
TV 125 136 155 181 210 242 276 320 365 13.3% 15.0%
Print 150 163 176 189 204 222 242 263 286 8.2% 8.6%
Radio 13 15 17 20 23 28 33 38 43 16.0% 16.9%
OOH 18 19 22 24 28 32 35 40 45 10.3% 13.1%
Digital 22 30 44 60 81 114 153 199 255 40.4% 33.5%
Total 327 363 414 475 547 637 739 860 994 13.2% 15.9%
Source: FICCI-KPMG report 2016, Equirus Research
652 728 821 918
1026 1157
2228
0
500
1000
1500
2000
2500
2010 2011 2012 2013 2014 2015 2020p
M&E industry size ( Rs bn)
0.33%
0.85%
0.97%
0.76% 0.86%
0.76%
0.00%
0.20%
0.40%
0.60%
0.80%
1.00%
1.20%
India UK US China Japan World
Media spend as % of GDP
2%
3%
4%
5%
6%
7%
8%
9%
0
20
40
60
80
100
120
2005 2006 2007 2010 2011 2012 2013 2014
Dailies Periodicals YoY growth (%) (RHS)
Page 9
Print Media Sector Note Overweight
January 8, 2017 Analyst: Depesh Kashyap,CFA [email protected] (+91-7228934327) Page 9 of 35
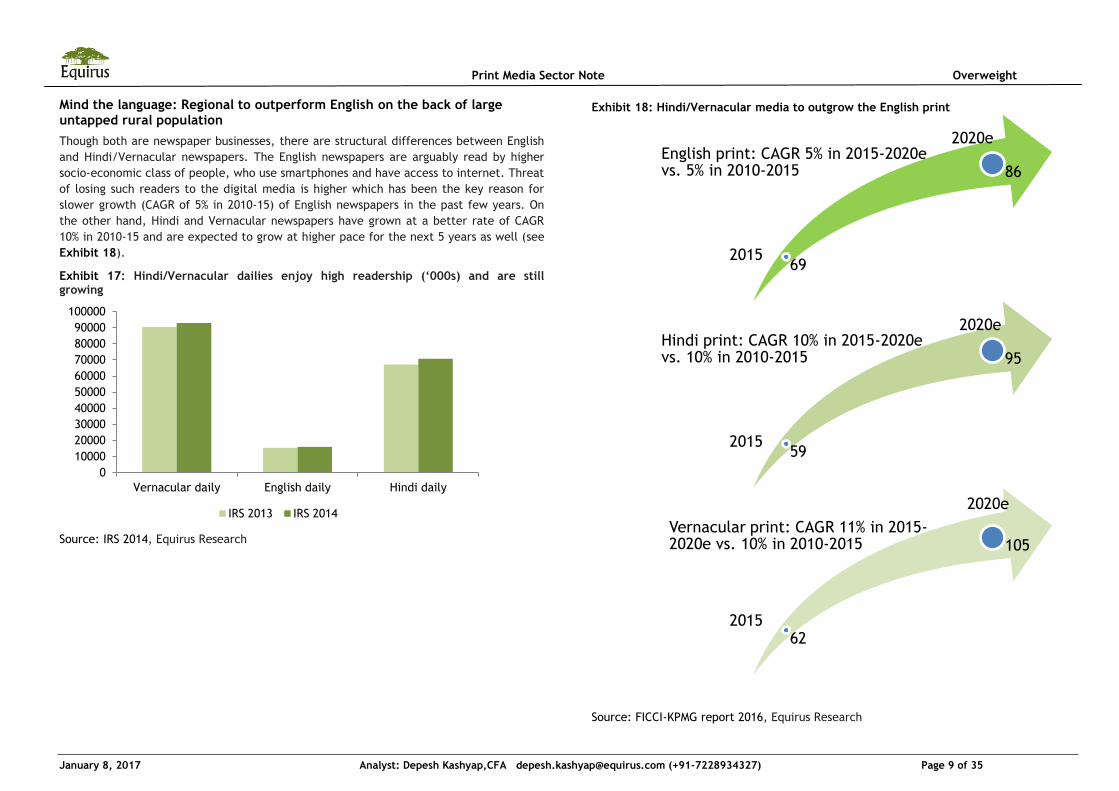
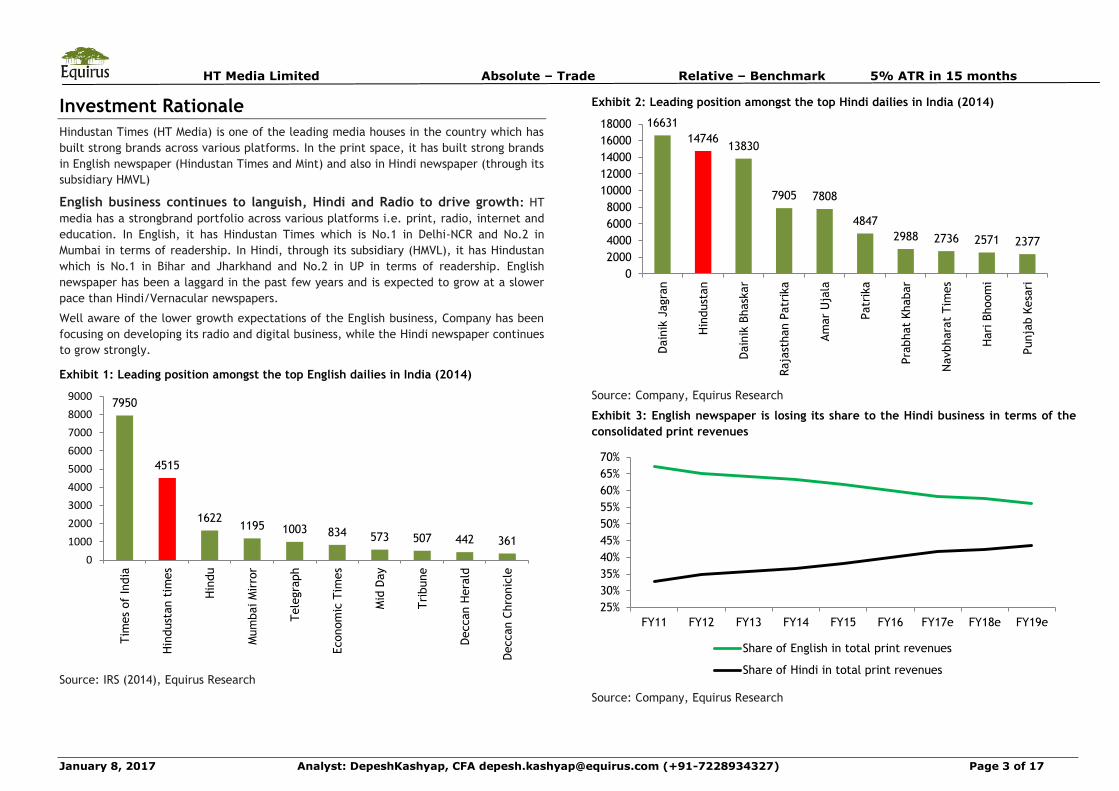
Mind the language: Regional to outperform English on the back of large untapped rural population
Though both are newspaper businesses, there are structural differences between English
and Hindi/Vernacular newspapers. The English newspapers are arguably read by higher
socio-economic class of people, who use smartphones and have access to internet. Threat
of losing such readers to the digital media is higher which has been the key reason for
slower growth (CAGR of 5% in 2010-15) of English newspapers in the past few years. On
the other hand, Hindi and Vernacular newspapers have grown at a better rate of CAGR
10% in 2010-15 and are expected to grow at higher pace for the next 5 years as well (see
Exhibit 18).
Exhibit 17: Hindi/Vernacular dailies enjoy high readership (‘000s) and are still growing
Source: IRS 2014, Equirus Research
Exhibit 18: Hindi/Vernacular media to outgrow the English print
Source: FICCI-KPMG report 2016, Equirus Research
0
10000
20000
30000
40000
50000
60000
70000
80000
90000
100000
Vernacular daily English daily Hindi daily
IRS 2013 IRS 2014
69 2015
English print: CAGR 5% in 2015-2020e vs. 5% in 2010-2015
2020e
86
59 2015
Hindi print: CAGR 10% in 2015-2020e vs. 10% in 2010-2015
2020e
95
62 2015
Vernacular print: CAGR 11% in 2015-2020e vs. 10% in 2010-2015
2020e
105
Page 10
Print Media Sector Note Overweight
January 8, 2017 Analyst: Depesh Kashyap,CFA [email protected] (+91-7228934327) Page 10 of 35
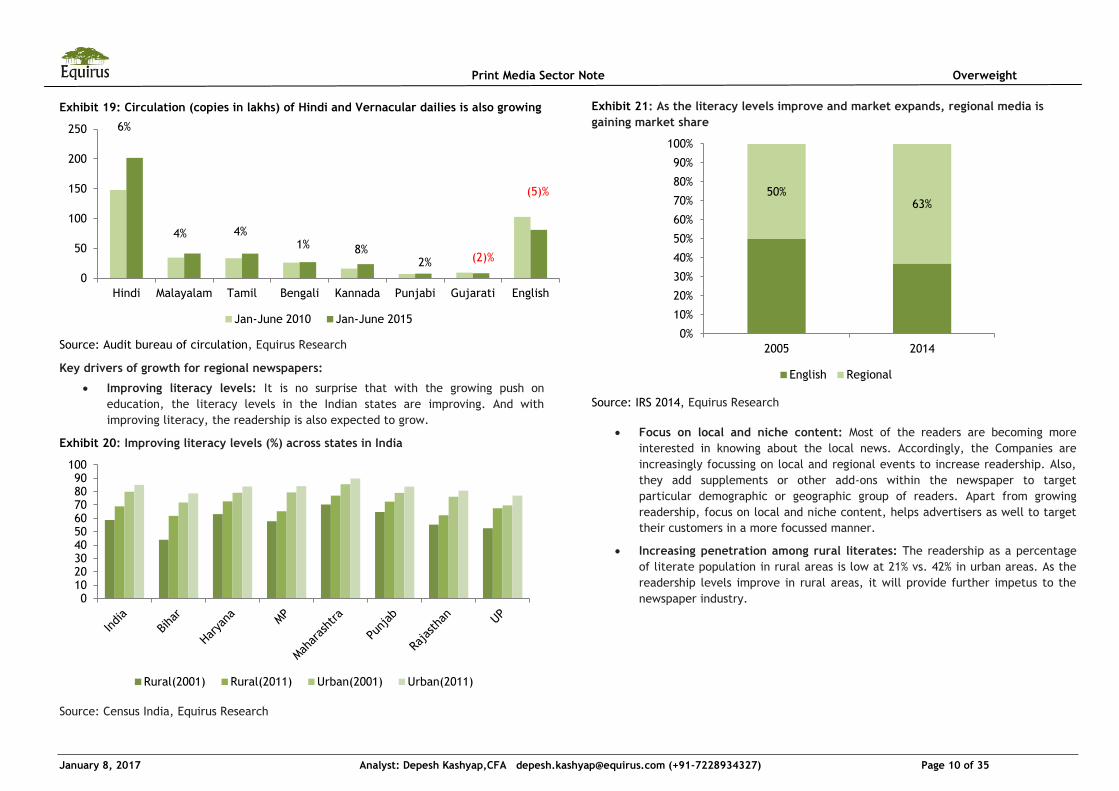
Exhibit 19: Circulation (copies in lakhs) of Hindi and Vernacular dailies is also growing
Source: Audit bureau of circulation, Equirus Research
Key drivers of growth for regional newspapers:
Improving literacy levels: It is no surprise that with the growing push on
education, the literacy levels in the Indian states are improving. And with
improving literacy, the readership is also expected to grow.
Exhibit 20: Improving literacy levels (%) across states in India
Source: Census India, Equirus Research
Exhibit 21: As the literacy levels improve and market expands, regional media is
gaining market share
Source: IRS 2014, Equirus Research
Focus on local and niche content: Most of the readers are becoming more
interested in knowing about the local news. Accordingly, the Companies are
increasingly focussing on local and regional events to increase readership. Also,
they add supplements or other add-ons within the newspaper to target
particular demographic or geographic group of readers. Apart from growing
readership, focus on local and niche content, helps advertisers as well to target
their customers in a more focussed manner.
Increasing penetration among rural literates: The readership as a percentage
of literate population in rural areas is low at 21% vs. 42% in urban areas. As the
readership levels improve in rural areas, it will provide further impetus to the
newspaper industry.
0
50
100
150
200
250
Hindi Malayalam Tamil Bengali Kannada Punjabi Gujarati English
Jan-June 2010 Jan-June 2015
6%
4%
4% 1%
8% 2%
(2)%
(5)%
0 10 20 30 40 50 60 70 80 90
100
Rural(2001) Rural(2011) Urban(2001) Urban(2011)
50% 63%
0%
10%
20%
30%
40%
50%
60%
70%
80%
90%
100%
2005 2014
English Regional
Page 11
Print Media Sector Note Overweight
January 8, 2017 Analyst: Depesh Kashyap,CFA [email protected] (+91-7228934327) Page 11 of 35
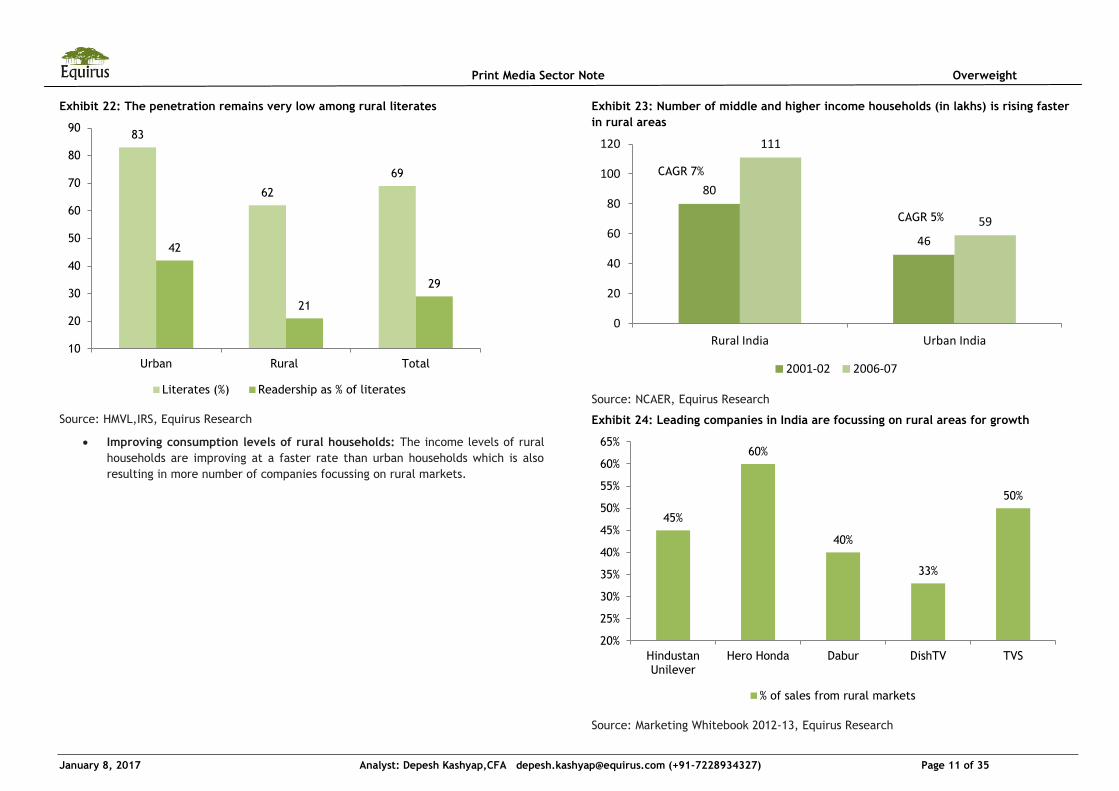
Exhibit 22: The penetration remains very low among rural literates
Source: HMVL,IRS, Equirus Research
Improving consumption levels of rural households: The income levels of rural
households are improving at a faster rate than urban households which is also
resulting in more number of companies focussing on rural markets.
Exhibit 23: Number of middle and higher income households (in lakhs) is rising faster
in rural areas
Source: NCAER, Equirus Research
Exhibit 24: Leading companies in India are focussing on rural areas for growth
Source: Marketing Whitebook 2012-13, Equirus Research
83
62
69
42
21
29
10
20
30
40
50
60
70
80
90
Urban Rural Total
Literates (%) Readership as % of literates
80
46
111
59
0
20
40
60
80
100
120
Rural India Urban India
2001-02 2006-07
CAGR 7%
CAGR 5%
45%
60%
40%
33%
50%
20%
25%
30%
35%
40%
45%
50%
55%
60%
65%
Hindustan Unilever
Hero Honda Dabur DishTV TVS
% of sales from rural markets
Page 12
Print Media Sector Note Overweight
January 8, 2017 Analyst: Depesh Kashyap,CFA [email protected] (+91-7228934327) Page 12 of 35
Future ready: Diversifying business
Being fully aware of the trends of the newspaper industry in the West, the Indian print
companies have been investing proactively and aggressively in the digital media and
already have a significant presence in online space. Though digital business models of the
companies are still evolving and the primary focus of the companies is mainly on
leveraging their brands in the online world. The companies are focussed on maximising
page views and unique visitors on their websites. Though the base remains very small but
all companies have seen exponential growth in the digital space in the last few years and
the trend is estimated to remain strong.
Exhibit 25: Digital advertisement revenues expected to grow at a CAGR (2015-20E) of 34%
Source: FICCI-KPMG, Equirus Research
Expanding the digital bouquet
Most of the Companies have been leveraging their brand in the print space to expand
their digital portfolio. Almost all the Companies have established their news websites,
and have also ventured into job, housing and education portals. Exhibit 28 lists websites
of various Companies in the sector. Though the total contribution of the digital segment
in the overall revenues of the Companies remains very low but it’s a high growth segment
and all the Companies are investing heavily in it.
Exhibit 26: High local language users in India will help in faster expansion of
Vernacular print companies
Source: FICCI-KPMG, Equirus Research
Exhibit 27: Digital revenue comparison of the Companies
Source: Company, Equirus Research
0
50
100
150
200
250
300
2012 2013 2014 2015 2016e 2017e 2018e 2019e 2020e
Digital advertisement revenues( Rs bn)
CAGR(2011-15) 41%
CAGR(2015-20E) 34%
47%
43%
57%
0%
10%
20%
30%
40%
50%
60%
0
50
100
150
200
250
300
All India Urban India Rural India
Internet users Local language users
460
213
1403 65%
38%
2% 1% 6%
0%
10%
20%
30%
40%
50%
60%
70%
0
200
400
600
800
1000
1200
1400
1600
DB Corp Ltd Jagran HT Media
Revenues from Digital (FY16) ( Rs mn)
Revenue CAGR(FY13-16) (RHS)
Digital as % of total revenues (FY16) (RHS)
Page 13
Print Media Sector Note Overweight
January 8, 2017 Analyst: Depesh Kashyap,CFA [email protected] (+91-7228934327) Page 13 of 35
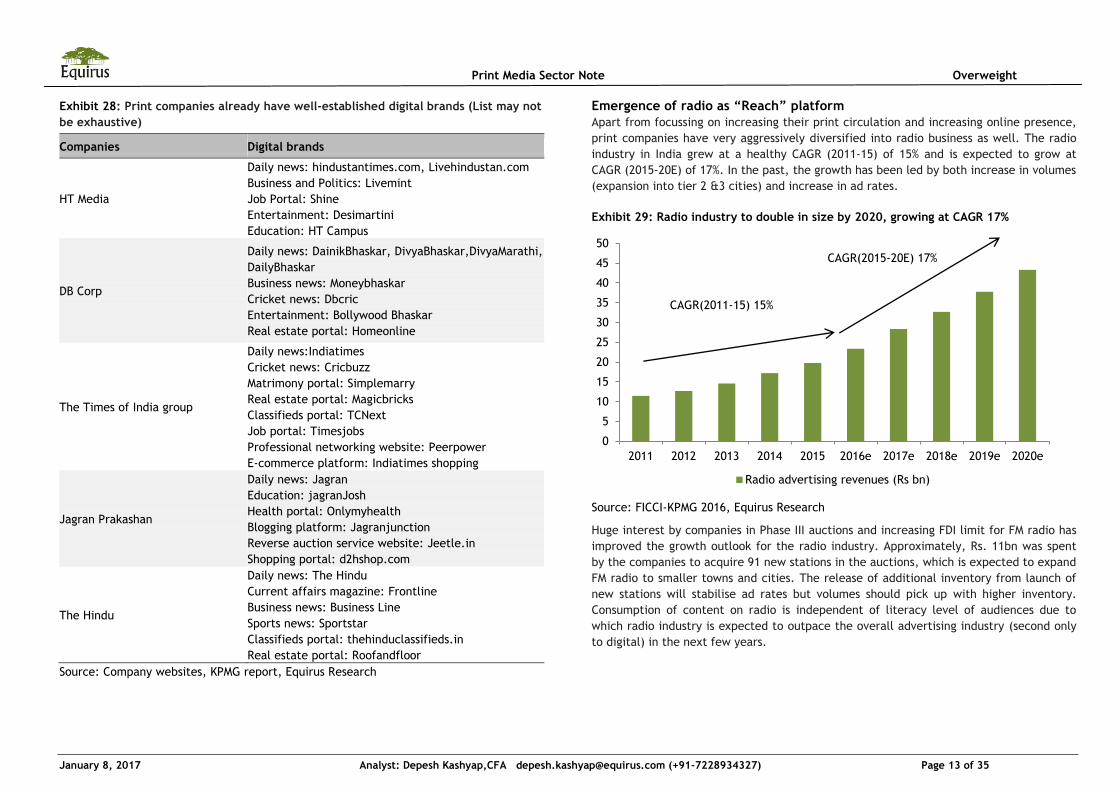
Exhibit 28: Print companies already have well-established digital brands (List may not
be exhaustive)
Companies Digital brands
HT Media
Daily news: hindustantimes.com, Livehindustan.com
Business and Politics: Livemint
Job Portal: Shine
Entertainment: Desimartini
Education: HT Campus
DB Corp
Daily news: DainikBhaskar, DivyaBhaskar,DivyaMarathi,
DailyBhaskar
Business news: Moneybhaskar
Cricket news: Dbcric
Entertainment: Bollywood Bhaskar
Real estate portal: Homeonline
The Times of India group
Daily news:Indiatimes
Cricket news: Cricbuzz
Matrimony portal: Simplemarry
Real estate portal: Magicbricks
Classifieds portal: TCNext
Job portal: Timesjobs
Professional networking website: Peerpower
E-commerce platform: Indiatimes shopping
Jagran Prakashan
Daily news: Jagran
Education: jagranJosh
Health portal: Onlymyhealth
Blogging platform: Jagranjunction
Reverse auction service website: Jeetle.in
Shopping portal: d2hshop.com
The Hindu
Daily news: The Hindu
Current affairs magazine: Frontline
Business news: Business Line
Sports news: Sportstar
Classifieds portal: thehinduclassifieds.in
Real estate portal: Roofandfloor
Source: Company websites, KPMG report, Equirus Research
Emergence of radio as “Reach” platform
Apart from focussing on increasing their print circulation and increasing online presence,
print companies have very aggressively diversified into radio business as well. The radio
industry in India grew at a healthy CAGR (2011-15) of 15% and is expected to grow at
CAGR (2015-20E) of 17%. In the past, the growth has been led by both increase in volumes
(expansion into tier 2 &3 cities) and increase in ad rates.
Exhibit 29: Radio industry to double in size by 2020, growing at CAGR 17%
Source: FICCI-KPMG 2016, Equirus Research
Huge interest by companies in Phase III auctions and increasing FDI limit for FM radio has
improved the growth outlook for the radio industry. Approximately, Rs. 11bn was spent
by the companies to acquire 91 new stations in the auctions, which is expected to expand
FM radio to smaller towns and cities. The release of additional inventory from launch of
new stations will stabilise ad rates but volumes should pick up with higher inventory.
Consumption of content on radio is independent of literacy level of audiences due to
which radio industry is expected to outpace the overall advertising industry (second only
to digital) in the next few years.
0
5
10
15
20
25
30
35
40
45
50
2011 2012 2013 2014 2015 2016e 2017e 2018e 2019e 2020e
Radio advertising revenues (Rs bn)
CAGR(2011-15) 15%
CAGR(2015-20E) 17%
Page 14
Print Media Sector Note Overweight
January 8, 2017 Analyst: Depesh Kashyap,CFA [email protected] (+91-7228934327) Page 14 of 35
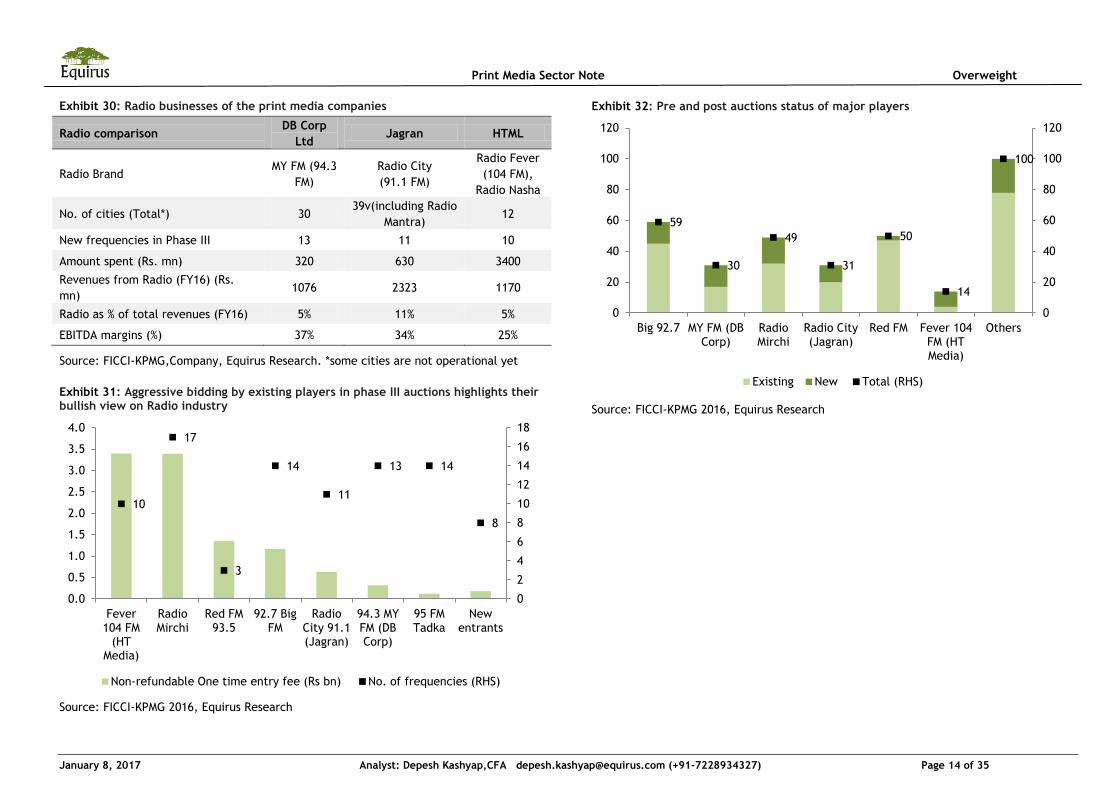
Exhibit 30: Radio businesses of the print media companies
Radio comparison DB Corp
Ltd Jagran HTML
Radio Brand MY FM (94.3
FM)
Radio City
(91.1 FM)
Radio Fever
(104 FM),
Radio Nasha
No. of cities (Total*) 30 39v(including Radio
Mantra) 12
New frequencies in Phase III 13 11 10
Amount spent (Rs. mn) 320 630 3400
Revenues from Radio (FY16) (Rs.
mn) 1076 2323 1170
Radio as % of total revenues (FY16) 5% 11% 5%
EBITDA margins (%) 37% 34% 25%
Source: FICCI-KPMG,Company, Equirus Research. *some cities are not operational yet
Exhibit 31: Aggressive bidding by existing players in phase III auctions highlights their bullish view on Radio industry
Source: FICCI-KPMG 2016, Equirus Research
Exhibit 32: Pre and post auctions status of major players
Source: FICCI-KPMG 2016, Equirus Research
10
17
3
14
11
13 14
8
0
2
4
6
8
10
12
14
16
18
0.0
0.5
1.0
1.5
2.0
2.5
3.0
3.5
4.0
Fever 104 FM
(HT Media)
Radio Mirchi
Red FM 93.5
92.7 Big FM
Radio City 91.1 (Jagran)
94.3 MY FM (DB Corp)
95 FM Tadka
New entrants
Non-refundable One time entry fee (Rs bn) No. of frequencies (RHS)
59
30
49
31
50
14
100
0
20
40
60
80
100
120
0
20
40
60
80
100
120
Big 92.7 MY FM (DB Corp)
Radio Mirchi
Radio City (Jagran)
Red FM Fever 104 FM (HT Media)
Others
Existing New Total (RHS)
Page 15
Print Media Sector Note Overweight
January 8, 2017 Analyst: Depesh Kashyap,CFA [email protected] (+91-7228934327) Page 15 of 35
Question that matters: “Where are we in the cycle”?
On the revenue side, newspaper industry is highly dependent on the advertising revenues
and on the cost side it is mainly dependent on the newsprint prices. Both components
depend on various macro variables and hence earnings of the newspaper business are
highly cyclical. We briefly discuss the business economics of the newspaper industry to
understand these variables in a better way.
Business economics: How do newspapers make money?
Newspaper publishers mainly have 2 sources of revenue:
a) Circulation revenues (sale of newspapers) which is mainly a function of i) total
newspaper circulation (Volumes) and
ii) Average realisation per copy (Pricing)
b) Advertising revenues (sale of advertising space) which is generally a function of
i) Ad space sold commercially (sq cm) (Volumes) and
ii) Average yield (Rs per sq cm) (Pricing)
Exhibit 33: Advertising revenue contributes nearly 70% of total revenues
Source: FICCI-KPMG 2016, Equirus Research
English newspapers are generally sold at lower prices (even lower than cost of
production) due to stiff competition in the market, on other hand Hindi/Vernacular
newspapers have higher cover prices. However, on the advertising side, English
newspaper generally command a premium on the ad-rates than Hindi/Vernacular
newspapers, mainly because higher income people whom advertisers are targeting read
English newspapers.
Exhibit 34: English newspaper revenues are more skewed towards advertising than Hindi
Source: FICCI-KPMG 2016, Equirus Research
On the cost side, the main operating costs for a newspaper publisher are:
a) Production costs mainly newsprint costs
b) Employee costs
c) Marketing and distribution costs
d) Content cost if procured from other agencies
67% 67% 67% 67% 67% 67% 67% 68% 68% 69%
33% 33% 33% 33% 33% 33% 33% 32% 32% 31%
0%
10%
20%
30%
40%
50%
60%
70%
80%
90%
100%
2011 2012 2013 2014 2015 2016e 2017e 2018e 2019e 2020e
Advertising revenue (%) Circulation revenue(%)
68% 65%
32% 35%
0%
10%
20%
30%
40%
50%
60%
70%
80%
90%
100%
English Hindi
Advertising Circulation
Page 16
Print Media Sector Note Overweight
January 8, 2017 Analyst: Depesh Kashyap,CFA [email protected] (+91-7228934327) Page 16 of 35
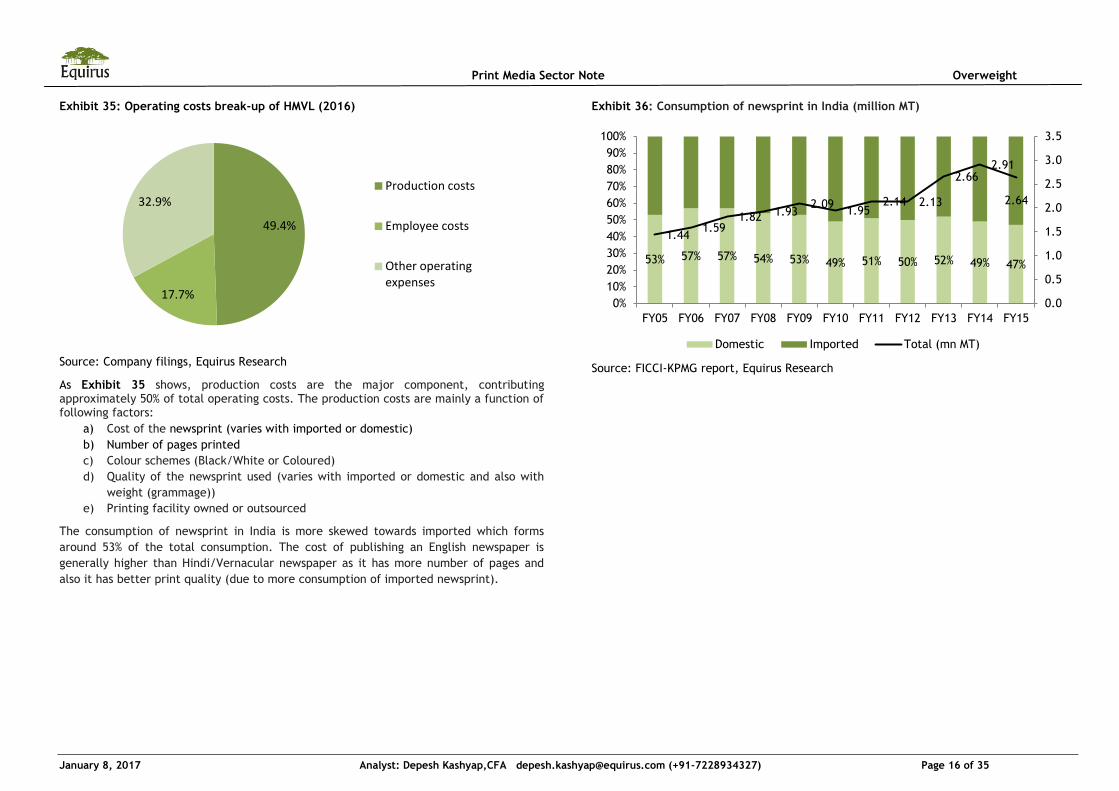
Exhibit 35: Operating costs break-up of HMVL (2016)
Source: Company filings, Equirus Research
As Exhibit 35 shows, production costs are the major component, contributing approximately 50% of total operating costs. The production costs are mainly a function of following factors:
a) Cost of the newsprint (varies with imported or domestic)
b) Number of pages printed
c) Colour schemes (Black/White or Coloured)
d) Quality of the newsprint used (varies with imported or domestic and also with
weight (grammage))
e) Printing facility owned or outsourced
The consumption of newsprint in India is more skewed towards imported which forms
around 53% of the total consumption. The cost of publishing an English newspaper is
generally higher than Hindi/Vernacular newspaper as it has more number of pages and
also it has better print quality (due to more consumption of imported newsprint).
Exhibit 36: Consumption of newsprint in India (million MT)
Source: FICCI-KPMG report, Equirus Research
49.4%
17.7%
32.9% Production costs
Employee costs
Other operating expenses
53% 57% 57% 54% 53% 49% 51% 50% 52% 49% 47%
1.44 1.59
1.82 1.93 2.09
1.95 2.14 2.13
2.66 2.91
2.64
0.0
0.5
1.0
1.5
2.0
2.5
3.0
3.5
0%
10%
20%
30%
40%
50%
60%
70%
80%
90%
100%
FY05 FY06 FY07 FY08 FY09 FY10 FY11 FY12 FY13 FY14 FY15
Domestic Imported Total (mn MT)
Page 17
Print Media Sector Note Overweight
January 8, 2017 Analyst: Depesh Kashyap,CFA [email protected] (+91-7228934327) Page 17 of 35
Print advertisement cycle: Remains favourable?
High dependence on advertising revenues makes the newspaper business highly
dependent on economic cycles. Exhibit 37 shows that cyclical sectors like Auto, Real
estate etc as among the top sectors which advertise heavily in the newspapers. Our
analysis of the past economic cycles shows that print advertising revenues closely lag the
Indian macroeconomic indicators like the real GDP growth rates (Exhibit 38), IIP index
(Exhibit 39) and the GDP per capita (Exhibit 40). The important point to note is that
even in the downturns, the print advertising growth rates had always stayed positive.
In our view, the advertising revenues are set to improve due to following key drivers:
1. Increasing media spend as % of GDP
2. Improving macroeconomic indicators
3. Easing of policy rates
4. Increase in discretionary spends by consumers
5. Rise of consumers in Tier 2 and 3 cities
6. Increase in ad-rates for Hindi/regional newspapers
7. Upcoming state elections and revised DAVP policy
8. Growth in emerging sectors like education, organised retail and
telecommunication
Exhibit 37: Top categories in the print advertising pie
Source: FICCI-KPMG report, Equirus Research
Exhibit 38: Real GDP growth leads the advertising revenue growth
Source: Bloomberg, FICCI-KPMG report, Equirus Research
Exhibit 39: IIP and the advertising revenue growth
Source: Bloomberg, FICCI-KPMG report, Equirus Research
14.6%
12.8%
9.8%
7.0%
6.0%
4.3% 3.8%
5.6%
4.7% 0.0%
4.6% 1.9%
1.3%
1.0%
22.4%
FMCG
Auto
Education
Real estate
Clothing/fashion/jewellery
E-com
Telecom/DTH
Retail
BFSI
Election/political ads
HH Durables
Travel and tourism
Corporate
Media
Others
0%
5%
10%
15%
20%
25%
5.0%
5.5%
6.0%
6.5%
7.0%
7.5%
8.0%
8.5%
9.0%
9.5%
10.0%
2005
2006
2007
2008
2009
2010
2011
2012
2013
2014
2015
GDP growth (%) Print advertising revenue (YoY %) (RHS)
0%
5%
10%
15%
20%
25%
-4.0
-2.0
0.0
2.0
4.0
6.0
8.0
10.0
12.0
14.0
16.0
2005
2006
2007
2008
2009
2010
2011
2012
2013
2014
2015
IIP index Print advertising revenue (YoY %) (RHS)
Page 18
Print Media Sector Note Overweight
January 8, 2017 Analyst: Depesh Kashyap,CFA [email protected] (+91-7228934327) Page 18 of 35
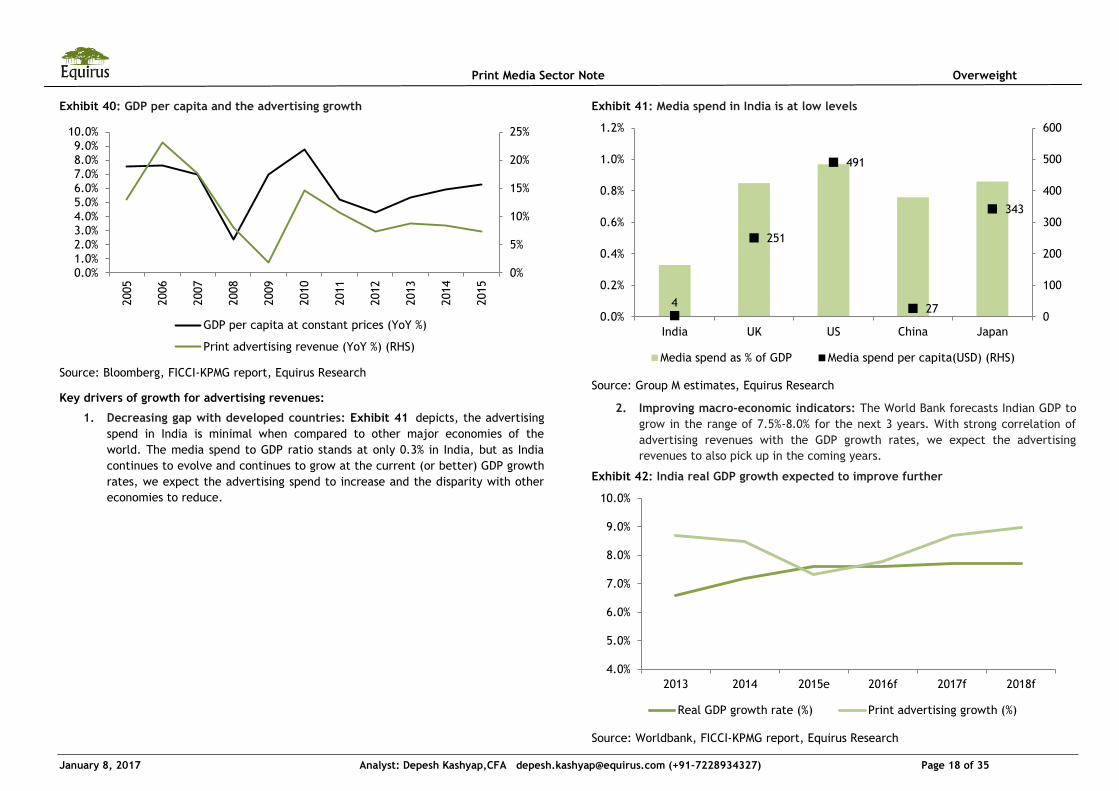
Exhibit 40: GDP per capita and the advertising growth
Source: Bloomberg, FICCI-KPMG report, Equirus Research
Key drivers of growth for advertising revenues:
1. Decreasing gap with developed countries: Exhibit 41 depicts, the advertising
spend in India is minimal when compared to other major economies of the
world. The media spend to GDP ratio stands at only 0.3% in India, but as India
continues to evolve and continues to grow at the current (or better) GDP growth
rates, we expect the advertising spend to increase and the disparity with other
economies to reduce.
Exhibit 41: Media spend in India is at low levels
Source: Group M estimates, Equirus Research
2. Improving macro-economic indicators: The World Bank forecasts Indian GDP to
grow in the range of 7.5%-8.0% for the next 3 years. With strong correlation of
advertising revenues with the GDP growth rates, we expect the advertising
revenues to also pick up in the coming years.
Exhibit 42: India real GDP growth expected to improve further
Source: Worldbank, FICCI-KPMG report, Equirus Research
0%
5%
10%
15%
20%
25%
0.0%
1.0%
2.0%
3.0%
4.0%
5.0%
6.0%
7.0%
8.0%
9.0%
10.0% 2005
2006
2007
2008
2009
2010
2011
2012
2013
2014
2015
GDP per capita at constant prices (YoY %)
Print advertising revenue (YoY %) (RHS)
4
251
491
27
343
0
100
200
300
400
500
600
0.0%
0.2%
0.4%
0.6%
0.8%
1.0%
1.2%
India UK US China Japan
Media spend as % of GDP Media spend per capita(USD) (RHS)
4.0%
5.0%
6.0%
7.0%
8.0%
9.0%
10.0%
2013 2014 2015e 2016f 2017f 2018f
Real GDP growth rate (%) Print advertising growth (%)
Page 19
Print Media Sector Note Overweight
January 8, 2017 Analyst: Depesh Kashyap,CFA [email protected] (+91-7228934327) Page 19 of 35
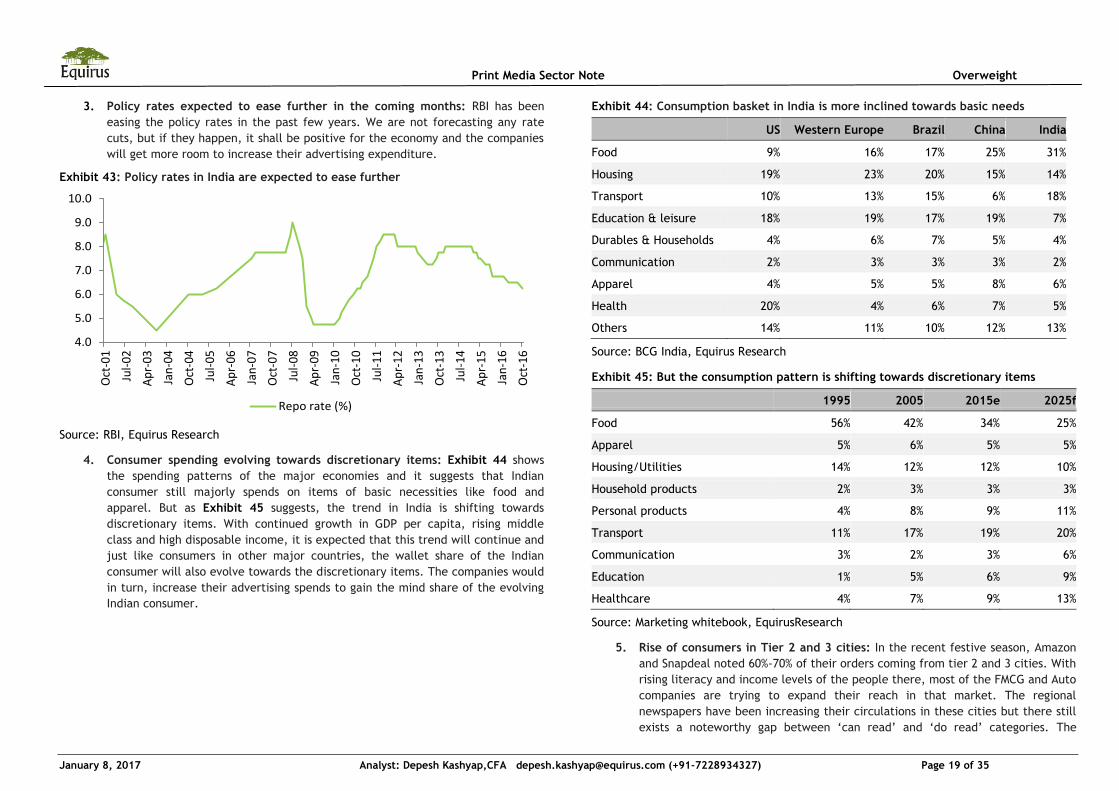
3. Policy rates expected to ease further in the coming months: RBI has been
easing the policy rates in the past few years. We are not forecasting any rate
cuts, but if they happen, it shall be positive for the economy and the companies
will get more room to increase their advertising expenditure.
Exhibit 43: Policy rates in India are expected to ease further
Source: RBI, Equirus Research
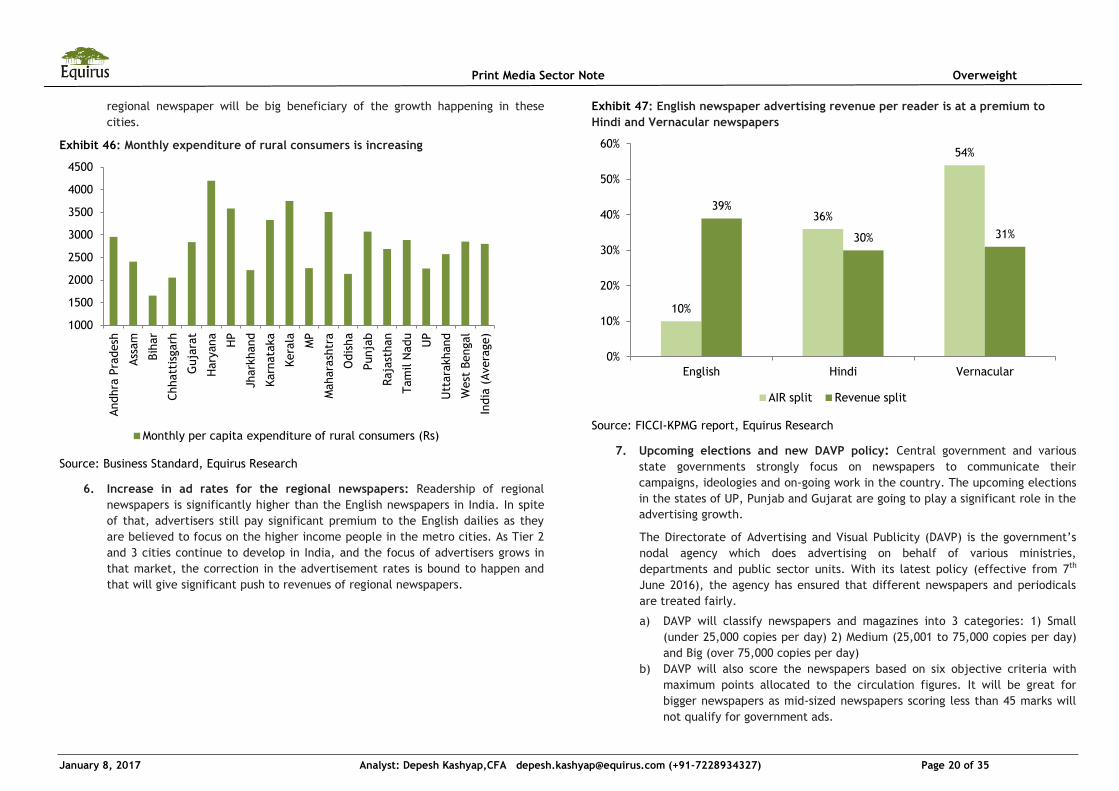
4. Consumer spending evolving towards discretionary items: Exhibit 44 shows
the spending patterns of the major economies and it suggests that Indian
consumer still majorly spends on items of basic necessities like food and
apparel. But as Exhibit 45 suggests, the trend in India is shifting towards
discretionary items. With continued growth in GDP per capita, rising middle
class and high disposable income, it is expected that this trend will continue and
just like consumers in other major countries, the wallet share of the Indian
consumer will also evolve towards the discretionary items. The companies would
in turn, increase their advertising spends to gain the mind share of the evolving
Indian consumer.
Exhibit 44: Consumption basket in India is more inclined towards basic needs
US Western Europe Brazil China India
Food 9% 16% 17% 25% 31%
Housing 19% 23% 20% 15% 14%
Transport 10% 13% 15% 6% 18%
Education & leisure 18% 19% 17% 19% 7%
Durables & Households 4% 6% 7% 5% 4%
Communication 2% 3% 3% 3% 2%
Apparel 4% 5% 5% 8% 6%
Health 20% 4% 6% 7% 5%
Others 14% 11% 10% 12% 13%
Source: BCG India, Equirus Research
Exhibit 45: But the consumption pattern is shifting towards discretionary items
1995 2005 2015e 2025f
Food 56% 42% 34% 25%
Apparel 5% 6% 5% 5%
Housing/Utilities 14% 12% 12% 10%
Household products 2% 3% 3% 3%
Personal products 4% 8% 9% 11%
Transport 11% 17% 19% 20%
Communication 3% 2% 3% 6%
Education 1% 5% 6% 9%
Healthcare 4% 7% 9% 13%
Source: Marketing whitebook, EquirusResearch
5. Rise of consumers in Tier 2 and 3 cities: In the recent festive season, Amazon
and Snapdeal noted 60%-70% of their orders coming from tier 2 and 3 cities. With
rising literacy and income levels of the people there, most of the FMCG and Auto
companies are trying to expand their reach in that market. The regional
newspapers have been increasing their circulations in these cities but there still
exists a noteworthy gap between ‘can read’ and ‘do read’ categories. The
4.0
5.0
6.0
7.0
8.0
9.0
10.0
Oct
-01
Jul-
02
Ap
r-03
Jan
-04
Oct
-04
Jul-
05
Ap
r-06
Jan
-07
Oct
-07
Jul-
08
Ap
r-09
Jan
-10
Oct
-10
Jul-
11
Ap
r-12
Jan
-13
Oct
-13
Jul-
14
Ap
r-15
Jan
-16
Oct
-16
Repo rate (%)
Page 20
Print Media Sector Note Overweight
January 8, 2017 Analyst: Depesh Kashyap,CFA [email protected] (+91-7228934327) Page 20 of 35
regional newspaper will be big beneficiary of the growth happening in these
cities.
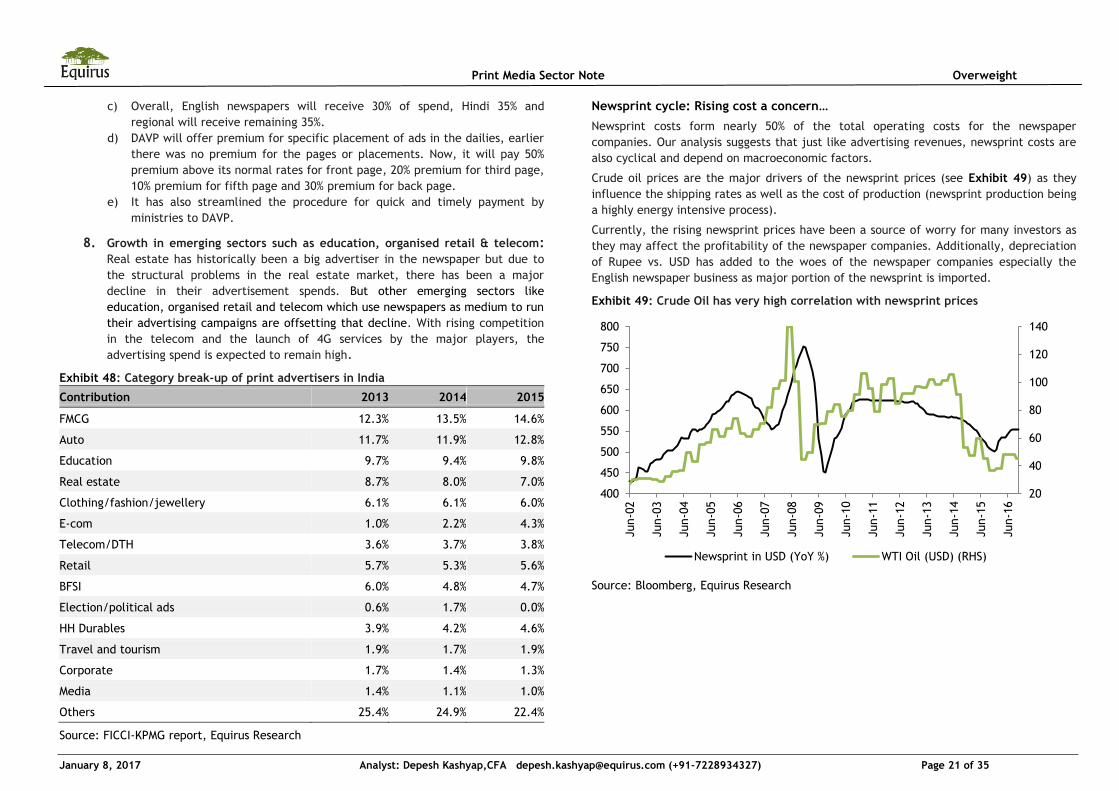
Exhibit 46: Monthly expenditure of rural consumers is increasing
Source: Business Standard, Equirus Research
6. Increase in ad rates for the regional newspapers: Readership of regional
newspapers is significantly higher than the English newspapers in India. In spite
of that, advertisers still pay significant premium to the English dailies as they
are believed to focus on the higher income people in the metro cities. As Tier 2
and 3 cities continue to develop in India, and the focus of advertisers grows in
that market, the correction in the advertisement rates is bound to happen and
that will give significant push to revenues of regional newspapers.
Exhibit 47: English newspaper advertising revenue per reader is at a premium to
Hindi and Vernacular newspapers
Source: FICCI-KPMG report, Equirus Research
7. Upcoming elections and new DAVP policy: Central government and various
state governments strongly focus on newspapers to communicate their
campaigns, ideologies and on-going work in the country. The upcoming elections
in the states of UP, Punjab and Gujarat are going to play a significant role in the
advertising growth.
The Directorate of Advertising and Visual Publicity (DAVP) is the government’s
nodal agency which does advertising on behalf of various ministries,
departments and public sector units. With its latest policy (effective from 7th
June 2016), the agency has ensured that different newspapers and periodicals
are treated fairly.
a) DAVP will classify newspapers and magazines into 3 categories: 1) Small
(under 25,000 copies per day) 2) Medium (25,001 to 75,000 copies per day)
and Big (over 75,000 copies per day)
b) DAVP will also score the newspapers based on six objective criteria with
maximum points allocated to the circulation figures. It will be great for
bigger newspapers as mid-sized newspapers scoring less than 45 marks will
not qualify for government ads.
1000
1500
2000
2500
3000
3500
4000
4500
Andhra
Pra
desh
Ass
am
Bih
ar
Chhatt
isgarh
Guja
rat
Hary
ana
HP
Jhark
hand
Karn
ata
ka
Kera
la
MP
Mahara
shtr
a
Odis
ha
Punja
b
Raja
sthan
Tam
il N
adu
UP
Utt
ara
khand
West
Bengal
India
(Avera
ge)
Monthly per capita expenditure of rural consumers (Rs)
10%
36%
54%
39%
30% 31%
0%
10%
20%
30%
40%
50%
60%
English Hindi Vernacular
AIR split Revenue split
Page 21
Print Media Sector Note Overweight
January 8, 2017 Analyst: Depesh Kashyap,CFA [email protected] (+91-7228934327) Page 21 of 35
c) Overall, English newspapers will receive 30% of spend, Hindi 35% and
regional will receive remaining 35%.
d) DAVP will offer premium for specific placement of ads in the dailies, earlier
there was no premium for the pages or placements. Now, it will pay 50%
premium above its normal rates for front page, 20% premium for third page,
10% premium for fifth page and 30% premium for back page.
e) It has also streamlined the procedure for quick and timely payment by
ministries to DAVP.
8. Growth in emerging sectors such as education, organised retail & telecom:
Real estate has historically been a big advertiser in the newspaper but due to
the structural problems in the real estate market, there has been a major
decline in their advertisement spends. But other emerging sectors like
education, organised retail and telecom which use newspapers as medium to run
their advertising campaigns are offsetting that decline. With rising competition
in the telecom and the launch of 4G services by the major players, the
advertising spend is expected to remain high.
Exhibit 48: Category break-up of print advertisers in India
Contribution 2013 2014 2015
FMCG 12.3% 13.5% 14.6%
Auto 11.7% 11.9% 12.8%
Education 9.7% 9.4% 9.8%
Real estate 8.7% 8.0% 7.0%
Clothing/fashion/jewellery 6.1% 6.1% 6.0%
E-com 1.0% 2.2% 4.3%
Telecom/DTH 3.6% 3.7% 3.8%
Retail 5.7% 5.3% 5.6%
BFSI 6.0% 4.8% 4.7%
Election/political ads 0.6% 1.7% 0.0%
HH Durables 3.9% 4.2% 4.6%
Travel and tourism 1.9% 1.7% 1.9%
Corporate 1.7% 1.4% 1.3%
Media 1.4% 1.1% 1.0%
Others 25.4% 24.9% 22.4%
Source: FICCI-KPMG report, Equirus Research
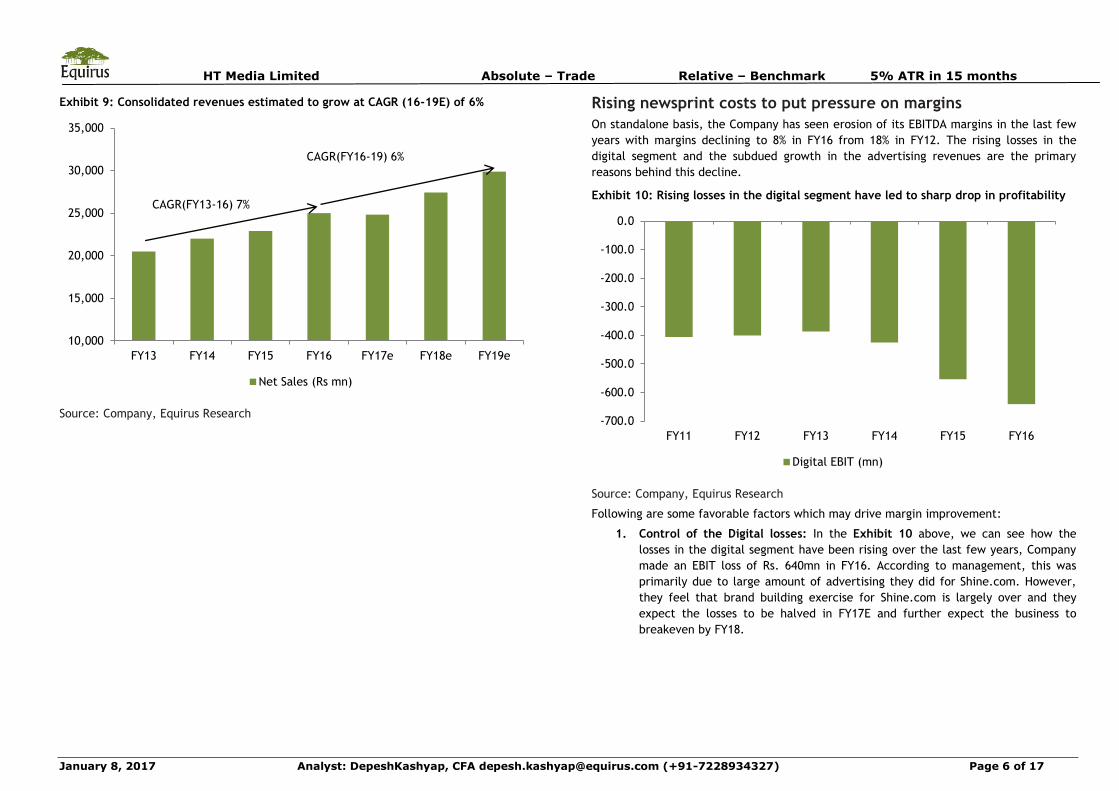
Newsprint cycle: Rising cost a concern…
Newsprint costs form nearly 50% of the total operating costs for the newspaper
companies. Our analysis suggests that just like advertising revenues, newsprint costs are
also cyclical and depend on macroeconomic factors.
Crude oil prices are the major drivers of the newsprint prices (see Exhibit 49) as they
influence the shipping rates as well as the cost of production (newsprint production being
a highly energy intensive process).
Currently, the rising newsprint prices have been a source of worry for many investors as
they may affect the profitability of the newspaper companies. Additionally, depreciation
of Rupee vs. USD has added to the woes of the newspaper companies especially the
English newspaper business as major portion of the newsprint is imported.
Exhibit 49: Crude Oil has very high correlation with newsprint prices
Source: Bloomberg, Equirus Research
20
40
60
80
100
120
140
400
450
500
550
600
650
700
750
800
Jun-0
2
Jun-0
3
Jun-0
4
Jun-0
5
Jun-0
6
Jun-0
7
Jun-0
8
Jun-0
9
Jun-1
0
Jun-1
1
Jun-1
2
Jun-1
3
Jun-1
4
Jun-1
5
Jun-1
6
Newsprint in USD (YoY %) WTI Oil (USD) (RHS)
Page 22
Print Media Sector Note Overweight
January 8, 2017 Analyst: Depesh Kashyap,CFA [email protected] (+91-7228934327) Page 22 of 35
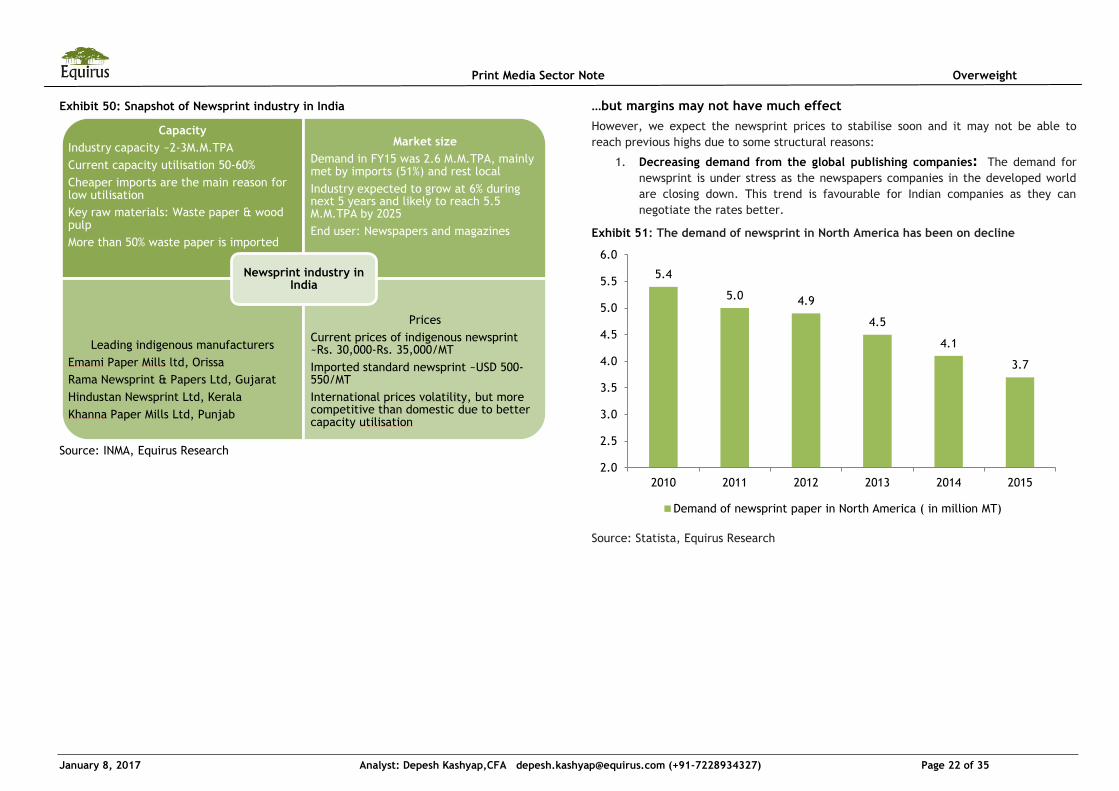
Exhibit 50: Snapshot of Newsprint industry in India
Source: INMA, Equirus Research
…but margins may not have much effect
However, we expect the newsprint prices to stabilise soon and it may not be able to
reach previous highs due to some structural reasons:
1. Decreasing demand from the global publishing companies: The demand for
newsprint is under stress as the newspapers companies in the developed world
are closing down. This trend is favourable for Indian companies as they can
negotiate the rates better.
Exhibit 51: The demand of newsprint in North America has been on decline
Source: Statista, Equirus Research
Capacity
Industry capacity ~2-3M.M.TPA
Current capacity utilisation 50-60%
Cheaper imports are the main reason for low utilisation
Key raw materials: Waste paper & wood pulp
More than 50% waste paper is imported
Market size
Demand in FY15 was 2.6 M.M.TPA, mainly met by imports (51%) and rest local
Industry expected to grow at 6% during next 5 years and likely to reach 5.5 M.M.TPA by 2025
End user: Newspapers and magazines
Leading indigenous manufacturers
Emami Paper Mills ltd, Orissa
Rama Newsprint & Papers Ltd, Gujarat
Hindustan Newsprint Ltd, Kerala
Khanna Paper Mills Ltd, Punjab
Prices
Current prices of indigenous newsprint ~Rs. 30,000-Rs. 35,000/MT
Imported standard newsprint ~USD 500-550/MT
International prices volatility, but more competitive than domestic due to better capacity utilisation
Newsprint industry in India
5.4
5.0 4.9
4.5
4.1
3.7
2.0
2.5
3.0
3.5
4.0
4.5
5.0
5.5
6.0
2010 2011 2012 2013 2014 2015
Demand of newsprint paper in North America ( in million MT)
Page 23
Print Media Sector Note Overweight
January 8, 2017 Analyst: Depesh Kashyap,CFA [email protected] (+91-7228934327) Page 23 of 35
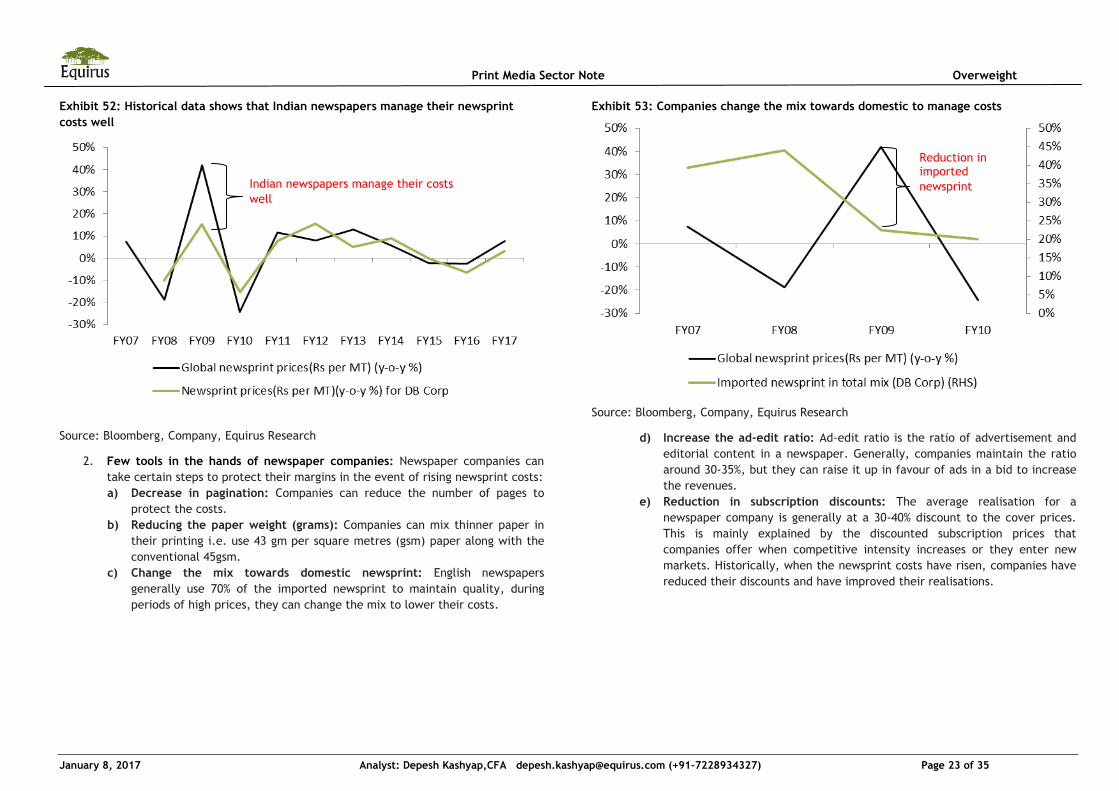
Exhibit 52: Historical data shows that Indian newspapers manage their newsprint
costs well
Source: Bloomberg, Company, Equirus Research
2. Few tools in the hands of newspaper companies: Newspaper companies can
take certain steps to protect their margins in the event of rising newsprint costs:
a) Decrease in pagination: Companies can reduce the number of pages to
protect the costs.
b) Reducing the paper weight (grams): Companies can mix thinner paper in
their printing i.e. use 43 gm per square metres (gsm) paper along with the
conventional 45gsm.
c) Change the mix towards domestic newsprint: English newspapers
generally use 70% of the imported newsprint to maintain quality, during
periods of high prices, they can change the mix to lower their costs.
Exhibit 53: Companies change the mix towards domestic to manage costs
Source: Bloomberg, Company, Equirus Research
d) Increase the ad-edit ratio: Ad-edit ratio is the ratio of advertisement and
editorial content in a newspaper. Generally, companies maintain the ratio
around 30-35%, but they can raise it up in favour of ads in a bid to increase
the revenues.
e) Reduction in subscription discounts: The average realisation for a
newspaper company is generally at a 30-40% discount to the cover prices.
This is mainly explained by the discounted subscription prices that
companies offer when competitive intensity increases or they enter new
markets. Historically, when the newsprint costs have risen, companies have
reduced their discounts and have improved their realisations.
Indian newspapers manage their costs
well
Reduction in imported
newsprint
Page 24
Print Media Sector Note Overweight
January 8, 2017 Analyst: Depesh Kashyap,CFA [email protected] (+91-7228934327) Page 24 of 35
Exhibit 54: Reduction in subscription discounts to counter newsprint costs
Source: Company, Equirus Research
3. Case of positive operating leverage: Due to higher dependence on advertising
revenues, earnings are more sensitive to changes in advertising revenues than
changes in newsprint costs. We estimate that the earnings of the sector are
~1.2x more sensitive to changes in advertising than changes in newsprint costs.
So, even if newsprint costs rise more than expected, in our view the strong
advertising growth shall be able to drive the earnings forward.
Differentiating factors: A bare comparison
We compared the Print, Radio, Digital and overall business on some common parameters.
Following are our conclusions of the same:
1. Print business: In our view, if we look only at print businesses of these
Companies, Dainik Bhaskar looks marginal favourite. It has highest daily
circulation amongst the competitors and has more diversified readership across
various states whereas Jagran and Hindustan are more focussed on UP & Bihar.
The Company has proven track record of making strong entry in new markets
and becoming No.1 from Day1 of launch.
2. Radio business: On comparing radio businesses of these companies, Jagran is
clearly ahead of the rest. The upcoming IPO of Radio City (91.1 FM) will further
unlock value of its radio business. All Companies have different strategies with
their radio businesses; while some operate the business as complementary
platform to their print business, others operate it more independently.
3. Digital Business: Though digital is still a very small component of the overall
business, but all the companies have been proactively establishing their brands
in the digital space. In this space, HT media has clearly made the biggest
investments amongst its peers. Apart from working on the news daily websites
like other players, the Company has established Shine.com which has become
no.2 jobs portal in India after Naukri.com. It has also ventured into education
space which is seen as high growth industry. As far as only news websites/portals
are concerned, Dainik Bhaskar attracts the maximum traffic along with Times of
India.
-20%
-15%
-10%
-5%
0%
5%
10%
15%
20%
FY08 FY09 FY10 FY11 FY12 FY13 FY14 FY15 FY16
Newsprint cost per MT (Rs) Average realisation(Rs)
Page 25
Print Media Sector Note Overweight
January 8, 2017 Analyst: Depesh Kashyap,CFA [email protected] (+91-7228934327) Page 25 of 35
Exhibit 55: DB Corp stands out with its Print strategy, Jagran has the best Radio
business, and HT Media leads with its Digital investments
Ranking DB Corp Jagran HT Media/
HMVL Comments
Print 1 2 3
Well proven market entry
strategy, diversified
readership makes DB Corp
our top pick in terms as far
as Print is concerned
Radio 3 1 2
Radio City(Jagran) is our top
pick because of its reach
and popularity.
Digital 2 3 1
HT Media has diversified its
digital investments in News,
jobs and education portals.
In terms of brand recall, DB
Corp is getting maximum
traffic on its websites.
Source: Company, Equirus Research
Below we look into detail all the three segments of these Companies.
DainikBhaskar has the most diversified print business
For the key Hindi print players in the industry, India can be broadly divided into 2 broad
categories as shown in Exhibit 56. 1) Focus markets- which include major Hindi speaking
states of UP, MP, Chattisgarh, Rajasthan, Bihar, Haryana, Punjab, Himachal Pradesh,
Uttarakhand, Jharkhand and J&K. The focus is also on regional markets where majority
understand Hindi like West Bengal, Orissa, Maharashtra and Gujarat. 2) Non Focus
markets- Rest of the markets like North-eastern states, Southern states of Tamil Nadu,
Karnataka, Kerala, AP& Telangana are not priority for the industry players at the
moment. Also the major metros are considered as majorly an English print market, with
Delhi being an exception as it is also a strong market for Hindi players.
Exhibit 56: Print media Landscape in India
Source: Company, Equirus Research * Delhi which is a metro is a also a strong market for
Hindi newspapers
In the print space, we rank DB Corp higher than others mainly due to following factors:
1. Diversified readership base: DB Corp is present in the highest number of states
(14) as compared to its peers and has the most diversified (see Exhibit 57)
readership base across various states whereas both Jagran and Hindustan are
more focussed on UP and Bihar. This diversification makes DB Corp more immune
to floods and other calamities which may disrupt any particular state. Though
UP, due to its large population is the largest market for advertisers in India, but
the states like Bihar, MP and Jharkhand are growing at faster rates. Also, having
a diverse readership like Dainik Bhaskar, makes a Company immune to slowdown
in any particular states.
2. Proven track record of entering new markets: Generally, newspaper
companies try to maintain their leadership in one or two states. But Dainik
Bhaskar has been able to grow beyond its MPCG market and expand into newer
territories like Gujarat and Rajasthan. From the day 1 of its launch, it was able
Print Media landscape
Focus markets
Remaining states
Hindi
UP, MP, Chattisgarh, Rajasthan, Haryana, Punjab, Himachal, Uttarakhand, Jharkhand, J&K, Bihar
Bengali/Oriya/Marathi/Gujarati
Non-focus markets
7 NE states 5 Southern
states
7 Metros (English
Play)
Page 26
Print Media Sector Note Overweight
January 8, 2017 Analyst: Depesh Kashyap,CFA [email protected] (+91-7228934327) Page 26 of 35
to displace the market leader of that particular state. This speaks a lot about
the strong brand recognition of Bhaskar.
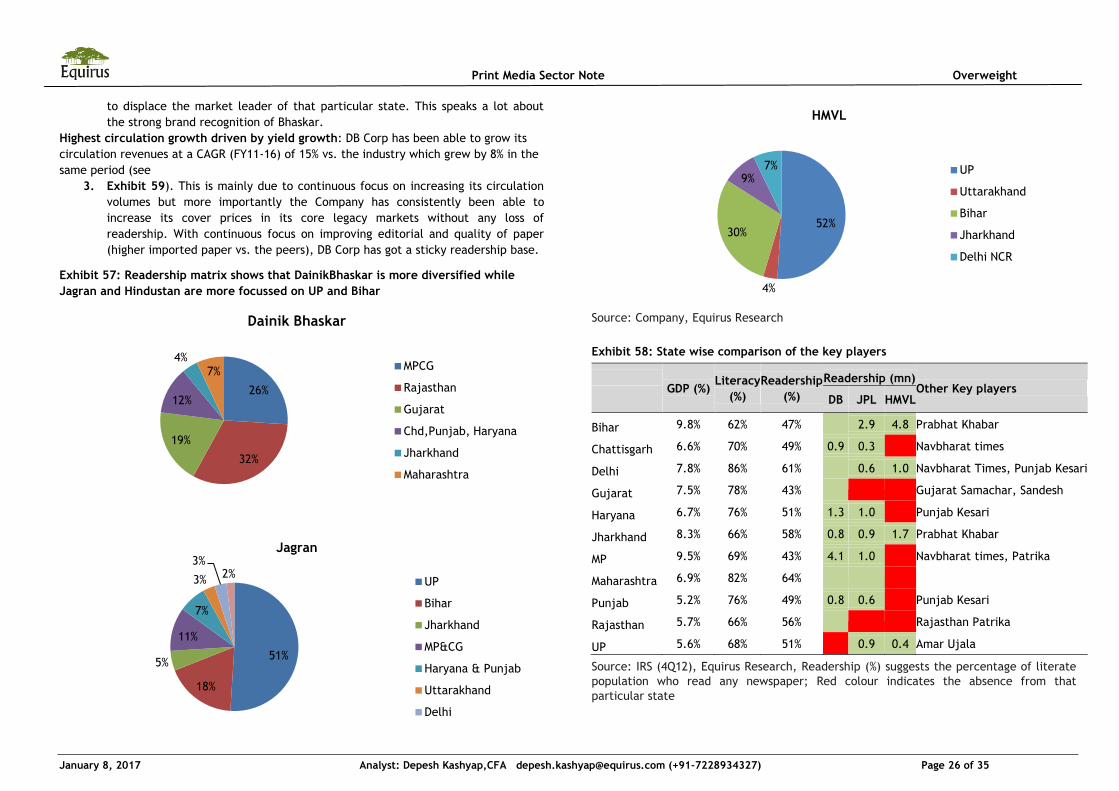
Highest circulation growth driven by yield growth: DB Corp has been able to grow its
circulation revenues at a CAGR (FY11-16) of 15% vs. the industry which grew by 8% in the
same period (see
3. Exhibit 59). This is mainly due to continuous focus on increasing its circulation
volumes but more importantly the Company has consistently been able to
increase its cover prices in its core legacy markets without any loss of
readership. With continuous focus on improving editorial and quality of paper
(higher imported paper vs. the peers), DB Corp has got a sticky readership base.
Exhibit 57: Readership matrix shows that DainikBhaskar is more diversified while
Jagran and Hindustan are more focussed on UP and Bihar
Source: Company, Equirus Research
Exhibit 58: State wise comparison of the key players
GDP (%)
Literacy
(%)
Readership
(%)
Readership (mn) Other Key players
DB JPL HMVL
Bihar 9.8% 62% 47%
2.9 4.8 Prabhat Khabar
Chattisgarh 6.6% 70% 49% 0.9 0.3
Navbharat times
Delhi 7.8% 86% 61%
0.6 1.0 Navbharat Times, Punjab Kesari
Gujarat 7.5% 78% 43%
Gujarat Samachar, Sandesh
Haryana 6.7% 76% 51% 1.3 1.0
Punjab Kesari
Jharkhand 8.3% 66% 58% 0.8 0.9 1.7 Prabhat Khabar
MP 9.5% 69% 43% 4.1 1.0
Navbharat times, Patrika
Maharashtra 6.9% 82% 64%
Punjab 5.2% 76% 49% 0.8 0.6
Punjab Kesari
Rajasthan 5.7% 66% 56%
Rajasthan Patrika
UP 5.6% 68% 51%
0.9 0.4 Amar Ujala
Source: IRS (4Q12), Equirus Research, Readership (%) suggests the percentage of literate
population who read any newspaper; Red colour indicates the absence from that
particular state
26%
32%
19%
12%
4% 7%
Dainik Bhaskar
MPCG
Rajasthan
Gujarat
Chd,Punjab, Haryana
Jharkhand
Maharashtra
51%
18%
5%
11%
7%
3%
3% 2%
Jagran
UP
Bihar
Jharkhand
MP&CG
Haryana & Punjab
Uttarakhand
Delhi
52%
4%
30%
9% 7%
HMVL
UP
Uttarakhand
Bihar
Jharkhand
Delhi NCR
Page 27
Print Media Sector Note Overweight
January 8, 2017 Analyst: Depesh Kashyap,CFA [email protected] (+91-7228934327) Page 27 of 35
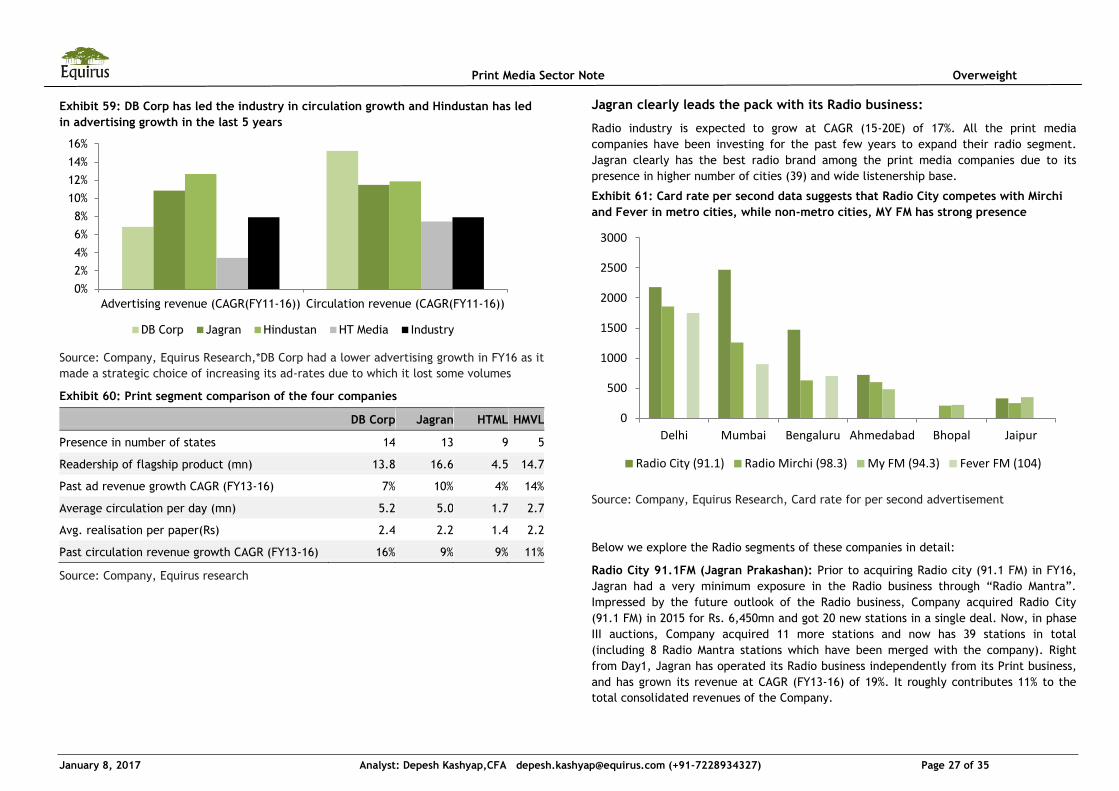
Exhibit 59: DB Corp has led the industry in circulation growth and Hindustan has led
in advertising growth in the last 5 years
Source: Company, Equirus Research,*DB Corp had a lower advertising growth in FY16 as it
made a strategic choice of increasing its ad-rates due to which it lost some volumes
Exhibit 60: Print segment comparison of the four companies
DB Corp Jagran HTML HMVL
Presence in number of states 14 13 9 5
Readership of flagship product (mn) 13.8 16.6 4.5 14.7
Past ad revenue growth CAGR (FY13-16) 7% 10% 4% 14%
Average circulation per day (mn) 5.2 5.0 1.7 2.7
Avg. realisation per paper(Rs) 2.4 2.2 1.4 2.2
Past circulation revenue growth CAGR (FY13-16) 16% 9% 9% 11%
Source: Company, Equirus research
Jagran clearly leads the pack with its Radio business:
Radio industry is expected to grow at CAGR (15-20E) of 17%. All the print media
companies have been investing for the past few years to expand their radio segment.
Jagran clearly has the best radio brand among the print media companies due to its
presence in higher number of cities (39) and wide listenership base.
Exhibit 61: Card rate per second data suggests that Radio City competes with Mirchi
and Fever in metro cities, while non-metro cities, MY FM has strong presence
Source: Company, Equirus Research, Card rate for per second advertisement
Below we explore the Radio segments of these companies in detail:
Radio City 91.1FM (Jagran Prakashan): Prior to acquiring Radio city (91.1 FM) in FY16,
Jagran had a very minimum exposure in the Radio business through “Radio Mantra”.
Impressed by the future outlook of the Radio business, Company acquired Radio City
(91.1 FM) in 2015 for Rs. 6,450mn and got 20 new stations in a single deal. Now, in phase
III auctions, Company acquired 11 more stations and now has 39 stations in total
(including 8 Radio Mantra stations which have been merged with the company). Right
from Day1, Jagran has operated its Radio business independently from its Print business,
and has grown its revenue at CAGR (FY13-16) of 19%. It roughly contributes 11% to the
total consolidated revenues of the Company.
0%
2%
4%
6%
8%
10%
12%
14%
16%
Advertising revenue (CAGR(FY11-16)) Circulation revenue (CAGR(FY11-16))
DB Corp Jagran Hindustan HT Media Industry
0
500
1000
1500
2000
2500
3000
Delhi Mumbai Bengaluru Ahmedabad Bhopal Jaipur
Radio City (91.1) Radio Mirchi (98.3) My FM (94.3) Fever FM (104)
Page 28
Print Media Sector Note Overweight
January 8, 2017 Analyst: Depesh Kashyap,CFA [email protected] (+91-7228934327) Page 28 of 35
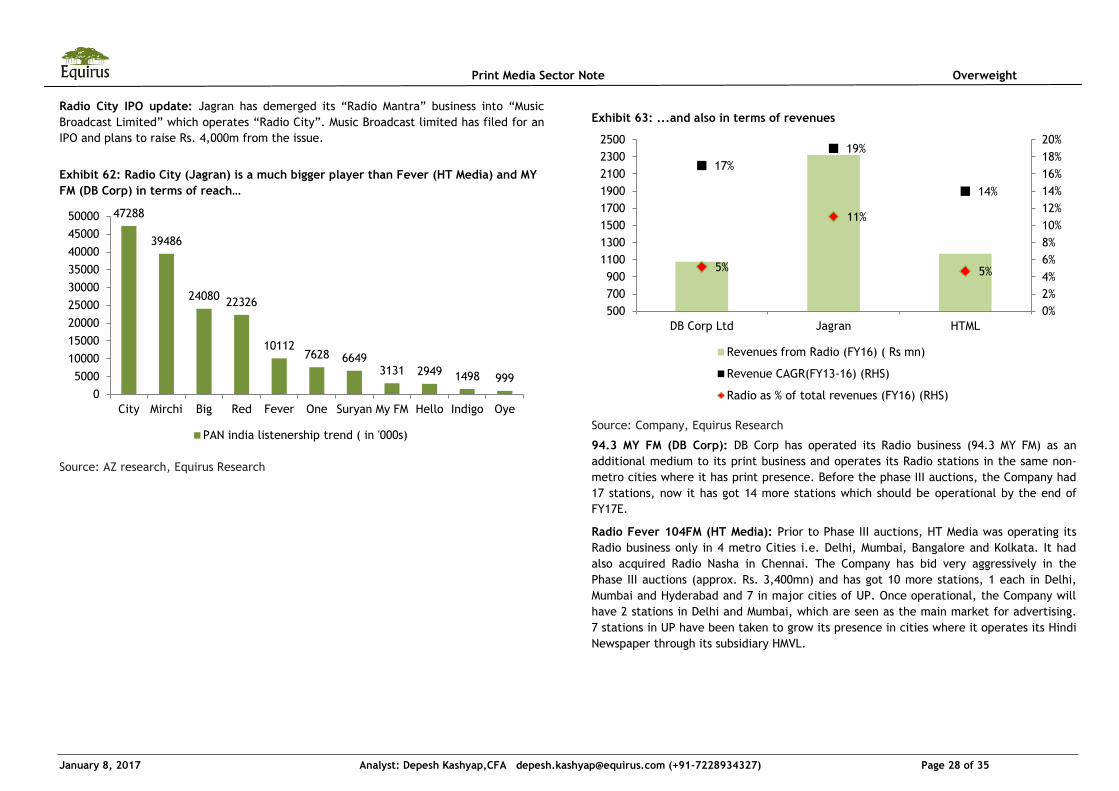
Radio City IPO update: Jagran has demerged its “Radio Mantra” business into “Music
Broadcast Limited” which operates “Radio City”. Music Broadcast limited has filed for an
IPO and plans to raise Rs. 4,000m from the issue.
Exhibit 62: Radio City (Jagran) is a much bigger player than Fever (HT Media) and MY
FM (DB Corp) in terms of reach…
Source: AZ research, Equirus Research
Exhibit 63: ...and also in terms of revenues
Source: Company, Equirus Research
94.3 MY FM (DB Corp): DB Corp has operated its Radio business (94.3 MY FM) as an
additional medium to its print business and operates its Radio stations in the same non-
metro cities where it has print presence. Before the phase III auctions, the Company had
17 stations, now it has got 14 more stations which should be operational by the end of
FY17E.
Radio Fever 104FM (HT Media): Prior to Phase III auctions, HT Media was operating its
Radio business only in 4 metro Cities i.e. Delhi, Mumbai, Bangalore and Kolkata. It had
also acquired Radio Nasha in Chennai. The Company has bid very aggressively in the
Phase III auctions (approx. Rs. 3,400mn) and has got 10 more stations, 1 each in Delhi,
Mumbai and Hyderabad and 7 in major cities of UP. Once operational, the Company will
have 2 stations in Delhi and Mumbai, which are seen as the main market for advertising.
7 stations in UP have been taken to grow its presence in cities where it operates its Hindi
Newspaper through its subsidiary HMVL.
47288
39486
24080 22326
10112 7628 6649
3131 2949 1498 999
0
5000
10000
15000
20000
25000
30000
35000
40000
45000
50000
City Mirchi Big Red Fever One Suryan My FM Hello Indigo Oye
PAN india listenership trend ( in '000s)
17%
19%
14%
5%
11%
5%
0%
2%
4%
6%
8%
10%
12%
14%
16%
18%
20%
500
700
900
1100
1300
1500
1700
1900
2100
2300
2500
DB Corp Ltd Jagran HTML
Revenues from Radio (FY16) ( Rs mn)
Revenue CAGR(FY13-16) (RHS)
Radio as % of total revenues (FY16) (RHS)
Page 29
Print Media Sector Note Overweight
January 8, 2017 Analyst: Depesh Kashyap,CFA [email protected] (+91-7228934327) Page 29 of 35
Exhibit 64: Aggressive bidding by existing players in phase III auctions highlights their
bullish view on Radio industry
Source: FICCI-KPMG 2016, Equirus Research
HT media is way ahead with its Digital strategy:
Though digital revenues form very small part of the overall revenues of the print media
companies, but they are investing heavily to expand their digital presence. The digital
businesses of all companies are currently loss making as the industry still trying to figure
out the best business model. All the Companies have developed several news
websites/apps, jobs website, housing websites etc. In terms of news websites, DB Corp
has been able to attract maximum traffic as it has been able to leverage its strong brand
in the print space. HT media has made large investments in terms of Jobs portal like
Shine.com and has also ventured into education portals. Jagran has been a late starter
but is catching up fast with the peers.
Exhibit 65: HT Media is way ahead of peers as far as Digital revenues are concerned
Source: Company, Equirus Research
Exhibit 66: DB Corp leads in terms of attracting maximum traffic on its website
Source: Similarweb, Equirus Research
10
17
3
14
11
13 14
8
0
2
4
6
8
10
12
14
16
18
0.0
0.5
1.0
1.5
2.0
2.5
3.0
3.5
4.0
Fever 104 FM
(HT Media)
Radio Mirchi
Red FM 93.5
92.7 Big FM
Radio City 91.1 (Jagran)
94.3 MY FM (DB Corp)
95 FM Tadka
New entrants
Non-refundable One time entry fee (Rs bn) No. of frequencies (RHS)
5.4 5.4
2.5
5.3
0
1
2
3
4
5
6
0
5
10
15
20
25
30
35
Bhask
ar.
com
Jagra
n.c
om
hin
dust
anti
mes.
com
Liv
ehin
dust
an.c
om
Average traffic in Nov'16 (mn) Average visit duration(mins) (RHS)
460
213
1403 65%
38%
2% 1% 6%
0%
10%
20%
30%
40%
50%
60%
70%
0
200
400
600
800
1000
1200
1400
1600
DB Corp Ltd Jagran HT Media
Revenues from Digital (FY16) ( Rs mn)
Revenue CAGR(FY13-16) (RHS)
Digital as % of total revenues (FY16) (RHS)
Page 30
Print Media Sector Note Overweight
January 8, 2017 Analyst: Depesh Kashyap,CFA [email protected] (+91-7228934327) Page 30 of 35
Exhibit 67: Visitors spend more time on DB Corp’s website than others
Source: Similarweb, Equirus Research
Exhibit 68: Most of the traffic is routed through Social media or search engines
Source: Similarweb, Equirus Research
Exhibit 69: Standardised P&L (FY16) comparison of print companies
FY16, Rs. mn DB Corp Jagran HT Media HMVL
Revenues 100 100 100 100
RM Cost 30 30 29 38
Gross profit 70 70 71 62
Employee expenses 19 15 22 14
Other expenses 25 27 37 25
EBITDA 26 28 12 24
Conversion ratio (EBITDA/GP) 37% 40% 17% 38%
Depreciation 4 5 4 2
EBIT 22 23 8 21
Other Income/Expenses 1 -1 4 5
PBT 23 22 12 27
Tax 8 7 3 7
Tax rate(%) 36% 30% 28% 26%
Net Income 14 16 9 20
EBITDA margins (%) for FY16 26% 28% 12% 24%
PAT margins (%) for FY16 14% 16% 7% 20%
RoE(%) in FY16 23% 24% 8% 22%
Core RoIC (%) in FY16 21% 24% 12% 33%
Net debt/Equity in FY16 0.02x 0.04x 0.13x -0.06x
Source: Company, Equirus Research
32.9%
45.0%
69.8%
50.5%
20%
30%
40%
50%
60%
70%
80%
0 1 2 3 4 5 6 7 8 9
10 Bhask
ar.
com
Jagra
n.c
om
hin
dust
anti
mes.
com
Liv
ehin
dust
an.c
om
Pages per visit Bounce rate(RHS)
0%
10%
20%
30%
40%
50%
60%
70%
Social website
Search engines
Direct Referrals Mail Display
Bhaskar.com Jagran.com hindustantimes.com Livehindustan.com
Page 31
Print Media Sector Note Overweight
January 8, 2017 Analyst: Depesh Kashyap,CFA [email protected] (+91-7228934327) Page 31 of 35
Valuation: EV/EBITDA is our preferred methodology
Out of the various valuations methodologies available, we prefer EV/EBITDA methodology
over P/E and DCF and have valued the sector using it.
EV/EBITDA preferred over P/E mainly because:
1. The Companies in the sector have very strong balance sheet but have varied
amounts of Cash & current investments which leads to large differences in the
‘Other Income’ component in the P&L.
2. Companies in the sector follow different accounting policies for depreciation
and amortisation. For e.g. Jagran follows WDV method while others follow
straight line method.
EV/EBITDA preferred over DCF mainly because of the cyclicality of the business. Though
the business generates high operating cash flows and pay high dividends but the high
dependence of the business on advertisements makes it very cyclical and can lead to
various forecasting biases. We have done Sum of the Parts (SoTP) valuation for the
Companies which generate more than 10% revenues from different segments. This is
mainly true for Jagran Prakashan whose main segment is its print and publishing business
but its radio segment has also grown to a size (generating >11% of the consolidated
revenues) that it should be valued separately. Similarly, in case of HT Media, we have
done a SoTP valuation of both its Standalone and Hindi businesses(through its subsidiary
HMVL). The Company has also been growing its radio and digital businesses but in our
view, they still have to grow bigger, before the market values them independtly.
Exhibit 70 : EV/EBITDA trading range in the last 6 years
Source: Company, Equirus Research
Valuation summary
DB Corp: We initiate our coverage with Long rating and have arrived at our Mar’18 TP of
Rs. 450 using 11x EV/EBITDA multiple on our FY18 EBITDA estimates. The company has
always traded at a premium to its peers for its strong brand recognition and diversified
presence across various states. Our target EBITDA multiple of 11x, apart from being the
last 6 year average multiple, also underlines our estimated EBITDA CAGR (FY16-19E) of
14%, strong RoE (FY18E) of 28% and solid FCF yield (FY18E) of 6%.
Exhibit 71 : Valuation summary of the print media companies
Company Rating Mkt cap (Rs
mn)
Current Price
(Rs)
Target Price
(Rs) Upside(%)
P/E
(FY18e)
EV/EBITDA
(FY18e)
P/B
(FY18e)
EBITDA CAGR
(FY16-19e)
RoE
(FY18e)
Core RoIC
(FY18e)
Div.Yield(%)
(FY18e)
FCF Yield(%)
(FY18e)
DB Corp Long 68,614 373 450 21% 16.8 9.6 4.3 14% 27% 28% 3.3% 6.1%
Jagran Long 57,340 175 220 25% 15.5 8.5 3.0 9% 20% 20% 2.6% 7.6%
HMVL Long 20,066 273 370 35% 9.4 6.3 1.5 11% 18% 46% 0.5% 7.4%
HTML Trade 17,596 76 80 6% 10.5 4.6 0.8 9% 8% 12% 0.5% 14.2%
Source: Company, Equirus Research
9x
7x
5x 6x
11x
10x
7x
8x
14x 13x
8x
11x
3
5
7
9
11
13
15
DB Corp Jagran HMVL HTML
min average max
Page 32
Print Media Sector Note Overweight
January 8, 2017 Analyst: Depesh Kashyap,CFA [email protected] (+91-7228934327) Page 32 of 35
JagranPrakashan: We initiate our coverage with Long rating and have arrived at our
Mar’18 TP of Rs. 220 using SoTP valuation. We have valued the radio business separately
as Jagran has always run its radio business independently and it contributes ~11% to its
overall consolidated revenues. Jagran has also filed a DRHP for its radio business which
will unlock the value. We have valued its print business at 10x EBITDA multiple (average
multiple of the Company in the last 6 years) and the radio business at 14x EBITDA
multiple (~30% discount to ENIL due its smaller size and further holding company
discount) on our FY18E EBITDA estimates. We estimate EBITDA CAGR (FY16-19E) of 9%,
strong RoE (FY18E) of 20% and solid FCF yield (FY18E) of 8%.
HMVL: We initiate our coverage with Long rating and have arrived at our Mar’18 TP of Rs.
370 using 7x EV/EBITDA multiple on our FY18E EBITDA estimates. Due to its smaller size
and lower dividend payout ratio, HMVL has always traded at a discount to its larger
peers. Our target EBITDA multiple of 7x implies ~30% discount to its peers and is also the
average multiple at which the company has traded in the last 6 years. In our view, HMVL
can re-rate closer to its peers if it improves its dividend policy. We estimate EBITDA
CAGR (FY16-19E) of 11%, strong RoE (FY18E) of 18% and solid FCF yield (FY18E) of 7%.
HT Media: We initiate our coverage with Trade rating and have arrived at our Mar’18 TP
of Rs. 80 using SoTP valuation. We have valued the standalone business of HT Media and
its Hindi business (subsidiary HMVL) separately as both have different growth potential in
our view. We have valued its standalone business at 6x EV/EBITDA multiple (mix of lower
growth expectations from its English business and higher growth expected of Radio
business) and the Hindi business at 7x EV/EBITDA multiple (explained in HMVL above) on
our FY18 EBITDA estimates. We estimate EBITDA CAGR (FY16-19E) of 12%, strong RoE
(FY18E) of 7% and solid FCF yield (FY18E) of 14%.
Investment risks
1. Economic slowdown can result in lower than expected growth in advertising
revenues.
2. Higher than expected increase in newsprint costs will have negative impact on
earnings.
3. Floods or any other natural calamity in any particular state can affect the
growth of the leading player in those states.
Exhibit 72: EV/EBITDA (FY18E) vs. EBITDA CAGR (FY16-19E)
Source: Company, Equirus Research
Exhibit 73: EV/EBITDA (FY18E) vs. core RoIC (FY18E)
Source: Company, Equirus Research
DB Corp
Jagran
HMVL
HT Media
4.0
5.0
6.0
7.0
8.0
9.0
10.0
8% 9% 10% 11% 12% 13% 14% 15%
EV
/EBIT
DA
(FY
18e)
EBITDA CAGR (FY16-19e)
DB Corp
Jagran
HMVL
HT Media
4.0
5.0
6.0
7.0
8.0
9.0
10.0
5% 10% 15% 20% 25% 30% 35% 40% 45% 50%
EV
/EBIT
DA
(FY
18e)
Core RoIC (FY18e)
Page 33
Print Media Sector Note Overweight
January 8, 2017 Analyst: Depesh Kashyap,CFA [email protected] (+91-7228934327) Page 33 of 35
Exhibit 74: PE (FY18E) vs. EPS CAGR (FY16-19E)
Source: Company, Equirus Research
Exhibit 75: PE (FY18E) vs. RoE (FY18E)
Source: Company, Equirus Research
Exhibit 76: EV/EBITDA (FY18E) vs. EBITDA margin (%) (FY18E)
Source: Company, Equirus Research
Exhibit 77: EV/EBITDA (FY18E) vs. Dividend yield (%) (FY18E)
Source: Company, Equirus Research
DB Corp
Jagran
HMVL
HT Media
4.0
6.0
8.0
10.0
12.0
14.0
16.0
18.0
5% 10% 15% 20% 25% 30%
P/E
(FY
18e)
RoE (FY18e)
DB Corp
Jagran
HMVL
HT Media
4.0
5.0
6.0
7.0
8.0
9.0
10.0
10% 15% 20% 25% 30%
EV
/EBIT
DA
(FY
18e)
EBITDA margin(%) (FY16-19e)
DB Corp
Jagran
HMVL
HT Media
4.0
5.0
6.0
7.0
8.0
9.0
10.0
0.0% 0.5% 1.0% 1.5% 2.0% 2.5% 3.0% 3.5%
EV
/EBIT
DA
(FY
18e)
Dividend yield(FY18e)
DB Corp
Jagran
HMVL
HT Media
4.0
6.0
8.0
10.0
12.0
14.0
16.0
18.0
0% 2% 4% 6% 8% 10% 12% 14% 16% 18%
P/E
(FY
18e)
EPS CAGR (FY16-19e)
Page 34
Print Media Sector Note Overweight
January 8, 2017 Analyst: Depesh Kashyap,CFA [email protected] (+91-7228934327) Page 34 of 35
Demonetisation: Curious case of 3QFY17
Print and publishing companies were optimistic of the pickup in advertising in 2HFY17 on
back of good monsoons and rollout of 7th pay commission. All the companies talked about
the great festive season in October which raised their hopes of a solid revival in 2HFY17.
But with announcement of demonetisation on 8th November, the recovery has been
derailed. Most of the Companies have cut their advertisements spends in a big way and
that is expected to hurt the publishing companies who earn 70-80% of their revenues
through advertisements.
It is very difficult for anyone to guess how the companies will report their 3QFY17
numbers, so broadly if we break 3Q month wise Exhibit 78, we can expect the month of
October to be very good for all the companies also helped by soft comps. First 8 days of
November were also seeing positive momentum, but post the demonetisation
announcement, the companies have seen a big drop in advertisements (both in volumes
and yields). Jagran in their conference calls have talked about December being a better
month than November and they have seen some recovery happening. But exactly how
good October was, how bad the decline was in November and how sharp was the recovery
in December is very difficult to estimate and we will get the clearer picture when the
Companies come out with their 3Q numbers in Jan/Feb.
Exhibit 78: The curious case of 3QFY17
We have tried to analyse the impact of demonetisation of various sectors which are the
main advertisers for the print companies. Except organised retail, government and new
digital wallets/BFSI who have gained market share because of demonetisation, rest of the
sectors have been hit and have cut their advertising spends. Generally, whenever
advertising falls, the print companies have few levers which they use to cut their costs:
1. Increase in cover prices
2. Decrease in pagination
3. Decrease in weight of paper
4. More use of domestic paper
But in this case, we do not think that Companies will be increasing their cover prices
further (last year most of them did), as they are focussing on increasing their circulation
as the new readership survey is round the corner (expected in 2QFY18). The other levers
of pagination, grammage and mix of domestic paper, the Companies are already using in
our view.
Source: Equirus Research
October
Expected to be very strong
festive month for all the companies
November
Advertisements ( esp. local)
expected to fall sharply post
demonetisation. Also last year Diwali was in November, so this month has strong comps.
December
The demand is expected to revive slowly
Page 35
Print Media Sector Note Overweight
January 8, 2017 Analyst: Depesh Kashyap,CFA [email protected] (+91-7228934327) Page 35 of 35
Exhibit 79: Impact of demonetisation of currency on various important sectors for Print media
Source: Mint, Equirus Research, *green colour signifies positive effect, red signifies negative impact and yellow signifies neutral impact
Page 36
January 8, 2017 Analyst: Depesh Kashyap, CFA [email protected] (+91-7228934327) Page 1 of 14
Before reading this report, you must refer to the disclaimer on the last page.
DB Corp Limited Absolute : LONG
Relative : Overweight
Initiating Note Regular Coverage 16% ATR in 15 months
Diversified play on India’s print story Media & Entertainment
© 2017 Equirus. All rights reserved.
Rating Information
Price (Rs) 373
Target Price (Rs) 450
Target Date 31st Mar'18
Target Set On 6th Jan’17
Implied yrs of growth (DCF) 15
Fair Value (DCF) 488
Fair Value (DDM) 445
Ind Benchmark BSETECK
Model Portfolio Position NA
Stock Information
Market Cap (Rs Mn) 68,614
Free Float (%) 30.07 %
52 Wk H/L (Rs) 447.8/283.4
Avg Daily Volume (1yr) 58,165
Avg Daily Value (Rs Mn) 21
Equity Cap (Rs Mn) 1,839
Face Value (Rs) 10
Bloomberg Code DBCL IN
Ownership Recent 3M 12M
Promoters 69.9 % 0.0 % -0.1 %
DII 6.2 % -0.8 % -1.5 %
FII 18.6 % 0.1 % 0.1 %
Public 5.3 % 0.8 % 1.4 %
Price % 1M 3M 12M
Absolute 7.0 % -3.7 % 16.7 %
Vs Industry 5.4 % 0.5 % 25.2 %
JAGRAN 2.7 % -11.6 % 4.2 %
HMVL 5.2 % -8.0 % -5.3 %
Consolidated Quarterly EPS forecast
Rs/Share 1Q 2Q 3Q 4Q
EPS (16A) 3.6 3.2 5.8 3.5
EPS (17E) 5.6 4.6 5.1 3.7
Dainik Bhaskar is the highest circulated news daily in India and is ranked fourth in
the world in terms of circulation. Wider reach, strong execution capability and
leadership position in most of the markets it is present gives the company a strong
competitive advantage over its peers. In our view, current valuations provide a good
entry point, given the strong elections pipeline, strong balance sheet, high cash flow
generation, high RoE (20% even in downturns) and consistently high dividend payouts
(~50%). We estimate EBITDA to grow at a CAGR of 14% over the period FY16-19E and
initiate our coverage with a Long rating with Mar’18 TP of Rs. 450.
News radio frequencies and strong election pipeline to drive growth: DB Corp
acquired 13 new frequencies in the phase III radio auctions last year, once launched
(expected by end of FY17E) and fully operational, these new stations will provide a
significant boost to radio revenues. All radio frequencies have been acquired in the
cities of Maharashtra, Haryana, Gujarat and Rajasthan, where DB Corp already has a
strong presence in print segment. In our view, strong brand presence in these states
will lead to faster turnaround for the radio business as well. Strong elections
pipeline in states of Punjab (February FY17), Gujarat (FY18), MPCG & Rajasthan
(FY19), where DB Corp is a market leader shall provide support to the advertising
growth momentum. We estimate revenue CAGR of 11% over FY16-19E driven by
both circulation and advertising growth.
Multiple levers to drive profitability higher: The company expects newsprint cost
(40-50% of total cost) to increase by 3%-5% in the near term, also launch of new
radio stations will put some pressure on the margins in the near term (as radio
stations take around 3 years to breakeven) but rising share of radio (higher margin
segment) in the overall revenues and maturing of Jharkhand & Maharashtra editions
in FY17 and Bihar edition expected FY18 (as it will be completing its fourth year),
margins are expected to improve. Also, barring the impact of demonetization, the
margin pressures are expected to be offset by the revival in advertisement as the
economy picks up with further boost coming from elections in the states where DB
Corp is a clear market leader.
Initiate coverage with Long rating and Mar’18 TP of Rs. 450: We initiate our
coverage with Long rating and Mar’18 TP of Rs. 450 based on 11x on EV/EBITDA
multiple on our FY18 estimates. Downside risks: Slower pickup in economy and
corporate earnings will affect advertising growth and higher than expected increase
in newsprint costs will put pressure on margins.
Consolidated Financials
Rs. Mn YE Mar FY16A FY17E FY18E FY19E
Sales 20,519 22,541 25,302 27,769
EBITDA 5,345 6,302 7,159 8,010
Depreciation 878 914 942 943
Interest Expense 92 86 86 86
Other Income 281 141 156 211
Reported PAT 2,966 3,538 4,086 4,674
Recurring PAT 2,966 3,538 4,086 4,674
Total Equity 13,466 14,544 16,001 17,941
Gross Debt 2,416 2,416 2,416 2,416
Cash 924 1,892 3,481 5,618
Rs Per Share FY16A FY17E FY18E FY19E
Earnings 16.1 19.0 22.2 25.4
Book Value 73 79 87 98
Dividends 11.0 11.4 12.2 12.7
FCFF 7.7 18.7 22.9 26.1
P/E (x) 23.1 19.6 16.8 14.7
P/B (x) 5.1 4.7 4.3 3.8
EV/EBITDA (x) 13.4 11.2 9.6 8.3
ROE (%) 23 % 25 % 27 % 28 %
Core ROIC (%) 21 % 24 % 28 % 32 %
EBITDA Margin (%) 26 % 28 % 28 % 29 %
Net Margin (%) 14 % 16 % 16 % 17 %
Page 37
DB Corp Limited Absolute – LONG Relative – Overweight 16% ATR in 15 months
January 8, 2017 Analyst: Depesh Kashyap,CFA [email protected] (+91-7228934327) Page 2 of 14
Company Snapshot
How we differ from Consensus
- Equirus Consensus % Diff Comment
EPS FY17E 19.0 20.8 -8 % The consensus estimates have not been
revised post the demonetisation drive in
our view FY18E 22.2 24.5 -9 %
Sales FY17E 22,541 22,905 -2 %
FY18E 25,302 25,712 -2 %
PAT FY17E 3,538 3,788 -7 %
FY18E 4,086 4,492 -9 %
Our Key Investment arguments:
1. Multiple growth engines in the near term: DB Corp acquired 13 new
frequencies in the phase III auctions last year, once launched (expected by end
of FY17E) and fully operational, these new stations will provide a significant
upside to the radio business. All the stations have been acquired in the cities of
Maharashtra, Haryana, Gujarat and Rajasthan, where the company already has a
strong print media presence. The strong elections pipeline to provide support to
the advertising growth momentum. We estimate revenue growth of CAGR 11% in
FY16-19E driven by advertising growth.
2. Multiple levers to drive profitability higher: The company expects newsprint
cost (40-50% of total cost) to increase by 3-5% in the near term, also the launch
of new radio stations will put some pressure on the margins in the near term ( as
radio stations take around 3 years to breakeven). But this pressure is expected
to be offset by the revival in advertisement as the economy picks up with
further boost coming from the elections in the states where DB Corp is a clear
market leader.
3. Strong balance sheet and cash flow generation to protect the downside:
Company is currently focusing on its radio and digital business and there is no
major capex expected in the next few years. Though, there will be some
increase in circulation in the existing markets, but with no new launches
planned in the print business in the near term, we estimate strong free cash
flow generation and high dividend payout, which should protect the downside
for investors.
Risk to Our View:
1. Slowdown in economy
2. Newsprint prices rise more than expected
Key Triggers
Revival in the advertisement growth
Sensitivity to Key Variables % Change % Impact on EPS
Newsprint prices 10 % -11 %
Advertisement revenues 10 % 13 %
- - -
DCF Valuations & Assumptions
Rf Beta Ke Term. Growth Debt/IC in Term. Yr
6.8 % 0.6 10.4 % 4.0 % 10.0 %
- FY17E FY18E FY19-21E FY22-26E FY27-31E
Sales Growth 10 % 12 % 10 % 8 % 8 %
NOPAT Margin 16 % 16 % 17 % 15 % 15 %
IC Turnover 1.53 1.73 2.11 2.10 2.10
Core RoIC 23.9 % 27.5 % 35.9 % 33.0 % 32.7 %
Years of strong growth 1 2 5 10 15
Valuation as on date (Rs) 275 315 413 397 433
Valuation as of 31st Mar'18 310 355 466 448 488
Based on DCF, we derive 31st March 2018 fair value of Rs. 488.
Company Description:
D B Corp Ltd. is engaged in printing and publication of Newspaper in four languages
across 14 states, in Radio Business with "94.3 MY FM" Radio station in 7 states and 24
cities along with strong web presence in India. DBCL is the only media house to enjoy
leadership at multiple states, in multiple languages and with well diversified readership.
Comparable valuation Mkt Cap
Rs. Mn.
Price
Target
Target
Date
EPS P/E BPS P/B RoE Div Yield
Company Reco. CMP FY16A FY17E FY18E FY16A FY17E FY18E FY16A FY17E FY16A FY17E FY18E FY16A FY17E
DB Corp LONG 373 68,614 450 Mar'18 16.1 19.0 22.2 23.1 19.6 16.8 73.3 4.7 23 % 25 % 27 % 3.6 % 3.6 %
Jagran LONG 175 57,340 220 Mar'18 10.1 9.4 11.3 17.3 18.7 15.5 48.4 3.3 24 % 18 % 20 % 0.0 % 2.1 %
HMVL LONG 273 20,066 370 Mar'18 24.6 27.1 29.0 11.1 10.1 9.4 123.8 1.8 22 % 20 % 18 % 0.4 % 0.5 %
Page 38
DB Corp Limited Absolute – LONG Relative – Overweight 16% ATR in 15 months
January 8, 2017 Analyst: Depesh Kashyap,CFA [email protected] (+91-7228934327) Page 3 of 14
Investment rationale
Multiple growth engines to drive growth in the near term: DB Corp is the largest print
media company in India with a strong brand portfolio. It’s key brand “Dainik Bhaskar”
which is a Hindi newspaper is present across 12 states, “Divya Bhaskar” Gujarati
newspaper in 2 states and “Divya Marathi” a Marathi Newspaper in Maharashtra. It also
owns FM radio network (94.3 MY FM), currently it is present in 7 states with 24
operational stations, 6 more stations are expected to be launched by the end of FY17E.
The company has also made good investments in the digital space and currently has 13
portals and 2 apps. Exhibit 1 shows the brand portfolio of DB Corp.
Exhibit 1: Strong brand portfolio provide multiple growth avenues
Source: Company, Equirus Research
a) Print business: DB Corp is the largest circulated newspaper in India with
total circulation of approx. 5.3mn newspaper daily and a readership of close
to 44mn. It has wider geographic reach than any of its peers and has a well
distributed readership base across various states which make it resilient to
any region specific economic downturn.
Exhibit 2: DainikBhaskar is amongst the top circulated newspapers in the world
Source: Company, Equirus Research
Exhibit 3: Even distribution of readership across states protects downside
Source: IRS 4Q12, Equirus Research
The states where DB Corp is present has higher GDP growth rates than the average
growth rate of India.
Hindi Newspaper
Dainik Bhaskar
12 states, 40 editions
Regional Newspaper
Divya Bhaskar & Divya Marathi
2 states, 14 editions
FM Radio Network
94.3 MY FM
7 states, 24 stations (6 more to be launched)
Digital & Mobile
DB digital
13 portals & 2 apps
Major brands
1000 2000 3000 4000 5000 6000 7000 8000 9000
10000
The Y
om
iuri
Shim
bun
The A
sahi Shim
bun
USA T
oday
Dain
ik B
hask
ar
The M
ain
ichi
New
spapers
Cankao X
iaoxi
Dain
ik J
agra
n
The T
imes
of
India
The N
ikkei
People
's D
aily
CIRCULATION (000)
26%
32%
19%
12%
4% 7%
Readership matrix(%)
MPCG
Rajasthan
Gujarat
Chd,Punjab, Haryana
Jharkhand
Maharashtra
Page 39
DB Corp Limited Absolute – LONG Relative – Overweight 16% ATR in 15 months
January 8, 2017 Analyst: Depesh Kashyap,CFA [email protected] (+91-7228934327) Page 4 of 14
Exhibit 4: Healthy GDP growth rates of States where DB Corp enjoys market
leadership
Source: Ministry of statistics, Equirus Research
i) Circulation revenues estimated to grow at CAGR (FY16-19E) of 7%: The
Company has been able to maintain its position as the largest circulated
daily for the last 2.5 years, as per Audit Bureau of Circulation growth. For
the past 5 years, the Company has been able to grow its circulation
revenues at a CAGR of 15% with volume growth of 5% and rest of the growth
driven by yield in its core legacy markets of MPCG and Rajasthan.
Company’s continuous focus on high quality content (having tie ups with
The Economist, Harvard business review, TIME magazine and New York
Times) has led to growth in readership despite increase in its cover price. In
our view, it will be difficult for the company to maintain its double digit
circulation growth as the prices cannot be raised beyond a level due to
competitive pressures. Barring a few cities in Maharashtra, the Company has
no plans to expand in newer geographies in the near future but the company
will focus on increasing its market share in Gujarat, Rajasthan & Punjab,
followed by Bihar, Jharkhand and in some parts of Madhya Pradesh. We
estimate the circulation revenue CAGR of 7% over the period of FY16-19E.
Exhibit 5: Circulation revenue estimated to grow at CAGR (FY16-19E) of 7%
Source: Company, Equirus Research
ii) Led by volumes, advertising revenue to grow at CAGR (FY16-19E) of 11%:
In the last 5 years, the Company has grown its advertising revenues at a
CAGR of 7% which was lower than the industry. FY16 saw a decline of 5% in
the advertising revenues as the Company undertook a “Right Price”
initiative in which it raised the advertising yields for the clients which led to
significant drop in volumes. Now that the Company has fixed its advertising
rates at a new level, it is focusing on regaining its market share. The
negative impact of demonetization will delay the expected pick up in
advertising volumes but when it normalizes, DB Corp should see a volume
led revival in advertisement revenues driven by regaining market share and
revival in economy. Also, with a lower base of last year, Company is
estimated to do better than peers in FY17E. Consumption should improve in
Tier 2 and 3 cities driven by good monsoons and implementation of 7th pay
commission which should drive advertising growth. We estimate
advertisement revenue CAGR of 11% over FY16-FY19E.
4
6
8
10
12
14
16
18
2010-11 2011-12 2012-13 2013-14 2014-15
Bihar Jharkhand Madhya Pradesh
Chhattisgarh Rajasthan Punjab 1000
1500
2000
2500
3000
3500
4000
4500
5000
5500
6000
FY11 FY12 FY13 FY14 FY15 FY16 FY17e FY18e FY19e
Circulation revenue ( Rs mn)
Page 40
DB Corp Limited Absolute – LONG Relative – Overweight 16% ATR in 15 months
January 8, 2017 Analyst: Depesh Kashyap,CFA [email protected] (+91-7228934327) Page 5 of 14
Exhibit 6: Advertising revenue growth to be driven by volumes
Source: Company, Equirus Research
b) New radio frequencies to drive revenue CAGR (FY16-19E) of 19%:
Company is running its radio business (94.3 MY FM) in-line with its strategy
of print business i.e. focus on non-metro cities. During the phase III
auctions, the company acquired 13 new radio frequencies in the states of
Maharashtra, Haryana, Gujarat and Rajasthan where it has strong print
media footprint. Currently, MY FM operates from 24 stations in 7 states and
rest of the 6 stations is expected to be launched by end of FY17E.
Generally, a new radio station takes around 3 years to breakeven, but the
existing print media presence, shall help new stations to breakeven faster
as the company should get some synergy benefits. We estimate the radio
business to grow at a CAGR of 19% in FY16-19E helped by volume
enhancement due to launch of new stations.
Exhibit 7: Radio business to scale new heights in next few years
Source: Company, Equirus Research
c) Digital - The way forward: Digital media is the fastest growing segment in
the media industry currently. DB Corp has been among the front runners to
grow their presence in online space. The digital business of the Company,
though has a very small base, but is growing at an exponential pace. DB
Corp has been leading the digital revolution by creating 13 portals and 2
apps, through which the company offers instant/real time and engaging
content. The Company is giving greater emphasis in Hindi, Gujarati and
Marathi- 3 of the top 5 regional languages. Exhibit 8 clearly shows that
among the various news websites in India, bhaskar.com clearly attracts the
maximum traffic along with Times of India. As in print media, the Company
is trying to focus on content as the key differentiating factor in digital space
as well. It has created an exclusive content team for its digital properties;
the editorial strength for only digital division is close to 300+ journalists.
Exhibit 8: Dainik Bhaskar along with TOI attracts maximum traffic (mn) online
1000
3000
5000
7000
9000
11000
13000
15000
17000
19000
Advertisement revenue (Rs mn)
200
400
600
800
1000
1200
1400
1600
1800
2000
FY11 FY12 FY13 FY14 FY15 FY16 FY17e FY18e FY19e
Radio business (Rs mn)
Page 41
DB Corp Limited Absolute – LONG Relative – Overweight 16% ATR in 15 months
January 8, 2017 Analyst: Depesh Kashyap,CFA [email protected] (+91-7228934327) Page 6 of 14
Source: Similarweb, Equirus Research
Though currently, the digital business contributes only 2.4% to company’s total revenues,
but given the strong growth in digital space, we estimate digital business will gain its
share to 4% of total revenues in next 3 years growing at a CAGR of 27% FY16-19E.
Exhibit 9: Strong growth in Digital shall continue
Source: Company, Equirus Research
Exhibit 10: Revenues estimated to grow at CAGR (FY16-19E) of 11%
Source: Company, Equirus Research
Margins to remain strong despite near term pressures
The rising crude oil prices has got investors worried of the raw material inflation that the
company may have to face in the next few years. We have argued that print companies
have some levers to moderate the impact of cost inflation like reducing consumption of
paper by decreasing pagination, weightage of paper and using more domestic paper than
imported. However, we do agree that Company may have to face ~5% inflation in the
next couple of quarters. Also, there will be increase in operational and employee costs as
the Company launches its new radio stations. Demonetization of currency is expected to
further delay the recovery in advertisements by couple of quarters. But once its impact
normalizes, we estimate the margins to increase mainly due to following reasons:
a) Maturing of Jharkhand, Maharashtra and Bihar editions to help margins:
Company has strong hold on its legacy markets of Madhya Pradesh &
Chhattisgarh (MPCG), Chandigarh, Punjab & Haryana (CPH), urban Rajasthan and
urban Gujarat, where it is present for many years. However, the newer markets
of Jharkhand, Maharashtra and Bihar are classified as emerging editions.
Normally, it takes 4 years for a new state launch to breakeven, Jharkhand and
Maharashtra have already been moved to mature category by the Company in
FY17 and Bihar (which was launched in FY14) is expected to breakeven by FY18.
As the investment phase in these states peaks out, the margins shall improve.
0
5
10
15
20
25
30
35
40
June July August September October November
Bhaskar.com Jagran.com livehindustan.com
hindustantimes.com ToI.com
0.2% 0.5%
0.7% 0.9%
1.7%
2.4% 2.6%
2.9%
3.6%
0.0%
0.5%
1.0%
1.5%
2.0%
2.5%
3.0%
3.5%
4.0%
0
100
200
300
400
500
600
700
800
900
1000
FY11 FY12 FY13 FY14 FY15 FY16 FY17e FY18e FY19e
Digital revenues (Rs mn) % of total revenues
5,000
10,000
15,000
20,000
25,000
30,000
FY13 FY14 FY15 FY16 FY17e FY18e FY19e
Net Sales (Rs mn)
CAGR(FY13-16) 9%
CAGR(FY16-19e) 11%
Page 42
DB Corp Limited Absolute – LONG Relative – Overweight 16% ATR in 15 months
January 8, 2017 Analyst: Depesh Kashyap,CFA [email protected] (+91-7228934327) Page 7 of 14
Exhibit 11: Maturing of Jharkhand, Maharashtra editions in FY17 and Bihar expected
in FY18 shall help margins
Source: Company, Equirus Research
b) Increasing share of Radio business: DB Corp has been running its radio business
very efficiently (see Exhibit 12), with margins ~40% which are the best in the
industry. New launches of radio stations will put some pressure on margins due
to rising operating and employee costs and the new stations may take 3-4 years
to breakeven. But as the revenue share of Radio business increases in the overall
revenues of the company, it should be margin accretive.
Exhibit 12: High growth and higher margin business of Radio
Source: Company, Equirus Research
We estimate EBITDA to grow at a CAGR (FY16-19E) of 14%.
Exhibit 13: EBITDA estimated to grow at a CAGR (FY16-19E) of 14%
Source: Company, Equirus Research
Strong balance sheet and cash flow generation to protect the downside
DB Corp has a strong balance sheet with minimal debt on the balance sheet, its net
debt/equity stood at 0.1x in FY16. With strong cash flow from operations (~Rs. 4,000mn)
and minimal capital expenditure in the next few years, we estimate the company to have
a free cash flow yield of 5% in FY17E and 7% in FY18E. The Company has also maintained
good dividend payout ratio of approximately 50% over the last few years. DB Corp has an
excellent track record of maintaining sector leading return ratios, even in the downturn
period of FY09 and FY12, DB Corp was able to maintain its RoE above 20%.
-60%
-40%
-20%
0%
20%
40%
0
5000
10000
15000
20000
FY12 FY13 FY14 FY15 FY16
Mature editions revenues( Rs mn)
Emerging editions revenues (Rs mn)
Mature editions EBITDA margin(%)
Emerging editions EBITDA margin(%)
22.4%
32.6%
39.7% 41.0%
37.2%
0%
5%
10%
15%
20%
25%
30%
35%
40%
45%
0
200
400
600
800
1000
1200
FY12 FY13 FY14 FY15 FY16
Revenues (Rs mn) EBITDA margin(%) (RHS)
24%
27%
28%
26%
28% 28%
29%
20%
21%
22%
23%
24%
25%
26%
27%
28%
29%
30%
2,000
3,000
4,000
5,000
6,000
7,000
8,000
9,000
FY13 FY14 FY15 FY16 FY17e FY18e FY19e
EBITDA(Rs mn) EBITDA margin(%)
Page 43
DB Corp Limited Absolute – LONG Relative – Overweight 16% ATR in 15 months
January 8, 2017 Analyst: Depesh Kashyap,CFA [email protected] (+91-7228934327) Page 8 of 14
Exhibit 14: Dividend payout ratio estimated to remain strong
Source: Company, Equirus Research
Exhibit 15: DB Corp maintained high RoE even in downturns
Source: Company, Equirus Research
Valuation
DB Corp currently trades at EV/EBITDA of 10x and PE multiple of 17x on our FY18
estimates. The Company has historically traded in the range of EV/EBITDA of 9x-13x.
Since the radio and digital businesses of the Company still remain a small part of the
overall consolidated revenues of the Company, we value DB Corp by applying EV/EBITDA
multiple of 11x (which is the average multiple at which it has traded for the last 6 years)
on our FY18 EBITDA estimate of Rs. 7,159mn. Our target price derivation is shown in the
Exhibit below. Our target price of Rs. 450 implies a PE multiple of 20x on our FY18 EPS
estimates.
Exhibit 16: Target price derivation of DBCL
Rs mn EBITDA (FY18e) Multiple Valuation
DB Corp 7,159 11x 80,892
(-)Debt
2,416
(+)Cash and cash equivalents
3,481
Equity value
81,956
Outstanding shares(mn)
183.9
Target price(Rs)
450
Source: Equirus Research
46% 43% 45%
68%
60%
55% 50%
20%
30%
40%
50%
60%
70%
80%
2.0
4.0
6.0
8.0
10.0
12.0
14.0
FY13 FY14 FY15 FY16 FY17e FY18e FY19e
Dividend per share Payout ratio (%)(RHS)
18%
23%
28%
33%
38%
43%
FY08 FY09 FY10 FY11 FY12 FY13 FY14 FY15 FY16 FY17e FY18e FY19e
RoE
Page 44
DB Corp Limited Absolute – LONG Relative – Overweight 16% ATR in 15 months
January 8, 2017 Analyst: Depesh Kashyap,CFA [email protected] (+91-7228934327) Page 9 of 14
Exhibit 17: EV/EBITDA vs. EBITDA growth of DBCL
Source: Company, Equirus Research
Exhibit 18: P/E vs. EPS growth of DBCL
Source: Company, Equirus Research
Investment Risk & Concerns
Another economic slowdown can result in lower expected growth in advertising
revenue: A slowdown in the economy can result in lesser than expected media spend by
the corporates, which can have a negative impact on the advertising revenue of DBCL,
which contributes almost 75% to the total revenue.
Higher than expected increase in newsprint price will have a negative impact on the
operating margins: Newsprint prices account for 30-40% of the total sales and 40-50% of
the total cost component. Newsprint prices are strongly correlated to crude oil prices
which have been rising lately and may put some stress on operating margins.
Rising competition: DBCL operated in a highly competitive environment. Most of the
states that it operates in have 2 or 3 other players as well. If competition reduces their
cover prices or advertisement rates to gain market share, it will put pressure on DBCL as
well.
-5%
0%
5%
10%
15%
20%
25%
0
20000
40000
60000
80000
100000
120000
140000
Mar/10
Sep/10
Mar/11
Sep/11
Mar/12
Sep/12
Mar/13
Sep/13
Mar/14
Sep/14
Mar/15
Sep/15
Mar/16
Sep/16
Mar/17
Sep/17
Mar/18
8x
10x
13x
14x
16x
EBITDA Growth
-20%
-10%
0%
10%
20%
30%
40%
0100200300400500600700
Mar/10
Sep/10
Mar/11
Sep/11
Mar/12
Sep/12
Mar/13
Sep/13
Mar/14
Sep/14
Mar/15
Sep/15
Mar/16
Sep/16
Mar/17
Sep/17
Mar/18
10x
15x
20x
25x
30x
EPS Growth
Page 45
DB Corp Limited Absolute – LONG Relative – Overweight 16% ATR in 15 months
January 8, 2017 Analyst: Depesh Kashyap,CFA [email protected] (+91-7228934327) Page 10 of 14
Corporate Governance
Following are key highlights of our preliminary assessment of level of corporate
governance in the company through its FY16 Annual Report:
Board of directors
Composition: The Board of Directors of the Company comprises of nine
members with two Executive Directors and seven Non-executive
Directors. The Chairman of the Board is Non-executive Director. There
are five Independent Directors and four Non-independent Directors on
the Board of the Company.
Background: All the members of the Board are associated with the
Company since November, 2007 or even earlier. Each of them has rich
experience in his/her respective field.
Distribution of power: Four of the board level committees: Audit
committee, Nomination and remuneration committee, Compensation
committee and the CSR committee are headed by Ashwani Kumar
Singhal who is an independent director while Stakeholder’s relationship
committee is headed by Mr. Girish Agarwal who is non-independent
director and Executive Committee is headed by Mr. Ramesh Chandra
Agarwal (Non-executive Chairman).
Disclosure Norm: As per our preliminary study, we do not find any issues on this
front, company follows disclosure norms as stipulated by the listing agreement
of the exchanges and is timely in coming up with quarterly results and other
disclosures.
Annexure 1: Company Overview DB Corp Ltd is engaged in printing and publishing of newspaper in 4 languages across 14
states and 62 editions. DainikBhaskar (Hindi Daily) is the highest circulated news daily in
India and is ranked fourth in the world in terms of circulation.
DBCL has transformed itself from a single state player to a national player, the company
has displayed consistent track record of growth in the past by maintaining leadership
position in each and every market it operates. DBCL has a proven business model with
strong execution capabilities and has demonstrated success in each of the market it had
entered. DBCL’s proven market entry strategy has redefined category norms and broke
barriers across languages, geography and medium, time and again.
Exhibit 19: DB Corp business overview
Source: Company, Equirus Research
Print: The Company has a leading Hindi Newspaper brand “DainikBhaskar” which is
present across 12 states. Its Gujarati Newspaper “DivyaBhaskar” which is published in 2
states and 1 Marathi newspaper “Divya Marathi” which is published in 1 state.
D B Corp ltd
Print
Newspapers
Dainik Bhaskar
Divya Bhaskar
Divya Marathi
Saurashtra Samachar
DNA, DB Post, DB Star
Periodicals
AHA Zindagi
Bal Bhaskar
Young Bhaskar
Radio
94.3 MY FM
7 states, 24 stations (6 stations in the pipeline)
Digital
13 portals and 2 Apps
Page 46
DB Corp Limited Absolute – LONG Relative – Overweight 16% ATR in 15 months
January 8, 2017 Analyst: Depesh Kashyap,CFA [email protected] (+91-7228934327) Page 11 of 14
FM Radio: DBCL operate FM radio business under the brand name (94.3 MY FM). It
currently operates 24 FM radio stations and will be soon launching another 6 stations. The
radio stations concentrate on music, talk shows and other entertainment oriented
programs which offer significant interaction with the listeners. Most of the radio stations
are present in markets in which DBCL also have a newspaper presence, which makes it
easier for DBCL to promote their radio programs to both advertisers and listeners. The
radio business derives its revenue from advertisements and sponsorships.
Digital: DB Digital has 13 portals which provide content across genres such as news,
fashion, spiritual, sports, entertainment and home-buying &rental. It also has 2 apps
DainikBhaskar and DivyaBhaskar mobile apps which provide users with rich collection of
information and entertainment.
Company history
1958: DainikBhaskar launched its first edition in Bhopal
1995: DainikBhaskar emerged as the No.1 in Madhya Pradesh
1996: DainikBhaskar launches its Jaipur Edition and becomes No. 1 from 1st day
1996: Expands in Haryana and Chandigarh
2003: Launches “DivyaBhaskar” edition from Ahmedabad. It was the biggest launch of
newspaper edition across languages
2004: Initiates presence in Maharashtra and also acquires “SaurashtraSamachar” in
Gujarat. Also launched its new Hindi Magazine “AHA! Zindagi.
2005: Inception of D B Corp Ltd, pursuant to the demerger of publishing business of
Writers and publishers limited (WPL). Launches its Radio business through its subsidiary
SMEL in 17 stations in the name of MY FM
2006: Enters Punjab and launched Amritsar and Jalandhar edition
2010: Listing of DB Corp public issue on BSE and NSE. Launched in its 12th state of
Jharkhand
2011: Launched Divya Marathi in Maharashtra, the 4th language newspaper of the group
2014: DB Corp Ltd, launches its newspaper in Patna-Bihar
2015: Acquired 13 new stations in Phase 3 Radio Auctions.
Key Management profile
Mr Ramesh Chandra Agarwal – Chairman
Mr Ramesh has over five decades of experience, is also serving as Chairman of FICCI of
the MP region. He is included in India Today’s list of 50 most powerful persons in India
Mr. Sudhir Agarwal –Managing director
Mr. Sudhir has 27 years of experience in the publishing and newspaper business. He is
responsible for Company’s long term vision, business planning and performance
monitoring
Mr. Pawan Agarwal – Deputy Managing Director Mr. Pawan has 13 years of experience in the publishing business. He heads entire
production, IT and Strategy department, with the Radio and Digital business.
Mr. Girish Agarwal – Non-executive Director
Mr. Girish has 20 years of experience. He was awarded “Outstanding Entrepreneur”
trophy at APEA. He provides direction to the marketing strategy and related operations of
the group.
MrPiyushPandey- Independent Director
Mr. Piyush is the Executive Chairman of Ogilvy & Mather pvt. Limited, India
Mr. Harish Bijoor- Independent Director
Mr. Harish is a member of the planning group sub-committee of the Union planning
commission of India
Mr. Ashwani Kumar Singhal- Independent Director
Mr. Ashwani is a vice president of BIR Brussels, the International Authority in Non-Ferrous
metals
Mr. Naveen Kumar Kshatriya- Independent Director
Mr. Naveen has 40 years of international experience with Unilever and BP Castrol at
senior most position at UK, Middle East, Singapore and Hong Kong.
Ms. Anupriya Acharya- Independent Director
Ms. Anupriya is a post graduate from IIT-Roorkee, was Zenith Optimedia’s group CEO and
now CEO of Publicis media.
Page 47
DB Corp Limited Absolute – LONG Relative – Overweight 16% ATR in 15 months
January 8, 2017 Analyst: Depesh Kashyap,CFA [email protected] (+91-7228934327) Page 12 of 14
Standalone Quarterly Earnings Forecast and Key Drivers Rs in Mn 1Q16A 2Q16A 3Q16A 4Q16A 1Q17A 2Q17A 3Q17E 4Q17E 1Q18E 2Q18E 3Q18E 4Q18E FY16A FY17E FY18E FY19E
Revenue 4,733 4,780 5,853 5,140 5,703 5,286 5,970 5,571 6,273 5,815 7,165 6,039 20,507 22,531 25,292 27,759
Raw Material Consumed 1,448 1,495 1,663 1,580 1,600 1,634 1,763 1,664 1,759 1,798 1,975 1,815 6,187 6,661 7,347 8,025
Event Expenses 0 0 0 0 0 0 0 0 0 0 0 0 0 0 0 0
Other expenses 0 0 0 0 0 0 0 0 0 0 0 0 0 0 0 0
- - - - - - - - - - - - - - - - -
- - - - - - - - - - - - - - - - -
EBITDA 1,225 1,127 1,875 1,152 1,821 1,514 1,694 1,310 1,935 1,601 2,291 1,369 5,379 6,339 7,196 8,047
Depreciation 208 215 232 222 211 216 240 246 235 235 235 235 877 913 941 942
EBIT 1,018 912 1,643 930 1,611 1,298 1,454 1,064 1,700 1,366 2,056 1,134 4,503 5,427 6,255 7,105
Interest 21 27 19 24 34 6 22 25 22 22 22 22 92 86 86 86
Other Income 68 53 37 123 42 42 28 28 39 39 39 39 282 141 156 211
PBT 1,064 938 1,661 1,030 1,619 1,335 1,460 1,067 1,717 1,383 2,073 1,151 4,692 5,481 6,325 7,230
Tax 393 337 585 374 568 440 526 384 601 484 726 403 1,690 1,918 2,214 2,530
Recurring PAT 671 601 1,075 655 1,050 895 935 683 1,116 899 1,348 748 3,002 3,563 4,111 4,699
Extraordinary 0 0 0 0 0 0 0 0 0 0 0 0 0 0 0 0
Reported PAT 671 601 1,075 655 1,050 895 935 683 1,116 899 1,348 748 3,002 3,563 4,111 4,699
EPS (Rs) 3.89 3.48 6.24 3.80 5.70 4.68 5.08 3.72 6.07 4.89 7.33 4.07 16.32 19.18 22.36 25.56
Key Drivers
Ad revenue(in Rs mn) - - - - - - - - - - - - 13,282 14,345 16,387 18,026
Circulation revenue(in Rs mn) - - - - - - - - - - - - 4,356 4,893 5,139 5,346
Revenue from radio business(in Rs mn)
- - - - - - - - - - - - 1,076 1,270 1,524 1,828
- - - - - - - - - - - - - - - - -
- - - - - - - - - - - - - - - - -
- - - - - - - - - - - - - - - - -
Sequential Growth (%)
Revenue -3 % 1 % 22 % -12 % 11 % -7 % 13 % -7 % 13 % -7 % 23 % -16 % - - - -
Raw Material Consumed -5 % 3 % 11 % -5 % 1 % 2 % 8 % -6 % 6 % 2 % 10 % -8 % - - - -
EBITDA 2 % -8 % 66 % -39 % 58 % -17 % 12 % -23 % 48 % -17 % 43 % -40 % - - - -
EBIT 7 % -10 % 80 % -43 % 73 % -19 % 12 % -27 % 60 % -20 % 50 % -45 % - - - -
Recurring PAT 4 % -11 % 79 % -39 % 60 % -15 % 4 % -27 % 63 % -19 % 50 % -44 % - - - -
EPS 4 % -11 % 79 % -39 % 50 % -18 % 9 % -27 % 63 % -19 % 50 % -44 % - - - -
Yearly Growth (%)
Revenue -3 % 0 % 6 % 6 % 20 % 11 % 2 % 8 % 10 % 10 % 20 % 8 % 63 % 10 % 12 % 10 %
EBITDA -9 % -9 % 2 % -4 % 49 % 34 % -10 % 14 % 6 % 6 % 35 % 4 % 33 % 18 % 14 % 12 %
EBIT -11 % -11 % 1 % -2 % 58 % 42 % -12 % 14 % 6 % 5 % 41 % 7 % 25 % 21 % 15 % 14 %
Recurring PAT -15 % -12 % 2 % 2 % 56 % 49 % -13 % 4 % 6 % 0 % 44 % 10 % 12 % 19 % 15 % 14 %
EPS -15 % -12 % 2 % 2 % 46 % 34 % -19 % -2 % 6 % 5 % 44 % 10 % 11 % 18 % 17 % 14 %
Margin (%)
EBITDA 26 % 24 % 32 % 22 % 32 % 29 % 28 % 24 % 31 % 28 % 32 % 23 % 26 % 28 % 28 % 29 %
EBIT 21 % 19 % 28 % 18 % 28 % 25 % 24 % 19 % 27 % 23 % 29 % 19 % 22 % 24 % 25 % 26 %
PBT 22 % 20 % 28 % 20 % 28 % 25 % 24 % 19 % 27 % 24 % 29 % 19 % 23 % 24 % 25 % 26 %
PAT 14 % 13 % 18 % 13 % 18 % 17 % 16 % 12 % 18 % 15 % 19 % 12 % 15 % 16 % 16 % 17 %
Page 48
DB Corp Limited Absolute – LONG Relative – Overweight 16% ATR in 15 months
January 8, 2017 Analyst: Depesh Kashyap,CFA [email protected] (+91-7228934327) Page 13 of 14
Consolidated Financials P&L (Rs Mn) FY16A FY17E FY18E FY19E
Balance Sheet (Rs Mn) FY16A FY17E FY18E FY19E
Cash Flow (Rs Mn) FY16A FY17E FY18E FY19E
Revenue 20,519 22,541 25,302 27,769 Equity Capital 1,837 1,837 1,837 1,837 PBT 4,657 5,443 6,286 7,191
Op. Expenditure 15,173 16,239 18,144 19,759 Reserve 11,629 12,707 14,163 16,103 Depreciation 878 914 942 943
EBITDA 5,345 6,302 7,159 8,010 Networth 13,466 14,544 16,001 17,941 Others 0 0 0 0
Depreciation 878 914 942 943 Long Term Debt 1,135 1,135 1,135 1,135 Taxes Paid 1,747 1,905 2,200 2,517
EBIT 4,468 5,388 6,216 7,067 Def Tax Liability 1,281 1,281 1,281 1,281 Change in WC -632 -477 -493 -397
Interest Expense 92 86 86 86 Minority Interest 0 0 0 0 Operating C/F 3,351 3,920 4,466 5,096
Other Income 281 141 156 211 Account Payables 1,180 1,314 1,409 1,539 Capex -1,991 -546 -318 -349
PBT 4,657 5,443 6,286 7,191 Other Curr Liabi 2,934 2,934 2,934 2,934 Change in Invest 55 0 0 0
Tax 1,690 1,905 2,200 2,517 Total Liabilities & Equity 19,996 21,208 22,760 24,830 Others 173 141 156 211
PAT bef. MI & Assoc. 2,966 3,538 4,086 4,674 Net Fixed Assets 8,912 8,545 7,920 7,325 Investing C/F -1,818 -406 -161 -138
Minority Interest 0 0 0 0 Capital WIP 459 459 459 459 Change in Debt 90 0 0 0
Profit from Assoc. 0 0 0 0 Others 3,589 3,589 3,589 3,589 Change in Equity 13 0 0 0
Recurring PAT 2,966 3,538 4,086 4,674
Inventory 1,675 1,825 1,952 2,089 Others -2,505 -2,546 -2,716 -2,821
Extraordinaires 0 0 0 0 Account Receivables 3,862 4,323 4,783 5,173 Financing C/F -2,402 -2,546 -2,716 -2,821
Reported PAT 2,966 3,538 4,086 4,674 Other Current Assets 576 576 576 576 Net change in cash -869 968 1,589 2,138
FDEPS (Rs) 16.1 19.0 22.2 25.4 Cash 924 1,892 3,481 5,618 RoE (%) 23 % 25 % 27 % 28 %
DPS (Rs) 11.0 11.4 12.2 12.7 Total Assets 19,996 21,208 22,760 24,830
RoIC (%) 20 % 22 % 23 % 24 %
CEPS (Rs) 20.9 24.2 27.3 30.6 Non-cash Working Capital 2,000 2,476 2,969 3,366
Core RoIC (%) 21 % 24 % 28 % 32 %
FCFPS (Rs) 7.7 18.7 22.9 26.1 Cash Conv Cycle 35.6 40.1 42.8 44.2 Div Payout (%) 68 % 60 % 55 % 50 %
BVPS (Rs) 73.3 79.1 87.0 97.6 WC Turnover 10.3 9.1 8.5 8.3 P/E 23.1 19.6 16.8 14.7
EBITDAM (%) 26 % 28 % 28 % 29 % FA Turnover 2.2 2.5 3.0 3.6 P/B 5.1 4.7 4.3 3.8
PATM (%) 14 % 16 % 16 % 17 % Net D/E 0.0 -0.1 -0.1 -0.2 P/FCFF 48.3 20.0 16.3 14.3
Tax Rate (%) 36 % 35 % 35 % 35 % Revenue/Capital Employed 1.8 1.8 1.9 1.9 EV/EBITDA 13.4 11.2 9.6 8.3
Sales Growth (%) 2 % 10 % 12 % 10 %
Capital Employed/Equity 1.3 1.3 1.2 1.2
EV/Sales 3.5 3.1 2.7 2.4
FDEPS Growth (%) -6 % 18 % 17 % 14 %
Dividend Yield (%) 3.6 % 3.6 % 3.8 % 4.0 %
TTM P/E vs. 2 yr forward EPS growth TTM EV/EBITDA vs. 2 yr forward EBITDA growth TTM P/B vs. 2 yr forward RoE
-20%
-10%
0%
10%
20%
30%
40%
0100200300400500600700
Mar/10
Sep/10
Mar/11
Sep/11
Mar/12
Sep/12
Mar/13
Sep/13
Mar/14
Sep/14
Mar/15
Sep/15
Mar/16
Sep/16
Mar/17
Sep/17
Mar/18
10x
15x
20x
25x
30x
EPS Growth
-5%
0%
5%
10%
15%
20%
25%
0
20000
40000
60000
80000
100000
120000
140000
Mar/10
Sep/10
Mar/11
Sep/11
Mar/12
Sep/12
Mar/13
Sep/13
Mar/14
Sep/14
Mar/15
Sep/15
Mar/16
Sep/16
Mar/17
Sep/17
Mar/18
8x
10x
13x
14x
16x
EBITDA Growth
15%
25%
35%
45%
55%
0
100
200
300
400
500
600
700
Mar/10
Sep/10
Mar/11
Sep/11
Mar/12
Sep/12
Mar/13
Sep/13
Mar/14
Sep/14
Mar/15
Sep/15
Mar/16
Sep/16
Mar/17
Sep/17
Mar/18
RoE
2x
3x
4x
5x
6x
Page 49
DB Corp Limited Absolute – LONG Relative – Overweight 16% ATR in 15 months
January 8, 2017 Analyst: Depesh Kashyap,CFA [email protected] (+91-7228934327) Page 14 of 14
Historical Consolidated Financials P&L (Rs Mn) FY13A FY14A FY15A FY16A
Balance Sheet (Rs Mn) FY13A FY14A FY15A FY16A
Cash Flow (Rs Mn) FY13A FY14A FY15A FY16A
Revenue 15,923 18,598 20,096 20,519 Equity Capital 1,834 1,835 1,836 1,837 PBT 3,313 4,524 4,923 4,657
Op. Expenditure 12,163 13,595 14,474 15,173 Reserve 8,458 9,633 11,045 11,629 Depreciation 581 642 881 878
EBITDA 3,760 5,003 5,622 5,345 Networth 10,292 11,467 12,882 13,466 Others 0 -23 0 0
Depreciation 581 642 881 878 Long Term Debt 1,374 1,264 983 1,135 Taxes Paid 1,041 1,502 1,686 1,747
EBIT 3,179 4,360 4,741 4,468 Def Tax Liability 1,160 1,232 1,209 1,281 Change in WC -618 -1,387 -95 -632
Interest Expense 80 75 76 92 Minority Interest 11 0 0 0 Operating C/F 2,366 2,479 4,253 3,351
Other Income 213 239 257 281 Account Payables 961 1,114 1,215 1,180 Capex -605 -1,058 -715 -1,991
PBT 3,313 4,524 4,923 4,657 Other Curr Liabi 2,530 2,618 2,757 2,934 Change in Invest -402 10 0 55
Tax 1,132 1,457 1,759 1,690 Total Liabilities & Equity 16,327 17,695 19,045 19,996 Others 246 127 -814 118
PAT bef. MI & Assoc. 2,181 3,066 3,163 2,966 Net Fixed Assets 8,313 8,503 8,158 8,912 Investing C/F -762 -921 -1,529 -1,818
Minority Interest 0 0 0 0 Capital WIP 70 22 45 459 Change in Debt -600 -233 -331 90
Profit from Assoc. 0 0 0 0 Others 1,722 2,628 3,794 3,589 Change in Equity 8 15 23 13
Recurring PAT 2,181 3,066 3,163 2,966 Inventory 1,299 1,732 1,402 1,675 Others -1,187 -1,432 -1,742 -2,505
Extraordinaires 0 0 0 0 Account Receivables 3,083 3,280 3,450 3,862 Financing C/F -1,778 -1,650 -2,051 -2,402
Reported PAT 2,181 3,066 3,163 2,966 Other Current Assets 563 397 418 576 Net change in cash -174 -92 674 -869
EPS (Rs) 11.9 16.7 17.2 16.1 Cash 1,277 1,133 1,780 924
RoE (%) 22 % 28 % 26 % 23 %
DPS (Rs) 5.5 7.3 7.8 11.0
Total Assets 16,327 17,695 19,046 19,996
RoIC (%) 18 % 23 % 22 % 20 %
CEPS (Rs) 15.1 20.2 22.0 20.9 Non-cash Working Capital 1,454 1,676 1,297 2,000 Core RoIC (%) 20 % 25 % 24 % 21 %
FCFPS (Rs) 9.9 8.0 19.5 7.7 Cash Conv Cycle 33.3 32.9 23.6 35.6 Div Payout (%) 46 % 43 % 45 % 68 %
BVPS (Rs) 56.1 62.5 70.2 73.3 WC Turnover 11.0 11.1 15.5 10.3
P/E 134.8 35.2 26.3 33.9
EBITDAM (%) 24 % 27 % 28 % 26 % FA Turnover 1.9 2.2 2.4 2.2 P/B 24.4 10.5 8.3 7.4
PATM (%) 14 % 16 % 16 % 14 % Net D/E 0.0 0.0 -0.1 0.0 P/FCFF 37.7 37.7 37.7 37.7
Tax Rate (%) 34 % 32 % 36 % 36 % Revenue/Capital Employed 1.3 1.4 1.4 1.0 EV/EBITDA 55.1 21.4 17.7 21.0
Sales growth (%) 10 % 17 % 8 % 2 %
Capital Employed/Equity 1.3 1.2 1.2 1.2
EV/Sales 13.0 13.0 13.0 13.0
FDEPS growth (%) 8 % 41 % 3 % -6 %
Dividend Yield (%) 1.7 % 2.3 % 2.5 % 3.6 %
Page 50
January 8, 2017 Analyst: Depesh Kashyap, CFA [email protected] (+91-7228934327) Page 1 of 14
Before reading this report, you must refer to the disclaimer on the last page.
Jagran Prakashan ltd Absolute : LONG
Relative : Overweight
Initiating Note Regular Coverage 20% ATR in 15 months
Tuning in to the right frequency Media & Entertainment
© 2017 Equirus. All rights reserved.
Rating Information
Price (Rs) 175
Target Price (Rs) 220
Target Date 31st Mar'18
Target Set On 6th Jan'17
Implied yrs of growth (DCF) 15
Fair Value (DCF) 270
Fair Value (DDM) 100
Ind Benchmark SPBSMIP
Model Portfolio Position NA
Stock Information
Market Cap (Rs Mn) 57,340
Free Float (%) 39.24 %
52 Wk H/L (Rs) 213.05/144
Avg Daily Volume (1yr) 183,718
Avg Daily Value (Rs Mn) 32
Equity Cap (Rs Mn) 654
Face Value (Rs) 2
Bloomberg Code JAGP IN
Ownership Recent 3M 12M
Promoters 60.8 % 0.0 % 0.0 %
DII 12.6 % -0.2 % -0.1 %
FII 15.7 % -0.4 % 0.7 %
Public 11.0 % 0.5 % -0.6 %
Price % 1M 3M 12M
Absolute 2.7 % -11.6 % 4.2 %
Vs Industry 2.9 % -2.6 % -6.4 %
DBCORP 7.0 % -3.7 % 16.7 %
HMVL 5.2 % -8.0 % -5.3 %
Consolidated Quarterly EPS forecast
Rs/Share 1Q 2Q 3Q 4Q
EPS (16A) 2.4 2.4 2.9 2.5
EPS (17E) 2.4 2.3 2.6 2.1
Jagran Prakashan Limited (JPL) has consistently focussed on building its scale
through both organic and inorganic routes. “Dainik Jagran”, the key brand of the
Company is India’s most widely read newspaper since 2003. Elections in UP/ Punjab,
public listing of Radio City which shall unlock value of radio segment and strengthen
company’s balance sheet are few of the near term triggers which are not being
reflected in current valuations. We initiate our coverage with a Long rating and a
Mar’18 TP of Rs. 220.
Leadership position in UP and Radio City to drive growth: The Company holds
leadership position in the key Hindi states. The Company has increased its market
share to 7.3% in FY16 (from 7.0% in FY15) in terms of the print ad-revenue market.
Elections in the state of UP and Punjab, good monsoons, and implementation of 7th
pay commission will drive growth once the impact of demonetization normalizes.
The Company clearly has the largest radio business amongst its print media peers
contributing ~11% to its consolidated revenues. With the public issue of its radio
business around the corner, the business is expected to be a major growth driver in
the years to come.
Continuing turnaround of Mid-day, NaiDunia and increasing share of radio to help
margins: Both Mid-day and NaiDunia have shown regular improvement in their
operating performances. The demonetization of currency may derail the recovery
for couple of quarters, but they should pick up once the impact normalises. Also,
radio business has been a high growth and high margin business having steady state
margins of ~34%. As the radio business increases its scale and its share in the total
revenues of the Company improves, margins shall improve further.
Deleveraging of balance sheet and strong cash flow generation provides enough
room for dividend payouts: Jagran’s subsidiary Music Broadcast Limited (MBL)
which operates Radio City, is planning to raise Rs. 4,000mn via an IPO (DRHP filed on
28th Nov’16). The company plans to use the proceeds of the issue to reduce its
debt. This will further strengthen the balance sheet of the Company. It is to be
noted that Jagran’s board recently approved a buyback proposal (5th Jan’17) where
it plans to buyback 4.74% of outstanding shares at Rs. 195
Initiate coverage with Long rating and TP of Rs. 220: We initiate coverage with
Long rating with Mar’18 TP of Rs. 220 based on our SOTP valuation methodology.
Risks: Slowdown in economy, more than expected increase in newsprint costs.
Consolidated Financials
Rs. Mn YE Mar FY16A FY17E FY18E FY19E
Sales 21,065 22,459 24,588 26,989
EBITDA 5,896 5,925 6,736 7,682
Depreciation 1,044 1,240 1,243 1,247
Interest Expense 523 520 466 406
Other Income 345 205 259 334
Reported PAT 4,446 3,058 3,700 4,454
Recurring PAT 3,283 3,058 3,700 4,454
Total Equity 15,812 17,440 19,408 21,778
Gross Debt 6,120 5,830 5,080 5,080
Cash 3,421 4,716 6,072 8,515
Rs Per Share FY16A FY17E FY18E FY19E
Earnings 10.1 9.4 11.3 13.6
Book Value 48 53 59 67
Dividends 0.0 3.7 4.5 5.4
FCFF 2.5 11.3 13.4 14.9
P/E (x) 17.3 18.7 15.5 12.9
P/B (x) 3.6 3.3 3.0 2.6
EV/EBITDA (x) 10.4 10.0 8.5 7.1
ROE (%) 24 % 18 % 20 % 22 %
Core ROIC (%) 24 % 17 % 20 % 24 %
EBITDA Margin (%) 28 % 26 % 27 % 28 %
Net Margin (%) 16 % 14 % 15 % 17 %
Page 51
JagranPrakashan Limited Absolute – LONG Relative – Overweight 20% ATR in 15 months
January 8, 2017 Analyst: DepeshKashyap,CFA [email protected] (+91-7228934327) Page 2 of 14
Company Snapshot
How we differ from Consensus
- Equirus Consensus % Diff Comment
EPS FY17E 9.4 11.0 -15 % In our view, consensus estimates are not
yet updated for the impact of
demonetisation and the increased
amortisation costs
FY18E 11.3 12.8 -11 %
Sales FY17E 22,459 22,995 -2 %
FY18E 24,588 25,488 -4 %
PAT FY17E 3,058 3,588 -15 %
FY18E 3,700 4,195 -12 %
Our Key Investment arguments:
1. Leadership position in UP and Radio City to drive growth: In terms of the
print-ad revenue market, the Company has gained market share to 7.3% in FY16
from 7.0% in FY15. With improving readership, 7th pay commission and good
monsoons, the Company looks well poised to take advantage of the improving
growth scenario once the impact of demonetization normalizes.
2. Continuing turnaround of Midday, NaiDunia and increasing share of radio to
help margins: Both Midday and NaiDunia have been improving their operating
performance lately. With turnaround of these businesses and growing share of
radio business (high margins ~34%), the operating margins are set to improve.
3. Strong cash flow generation provide enough room for dividends: With bulk of
the capex in the radio business already done, there are no major investments in
the pipeline. Though, there will be some increase in circulation in the existing
markets, but with no new launches planned in the print business in the near
term, we estimate strong free cash flow generation and high dividend payouts
which should protect the downside for investors.
Risk to Our View:
1. Slowdown in economy
2. Newsprint prices rise more than expected
Key Triggers:
Revival in the advertisement growth
Declaration of dividends/Buybacks or some strategic acquisition will provide big
boost
DCF Valuations & Assumptions
Rf Beta Ke Term. Growth Debt/IC in Term. Yr
6.8 % 0.8 11.3 % 2.5 % 10.0 %
- FY17E FY18E FY19-21E FY22-26E FY27-31E
Sales Growth 7 % 9 % 10 % 7 % 7 %
NOPAT Margin 15 % 16 % 17 % 15 % 15 %
IC Turnover 1.18 1.30 1.57 1.72 1.72
RoIC 17.3 % 20.3 % 27.4 % 26.7 % 26.7 %
Years of strong growth 1 2 5 10 15
Valuation as on date (Rs) 140 167 242 222 236
Valuation as of 31st Mar'18 159 191 276 253 270
Based on DCF, we derive 31st March 2018 fair value of Rs. 270.
Company Description:
Jagran Prakashan Ltd (JPL) is a media conglomerate with interests spanning across
Print, FM Radio, OOH, Activations & Digital covers all of India as its footprint – and is
amongst one of the largest media conglomerates in the country. Jagran group publishes
12 print titles in 5 different languages spread across 15 states with over 100 editions
and these include some veritable titles as the World's largest read daily, India's No.1
compact daily, India's No.1 Afternoon daily, and India's No.1 Urdu daily.
Comparable valuation Mkt Cap
Rs. Mn.
Price
Target
Target
Date
EPS P/E BPS P/B RoE Div Yield
Company Reco. CMP FY16A FY17E FY18E FY16A FY17E FY18E FY16A FY17E FY16A FY17E FY18E FY16A FY17E
Jagran Prakashan LONG 175 57,340 220 Mar'18 10.1 9.4 11.3 17.3 18.7 15.5 48.4 3.3 24 % 18 % 20 % 0.0 % 2.1 %
DBCL LONG 373 68,614 450 Mar'18 16.1 19.0 22.2 23.1 19.6 16.8 73.3 4.7 23 % 25 % 27 % 3.6 % 3.6 %
HMVL LONG 273 20,066 370 Mar'18 24.6 27.1 29.0 11.1 10.1 9.4 123.8 1.8 22 % 20 % 18 % 0.4 % 0.5 %
Page 52
JagranPrakashan Limited Absolute – LONG Relative – Overweight 20% ATR in 15 months
January 8, 2017 Analyst: DepeshKashyap,CFA [email protected] (+91-7228934327) Page 3 of 14
Investment Rationale
Leadership position in UP and Radio City to drive growth
DainikJagran is the largest read newspaper in India and has a leading position in the key
Hindi speaking states i.e. UP, Bihar, Jharkhand. The Company also operates through
‘NaiDuniya’ brand in Madhya Pradesh and Chattisgarh. The advertising revenue, which is
related to the economic growth of the states and India overall, is expected to remain
strong given the strong GDP growth rates in these states. The impact of good monsoons,
implementation of 7th pay commission and elections in UP/Punjab are expected to uplift
the advertisement growth once the impact of demonetization normalizes. Company’s
subisidiary “Music Broadcast Limited” which operates Radio City is working on
operationalizing of its new stations which it had acquired in Phase III auctions. Radio is a
high growth and high margin business and the industry is expected to grow at CAGR of
17% in FY16-20E.
Exhibit 1: DainikJagran has been at the top in terms of readership
Source: IRS, Equirus Research
Exhibit 2: UP and Bihar form ~70% of its readership base
Source: Company, Equirus Research
Exhibit 3: Healthy GSDP growth rate of states where Jagran is present
Source: Company, Equirus Research
2000
4000
6000
8000
10000
12000
14000
16000
18000
Dain
ik J
agra
n
Hin
dust
an
Dain
ik B
hask
ar
Mala
yala
Manora
ma
Daily T
hanth
i
Raja
sthan P
atr
ika
Am
ar
Uja
la
TO
I
Math
rubhum
i
Lokm
at
2013 Readership 2014 Readership
51%
18%
5%
11%
7%
3% 3% 2%
UP
Bihar
Jharkhand
MP&CG
Haryana & Punjab
Uttarakhand
Delhi
Others
4
6
8
10
12
14
16
18
2010-11 2011-12 2012-13 2013-14 2014-15
Bihar Jharkhand Madhya Pradesh
Chhattisgarh Uttar Pradesh
Page 53
JagranPrakashan Limited Absolute – LONG Relative – Overweight 20% ATR in 15 months
January 8, 2017 Analyst: DepeshKashyap,CFA [email protected] (+91-7228934327) Page 4 of 14
i) Circulation revenue estimated to grow at CAGR (FY16-19E) of 5%: The
Company has grown its circulation revenues at a CAGR (FY12-16) of 12%
driven by both increase in volumes and pricing. In the past, Jagran has
invested in increasing the circulation of its key brand “DainikJagran” and
has also relaunched “Inext” in a new format which improved its circulation.
The Company launched “Punjabi Jagran” in 2011 and has been improving its
circulation since. It also made an acquisition of “NaiDunia” in 2012 to
improve its foothold in Madhya Pradesh and Chattisgarh (MPCG) market.
Going forward, there is no plan of expansion or acquisition in any new
markets, we expect Jagran to keep increasing its circulation (though at a
slower pace) as the IRS survey is expected in 3QFY18 and it would like to
maintain its leadership position. We estimate revenue CAGR (FY16-19E) of
5%.
Exhibit 4: Circulation revenue estimated to grow at CAGR (FY16-19E) of 5%
Source: Company, Equirus Research
ii) Advertising revenues estimated to grow at CAGR (FY16-19e) of 8%: The
Company has grown its advertising revenues at a CAGR (FY12-16) of 12%. In
1HFY17, Jagran saw 7% yoy growth in advertising, the expected recovery in
advertising in 2HFY17 has been hit by demonetization of currency. We
expect the advertising to be weaker in 2H (though UP elections should
provide support) and estimate the growth in FY17 at ~5 % (given the 1HFY17
growth at 7%). Once the impact normalizes, going forward, the Company
should see a volume led revival in advertisement revenues driven by rising
consumption in tier 2 and 3 cities triggered by good monsoons and
implementation of 7th pay commission. We estimate advertisement revenue
CAGR of 8% over FY16-19E.
Exhibit 5: Advertising revenue estimated to grow at CAGR (FY16-19E) of 8%
Source: Company, Equirus Research
iii) Circulation growth along with gradual pick up in advertising should drive
Mid-day forward: Mid-day Infomedia limited (MIL) which publishes Mid-day
English, Mid-day Gujarati and Inquilab (Urdu paper) had seen some pickup in
its advertisement growth in FY16 and higher per copy realization boosted
the circulation revenues. Jagran has not reported 1HFY17 consolidated
numbers as it was awaiting various amalgamation approvals, the exact trend
of advertising growth is not known but we expect it to be weak in-line with
other publications. We are estimating flat advertising growth in FY17E and
expect a pickup in FY18E. Overall, we estimate Mid-day revenues to grow in
the range of 2-3% driven by circulation and gradual pick up in
advertisements.
1000
1500
2000
2500
3000
3500
4000
4500
5000
FY12 FY13 FY14 FY15 FY16 FY17e FY18e FY19e
Circulation revenues ( Rs mn)
CAGR(FY12-16) 12%
CAGR(FY16-19e) 5%
1000
3000
5000
7000
9000
11000
13000
15000
17000
FY12 FY13 FY14 FY15 FY16 FY17e FY18e FY19e
Advertisement revenue ( Rs mn)
CAGR(FY12-16) 11%
CAGR(FY16-19e) 8%
Page 54
JagranPrakashan Limited Absolute – LONG Relative – Overweight 20% ATR in 15 months
January 8, 2017 Analyst: DepeshKashyap,CFA [email protected] (+91-7228934327) Page 5 of 14
Exhibit 6: Growth to remain muted supported by circulation
Source: Company, Equirus Research
iv) Radio City revenues estimated to grow at CAGR (FY16-19e) of 18%: To
begin with, Jagran was a small player in Radio operating “Radio Mantra”,
but in early FY16 with an acquisition of Radio City, it has jumped way ahead
of its peers. Recently, Jagran also demerged Radio Mantra and merged it
with Music broadcast limited (MBL), a subsidiary company which operates
Radio City. Post merger, Radio City has become even stronger player with
39 frequencies (all not operational as yet). Jagran has always operated
Radio City independently and recently has also filed a DRHP of MBL. MBL
plans to raise Rs. 4,000mn via this public issue, which will be majorly used
for reducing debt. The radio industry is expected to grow at a CAGR of 17%
during FY16-20E, with the additions of new stations, we estimate the
Company to grow at similar CAGR (FY16-19E) of 18%.
Exhibit 7: With launch of new stations, growth in Radio business is estimated to remain solid
Source: Company, Equirus Research
Overall we are estimating the revenues to grow at CAGR (FY16-19E) of 9% as compared to
the CAGR (FY13-16) of 11%.
Exhibit 8: Overall revenue growth estimated to grow at CAGR(FY16-19e) of 9%
Source: Company, Equirus Research
-6.0%
-4.0%
-2.0%
0.0%
2.0%
4.0%
6.0%
8.0%
10.0%
12.0%
14.0%
FY14 FY15 FY16 FY17e FY18e FY19e
Mid-day-Advertising revenue(%) Mid-day-Circulation revenue (%)
Mid-day- Total revenue(%)
500
1,000
1,500
2,000
2,500
3,000
3,500
4,000
FY13 FY14 FY15 FY16 FY17e FY18e FY19e
Radio revenues ( Rs mn)
CAGR(13-16) 19%
CAGR(16-19e) 18%
10,000
12,000
14,000
16,000
18,000
20,000
22,000
24,000
26,000
28,000
FY13 FY14 FY15 FY16 FY17e FY18e FY19e
Net Sales (Rs mn)
CAGR (FY13-16) 11%
CAGR (FY16-19e) 9%
Page 55
JagranPrakashan Limited Absolute – LONG Relative – Overweight 20% ATR in 15 months
January 8, 2017 Analyst: DepeshKashyap,CFA [email protected] (+91-7228934327) Page 6 of 14
Multiple levers to hold up the margins
The additional operating and employee expenses due to launch of new radio stations and
negative impact of demonetisation on advertisements are expected to cause near term
pressure on margins but once these issues get normalized, the margins of Jagran are
expected to get better due to following factors:
i) Improving operating performance of other publications (Mid-day,
NaiDunia, INext, PunjbaiJagran): The flagship product of the Company i.e.
“DainikJagran” has EBITDA margins above 30%, its mainly the other
publications which include Mid-day, NaiDunia, INext and Punjabi Jagran
which have been putting downward pressure on the margins. The
profitability of NaiDunia has been below Company’s expectations and to
improve the same, the top management team of NaiDunia has been
restructured. Also due to pending high court approvals on schemes of
amalgamation, Company did not disclose the 1HFY17 numbers. In the last 2
years, the profitability of Mid-day publications has improved from just
breakeven to 20% EBITDA margins in FY16. The Company was targeting the
margins in the range of 24-25% for Mid-day in FY17, but it looks unlikely due
to demonetization, but once the impact normalises, it should be able to
improve its margins further.
Exhibit 9: Other Publications (Mid-day, NaiDunia, INext, PunjbaiJagran) are seeing a turnaround
Source: Company, Equirus Research, Note: Q117 and Q217 do not include Mid-day
Exhibit 10: Mid-day’s margin performance has been improving
Source: Company, Equirus Research
ii) Increasing share of radio business in the overall revenues will boost
margins: Jagran’s Radio City is one of the largest radio player in the
country. With the merger of Radio Mantra, Radio City has been further
strengthened and it will have 39 frequencies (all not yet operational). It
operates at high EBITDA margins of 34%. The radio business currently
contributes ~11% to the total consolidated revenues. As the share of the
radio business increases in the overall portfolio, the margins of the
Company will improve.
Exhibit 11: Rising share of Radio business to push margins upwards
Source: Company, Equirus Research
-15.0%
-10.0%
-5.0%
0.0%
5.0%
10.0%
15.0%
-120
-80
-40
0
40
80
120
Q115 Q215 Q315 Q415 Q116 Q216 Q316 Q416 Q117 Q217
Operating profit ( Rs mn) Operating margin(%) (RHS)
-5.0%
0.0%
5.0%
10.0%
15.0%
20.0%
25.0%
FY13 FY14 FY15 FY16
Mid-day EBITDA margins (%)
9.0% 9.1%
11.3% 11.0% 11.8%
12.9%
14.1%
4.0%
6.0%
8.0%
10.0%
12.0%
14.0%
16.0%
FY13 FY14 FY15 FY16 FY17e FY18e FY19e
Share of Radio as % of consolidated revenues
Page 56
JagranPrakashan Limited Absolute – LONG Relative – Overweight 20% ATR in 15 months
January 8, 2017 Analyst: DepeshKashyap,CFA [email protected] (+91-7228934327) Page 7 of 14
Exhibit 12: EBITDA estimated to grow at CAGR (FY16-19E) of 9%
Source: Company, Equirus Research
We estimate EBITDA to grow at a CAGR (FY16-19E) of 9% with EBITDA margins improving
to 28.5% in FY19E from 28.0% in FY16.
Strong cash flow generation to support dividend payouts
Barring last year, Jagran has always maintained a good dividend payout ratio. In FY16,
Company did not pay any dividend but has recently approved a buyback proposal (5th
Jan’17) where it plans to buyback 4.74% of outstanding shares at Rs. 195 through a
tender process.
Jagran’s subsidiary “Music Broadcast Limited (MBL)” has filed its DRHP and plans to raise
Rs. 4,000mn from the public issue. According to DRHP, the proceeds of the issue will be
used to redeem the debt it has taken from Jagran and also Rs. 2,000mn which was raised
in the form of Non-convertible debentures (NCD). Redemption of these NCD’s and inflow
of IPO proceeds will further strengthen the balance sheet.
Exhibit 13: Strong cash flow generation to support the dividends
Source: Company, Equirus Research
Exhibit 14: Return on capital estimated to remain strong
Source: Company, Equirus Research
19.4%
22.5%
25.5%
28.0%
26.4%
27.4%
28.5%
15%
17%
19%
21%
23%
25%
27%
29%
31%
1,000
2,000
3,000
4,000
5,000
6,000
7,000
8,000
9,000
FY13 FY14 FY15 FY16 FY17e FY18e FY19e
EBITDA (Rs mn) EBITDA Margin (RHS)
25%
53%
48%
40% 40% 40%
15%
20%
25%
30%
35%
40%
45%
50%
55%
60%
0.0
1.0
2.0
3.0
4.0
5.0
6.0
FY13 FY14 FY15 FY16 FY17e FY18e FY19e
Dividend per share Divi payout ratio
10%
15%
20%
25%
30%
35%
FY13 FY14 FY15 FY16 FY17e FY18e FY19e
Core RoIC RoE
Page 57
JagranPrakashan Limited Absolute – LONG Relative – Overweight 20% ATR in 15 months
January 8, 2017 Analyst: DepeshKashyap,CFA [email protected] (+91-7228934327) Page 8 of 14
Valuation
Jagran is currently trading at PE multiple of 16x and EV/EBITDA multiple of 9x on our
FY18 estimates.
The radio business of Jagran has been superior to its peers in terms of revenue
contribution (~11%) to its total consolidated revenues. Further public listing of the radio
business will help in value unlocking. We have preferred Sum-Of-The-Parts (SOTP)
methodology to value the Company where we have valued the standalone and radio
business separately. Jagran has always traded in the EV/EBITDA range of 8x-12x, we have
valued the print business by applying EV/EBITDA multiple of 10x(last 6 years average) to
our FY18 EBITDA estimate of Rs. 5,590mn to derive the value of Rs. 55,903mn. We have
valued radio segment using EV/EBITDA multiple of 14x (~30% discount to ENIL due to its
smaller size and further 30% holding company discount) on our FY18E EBITDA estimates of
Rs. 1,000mn to derive the value of Rs. 14,001mn. Exhibit 15 below shows the step by
step process we followed to derive our Mar’18 TP of Rs. 220.
Exhibit 15: Target price derivation through SOTP valuation
Jagran (Rs mn) EBITDA
(FY18e) Multiple Valuation
Standalone business 5,590 10x 55,903.1
Radio business 1,000 14x 14,001.1
Total EV
69,904.2
(-) Debt
5,080.4
(+) Cash and cash equivalents
6,071.7
Equity value
70,895.6
Outstanding shares(mn)
326.9
Target price(Rs) (rounded) 220
Source: Company, Equirus Research
Exhibit 16: Jagran’s P/E has been in the range of 15x-25x
Source: Bloomberg, Equirus Research
Exhibit 17: Jagran’s EV/EBITDA ratio has been in the range of 8x-12x
Source: Bloomberg, Equirus Research
10x
15x
23x
30x
35x
-10%
0%
10%
20%
30%
40%
0
50
100
150
200
250
300
Mar
/09
Sep
/09
Mar
/10
Sep
/10
Mar
/11
Sep
/11
Mar
/12
Sep
/12
Mar
/13
Sep
/13
Mar
/14
Sep
/14
Mar
/15
Sep
/15
Mar
/16
Sep
/16
Mar
/17
Sep
/17
Mar
/18
EPS Growth
-20%-10%0%10%20%30%40%50%60%
0
20000
40000
60000
80000
100000
120000
Mar
/09
Sep
/09
Mar
/10
Sep
/10
Mar
/11
Sep
/11
Mar
/12
Sep
/12
Mar
/13
Sep
/13
Mar
/14
Sep
/14
Mar
/15
Sep
/15
Mar
/16
Sep
/16
Mar
/17
Sep
/17
Mar
/18
5x
8x
10x
12x
15x
EBITDA Growth
Page 58
JagranPrakashan Limited Absolute – LONG Relative – Overweight 20% ATR in 15 months
January 8, 2017 Analyst: DepeshKashyap,CFA [email protected] (+91-7228934327) Page 9 of 14
Investment Risk & Concerns
Another economic slowdown can result in lower than expected growth in advertising
revenue: A slowdown in the economy can result in lesser than expected media spend by
the corporates, which can have a negative impact on the advertising revenue.
Higher than expected increase in newsprint price will have a negative impact on the
operating margins: Newsprint prices account for 30-40% of the total sales and 40-50% of
the total cost component. Newsprint prices are strongly correlated to crude oil prices
which have been rising lately. Rising raw material cost may put some stress on operating
margins.
Rising competition: Jagran operates in a highly competitive environment. Most of the
states that it operates in have 2 or 3 other players as well. If competition reduces their
cover prices or advertisement rates to gain market share, it will put pressure on the
Company as well.
Corporate Governance
Following are key highlights of our assessment of level of corporate governance in the
company from its FY16 Annual Report.
Since the Chairman of the Company is also an Executive Director, atleast half of the
board should consist of Independent Directors. Presently, the Board consists of 18
directors, 12 directors are non-executive of whom 9 are independent directors
constituting the stipulated 50% of the total strength of Board of Directors.
Distribution of Power: Three of the four board committee including Audit, Nomination
and remuneration, Stakeholders relationship are run by independent directors. Only the
CSR committee is headed by the Chairman himself.
Disclosure Norms
Quarterly Reporting: The quarterly financials are generally provided on both standalone
and consolidated basis in the format in which it is submitted to the stock exchanges.
However, due to certain schemes of amalgamation which are pending for court
approvals, Company has been providing only standalone results in FY16.
Auditors Report The Auditor, PWC has reported the books of accounts to be in proper order and has
stated that the financials provide a true and fair view of the business. There is no
negative remark on the accounting policy or financial management of the company.
Annexure 1: Company Overview Jagran Prakashan Ltd (JPL) is India’s leading media and communications group with its
interests spanning across Print, OOH, Activations & Digital covers all of India as its
footprint. The group publishes 12 print titles in 5 different languages spread across 15
states with over 100 editions.
Exhibit 18: Jagran Prakashan Overview
Source: Company, Equirus Research
Company History
1942: The first edition of DainikJagran was launched in Jhansi
2005: Company entered into strategic alliance and partnership with Independent News
and Media plc.
2006: The Company came up with a public issue
2010: Company acquires the print business of Mid-day Multimedia, which owned brands
like Mid-day, Mid-day Gujarati and Urdu newspaper “Inquilab”
2011: Launches Punjabi newspaper Punjabi Jagran
2012: Acquires Suvi info Management (Indore) Private limited, which owned the brand
Jagran Prakashan
Print
Newspapers
Dainik Jagran
INext
Mid Day
Nai Dunia
Inquilab
Punjabi Jagran
Periodicals
Sakhi
Khel Khaliyan
Radio
Radio City 91.1 FM
Digital
10 portals
Activation OOH
Page 59
JagranPrakashan Limited Absolute – LONG Relative – Overweight 20% ATR in 15 months
January 8, 2017 Analyst: DepeshKashyap,CFA [email protected] (+91-7228934327) Page 10 of 14
“NaiDunia”, third largest Hindi Daily in Madhya Pradesh, Chattisgarh (MPCG) market
2012: Raises Rs. 1,500mn through Non-convertible debentures
2014: Completes the merger of NaiDunia with itself
2015: Acquires Radio City 91.1 FM, India’s leading FM operator with 20 stations under the
brand, acquired 11 more stations in the phase III auctions
2016: Radio City files a DRHP and plans to raise Rs. 4,000mn via public issue
Key Management profile
Mr. Mahendra Mohan Gupta – Chairman & Managing Director
Mr. Mahendra Mohan Gupta, age 75 years, holds a bachelor’s degree in commerce. He has
57 years of experience in the print media industry. He has held various key positions in
the industry including being the Chairman of United News of India (“UNI”), President of
The Indian Newspaper Society (“INS”). He also holds the post of Non-Executive Chairman
of Jagran Media Network Investment Private Limited, Rave@Moti Entertainment Private
limited and Jagran18 Publications limited. He has been a director of the Company since
inception and is a nominee of Promoters.
Mr. Sanjay Gupta –CEO and whole time director
Mr. Sanjay Gupta, age 52 years, is CEO and whole time director of the Company and also
holds the position of Editor-in-Chief of DainikJagran. He holds a bachelor’s degree in
Science and has more than 32 years of experience in print media. He is responsible for
implementation of business plan, regular monitoring of the operations, strategy,
competitive landscape and is involved in expansion plan including M&A and JV
opportunities.
Mr. Sunil Gupta – Whole time Director
Mr. Sunil Gupta, age 52 years, is a whole time director. He holds a bachelor’s and a
master’s degree in commerce. He has more than 32 years of experience in the print
media industry. He is in charge of operations in Bihar, Jharkhand and parts of eastern UP.
Mr. Shailesh Gupta –Whole time Director
Mr. Shailesh Gupta, age 45 years, is a whole time director and holds a bachelor’s degree
in commerce. He has more than 25 years of experience in the print media industry. He is
Chairman of council of Audit Bureau of Circulations, member of The Indian Newspaper
Society and heads advertisement and marketing department.
MrDevendra Mohan Gupta – Non-executive Director
Mr. Devendra Mohan Gupta, age 65 years, is a non-executive director and holds a
bachelor’s degree in Engineering (Mechanical). He has a vast experience in handling
Product Design, Research & Development, Production, Purchase & Sales( Domestic &
overseas). He was appointed as the Director of the Company in 2008 and is a nominee of
promoters.
Mr. Shailendra Mohan Gupta – Non-executive Director
Mr. Sahilendra Mohan Gupta, age 64 years, holds a bachelor’s degree in Science. He has
over 36 years of experience in administration, sales and marketing fields in Sugar,
Alcohol and Electronics industry. He was appointed Director of the Company in 2008 and
is a nominee of the promoters.
Mr. Satish Chandra Mishra – Non-executive Director
Mr. Satish Chandra Mishra, age 52 years, holds a B.E (Electronics) degree from Madhav
Institute of Technology, Gwalior(1983) and P.G. Diploma in Humar Resrource
management from IMT Ghaziabad(2006) and MBA (Marketing, operations) from Punjabi
school of management studies, Punjabi University, Patiala (2009). He has over 32 years of
experience in Newspaper industry. He joined the Board in 2013.
Mr. Amit Dixit – Independent Director
Mr. Amit Dixit, age 42 years, holds MBA degree from Harvard business school, MS degree
in Engineering from Stanford Uiversity and BTech from IIT, Madras. He is at present
Senior Managing Director in the Blackstone, a private equity fund. He joined the board in
2012.
Mr. AnujPuri – Independent Director
Mr. Anuj Puri, age 48 years, holds a bachelor’s degree in Commerce, is an Associate of
the Institute of Chartered Accountants of India (New Delhi), Associate of the Chartered
Insurance Institute, UK, Associate of Insurance Institute of Surveyors & Adjusters (India)
and an Associate of the Insurance Institute of India. He has over 24 years of experience in
multidisciplinary consulting ranging from real estate to social development projects.
Mr. DilipCherian – Independent Director
Mr. Dilip Cherian, age 58 years, holds a bachelor’s and master’s degree in Economic and
is a Gurukul Chevening Fellow from the London School of Economics. Mr. Cherian is
Founder & Consulting Partner of Perfect Relations, South Asia’s leading image
management consultancy. He advises CEOs on External communications, Internal
communications and public affairs. He joined the board in 2013.
Mr. Rajendra Kumar Jhunjhunwala – Independent Director
Mr. Rajendra Kumar Jhunjhunwala, aged 69 years, holds a bachelor’s degree in
Commerce. He has the vast experience of handling Sugar Mill, Vanaspati Plant and Steel
Page 60
JagranPrakashan Limited Absolute – LONG Relative – Overweight 20% ATR in 15 months
January 8, 2017 Analyst: DepeshKashyap,CFA [email protected] (+91-7228934327) Page 11 of 14
foundry of Motilal Padampat Udyog private limited. He was appointed as the director of
the Company in 2008.
Mr. Shashidhar Narain Sinha – Independent Director
Mr. Shashidhar Narain Sinha, aged 57 years, is the CEO of Lodestar universal India. He has
over 30 years of experience in media management and development. He was appointed
the Director of the Company in 2008.
Mr. Vijay Tandon – Independent Director
Mr. Vijay Tandon, aged 70 years, graduated from University of Delhi. He is a Chartered
Accountant and fellow of the Institute of Chartered Accountants of India. He has been
associated with number of private and public sector companies and banks in the capacity
of the auditor. He joined the board in 2005.
Ms. Anita Nayyar – Independent Director
Ms. Anita Nayyar, aged 54 years, holds a bachelor’s degree in Microbiology and has done
her post-graduation in Advertising and Marketing with a Masters in Management. She has
over 26 years of experience in the industry and was voted second most influential media
person in India by The Brand Equity Survey in 2006. Currently, she is CEO India and South
Asia for Havas Media group.
Mr. Jayant Davar – Independent Director
Mr. Jayant Davar, aged 54 years, is the founder, Co-Chairman & Managing Director of
Sandhar Technologies Limited. He is a mechanical engineer and is also an alumni of
Harvard Business School.
Mr. Ravi Sardana – Independent Director
Mr. Ravi Sardana, aged 49 years, is a Chartered Accountant by profession and a
Chevening Scholar. He has over two decades experience in investment banking and
corporate finance. He is currently Executive Vice President of ICICI Securities limited.
Mr. Vikram Sakhuja – Additional Independent Director
Mr. Vikram Sakhuja, aged 54 years, is an engineer from IIT Delhi with an MBA from IIM
Calcutta. He joined P&G in 1988 and held positions in Marketing Research and Media over
8 years. He joined the Board as an Additional independent Director in 2016.
Page 61
JagranPrakashan Limited Absolute – LONG Relative – Overweight 20% ATR in 15 months
January 8, 2017 Analyst: DepeshKashyap,CFA [email protected] (+91-7228934327) Page 12 of 14
Standalone Quarterly Earnings Forecast and Key Drivers Rs in Mn 1Q16A 2Q16A 3Q16A 4Q16A 1Q17A 2Q17A 3Q17E 4Q17E 1Q18E 2Q18E 3Q18E 4Q18E FY16A FY17E FY18E FY19E
Revenue 4,360 4,319 4,827 4,422 4,734 4,590 4,875 4,752 5,113 4,957 5,509 4,953 18,040 18,951 20,533 22,281
Consumption of raw materials 1,489 1,479 1,546 1,505 1,626 1,544 1,609 1,608 1,738 1,685 1,818 1,734 6,019 6,386 6,976 7,472
Employees cost 617 618 633 607 656 681 683 690 706 734 749 748 2,468 2,710 2,936 3,186
Other expenditure 1,021 981 1,239 1,185 1,148 1,153 1,297 1,235 1,227 1,190 1,350 1,264 4,532 4,833 5,031 5,392
- - - - - - - - - - - - - - - - -
- - - - - - - - - - - - - - - - -
EBITDA 1,233 1,241 1,409 1,125 1,304 1,213 1,287 1,219 1,442 1,348 1,592 1,208 5,020 5,023 5,590 6,230
Depreciation 205 216 222 198 189 195 210 209 208 208 208 208 841 803 832 840
EBIT 1,028 1,025 1,187 927 1,115 1,018 1,077 1,010 1,234 1,140 1,384 1,000 4,179 4,220 4,758 5,391
Interest 160 157 152 122 101 89 90 96 56 56 56 56 566 377 223 170
Other Income 181 125 31 93 79 165 120 110 115 115 115 115 252 475 462 503
PBT 1,050 993 1,066 898 1,093 1,094 1,107 1,024 1,294 1,200 1,444 1,060 3,866 4,318 4,997 5,724
Tax 351 332 369 291 356 339 376 353 440 408 491 360 1,315 1,425 1,699 1,946
Recurring PAT 699 661 697 607 736 755 731 671 854 792 953 699 2,550 2,893 3,298 3,778
Extraordinary 0 0 0 0 0 0 0 0 0 0 0 0 0 0 0 0
Reported PAT 699 661 697 607 736 755 731 671 854 792 953 699 2,550 2,893 3,298 3,778
EPS (Rs) 2.03 1.78 2.13 1.86 2.26 2.32 2.24 2.05 2.61 2.42 2.92 2.14 7.80 8.85 10.09 11.56
Key Drivers
Ad revenue (in Rs mn) - - - - - - - - - - - - 12,831 13,408 14,749 16,224
Circulation revenue(in Rs mn) - - - - - - - - - - - - 3,842 4,036 4,240 4,455
Revenue from digita excl. ads(in Rs mn)
- - - - - - - - - - - - 13 14 15 17
OOH and event mgmt business(in Rs mn)
- - - - - - - - - - - - 893 999 1,030 1,062
- - - - - - - - - - - - - - - - -
- - - - - - - - - - - - - - - - -
Sequential Growth (%)
Revenue 10 % -1 % 12 % -8 % 7 % -3 % 6 % -3 % 8 % -3 % 11 % -10 % - - - -
Consumption of raw materials 9 % -1 % 4 % -3 % 8 % -5 % 4 % 0 % 8 % -3 % 8 % -5 % - - - -
EBITDA 19 % 1 % 14 % -20 % 16 % -7 % 6 % -5 % 18 % -6 % 18 % -24 % - - - -
EBIT 34 % 0 % 16 % -22 % 20 % -9 % 6 % -6 % 22 % -8 % 21 % -28 % - - - -
Recurring PAT 41 % -5 % 6 % -13 % 21 % 2 % -3 % -8 % 27 % -7 % 20 % -27 % - - - -
EPS 34 % -12 % 20 % -13 % 22 % 3 % -4 % -8 % 27 % -7 % 20 % -27 % - - - -
Yearly Growth (%)
Revenue 5 % 5 % 10 % 11 % 9 % 6 % 1 % 7 % 8 % 8 % 13 % 4 % 9 % 5 % 8 % 9 %
EBITDA 16 % 20 % 12 % 9 % 6 % -2 % -9 % 8 % 11 % 11 % 24 % -1 % 14 % 0 % 11 % 11 %
EBIT 22 % 27 % 17 % 21 % 8 % -1 % -9 % 9 % 11 % 12 % 29 % -1 % 22 % 1 % 13 % 13 %
Recurring PAT 25 % 18 % 13 % 22 % 5 % 14 % 5 % 11 % 16 % 5 % 30 % 4 % 14 % 13 % 14 % 15 %
EPS 19 % 4 % 13 % 22 % 11 % 30 % 5 % 10 % 16 % 4 % 30 % 4 % 14 % 13 % 14 % 15 %
Margin (%)
EBITDA 28 % 29 % 29 % 25 % 28 % 26 % 26 % 26 % 28 % 27 % 29 % 24 % 28 % 27 % 27 % 28 %
EBIT 24 % 24 % 25 % 21 % 24 % 22 % 22 % 21 % 24 % 23 % 25 % 20 % 23 % 22 % 23 % 24 %
PBT 24 % 23 % 22 % 20 % 23 % 24 % 23 % 22 % 25 % 24 % 26 % 21 % 21 % 23 % 24 % 26 %
PAT 16 % 15 % 14 % 14 % 16 % 16 % 15 % 14 % 17 % 16 % 17 % 14 % 14 % 15 % 16 % 17 %
Page 62
JagranPrakashan Limited Absolute – LONG Relative – Overweight 20% ATR in 15 months
January 8, 2017 Analyst: DepeshKashyap,CFA [email protected] (+91-7228934327) Page 13 of 14
Consolidated Financials P&L (Rs Mn) FY16A FY17E FY18E FY19E
Balance Sheet (Rs Mn) FY16A FY17E FY18E FY19E
Cash Flow (Rs Mn) FY16A FY17E FY18E FY19E
Revenue 21,065 22,459 24,588 26,989 Equity Capital 654 654 654 654 PBT 4,674 4,369 5,286 6,362
Op. Expenditure 15,170 16,535 17,852 19,308 Reserve 15,159 16,786 18,754 21,124 Depreciation 1,044 1,240 1,243 1,247
EBITDA 5,896 5,925 6,736 7,682 Networth 15,812 17,440 19,408 21,778 Others 441 315 207 72
Depreciation 1,044 1,240 1,243 1,247 Long Term Debt 5,120 4,830 4,080 4,080 Taxes Paid -1,460 -1,311 -1,586 -1,909
EBIT 4,852 4,684 5,493 6,435 Def Tax Liability 1,000 1,000 1,000 1,000 Change in WC -679 -421 -492 -553
Interest Expense 523 520 466 406 Minority Interest 0 0 0 0 Operating C/F 4,020 4,193 4,658 5,220
Other Income 345 205 259 334 Account Payables 1,390 1,474 1,494 1,492 Capex -3,560 -861 -614 -620
PBT 4,674 4,369 5,286 6,362 Other Curr Liabi 2,390 2,390 2,390 2,390 Change in Invest 3,262 0 0 0
Tax 1,390 1,311 1,586 1,909 Total Liabilities & Equity 25,712 27,133 28,372 30,740 Others 235 205 259 334
PAT bef. MI & Assoc. 3,284 3,058 3,700 4,454 Net Fixed Assets 13,226 12,847 12,219 11,592 Investing C/F -63 -656 -355 -286
Minority Interest 0 0 0 0 Capital WIP 1,450 1,450 1,450 1,450 Change in Debt -3,554 -290 -750 0
Profit from Assoc. -1 0 0 0 Others 1,122 1,122 1,122 1,122 Change in Equity 0 0 0 0
Recurring PAT 3,283 3,058 3,700 4,454
Inventory 669 858 936 1,002 Others -1,986 -1,952 -2,198 -2,491
Extraordinaires 1,163 0 0 0 Account Receivables 4,977 5,292 5,726 6,211 Financing C/F -5,540 -2,242 -2,948 -2,491
Reported PAT 4,446 3,058 3,700 4,454 Other Current Assets 848 848 848 848 Net change in cash -420 1,296 1,355 2,443
FDEPS (Rs) 10.1 9.4 11.3 13.6 Cash 3,421 4,716 6,072 8,515 RoE (%) 24 % 18 % 20 % 22 %
DPS (Rs) 0.0 3.7 4.5 5.4 Total Assets 25,712 27,133 28,372 30,739
RoIC (%) 18 % 15 % 17 % 18 %
CEPS (Rs) 13.2 13.2 15.1 17.4 Non-cash Working Capital 2,714 3,135 3,626 4,179
Core RoIC (%) 24 % 17 % 20 % 24 %
FCFPS (Rs) 2.5 11.3 13.4 14.9 Cash Conv Cycle 47.0 50.9 53.8 56.5 Div Payout (%) 0 % 40 % 40 % 40 %
BVPS (Rs) 48.4 53.3 59.4 66.6 WC Turnover 7.8 7.2 6.8 6.5 P/E 17.3 18.7 15.5 12.9
EBITDAM (%) 28 % 26 % 27 % 28 % FA Turnover 1.4 1.6 1.8 2.1 P/B 3.6 3.3 3.0 2.6
PATM (%) 16 % 14 % 15 % 17 % Net D/E 0.1 0.0 -0.1 -0.2 P/FCFF 69.3 15.5 13.1 11.7
Tax Rate (%) 30 % 30 % 30 % 30 % Revenue/Capital Employed 1.1 1.0 1.0 1.1 EV/EBITDA 10.4 10.0 8.5 7.1
Sales Growth (%) 19 % 7 % 9 % 10 %
Capital Employed/Equity 1.5 1.4 1.3 1.2
EV/Sales 2.9 2.6 2.3 2.0
FDEPS Growth (%) 39 % -8 % 21 % 20 %
Dividend Yield (%) 0.0 % 2.1 % 2.6 % 3.1 %
TTM P/E vs. 2 yr forward EPS growth TTM EV/EBITDA vs. 2 yr forward EBITDA growth TTM P/B vs. 2 yr forward RoE
10x
15x
23x
30x
35x
-10%
0%
10%
20%
30%
40%
0
50
100
150
200
250
300
Mar
/09
Sep
/09
Mar
/10
Sep
/10
Mar
/11
Sep
/11
Mar
/12
Sep
/12
Mar
/13
Sep
/13
Mar
/14
Sep
/14
Mar
/15
Sep
/15
Mar
/16
Sep
/16
Mar
/17
Sep
/17
Mar
/18
EPS Growth
-20%-10%0%10%20%30%40%50%60%
0
20000
40000
60000
80000
100000
120000
Mar
/09
Sep
/09
Mar
/10
Sep
/10
Mar
/11
Sep
/11
Mar
/12
Sep
/12
Mar
/13
Sep
/13
Mar
/14
Sep
/14
Mar
/15
Sep
/15
Mar
/16
Sep
/16
Mar
/17
Sep
/17
Mar
/18
5x
8x
10x
12x
15x
EBITDA Growth
0%5%10%15%20%25%30%35%40%
050
100150200250300350400
Mar
/09
Sep/
09
Mar
/10
Sep/
10
Mar
/11
Sep/
11
Mar
/12
Sep/
12
Mar
/13
Sep/
13
Mar
/14
Sep/
14
Mar
/15
Sep/
15
Mar
/16
Sep/
16
Mar
/17
Sep/
17
Mar
/18
RoE
1x
2x
3x
4x
5x
Page 63
JagranPrakashan Limited Absolute – LONG Relative – Overweight 20% ATR in 15 months
January 8, 2017 Analyst: DepeshKashyap,CFA [email protected] (+91-7228934327) Page 14 of 14
Historical Consolidated Financials P&L (Rs Mn) FY13A FY14A FY15A FY16A
Balance Sheet (Rs Mn) FY13A FY14A FY15A FY16A
Cash Flow (Rs Mn) FY13A FY14A FY15A FY16A
Revenue 15,255 17,027 17,698 21,065 Equity Capital 633 623 635 654 PBT 2,552 3,057 4,183 4,674
Op. Expenditure 12,303 13,201 13,192 15,170 Reserve 8,691 8,994 10,708 15,159 Depreciation 1,247 890 1,035 1,044
EBITDA 2,952 3,826 4,506 5,896 Networth 9,324 9,616 11,342 15,812 Others -587 100 224 441
Depreciation 755 789 1,035 1,044 Long Term Debt 4,623 4,658 5,479 5,120 Taxes Paid -501 -621 -701 -1,460
EBIT 2,197 3,037 3,470 4,852 Def Tax Liability 924 1,085 1,039 1,000 Change in WC -692 -120 -356 -679
Interest Expense 307 345 369 523 Minority Interest 11 9 10 0 Operating C/F 2,019 3,305 4,385 4,020
Other Income 690 466 279 345 Account Payables 1,045 1,275 1,135 1,390 Capex -961 -497 -512 -3,560
PBT 2,580 3,158 3,380 4,674 Other Curr Liabi 2,091 2,613 3,546 2,390 Change in Invest -757 -1,249 -4,093 3,262
Tax 5 795 1,102 1,390 Total Liabilities & Equity 18,019 19,256 22,551 25,712 Others 80 48 198 235
PAT bef. MI & Assoc. 2,575 2,363 2,278 3,284 Net Fixed Assets 7,758 7,911 7,731 13,226 Investing C/F -1,639 -1,698 -4,407 -63
Minority Interest -5 -2 1 0 Capital WIP 1,311 1,137 722 1,450 Change in Debt 1,194 -484 1,556 -3,554
Profit from Assoc. -1 -4 0 -1 Others 2,148 1,907 3,847 1,122 Change in Equity 0 0 0 0
Recurring PAT 2,579 2,579 2,579 2,579 Inventory 833 999 929 669 Others -1,508 -1,400 -1,388 -1,986
Extraordinaires 28 101 803 1,163 Account Receivables 3,190 3,426 3,636 4,977 Financing C/F -314 -1,884 168 -5,540
Reported PAT 2,551 2,551 2,551 2,551 Other Current Assets 846 1,513 360 848 Net change in cash 65 -277 146 -420
EPS (Rs) 8.2 7.5 7.3 10.1 Cash 1,934 2,363 5,327 3,421
RoE (%) 30 % 23 % 22 % 24 %
DPS (Rs) 2.0 4.0 3.5 0.0
Total Assets 18,019 19,256 22,551 25,712
RoIC (%) 19 % 17 % 15 % 18 %
CEPS (Rs) 10.5 10.1 10.4 13.2 Non-cash Working Capital 1,732 2,050 243 2,714 Core RoIC (%) 18 % 19 % 21 % 24 %
FCFPS (Rs) 4.3 9.9 13.0 2.5 Cash Conv Cycle 41.5 44.0 5.0 47.0 Div Payout (%) 25 % 53 % 48 % 0 %
BVPS (Rs) 29.5 30.9 35.7 48.4 WC Turnover 8.8 8.3 72.9 7.8
P/E 57.7 30.0 26.7 17.3
EBITDAM (%) 19 % 22 % 25 % 28 % FA Turnover 1.7 1.9 2.1 1.4 P/B 9.4 8.6 7.9 3.6
PATM (%) 17 % 14 % 13 % 16 % Net D/E 0.3 0.2 0.0 0.1 P/FCFF 37.6 16.7 17.6 16.8
Tax Rate (%) 0 % 25 % 33 % 30 % Revenue/Capital Employed 2.1 2.2 2.0 1.7 EV/EBITDA 37.6 20.8 16.4 17.3
Sales growth (%) 13 % 12 % 4 % 19 %
Capital Employed/Equity 1.3 1.3 1.3 1.7
EV/Sales 7.3 4.7 4.2 4.9
FDEPS growth (%) 45 % -8 % -3 % 39 %
Dividend Yield (%) 1.1 % 2.3 % 2.0 % 0.0 %
Page 64
January 8, 2017 Analyst: DepeshKashyap,CFA [email protected] (+91-7228934327) Page 1 of 13
Before reading this report, you must refer to the disclaimer on the last page.
Hindustan Media Ventures Ltd Absolute : LONG
Relative : Overweight
Initiating Note Regular Coverage 30% ATR in 15 months
Watch out for ‘Money in the Bank’ Media & Entertainment
© 2017 Equirus. All rights reserved.
Rating Information
Price (Rs) 273
Target Price (Rs) 370
Target Date 31st Mar'18
Target Set On 6th Jan’17
Implied yrs of growth (DCF) 15
Fair Value (DCF) 466
Fair Value (DDM) 148
Ind Benchmark SPBSMSIP
Model Portfolio Position NA
Stock Information
Market Cap (Rs Mn) 20,066
Free Float (%) 25.70 %
52 Wk H/L (Rs) 314/243
Avg Daily Volume (1yr) 53,356
Avg Daily Value (Rs Mn) 15
Equity Cap (Rs Mn) 734
Face Value (Rs) 10
Bloomberg Code HMVL IN
Ownership Recent 3M 12M
Promoters 74.3 % 0.0 % -0.6 %
DII 1.2 % 0.2 % -11.6 %
FII 15.3 % -0.8 % 9.3 %
Public 9.3 % 0.6 % 2.9 %
Price % 1M 3M 12M
Absolute 5.2 % -8.0 % -5.3 %
Vs Industry 4.0 % -0.7 % -12.9 %
DBCORP 7.0 % -3.7 % 16.7 %
JAGRAN 2.7 % -11.6 % 4.2 %
Consolidated Quarterly EPS forecast
Rs/Share 1Q 2Q 3Q 4Q
EPS (16A) 5.7 6.1 6.4 6.4
EPS (17E) 6.6 7.5 6.5 6.5
Hindustan Media Ventures Limited (HMVL), a subsidiary of HT Media has strong
presence in Bihar, Jharkhand, Uttarakhand, UP and Delhi-NCR. Its flagship
newspaper, Hindustan is the second largest newspaper in India in terms of
readership. The Company has been trading at a discount to its peers due to its
smaller size and low dividend payouts. In our view, the current valuations do not
capture company’s strong balance sheet, high cash flow generation and its
reinvestment potential. We initiate our coverage with a Long rating with Mar’18TP
of Rs. 370.
Consolidation in UP and new radio frequencies to drive growth: Apart from
leveraging the strong brand identity of its promoter, the Company also derives
significant synergy benefits from HT Media in terms of infrastructure and content
sharing. In the phase III radio auctions, HT Media has won 7 frequencies in the main
cities of UP, which will help HMVL expand its cross media presence. HMVL will be
able to bundle its service offerings to the advertisers, thus gaining larger wallet
share.
Closing gap with the leader in UP should take the margins higher: After Jagran,
Hindustan along with Amar Ujala compete for the second position in UP. Currently,
Hindustan’s advertisement yields are ~55-60% of the market leader and they aim to
increase the advertisement yields to 75-80%. Company aims to further increase its
circulation in UP as the IRS survey is fast approaching. Demonetization is expected
to optically hit the company more than its peers due its high base effect in 3Q last
year (Bihar elections). But as the impact normalises, UP elections together with
implementation of 7th pay commission should drive advertising growth.
Cash on the balance sheet suggests reinvestment potential: Due to its strong cash
flow generation, HMVL boasts of having a strong balance sheet with net cash of ~Rs.
6,000mn (including long term investments). The Company has been looking to
expand into new geographies or consolidate its position in the existing markets
through acquisitions for the last 2 years now. Our scenario analysis suggests, if the
Company makes an acquisition in the range of 6x-10x EV/EBITDA multiple, it could
potentially add up to 12% to our FY18 EPS estimates.
Initiate coverage with Long rating and TP of Rs. 370: We initiate with Long rating
and Mar’18 TP of Rs. 370 based on 7x EV/EBITDA multiple on FY18E estimates.
Downside risks: Slower pickup in economy which would affect the advertisement
growth and more than expected increase in newsprint costs are key downside risks.
Consolidated Financials
Rs. Mn YE Mar FY16A FY17E FY18E FY19E
Sales 9,185 9,502 10,396 11,538
EBITDA 2,177 2,194 2,526 2,942
Depreciation 225 227 230 244
Interest Expense 113 161 121 121
Other Income 607 938 781 935
Reported PAT 1,805 1,990 2,128 2,528
Recurring PAT 1,805 1,990 2,128 2,528
Total Equity 9,086 10,959 12,963 15,343
Gross Debt 1,727 1,727 1,727 1,727
Cash 2,155 4,002 5,925 8,241
Rs Per Share FY16A FY17E FY18E FY19E
Earnings 24.6 27.1 29.0 34.4
Book Value 124 149 177 209
Dividends 1.2 1.4 1.4 1.7
FCFF 12.1 17.8 20.1 23.7
P/E (x) 11.1 10.1 9.4 7.9
P/B (x) 2.2 1.8 1.5 1.3
EV/EBITDA (x) 9.1 8.1 6.3 4.6
ROE (%) 22 % 20 % 18 % 18 %
Core ROIC (%) 46 % 41 % 46 % 53 %
EBITDA Margin (%) 24 % 23 % 24 % 25 %
Net Margin (%) 20 % 21 % 20 % 22 %
Page 65
Hindustan Media Ventures Limited Absolute – LONG Relative – Overweight 30% ATR in 15 months
January 8, 2017 Analyst: DepeshKashyap,CFA [email protected] (+91-7228934327) Page 2 of 13
Company Snapshot
How we differ from Consensus
- Equirus Consensus % Diff Comment
EPS FY17E 27.1 27.1 0 % In our view, consensus estimates are not
updated post demonetisation FY18E 29.0 31.0 -7 %
Sales FY17E 9,502 10,008 -5 %
FY18E 10,396 11,040 -6 %
PAT FY17E 1,990 1,989 0 %
FY18E 2,128 2,291 -7 %
Our Key Investment arguments:
1. Consolidation in UP and new radio frequencies to drive growth: Apart from,
leveraging the strong brand identity of its promoter, the Company also derives
significant synergy benefits from HT media in terms of infrastructure and
content sharing. In the phase III radio auctions, HT Media has won 7 frequencies
in the main cities of UP, which will help HMVL expand its cross media presence.
HMVL will be able to bundle its service offerings to the advertisers, thus gaining
larger wallet share.
2. Closing gap with the leader in UP should take the margins higher: After
Jagran, Hindustan along with Amar Ujala compete for the second position in UP.
Currently, Hindustan’s ad yields are ~55-60% of the market leader and they aim
to increase the ad yields to 75-80%. Company aims to further increase in
circulation in UP as the IRS survey is closing in. Demonetization is expected to
optically hit the company more than its peers due its high base effect in 3Q last
year (Bihar elections). But as the impact normalizes, the upcoming UP elections
together with implementation of 7th pay commission should drive advertising
growth.
3. Cash on the balance sheet suggests reinvestment potential: Due to its strong
cash flow generation, HMVL boasts of having a strong balance sheet with net
cash of ~Rs. 6,000mn (including long term investments). Our scenario analysis suggests, if
the Company makes an acquisition in the range of 6x-10x EV/EBITDA multiple, it could
potentially add up to 12% to our FY18 EPS estimates.
Risk to Our View:
1. Slowdown in economy
2. Newsprint prices rising more than expected
Key Triggers
Revival in the advertisement growth
Declaration of dividends/Buybacks or some strategic acquisition will provide big
boost
DCF Valuations & Assumptions
Rf Beta Ke Term. Growth Debt/IC in Term. Yr
6.8 % 0.7 11.0 % 2.5 % 35.6 %
- FY17E FY18E FY19-21E FY22-26E FY27-31E
Sales Growth 3 % 9 % 13 % 5 % 5 %
NOPAT Margin 15 % 16 % 18 % 15 % 15 %
IC Turnover 2.70 2.87 3.36 3.00 3.00
RoIC 40.7 % 46.3 % 60.9 % 46.9 % 46.1 %
Years of strong growth 1 2 5 10 15
Valuation as on date (Rs) 300 330 451 398 411
Valuation as of 31st Mar'18 340 375 512 452 466
Based on DCF, we derive 31st March 2018 fair value of Rs. 466.
Company Description:
HMVL, a subsidiary company of HT Media Ltd, is one of the leading print media
companies in India in terms of readership. HMVL publishes and print Hindustan, the
second largest daily newspaper in India in terms of readership with a readership of ~15
million readers.
Comparable valuation Mkt Cap
Rs. Mn.
Price
Target
Target
Date
EPS P/E BPS P/B RoE Div Yield
Company Reco. CMP FY16A FY17E FY18E FY16A FY17E FY18E FY16A FY17E FY16A FY17E FY18E FY16A FY17E
HMVL LONG 273 20,066 370 Mar'18 24.6 27.1 29.0 11.1 10.1 9.4 123.8 1.8 22 % 20 % 18 % 0.4 % 0.5 %
DB Corp. LONG 373 68,614 450 Mar'18 16.1 19.0 22.2 23.1 19.6 16.8 73.3 4.7 23 % 25 % 27 % 3.6 % 3.6 %
Jagran LONG 175 57,340 220 Mar'18 10.1 9.4 11.3 17.3 18.7 15.5 48.4 3.3 24 % 18 % 20 % 0.0 % 2.1 %
Page 66
Hindustan Media Ventures Limited Absolute – LONG Relative – Overweight 30% ATR in 15 months
January 8, 2017 Analyst: DepeshKashyap,CFA [email protected] (+91-7228934327) Page 3 of 13
Investment Rationale
Consolidation in UP and new radio frequencies to drive growth: Hindustan is the second largest read newspaper in India and has a leading position in the
key Hindi speaking states i.e. Bihar, Jharkhand, UP, Uttarakhand and Delhi. The
advertising revenue, which is related to the economic growth of the states and India
overall, is expected to remain strong given strong GDP growth rates in these states. The
circulation revenues are also expected to remain strong due to the structural growth
drivers like improving spending power of the readers and rising literacy levels.
Exhibit 1: Company enjoys leadership position in Hindi states
Source: Company, Equirus Research
No.1 position in Bihar and Jharkhand: According to the last readership survey,
Hindustan was the No.1 Hindi newspaper in Bihar and Jharkhand with a readership of
4.4mn and 1.3mn respectively. The company has printing locations in the cities of Patna,
Ranchi, Muzaffarpur, Dhanbad, Bhagalpur, Jamshedpur and Gaya. Besides having large
literate population of 54mn and 19mn in Bihar and Jharkhand respectively, the GDP
growth rates (constant prices) of Bihar and Jharkhand are of the order of 9.5% and 8.5%
respectively which is higher than India’s overall GDP growth rates.
No.2 in UP: UP is the second largest state in terms of GDP, and with 118.4mn literate
population, it is also the largest advertising market for Hindi newspaper with rough
market size of Rs. 12,000mn (Company estimates). The Company has been investing
aggressively in UP and is currently the No.2 player, with a readership of 8.13mn. The
company has printing locations in the cities of Lucknow, Varanasi, Meerut, Agra,
Allahabad, Gorakhpur, Bareilly, Moradabad, Aligarh, Kanpur, Dehradun, Greater Noida
and Haldwani. With a huge size of literate population, there is a further scope of
increasing market penetration.
No.2 in Delhi-NCR: In Delhi, Hindustan has been leveraging the strong brand identity of
its promoter Hindustan Times and currently is at No.2 position with a readership of
1.1mn.
Exhibit 2: GDP growth (%) in key states for Hindustan is higher than India’s overall
average growth rate
Source: Statistictimes, Equirus Research
i) Circulation revenues to grow at CAGR (FY16-19E) of 5% in absence of any
major expansion plans: The Company has grown its circulation revenues at
a CAGR (FY12-16) of 12% driven by both increase in volumes and pricing.
The Company has been trying to expand into newer geographies
inorganically or consolidate its position in the existing ones. Till that
happens, the Company is unlikely to expand in other states organically. We
estimate the circulation revenues to grow at CAGR (FY16-19E) of 5% mainly
driven my increase in number of copies and nominal increase in the prices.
In our view, it will be difficult for the company to keep increasing prices
due to competitive pressures.
1.07
4.38
1.31
8.13
2
1 1
2
0
1
2
3
4
5
6
7
8
9
Delhi Bihar Jharkhand UP
Hindustan's readership (mn) Current Readership position
4
6
8
10
12
14
16
18
2010-11 2011-12 2012-13 2013-14 2014-15
Bihar Jharkhand Uttarakhand Delhi Uttar Pradesh
Page 67
Hindustan Media Ventures Limited Absolute – LONG Relative – Overweight 30% ATR in 15 months
January 8, 2017 Analyst: DepeshKashyap,CFA [email protected] (+91-7228934327) Page 4 of 13
Exhibit 3: Circulation revenue estimated to grow at a CAGR (FY16-19E) of 5%
Source: Company, Equirus Research
ii) Advertising revenues estimated to grow at CAGR (FY16-19e) of 9%: The
Company has grown its advertising revenues at a CAGR (FY12-16) of 12%.
After Jagran, Hindustan along with Amar Ujala compete for the second
position in UP. Currently, Hindustan’s advertisement yields are ~55-60% of
the market leader and they aim to increase the advertisement yields to 75-
80%. We estimate advertisement revenue growth of CAGR (FY16-19E) of 9%.
The upcoming state elections in UP should help the advertising revenues in
the near term.
Exhibit 4: Advertising revenue estimated to grow at CAGR (FY16-19E) of 9%
Source: Company, Equirus Research
iii) Cross selling and synergy benefits from the promoter, HT media:
Radio FEVER enters UP: Unlike its peers like DainikBhaskar and Jagran,
which have made big investments to grow their radio and digital business,
HMVL does not have any direct investments, but it derives certain cross-
selling benefits from its promoter businesses. In phase III radio auctions, HT
media has acquired 10 new FM radio frequencies, one each in Delhi, Mumbai
and Hyderabad and 7 frequencies in large cities of UP. Hindustan is the key
player in the UP market and its main rival Jagran has presence in both print
and radio space in the state. With the arrival of Radio Fever in UP,
Hindustan will derive significant synergies as they will be able to offer both
print and radio solutions to the clients.
Outsourcing the Digital business: HMVL/HT Media have formed a new
entity “HT Digital stream”, which will take care of the digital assets of both
HT media and HMVL. In this new entity, HMVL will hold 43% of the share and
remaining 57% will be held by HT Media. The Company is hoping of greater
synergies between HT Media digital and HMVL digital, and also greater
synergies between print and digital.
Overall we are estimating revenues to grow at CAGR (FY16-19E) of 8% as compared to the
CAGR (FY12-16) growth of 11%.
Exhibit 5: Overall revenues estimated to grow at CAGR (FY16-19E) of 8%
Source: Company, Equirus Research
2%
4%
6%
8%
10%
12%
14%
16%
500
1000
1500
2000
2500
3000
FY12 FY13 FY14 FY15 FY16 FY17e FY18e FY19e
Circulation revenue YoY growth(%)
2%
4%
6%
8%
10%
12%
14%
16%
18%
2000
3000
4000
5000
6000
7000
8000
9000
10000
FY12 FY13 FY14 FY15 FY16 FY17e FY18e FY19e
Advertisement revenue YoY growth (%)
2.0%
4.0%
6.0%
8.0%
10.0%
12.0%
14.0%
16.0%
500
2500
4500
6500
8500
10500
12500
FY12 FY13 FY14 FY15 FY16 FY17e FY18e FY19e
Revenues YoY growth (%)
Page 68
Hindustan Media Ventures Limited Absolute – LONG Relative – Overweight 30% ATR in 15 months
January 8, 2017 Analyst: DepeshKashyap,CFA [email protected] (+91-7228934327) Page 5 of 13
Significant potential for margins to expand further
The Company has expanded its EBITDA margins from 16% in FY12 to 24% in FY16, implying
an average improvement of 200bps every year. The management feels confident that this
trend of margin expansion will continue for next few years as well. Higher newsprint
costs may have a dampening impact but we contend that the Company will be able to see
through the rising costs due to following factors:
Advertising revenues may provide cushion against the pressure of rising costs: In the
mature markets of Bihar and Jharkhand, the Company is operating at margins above 30%
but in UP, the Company is operating at margins of around 20%. Currently, the Company is
able to charge 50%-60% of the advertisement rates the market leader charges. As the
Company solidifies its position in UP and gets closer to the market leader in terms of
circulation and readership, there will be scope for further margin expansion.
Cost cutting initiatives at the corporate level: HT Media has undertaken a cost cutting
initiative at the group level, which will affect HMVL as well. The real effects of such an
initiative are difficult to quantify at the moment, but it will be step in right direction to
improve the margins further.
Exhibit 6: EBITDA margins to expand further albeit at a slower pace
Source: Company, Equirus Research
We estimate EBITDA to grow at a CAGR (FY16-19E) of 11% with EBITDA margins improving
to 25.5% in FY19E from 23.7% in FY16.
Strong cash flow generation to keep the balance sheet strong
As of FY16, HMVL had Rs. 2,155mn of cash and cash equivalents on its balance sheet, if
we also include the non-current investments (which are basically investments in various
debt funds) of Rs. 5,483mn, then the effective cash on the balance sheet comes roughly
close to Rs. 7,638mn. With strong cash flow from operations (Rs. 1,500mn) and minimal
capital expenditure in the next few years, we estimate the company to have strong free
cash yield of 7% in FY17E and 8% yield in FY18E.
Exhibit 7: Low dividend payouts despite high cash flow generation
Source: Company, Equirus Research
Exhibit 8: Prudent capital allocation may improve the return ratios further
Source: Company, Equirus Research, *Core RoIC excludes cash
15.9%
17.7%
20.7% 20.3%
23.7% 23.1%
24.3%
25.5%
15.0%
17.0%
19.0%
21.0%
23.0%
25.0%
27.0%
500
1,000
1,500
2,000
2,500
3,000
3,500
FY12 FY13 FY14 FY15 FY16 FY17e FY18e FY19e
EBITDA EBITDA Margin (RHS)
10%
8%
6%
5% 5% 5% 5%
0%
2%
4%
6%
8%
10%
12%
0
500
1,000
1,500
2,000
FY13 FY14 FY15 FY16 FY17e FY18e FY19e
FCFF dividend payout ratio(%) (RHS)
10%
12%
14%
16%
18%
20%
22%
24%
26%
28%
FY13 FY14 FY15 FY16 FY17e FY18e FY19e
Core RoIC RoE
Page 69
Hindustan Media Ventures Limited Absolute – LONG Relative – Overweight 30% ATR in 15 months
January 8, 2017 Analyst: DepeshKashyap,CFA [email protected] (+91-7228934327) Page 6 of 13
Scenario analysis: question of reinvestment
A core challenge of modeling highly cash generative business and high cash on the
balance sheet is that investors end up underestimating the positive impact of re-
investment. HMVL has clearly stated its strategy that it is looking for acquisition to
expand its reach in new geographies or to consolidate its position in the existing markets.
The management has clearly communicated that it may require Rs. 3,000-5,000mn for
the acquisition, which is the primary reason that it has been accumulating cash, without
paying reasonable dividends. Since, Company has been unable to finalise on any
acquisition target for the last 2 to 3 years and net cash on the balance sheet has been
increasing, investors are becoming skeptical of the management plans.
Company’s stated acquisition criteria
The Company has been looking for acquisitions for the last 2.5 years now but the right
target still seems to elude them. We have put together the broad criteria for acquisitions
which management has conveyed in various analyst meets and conference calls:
Target type: The Company is only focusing on print media companies in the
Hindi or Vernacular space. English print, radio and digital falls in the realm of
HT Media, so HMVL is not looking at those companies
Operational synergies: The Company is likely to focus on targets that offer cost
synergies in terms of editorial or print facilities.
Size: According to Company, they have looked at targets in the wide range of
Rs. 150mn to Rs. 5,000mn. In our view, the Company will not be comfortable for
acquisitions beyond Rs. 5,000-6,000mn. The Company is ideally looking at a
payback period of 5-7 years on their investment.
Geographic focus: In the Hindi speaking belt, there are major states like
Madhya Pradesh, Gujarat, Rajasthan, Punjab, where the Company has no
presence. It may ideally be targeting players in these states or it may look at
southern states where its main rivals are not present (in the vernacular space).
In our view, Company may ideally not look for acquisitions in the regions where
it is already present as it is easier to expand organically in those regions.
To counter the uncertainties of estimates that do not include potential acquisitions, we
have performed a scenario analysis to measure the impact of acquisitions on our
estimates and valuations. Our key assumptions in this analysis are:
The Company makes an acquisition of Rs. 5,000mn (which is at the top end of
what Company will be willing to pay) in FY18E
Average multiple paid for the acquisition may range from 6x-12x trailing EBITDA
(broad range in which listed peers have traded)
Operating margin of the acquired business is 23%, which is a fair assumption for
any print player in its mature markets
Working capital management of acquired business performs in line with the
existing business.
Our analysis in Exhibit 9 suggests, if HMVL pays 6x-10x EBITDA multiple for an
acquisition, it may be EPS accretive from first year, paying higher may prove to be
dilutive as the HMVL is currently generating good returns from its investments in the form
of other income.
Page 70
Hindustan Media Ventures Limited Absolute – LONG Relative – Overweight 30% ATR in 15 months
January 8, 2017 Analyst: DepeshKashyap,CFA [email protected] (+91-7228934327) Page 7 of 13
Exhibit 9: Our acquisition scenario analysis suggests right acquisition at right price may add upto 12% to our base case estimates
HMVL : Base case (Rs mn) FY16 FY17 FY18
FY18 Acquisition case (Rs mn) 6x 8x 10x 12x
Sales 9,185 9,502 10,396
Sales 14,019 13,114 12,570 12,208
Acquisition Growth (%)
0.0% 0.0%
Acquisition Growth (%) 38.1% 28.6% 22.9% 19.1%
Organic Growth (%)
3.5% 9.4%
Organic Growth (%) 9.4% 9.4% 9.4% 9.4%
Total Sales Growth (%)
3.5% 9.4%
Total sales Growth (%) 47.5% 38.0% 32.3% 28.5%
EBITDA 2,177 2,194 2,526
EBITDA 3,359 3,151 3,026 2,942
Margin (%) 23.7% 23.1% 24.3%
Margin (%) 24.0% 24.0% 24.1% 24.1%
Depreciation 225 227 230
Depreciation 305 305 305 305
EBIT 1,952 1,967 2,296
EBIT 3,054 2,846 2,721 2,637
Margin (%) 21.3% 20.7% 22.4%
Margin (%) 21.8% 21.7% 21.6% 21.6%
Net interest income 494 778 660
Net interest income 260 260 260 260
PBT 2,446 2,745 2,955
PBT 3,314 3,105 2,980 2,897
Tax 641 755 828
Tax 928 870 835 811
Tax Rate (%) 26.2% 27.5% 28.0%
Tax Rate (%) 28.0% 28.0% 28.0% 28.0%
Net income 1,805 1,990 2,128
Net income 2,386 2,236 2,146 2,086
No. of shares 73.4 73.4 73.4
No. of shares 73.4 73.4 73.4 73.4
EPS(Rs) 24.6 27.1 29.0
EPS(Rs) 32.5 30.5 29.2 28.4
Upside to base estimates 12% 5% 1% -2%
Source: Equirus Research
Page 71
Hindustan Media Ventures Limited Absolute – LONG Relative – Overweight 30% ATR in 15 months
January 8, 2017 Analyst: DepeshKashyap,CFA [email protected] (+91-7228934327) Page 8 of 13
Valuation
HMVL currently trades at EV/EBITDA of 6x and P/E of 9x on our FY18 estimates. Due to its
small scale and low dividend payout ratio, the Company has always traded at a discount
to its larger peers. As its other peers, we value HMVL using our preferred EV/EBITDA
methodology. We arrive at our target price of Rs. 370 by applying EV/EBITDA multiple of
7x, which is the average EV/EBITDA multiple for the stock since last 5 years, on our FY18
EBITDA estimate of Rs. 2,526mn.
Our target price implies PE of 13x on our FY18 EPS estimates. In our view, as the
Company increases its dividend payout in line with its peers, it should re-rate to higher
multiples in line with peers.
Exhibit 10: HMVL’s target price derivation
Rs mn EBITDA (FY18e) Multiple EV
HMVL 2,526 7x 17,679
(-)Debt
1,810
(+)Cash and investments
11,408
Equity value
27,278
Outstanding shares (mn)
73.4
Target price (Rs)
370
Source: Equirus research, *cash and investments also include non-current investments
which are mainly investments in debt funds and are fairly liquid
Exhibit 11: HMVL has traded in the P/E range of 10x-15x
Source: Company, Equirus Research
Exhibit 12: HMVL has traded in the EV/EBITDA range of 5x-10x
Source: Company, Equirus Research
0%5%10%15%20%25%30%35%
50
150
250
350
450
Mar/13
Jun/13
Sep/13
Dec/13
Mar/14
Jun/14
Sep/14
Dec/14
Mar/15
Jun/15
Sep/15
Dec/15
Mar/16
Jun/16
Sep/16
Dec/16
Mar/17
Jun/17
Sep/17
Dec/17
Mar/18
6x
8x
10x
12x
15x
EPS Growth
0%
5%
10%
15%
20%
25%
30%
35%
0500010000150002000025000300003500040000
Mar/13
Jun/13
Sep/13
Dec/13
Mar/14
Jun/14
Sep/14
Dec/14
Mar/15
Jun/15
Sep/15
Dec/15
Mar/16
Jun/16
Sep/16
Dec/16
Mar/17
Jun/17
Sep/17
Dec/17
Mar/18
4x
8x
10x
12x
15x
EBITDA Growth
Page 72
Hindustan Media Ventures Limited Absolute – LONG Relative – Overweight 30% ATR in 15 months
January 8, 2017 Analyst: DepeshKashyap,CFA [email protected] (+91-7228934327) Page 9 of 13
Investment Risk & Concerns
Economic slowdown can result in lower than expected growth in advertising revenue:
A slowdown in the economy can result in lower than expected media spend by the
corporates, which can have a negative impact on the advertising revenue.
Higher than expected increase in newsprint price will have a negative impact on the
operating margins: Newsprint prices account for ~30-40% of the total sales and 45-50% of
the total cost component. We are estimating a 5-6% y-o-y increase in the newsprint
prices over the next two financial years. Higher than expected increase in newsprint
prices will have a negative impact on the operating margin of the company
Corporate Governance
Following are key highlights of our assessment of level of corporate governance in the
company from its FY16 Annual Report.
The Board of Directors of the Company has a balanced mix of Executive directors, Non-
executive directors and independent directors. The Directors are eminent professionals
from diverse fields. The Board comprises of nine directors including seven non-executive
directors. The Chairperson of the board is a woman non-executive director.
Company complies with the requirement of at least one-half of the board to comprise of
independent directors. None of the independent directors of the Company serve as
Independent director in more than seven listed entities.
Disclosure Norms
Quarterly Reporting: The quarterly financials are provided on a standalone basis in the
format in which it is submitted to the stock exchanges.
Auditors Report The Auditor, S.R. Batliboi & Co. has reported the books of accounts to be in proper order
and has stated that the financials provide a true and fair view of the business. There is
no negative remark on the accounting policy or financial management of the company.
HMVL is a professionally run company and focuses a lot on adopting good corporate
governance practices. It is a subsidiary of HT Media which has been acknowledged as one
of the top 25 companies adopting good corporate governance practices for 2009 by the
Institute of Company Secretaries of India. HMVL draws its governance practices from HT
Media itself and is expected to have similar robust board practices. HMVL has a
completely different senior and second line of management.
Annexure 1: Company Overview Hindustan Media Ventures (HMVL), promoted by HT Media (an integrated multimedia
company which publishes leading dailies in India such as Hindustan Times and Mint), is
one of the leading print media companies in India with strong presence in major Hindi
speaking market. HT Media currently owns ~74.3% of HMVL's equity share capital.
Hindustan, the Hindi flagship daily of HMVL, covers news across the entire spectrum of
international, national and local news relating to politics, business, entertainment,
sports and other general interests. The first edition of 'Hindustan' was published on April
12, 1936 from Delhi and the reach of the newspaper now extends to six regions, namely,
Uttar Pradesh, Uttarakhand, Bihar, Jharkhand, Mohali and Delhi-NCR. 'Hindustan' is the
second largest brand in terms of readership of Hindi daily newspapers. Hindustan
dominates in Bihar with an undisputed readership of over 4mn. Hindustan has been the
No.1 newspaper of Jharkhand, ever since IRS survey started reporting readership
numbers for Jharkhand as a separate state and in Delhi + NCR, Hindustan is an
undisputed No. 2. With strong focus on UP, the Company has reached No.2 position in
the state in terms of readership.
Company History
1918: Incorporation of the Company as The Behar Journals Limited
1919: Commencement of the business of the Company; Commissioning of the printing
press at Patna; Commencement of printing and publishing of English newspaper,
“Searchlight”
1947: Commencement of printing and publication of Hindi daily “Pradeep” at Patna
1986: Termination of printing and publishing of Hindi daily “Pradeep” and English daily
“Searchlight”.
1987: Name of the Company changed to “Searchlight Publishing house limited” in order
to capitalize on the name earned by its publication Searchlight
2008: Name of the Company changed to Hindustan media Ventures Ltd
2009: Acquisition of Hindi business from HT Media comprising of Hindi daily newspaper,
“Hindustan”, in terms of the printing agreement with the holding company
2010: Company came out with an IPO of Rs. 2,700mn and got listed on BSE & NSE on 21st
July 2010
2016: Acquisition of Hindi brands from the parent company for Rs. 670mn.
Page 73
Hindustan Media Ventures Limited Absolute – LONG Relative – Overweight 30% ATR in 15 months
January 8, 2017 Analyst: DepeshKashyap,CFA [email protected] (+91-7228934327) Page 10 of 13
Key Management profile
Mrs. Shobhana Bhartia – Non-executive Chairperson Mrs. Shobhana Bhartia, a graduate from Calcutta University, was also a former MP from
RajyaSabha. She has been associated with the company since its inception. She is also a
recipient of the Padma Shri for her contribution in the field of journalism.
Mr. Vivek Khanna – CEO Mr. Vivek Khanna is a Post Graduate in Management from IIM-Ahmedabad and Economics
graduate from the University of Delhi. He joined HT Media in 2008 after working for more
than 16 years of which 11 were spent in Hindustan Lever Limited (HLL).
Mr. Ajay Relan – Non-executive Independent director Mr. Ajay Relan, age 56 years, is an MBA from IIM Ahmedabad and has over 25 years of
corporate and investment banking experience. MrRelan has served on the board of
directors of several Citigroup Venture Capital India portfolio companies such as HT
Media, Yes Bank, i-Flex and Progeon.
Mr. Ashwani Windlass – Non-executive Independent Director Mr. AshwaniWindlass, holds an MBA from FMS, Delhi and has over 30 years of experience
in strategy, telecom and technology. He has established and managed many green field
projects in the field of telecom and technology.
Mr. Piyush G Mankad – Non-executive Independent Director Mr. Piyush G Mankad,was educated at Delhi University and later at Cambridge, UK where
he obtained a Post Graduate Diploma in Development Studies, with distinction. He is a
retired civil servant with a distinguished career of over 40 years in the IAS.
Mr. Shardul S. Shroff – Non-executive Independent Director
Mr. Shardul S. Shroff, age 54 years, holds a bachelor degree in Commerce from Sydenham
College Mumbai and has over 29 years of experience as a corporate attorney. He has
extensive experience in areas of infrastructure, projects and project finance, capital
markets and commercial contracts.
Dr. Mukesh Aghi –Director
Dr. Mukesh Aghi holds an advanced Management Diploma from Harvard business School,
Ph.D in International relations from Claremont Graduate University, California and an
MBA in International marketing from Andrews University, Michigan.
Mr. Priyavrat Bhartia –Whole time Director
Mr. Priyavrat Bhartia started as a financial analyst with Wasserstein Parella & Co., New
York in 1998. He holds a MBA from Stanford University (USA). He is also a director with a
number of companies including Birla Cotton Spinning and weaving mills ltd, Jubilant
Enpropvt, Ltd, HT Burda Media limited and Firefly e-Ventures limited.
Mr. Shamit Bhartia –Non executive Director
Mr. Shamit Bhartia holds a degree in Economics from Dartmouth College, USA. He has
worked in the Corporate Finance and M&A group, Lazard Frere, New York.
Mr. Benoy Roychowdhury – Whole time Director
Mr. Benoy Roychowdhury, has over 25 years of experience in marketing, sale and general
management. He holds a bachelor’s degree in Economics from Presidency College,
Calcutta University and has a Post Graduate Diploma in Business Management from XLRI,
Jamshedpur. He was previously with HT Media, where he was executive Director and was
responsible for revenue functions of media marketing and circulation. He also has worked
with Whirlpool as VP – Sales, Trade Marketing and Logistics.
Page 74
Hindustan Media Ventures Limited Absolute – LONG Relative – Overweight 30% ATR in 15 months
January 8, 2017 Analyst: DepeshKashyap,CFA [email protected] (+91-7228934327) Page 11 of 13
Standalone Quarterly Earnings Forecast and Key Drivers Rs in Mn 1Q16A 2Q16A 3Q16A 4Q16A 1Q17A 2Q17A 3Q17E 4Q17E 1Q18E 2Q18E 3Q18E 4Q18E FY16A FY17E FY18E FY19E
Revenue 2,237 2,269 2,404 2,275 2,392 2,295 2,380 2,435 2,584 2,525 2,737 2,551 9,185 9,502 10,396 11,538
Raw material consumed 842 861 893 868 937 883 919 911 993 954 1,030 933 3,465 3,650 3,910 4,269
Personnel Expenses 287 299 312 343 302 324 332 343 333 357 359 376 1,240 1,302 1,424 1,558
Operating and other expenses 563 588 599 553 584 583 609 581 628 619 657 633 2,303 2,357 2,537 2,769
- - - - - - - - - - - - - - - - -
- - - - - - - - - - - - - - - - -
EBITDA 545 521 601 511 569 505 519 600 630 596 692 608 2,177 2,194 2,526 2,942
Depreciation 55 53 56 61 50 52 60 65 57 57 57 57 225 227 230 244
EBIT 490 467 545 450 519 453 459 535 573 538 634 551 1,952 1,967 2,296 2,697
Interest 29 30 27 27 47 41 36 37 30 30 30 30 113 161 121 121
Other Income 117 190 112 189 201 338 235 166 195 195 195 195 607 938 781 935
PBT 578 627 630 611 673 749 658 664 738 703 799 716 2,446 2,745 2,955 3,511
Tax 161 177 161 142 186 202 181 186 207 197 224 200 641 755 828 983
Recurring PAT 417 450 469 470 487 547 477 479 531 506 575 515 1,805 1,990 2,128 2,528
Extraordinary 0 0 0 0 0 0 0 0 0 0 0 0 0 0 0 0
Reported PAT 417 450 161 470 487 547 477 479 531 506 575 515 1,805 1,990 2,128 2,528
EPS (Rs) 5.68 6.14 6.38 6.40 6.64 7.45 6.50 6.52 7.24 6.90 7.84 7.02 24.60 27.11 28.99 34.44
Key Drivers
Ad revenue(in Rs mn) - - - - - - - - - - - - 6,840 7,045 7,820 8,836
Circulation revenue(in Rs mn) - - - - - - - - - - - - 2,144 2,252 2,366 2,486
- - - - - - - - - - - - - - - - -
- - - - - - - - - - - - - - - - -
- - - - - - - - - - - - - - - - -
- - - - - - - - - - - - - - - - -
Sequential Growth (%)
Revenue 11 % 1 % 6 % -5 % 5 % -4 % 4 % 2 % 6 % -2 % 8 % -7 % - - - -
Raw material consumed 6 % 2 % 4 % -3 % 8 % -6 % 4 % -1 % 9 % -4 % 8 % -9 % - - - -
EBITDA 23 % -4 % 15 % -15 % 11 % -11 % 3 % 16 % 5 % -5 % 16 % -12 % - - - -
EBIT 26 % -5 % 17 % -17 % 15 % -13 % 1 % 17 % 7 % -6 % 18 % -13 % - - - -
Recurring PAT 7 % 8 % 4 % 0 % 4 % 12 % -13 % 0 % 11 % -5 % 14 % -10 % - - - -
EPS 7 % 8 % 4 % 0 % 4 % 12 % -13 % 0 % 11 % -5 % 14 % -10 % - - - -
Yearly Growth (%)
Revenue 6 % 14 % 16 % 13 % 7 % 1 % -1 % 7 % 8 % 10 % 15 % 5 % 12 % 3 % 9 % 11 %
EBITDA 27 % 33 % 50 % 15 % 4 % -3 % -14 % 17 % 11 % 18 % 33 % 1 % 31 % 1 % 15 % 16 %
EBIT 33 % 43 % 61 % 16 % 6 % -3 % -16 % 19 % 10 % 19 % 38 % 3 % 37 % 1 % 17 % 18 %
Recurring PAT 23 % 43 % 28 % 21 % 17 % 21 % 2 % 2 % 9 % -7 % 21 % 8 % 28 % 10 % 7 % 19 %
EPS 23 % 43 % 28 % 21 % 17 % 21 % 2 % 2 % 9 % -7 % 21 % 8 % 28 % 10 % 7 % 19 %
Margin (%)
EBITDA 24 % 23 % 25 % 22 % 24 % 22 % 22 % 25 % 24 % 24 % 25 % 24 % 24 % 23 % 24 % 25 %
EBIT 22 % 21 % 23 % 20 % 22 % 20 % 19 % 22 % 22 % 21 % 23 % 22 % 21 % 21 % 22 % 23 %
PBT 26 % 28 % 26 % 27 % 28 % 33 % 28 % 27 % 29 % 28 % 29 % 28 % 27 % 29 % 28 % 30 %
PAT 19 % 20 % 19 % 21 % 20 % 24 % 20 % 20 % 21 % 20 % 21 % 20 % 20 % 21 % 20 % 22 %
Page 75
Hindustan Media Ventures Limited Absolute – LONG Relative – Overweight 30% ATR in 15 months
January 8, 2017 Analyst: DepeshKashyap,CFA [email protected] (+91-7228934327) Page 12 of 13
Consolidated Financials P&L (Rs Mn) FY16A FY17E FY18E FY19E
Balance Sheet (Rs Mn) FY16A FY17E FY18E FY19E
Cash Flow (Rs Mn) FY16A FY17E FY18E FY19E
Revenue 9,185 9,502 10,396 11,538 Equity Capital 734 734 734 734 PBT 2,446 2,745 2,955 3,511
Op. Expenditure 7,008 7,309 7,870 8,596 Reserve 8,352 10,226 12,229 14,609 Depreciation 225 227 230 244
EBITDA 2,177 2,194 2,526 2,942 Networth 9,086 10,959 12,963 15,343 Others -387 -778 -660 -814
Depreciation 225 227 230 244 Long Term Debt 1,727 1,727 1,727 1,727 Taxes Paid 659 755 828 983
EBIT 1,952 1,967 2,296 2,697 Def Tax Liability 82 82 82 82 Change in WC 4 -43 -105 -104
Interest Expense 113 161 121 121 Minority Interest 0 0 0 0 Operating C/F 1,630 1,396 1,593 1,855
Other Income 607 938 781 935 Account Payables 947 1,011 1,060 1,158 Capex -827 -210 -205 -205
PBT 2,446 2,745 2,955 3,511 Other Curr Liabi 994 994 994 994 Change in Invest -1,718 0 0 0
Tax 641 755 828 983 Total Liabilities & Equity 12,837 14,774 16,827 19,305 Others 436 938 781 935
PAT bef. MI & Assoc. 1,805 1,990 2,128 2,528 Net Fixed Assets 2,467 2,450 2,425 2,385 Investing C/F -2,110 729 575 730
Minority Interest 0 0 0 0 Capital WIP 26 26 26 26 Change in Debt 743 0 0 0
Profit from Assoc. 0 0 0 0 Others 5,849 5,849 5,849 5,849 Change in Equity 0 0 0 0
Recurring PAT 1,805 1,990 2,128 2,528
Inventory 482 490 525 573 Others -213 -277 -245 -269
Extraordinaires 0 0 0 0 Account Receivables 1,177 1,276 1,396 1,549 Financing C/F 530 -277 -245 -269
Reported PAT 1,805 1,990 2,128 2,528 Other Current Assets 682 682 682 682 Net change in cash 51 1,847 1,923 2,316
FDEPS (Rs) 24.6 27.1 29.0 34.4 Cash 2,155 4,002 5,925 8,241 RoE (%) 22 % 20 % 18 % 18 %
DPS (Rs) 1.2 1.4 1.4 1.7 Total Assets 12,837 14,774 16,827 19,305
RoIC (%) 20 % 18 % 16 % 16 %
CEPS (Rs) 27.7 30.2 32.1 37.8 Non-cash Working Capital 400 443 548 652
Core RoIC (%) 46 % 41 % 46 % 53 %
FCFPS (Rs) 12.1 17.8 20.1 23.7 Cash Conv Cycle 15.9 17.0 19.2 20.6 Div Payout (%) 6 % 6 % 6 % 6 %
BVPS (Rs) 123.8 149.3 176.6 209.1 WC Turnover 23.0 21.4 19.0 17.7 P/E 11.1 10.1 9.4 7.9
EBITDAM (%) 24 % 23 % 24 % 25 % FA Turnover 3.7 3.8 4.2 4.8 P/B 2.2 1.8 1.5 1.3
PATM (%) 20 % 21 % 20 % 22 % Net D/E 0.0 -0.2 -0.3 -0.4 P/FCFF 22.6 15.4 13.6 11.6
Tax Rate (%) 26 % 28 % 28 % 28 % Revenue/Capital Employed 2.1 1.9 1.8 1.6 EV/EBITDA 9.1 8.1 6.3 4.6
Sales Growth (%) 12 % 3 % 9 % 11 %
Capital Employed/Equity 1.1 1.0 1.0 1.1
EV/Sales 2.1 1.9 1.5 1.2
FDEPS Growth (%) 28 % 10 % 7 % 19 %
Dividend Yield (%) 0.4 % 0.5 % 0.5 % 0.6 %
TTM P/E vs. 2 yr forward EPS growth TTM EV/EBITDA vs. 2 yr forward EBITDA growth TTM P/B vs. 2 yr forward RoE
0%5%10%15%20%25%30%35%
50
150
250
350
450
Mar/13
Jun/13
Sep/13
Dec/13
Mar/14
Jun/14
Sep/14
Dec/14
Mar/15
Jun/15
Sep/15
Dec/15
Mar/16
Jun/16
Sep/16
Dec/16
Mar/17
Jun/17
Sep/17
Dec/17
Mar/18
6x
8x
10x
12x
15x
EPS Growth
0%
5%
10%
15%
20%
25%
30%
35%
0500010000150002000025000300003500040000
Mar/13
Jun/13
Sep/13
Dec/13
Mar/14
Jun/14
Sep/14
Dec/14
Mar/15
Jun/15
Sep/15
Dec/15
Mar/16
Jun/16
Sep/16
Dec/16
Mar/17
Jun/17
Sep/17
Dec/17
Mar/18
4x
8x
10x
12x
15x
EBITDA Growth
0%5%10%15%20%25%30%35%40%
0
200
400
600
800
1000
1200
Mar/13
Jun/13
Sep/13
Dec/13
Mar/14
Jun/14
Sep/14
Dec/14
Mar/15
Jun/15
Sep/15
Dec/15
Mar/16
Jun/16
Sep/16
Dec/16
Mar/17
Jun/17
Sep/17
Dec/17
Mar/18
RoE
0.5x
1x
2x
3x
4x
Page 76
Hindustan Media Ventures Limited Absolute – LONG Relative – Overweight 30% ATR in 15 months
January 8, 2017 Analyst: DepeshKashyap,CFA [email protected] (+91-7228934327) Page 13 of 13
Historical Consolidated Financials P&L (Rs Mn) FY13A FY14A FY15A FY16A
Balance Sheet (Rs Mn) FY13A FY14A FY15A FY16A
Cash Flow (Rs Mn) FY13A FY14A FY15A FY16A
Revenue 6,363 7,297 8,186 9,185 Equity Capital 734 734 734 734 PBT 1,140 1,546 1,881 2,446
Op. Expenditure 5,237 5,785 6,521 7,008 Reserve 4,349 5,358 6,653 8,352 Depreciation 217 216 243 225
EBITDA 1,126 1,512 1,665 2,177 Networth 5,083 6,092 7,387 9,086 Others -151 -212 -403 -387
Depreciation 217 216 243 225 Long Term Debt 32 203 984 1,727 Taxes Paid 284 428 397 659
EBIT 909 1,297 1,422 1,952 Def Tax Liability 66 65 59 82 Change in WC -115 11 51 4
Interest Expense 53 57 105 113 Minority Interest 0 0 0 0 Operating C/F 807 1,133 1,375 1,630
Other Income 285 306 564 607 Account Payables 599 762 972 947 Capex -75 -426 -153 -827
PBT 1,140 1,546 1,881 2,446 Other Curr Liabi 501 621 812 994 Change in Invest -666 -909 -1,786 -1,718
Tax 295 434 472 641 Total Liabilities & Equity 6,281 7,743 10,214 12,837 Others 166 161 123 436
PAT bef. MI & Assoc. 845 1,112 1,409 1,805 Net Fixed Assets 1,781 1,693 1,801 2,467 Investing C/F -575 -1,173 -1,816 -2,110
Minority Interest 0 0 0 0 Capital WIP 10 110 32 26 Change in Debt -231 171 774 743
Profit from Assoc. 0 0 0 0 Others 1,345 1,567 5,146 5,849 Change in Equity 0 0 0 0
Recurring PAT 845 1,112 1,409 1,805 Inventory 324 330 448 482 Others -152 -155 -197 -213
Extraordinaires 0 0 0 0 Account Receivables 791 933 1,072 1,177 Financing C/F -383 16 577 530
Reported PAT 845 1,112 1,409 1,805 Other Current Assets 219 414 438 682 Net change in cash -151 -24 136 51
EPS (Rs) 11.5 15.2 19.2 24.6 Cash 1,813 2,696 1,277 2,155
RoE (%) 18 % 20 % 21 % 22 %
DPS (Rs) 1.2 1.2 1.2 1.2
Total Assets 6,281 7,743 10,214 12,837
RoIC (%) 18 % 20 % 20 % 20 %
CEPS (Rs) 14.5 18.1 22.5 27.7 Non-cash Working Capital 233 294 174 400 Core RoIC (%) 30 % 38 % 40 % 46 %
FCFPS (Rs) 10.5 10.2 17.7 12.1 Cash Conv Cycle 13.4 14.7 7.8 15.9 Div Payout (%) 12 % 9 % 8 % 6 %
BVPS (Rs) 69.3 83.0 100.6 123.8 WC Turnover 27.3 24.8 46.9 23.0
P/E 23.7 18.0 14.2 11.1
EBITDAM (%) 18 % 21 % 20 % 24 % FA Turnover 3.6 4.0 4.5 3.7 P/B 3.9 3.3 2.7 2.2
PATM (%) 13 % 15 % 17 % 20 % Net D/E -0.4 -0.4 0.0 0.0 P/FCFF 26.0 26.8 15.4 22.6
Tax Rate (%) 26 % 28 % 25 % 26 % Revenue/Capital Employed 1.3 1.3 1.1 1.0 EV/EBITDA 16.4 11.7 12.0 9.1
Sales growth (%) 6 % 15 % 12 % 12 %
Capital Employed/Equity 1.0 1.0 1.1 1.2
EV/Sales 2.9 2.4 2.4 2.2
FDEPS growth (%) 29 % 32 % 27 % 28 %
Dividend Yield (%) 0.4 % 0.4 % 0.4 % 0.4 %
Page 77
January 8, 2017 Analyst: Depesh Kashyap, CFA [email protected] (+91-7228934327) Page 1 of 17
Before reading this report, you must refer to the disclaimer on the last page.
HT Media Ltd Absolute : Trade
Relative : Benchmark
Initiating Note Regular Coverage 5% ATR in 15 months
Still time before it Shines Media & Entertainment
© 2017 Equirus. All rights reserved.
Rating Information
Price (Rs) 76
Target Price (Rs) 80
Target Date 31st Mar'18
Target Set On 6th Jan'17
Implied yrs of growth (DCF) 15
Fair Value (DCF) 132
Fair Value (DDM) 35
Ind Benchmark SPBSMSIP
Model Portfolio Position NA
Stock Information
Market Cap (Rs Mn) 17,596
Free Float (%) 30.49 %
52 Wk H/L (Rs) 96.5/68.9
Avg Daily Volume (1yr) 2,59,332
Avg Daily Value (Rs Mn) 21
Equity Cap (Rs Mn) 465
Face Value (Rs) 2
Bloomberg Code HTML IN
Ownership Recent 3M 12M
Promoters 69.5 % 0.0 % 0.0 %
DII 10.4 % 1.6 % 1.7 %
FII 7.3 % -2.8 % -6.2 %
Public 12.9 % 1.1 % 4.4 %
Price % 1M 3M 12M
Absolute 7.6 % -11.7 % -14.5 %
Vs Industry 6.4 % -4.4 % -22.1 %
DB Corp 7.0 % -3.7 % 16.7 %
Jagran 2.7 % -11.6 % 4.2 %
Consolidated Quarterly EPS forecast
Rs/Share 1Q 2Q 3Q 4Q
EPS (16A) 1.1 1.6 3.0 1.6
EPS (17E) 1.0 1.3 0.5 1.1
Hindustan Times (HT) Media Ltd is one of the leading media houses in the country
with a well-diversified portfolio and strong brands to boast of. While balance sheet
remains strong but muted growth of its English newspaper, low dividend pay-out and
heavy investments in digital, radio and certain non-core areas like education has
depressed RoE to single digits. Though investments in the digital business may have
peaked out, but weak advertisement growth and rising newsprint costs will continue
to put pressure on the margins. We initiate our coverage on HT Media with a Trade
rating with Mar’18 TP of Rs. 80.
English business continues to languish, Hindustan and Radio to drive growth:
English newspaper has been a laggard and has seen a much weaker advertising CAGR
(FY12-16) of 2% while advertising in the Hindi business has grown at CAGR (FY12-16)
of 12%. In 1HFY17, the English newspaper advertising growth has further
exacerbated and has seen a decline of ~4%, the recovery that was expected in
2HFY17 will be further delayed due to demonetisation of currency. We estimate the
English newspaper advertising to grow at CAGR (FY16-19E) of 1%. Hindi newspaper
(through subsidiary HMVL) is estimated to do much better and advertising is
estimated to grow at CAGR (FY16-19E) of 9%.
New stations to drive the Radio business going forward: Radio Fever (104 FM) has
been a leading brand in the metro cities of Delhi, Mumbai, Bangalore, Kolkata and
Chennai. The radio segment has grown at CAGR (FY12-16) of 18%, with the addition
of 10 new frequencies; the segment is estimated to grow at CAGR (FY16-19E) of 22%.
Digital losses are expected to reduce but rising newsprint costs to put pressure
on margins: The major part of digital losses that the company has seen in the past
few years are mainly due to advertising expenditure on Shine.com. Company expects
the Shine.com to breakeven by FY18E, but rising newsprint costs (80% is imported)
and weaker advertising growth will continue to put pressure on margins.
Initiate coverage with Trade rating and TP of Rs. 80: We initiate our coverage on
HT Media with Trade rating and Mar’18 PT of Rs. 80 based on SoTP valuation.
Downside risks: Slower pickup in economy and corporate earning which would
affect the advertisement growth and more than expected increase in newsprint
cost. Upside risks: Faster pickup in advertising, lower increase in newsprint cost,
improved profitability of radio and digital businesses. Buybacks/dividend
announcements can lead to re-rating of the stock.
Consolidated Financials
Rs. Mn YE Mar FY16A FY17E FY18E FY19E
Sales 25,008 24,810 27,427 29,877
EBITDA 3,079 2,386 3,673 4,030
Depreciation 1,018 1,223 1,274 1,339
Interest Expense 630 988 988 988
Other Income 1,543 1,988 1,637 1,822
Reported PAT 1,678 907 1,678 1,924
Recurring PAT 1,678 907 1,678 1,924
Total Equity 20,515 21,370 22,950 24,762
Gross Debt 10,572 10,572 10,572 10,572
Cash 7,568 9,274 11,584 14,497
Rs Per Share FY16A FY17E FY18E FY19E
Earnings 7.2 3.9 7.2 8.3
Book Value 89 93 100 107
Dividends 0.4 0.2 0.4 0.4
FCFF -17.1 6.4 10.8 12.6
P/E (x) 10.5 19.4 10.5 9.1
P/B (x) 0.8 0.8 0.8 0.7
EV/EBITDA (x) 6.8 8.1 4.6 3.5
ROE (%) 8 % 4 % 8 % 8 %
Core ROIC (%) 12 % 5 % 12 % 13 %
EBITDA Margin (%) 12 % 10 % 13 % 13 %
Net Margin (%) 7 % 4 % 6 % 6 %
Page 78
HT Media Limited Absolute – Trade Relative – Benchmark 5% ATR in 15 months
January 8, 2017 Analyst: DepeshKashyap, CFA [email protected] (+91-7228934327) Page 2 of 17
Company Snapshot
How we differ from Consensus
- Equirus Consensus % Diff Comment
EPS FY17E 3.9 6.6 -41 % In our view, Consensus numbers are not
yet updated post demonetisation FY18E 7.2 7.9 -9 %
Sales FY17E 24,810 26,327 -6 %
FY18E 27,427 28,669 -4 %
PAT FY17E 907 1,509 -40 %
FY18E 1,678 1,814 -8 %
Our Key Investment arguments:
1. English business continues to languish, Hindustan and Radio to drive growth:
English newspaper has been a laggard and has seen a much weaker advertising
CAGR (FY12-16) of 2% while advertising in the Hindi business has grown at CAGR
(FY12-16) of 12%. In 1HFY17, the English advertising growth has further
exacerbated and has seen a decline of ~4%, the recovery that was expected in
2HFY17 will be further delayed due to demonetisation of currency. We estimate
the English newspaper advertising to grow at CAGR (FY16-19E) of 1%. Hindi
newspaper (through subsidiary HMVL) is estimated to do much better and
advertising is estimated to grow at CAGR (FY16-19E) of 9%.
2. New stations to drive the Radio business going forward: Radio Fever (104 FM)
has been a leading brand in the metro cities of Delhi, Mumbai, Bangalore,
Kolkata and Chennai. The radio segment has grown at CAGR (FY12-16) of 18%,
with the addition of 10 new frequencies; the segment is estimated to grow at
CAGR (FY16-19E) of 22%.
3. Digital losses are expected to reduce but rising newsprint costs to put
pressure on margins: The major part of digital losses that the company has seen
in the past few years are mainly due to brand building expenditure on
Shine.com. Company expects the Shine.com to breakeven by FY18E, but rising
newsprint costs (80% is imported) and weaker advertising growth will continue to
put pressure on margins.
Risk to Our View:
1. Slowdown in economy
2. Newsprint prices rise more than expected
Key Triggers:
Revival in the advertisement growth
Buybacks or better dividends can improve sentiments
DCF Valuations & Assumptions
Rf Beta Ke Term. Growth Debt/IC in Term. Yr
6.8 % 0.7 11.0 % 2.0 % 10.0 %
FY17E FY18E FY19-21E FY22-26E FY27-31E
Sales Growth -1 % 11 % 9 % 5 % 5 %
NOPAT Margin 3 % 6 % 7 % 7 % 7 %
IC Turnover 1.64 1.63 2.30 1.96 1.49
RoIC 5.5 % 12.1 % 16.8 % 14.6 % 10.7 %
Years of strong growth 1 2 5 10 15
Valuation as on date (Rs) 55 102 148 120 116
Valuation as of 31st Mar'18 62 116 169 136 132
Based on DCF, we derive fair value of Rs. 132 as on 31st Mar’18.
Company Description:
Hindustan Times (HT Media) is one of the leading media houses in the country which has
built strong brands across various platforms. In the print space, it has built strong brands
in English newspaper (Hindustan times and Mint) and also in Hindi newspaper (through its
subsidiary HMVL). The Company also operates FM radio stations under the brands ’Fever’
and ‘Radio Nasha’. Their internet businesses include multiple web portals
(hindustantimes.com, livehindustan.com, livemint.com and shine.com). They have also
ventured into education space through ventures like Studymate and Bridge school of
management.
Comparable valuation Mkt Cap
Rs. Mn.
Price
Target
Target
Date
EPS P/E BPS P/B RoE Div Yield
Company Reco. CMP FY16A FY17E FY18E FY16A FY17E FY18E FY16A FY17E FY16A FY17E FY18E FY16A FY17E
HT Media TRADE 76 17,596 80 Mar'18 7.2 3.9 7.2 10.5 19.4 10.5 89.0 0.8 8 % 4 % 8 % 0.5 % 0.3 %
DB Corp. LONG 373 68,614 450 Mar'18 16.1 19.0 22.2 23.1 19.6 16.8 73.3 4.7 23 % 25 % 27 % 3.6 % 3.6 %
Jagran LONG 175 57,340 220 Mar'18 10.1 9.4 11.3 17.3 18.7 15.5 48.4 3.3 24 % 18 % 20 % 0.0 % 2.1 %
Page 79
HT Media Limited Absolute – Trade Relative – Benchmark 5% ATR in 15 months
January 8, 2017 Analyst: DepeshKashyap, CFA [email protected] (+91-7228934327) Page 3 of 17
Investment Rationale
Hindustan Times (HT Media) is one of the leading media houses in the country which has
built strong brands across various platforms. In the print space, it has built strong brands
in English newspaper (Hindustan Times and Mint) and also in Hindi newspaper (through its
subsidiary HMVL)
English business continues to languish, Hindi and Radio to drive growth: HT
media has a strongbrand portfolio across various platforms i.e. print, radio, internet and
education. In English, it has Hindustan Times which is No.1 in Delhi-NCR and No.2 in
Mumbai in terms of readership. In Hindi, through its subsidiary (HMVL), it has Hindustan
which is No.1 in Bihar and Jharkhand and No.2 in UP in terms of readership. English
newspaper has been a laggard in the past few years and is expected to grow at a slower
pace than Hindi/Vernacular newspapers.
Well aware of the lower growth expectations of the English business, Company has been
focusing on developing its radio and digital business, while the Hindi newspaper continues
to grow strongly.
Exhibit 1: Leading position amongst the top English dailies in India (2014)
Source: IRS (2014), Equirus Research
Exhibit 2: Leading position amongst the top Hindi dailies in India (2014)
Source: Company, Equirus Research
Exhibit 3: English newspaper is losing its share to the Hindi business in terms of the
consolidated print revenues
Source: Company, Equirus Research
7950
4515
1622 1195 1003 834 573 507 442 361
0
1000
2000
3000
4000
5000
6000
7000
8000
9000
Tim
es
of
India
Hin
dust
an t
imes
Hin
du
Mum
bai M
irro
r
Tele
gra
ph
Econom
ic T
imes
Mid
Day
Tri
bune
Deccan H
era
ld
Deccan C
hro
nic
le
16631
14746 13830
7905 7808
4847
2988 2736 2571 2377
0
2000
4000
6000
8000
10000
12000
14000
16000
18000
Dain
ik J
agra
n
Hin
dust
an
Dain
ik B
hask
ar
Raja
sthan P
atr
ika
Am
ar
Uja
la
Patr
ika
Pra
bhat
Khabar
Navbhara
t Tim
es
Hari
Bhoom
i
Punja
b K
esa
ri
25%
30%
35%
40%
45%
50%
55%
60%
65%
70%
FY11 FY12 FY13 FY14 FY15 FY16 FY17e FY18e FY19e
Share of English in total print revenues
Share of Hindi in total print revenues
Page 80
HT Media Limited Absolute – Trade Relative – Benchmark 5% ATR in 15 months
January 8, 2017 Analyst: DepeshKashyap, CFA [email protected] (+91-7228934327) Page 4 of 17
Circulation revenue estimated to grow at CAGR (FY16-19E) of 2% and 5% for English
and Hindi respectively: As far as circulation is concerned, HT Media does not have any
immediate expansion plans for its English daily “Hindustan Times”. Recently, it has also
discontinued the circulation of ‘HT Edge’, which will impact the volumes but shall
improve the realizations. We estimate circulation revenue of English business to grow at
a CAGR (FY16-19E) of 2% mainly driven by realizations growth.
Exhibit 4: English circulation revenue estimated to grow at CAGR (FY16-19E) of 2%
Source: Company, Equirus Research
On the other hand, HMVLhas been able to grow its circulation revenues at a CAGR (FY12-
16) of 12% driven by both increase in volumes and pricing. The Company has been trying
to expand into newer geographies inorganically or consolidate its position in the existing
ones. Till that happens, the Company has no plans to expand in other states organically.
We estimate the circulation revenues to grow at CAGR (FY16-19E) of 5% mainly driven my
increase in number of copies and nominal increase in the prices. In our view, it will be
difficult for the company to keep increasing prices due to competitive pressures.
Exhibit 5: Hindi circulation revenue estimated to grow at CAGR (FY16-19E) of 5% as
HMVL further consolidates its position in UP and Bihar
Source: Company, Equirus Research
Similar trends expected in advertising as well: Going by the historical trend, the
advertising growth in the English business is expected to be lower than Hindi/Vernacular
newspapers, but as the economy shows recovery in urban cities, the market leadership of
its English daily in Delhi and Mumbai will be the key beneficiary. The advertising revenue
for HT Media has declined by 4% in 1HFY17 due to weakness in the urban areas, with the
demonetization of currency in November, we expect the 2HFY17 to be much worse and
are factoring in 7% decline for FY17E and expect the advertising to pick up in FY18E. We
estimate the advertising revenue to grow at a CAGR (FY16-19E) of 2%.
For the Hindi newspaper, 1HFY17 has shown a growth of 4%, due to the impact of
demonetization and further higher base effect of Bihar elections in 3Q last year, we
estimate a decline of 2% in 3Q but due to upcoming state elections in UP, recent approval
of UP state government for the rollout of 7th pay commission and good monsoons,
advertising is expected to be better for Hindustan in 4QFY17 and beyond. We estimate
the advertising revenue to grow at CAGR (FY16-19E) of 9%.
200
300
400
500
600
700
800
900
1000
FY12 FY13 FY14 FY15 FY16 FY17e FY18e FY19e
English circulation rev (mn)
CAGR(FY12-16) 9%
CAGR(FY16-19e) 2%
200
700
1200
1700
2200
2700
FY12 FY13 FY14 FY15 FY16 FY17e FY18e FY19e
Hindi circulation rev (mn)
CAGR(FY12-16) 12%
CAGR(FY16-19e) 5%
Page 81
HT Media Limited Absolute – Trade Relative – Benchmark 5% ATR in 15 months
January 8, 2017 Analyst: DepeshKashyap, CFA [email protected] (+91-7228934327) Page 5 of 17
Exhibit 6: Advertising for the English newspaper estimated to grow at CAGR (FY16-
19E) of 2% with pick up expected in FY18 and FY19
Source: Company, Equirus Research
Exhibit 7: Advertising for the Hindi newspaper estimated to grow at CAGR (FY16-19E) of 9%
Source: Company, Equirus Research
New radio frequencies to drive growth: Before the phase III auctions, Radio Fever
(104 FM) was a much smaller player in the Radio segment vis-à-vis other players in the
industry. Its main focus has been on metro cities of Delhi, Mumbai, Bangalore, Kolkata
and it had also acquired a Radio company in Chennai. In the phase III auctions, the
Company has acquired 10 new frequencies, 1 each in Delhi, Mumbai and Hyderabad and 7
in major cities of UP. The Company has launched the 2 new stations in Delhi and Mumbai
under the brand of Radio Nasha, which mainly plays retro music. Having multiple
frequencies in Delhi and Mumbai will improve the advertisement volumes, though yields
in the new channels are expected to be at 60-70% of the Fever brand. In addition, the
Company has chosen to expand in UP as it is a major market for its Hindi newspaper and
the cross-media platform presence in UP will help it gain market share at accelerated
pace.
The company has grown at a CAGR (FY12-16) of 18%, now with multiple frequencies in
Delhi and Mumbai and new frequencies in UP, the Company is poised to see stronger
growth in the next few years, we estimate the sales in radio segment to grow at a CAGR
(FY16-19E) of 22%.
Exhibit 8: New frequencies to drive radio growth at a CAGR (FY16-19e) of 22%
Source: Company, Equirus Research
9000
9500
10000
10500
11000
11500
12000
12500
13000
13500
FY12 FY13 FY14 FY15 FY16 FY17e FY18e FY19e
English Ad revenues (mn)
CAGR(FY12-16) 2%
CAGR(FY16-19e) 2%
2000
3000
4000
5000
6000
7000
8000
9000
10000
FY12 FY13 FY14 FY15 FY16 FY17e FY18e FY19e
Hindi Ad revenues (mn)
CAGR(FY12-16) 12%
CAGR(FY16-19e) 9%
200
400
600
800
1000
1200
1400
1600
1800
2000
2200
FY12 FY13 FY14 FY15 FY16 FY17e FY18e FY19e
Radio revenues (mn)
CAGR(FY12-16) 18%
CAGR(FY16-19e) 22%
Page 82
HT Media Limited Absolute – Trade Relative – Benchmark 5% ATR in 15 months
January 8, 2017 Analyst: DepeshKashyap, CFA [email protected] (+91-7228934327) Page 6 of 17
Exhibit 9: Consolidated revenues estimated to grow at CAGR (16-19E) of 6%
Source: Company, Equirus Research
Rising newsprint costs to put pressure on margins
On standalone basis, the Company has seen erosion of its EBITDA margins in the last few
years with margins declining to 8% in FY16 from 18% in FY12. The rising losses in the
digital segment and the subdued growth in the advertising revenues are the primary
reasons behind this decline.
Exhibit 10: Rising losses in the digital segment have led to sharp drop in profitability
Source: Company, Equirus Research
Following are some favorable factors which may drive margin improvement:
1. Control of the Digital losses: In the Exhibit 10 above, we can see how the
losses in the digital segment have been rising over the last few years, Company
made an EBIT loss of Rs. 640mn in FY16. According to management, this was
primarily due to large amount of advertising they did for Shine.com. However,
they feel that brand building exercise for Shine.com is largely over and they
expect the losses to be halved in FY17E and further expect the business to
breakeven by FY18.
10,000
15,000
20,000
25,000
30,000
35,000
FY13 FY14 FY15 FY16 FY17e FY18e FY19e
Net Sales (Rs mn)
CAGR(FY13-16) 7%
CAGR(FY16-19) 6%
-700.0
-600.0
-500.0
-400.0
-300.0
-200.0
-100.0
0.0
FY11 FY12 FY13 FY14 FY15 FY16
Digital EBIT (mn)
Page 83
HT Media Limited Absolute – Trade Relative – Benchmark 5% ATR in 15 months
January 8, 2017 Analyst: DepeshKashyap, CFA [email protected] (+91-7228934327) Page 7 of 17
Exhibit 11: Shine.com has become a distant No.2 among job portals in terms of total
visits (mn)
Source: Similarweb, Equirus Research
2. Cost cutting initiatives at the corporate level: HT media has undertaken a cost
cutting initiative at the group level. The primary focus of this initiative is to
streamline various businesses and to rationalize the cost base of various
businesses with the main focus on the print business. The real effects of such an
initiative are difficult to quantify at the moment, but it will be a step in right
direction to improve the margins further.
3. Increasing profitability of Hindi business (subsidiary HMVL) to improve the
overall margins: HMVL has expanded its EBITDA margins from 16% in FY12 to 24%
in FY16, implying an average improvement of 200bps every year. The
management feels confident that this trend of margin expansion will continue
for next few years as well. In the mature markets of Bihar and Jharkhand, the
Company is operating at margins above 30% but in UP, the Company is operating
at margins of around 20%. Currently, the Company is able to charge 50%-60% of
the advertisement rates the market leader charges. As the Company solidifies its
position in UP and gets closer to the market leader in terms of circulation and
readership, there will be scope for further margin expansion.
Exhibit 12: HMVL has been improving its margins over the years and trend is expected to continue
Source: Company, Equirus Research
Following are some of the unfavorable factors which may put pressure on margins:
1. Increasing newsprint costs: English newspaper companies generally have higher
amount of imported newsprint (80%) in their mix while Hindi/Vernacular papers
use just 20% of the imported newsprint. Due to additional freight charges,
imported newsprint is more correlated to the prices of crude oil. With rising
prices of crude oil, the newsprint prices are also rising and this put additional
pressure on the Company’s margins.
2. Setting up of new radio stations: Radio segment is generally a high margin
business (30-35% EBITDA margins), but the newly launched stations may take 3-4
years to breakeven. The initial few years will lead to rise in employee and other
operating expenses.
3. Weaker advertising growth outlook for English business: The advertising
revenues for the English business have seen decline of 4% in 1HFY17, the
demonetization of currency is expected to delay the recovery that was expected
in the second half. Hindustan Times is the market leader in Delhi region and
No.2 in Mumbai region, as and when the economy starts improving and
advertising picks up, we expect the company to be a major beneficiary.
We estimate consolidated EBITDA to grow at a CAGR (FY16-19E) of 9% with EBITDA
margins improving to 13% in FY19 from 12% in FY16.
15.9%
17.7%
20.7% 20.3%
23.7% 23.1%
24.3%
25.5%
15.0%
17.0%
19.0%
21.0%
23.0%
25.0%
27.0%
500
1,000
1,500
2,000
2,500
3,000
3,500
FY12 FY13 FY14 FY15 FY16 FY17e FY18e FY19e
EBITDA EBITDA Margin (RHS)
0
5
10
15
20
25
30
35
40
June July August September October November
Naukri.com Shine.com Monster.com Timesjobs.com
Page 84
HT Media Limited Absolute – Trade Relative – Benchmark 5% ATR in 15 months
January 8, 2017 Analyst: DepeshKashyap, CFA [email protected] (+91-7228934327) Page 8 of 17
Exhibit 13: HT Media’s EBITDA estimated to grow at CAGR(FY16-19E) of 9%
Source: Company, Equirus Research
High cash flow generation but inefficient capital allocation is a concern
On a consolidated level, HT media generates Rs. 2,000mn of cash flow from its
operations, due to aggressive bidding by the Company in the phase III of radio auctions,
FCFF turned negative in FY16. Otherwise with minimal capital expenditure in the next
few years, we estimate free cash flow yield of 9% and 15% in FY17E and FY18E
respectively. Despite having high free cash flows, HT Media’s dividend payouts have been
very low. The Company has been making heavy investments to expand its radio and
digital portfolio, which is the main reason for its low return ratios.
Exhibit 14: Low dividend payouts despite good cash flow generation
Source: Company, Equirus Research
Exhibit 15: Return ratios shall improve with rising profitability
Source: Company, Equirus Research
14% 14%
12% 12%
10%
13% 13%
6%
7%
8%
9%
10%
11%
12%
13%
14%
15%
1,000
1,500
2,000
2,500
3,000
3,500
4,000
4,500
FY13 FY14 FY15 FY16 FY17e FY18e FY19e
EBITDA EBITDA Margin(RHS)
3.0%
3.5%
4.0%
4.5%
5.0%
5.5%
6.0%
-5,000
-4,000
-3,000
-2,000
-1,000
0
1,000
2,000
3,000
4,000
5,000
FY2013 FY2014 FY2015 FY2016 FY2017e FY2018e FY2019e
FCFF(Rs mn) Dividend payout ratio(%)(RHS)
0%
2%
4%
6%
8%
10%
12%
14%
16%
18%
FY2013 FY2014 FY2015 FY2016 FY2017e FY2018e FY2019e
Core RoIC RoE
Page 85
HT Media Limited Absolute – Trade Relative – Benchmark 5% ATR in 15 months
January 8, 2017 Analyst: DepeshKashyap, CFA [email protected] (+91-7228934327) Page 9 of 17
Valuation
HT Media currently trades at PE of 10x and EV/EBITDA of 5x on our FY18 estimates. Due
to weaker growth of English print, high losses in the digital and inefficient capital
allocation, the Company has been trading at a discount to the other print peers.
Since HMVL is a separate listed entity, we have valued the standalone and HMVL business
separately. In our view, as the radio and digital segments expand their revenues and
profitability, they may add further upside to the HT Media valuations.
We value HT Media standalone business at EV/EBITDA of 6x due to mix of weaker growth
outlook of the English print and stronger outlook for Radio business. The Hindi businessis
valued at a multiple of 7x as it has better growth prospects ahead. Since HT Media is a
holding company, we have applied a holding company discount of 30%. We derive our
target price of Rs. 80 by using SoTP valuation shown below.
Exhibit 16: We arrive at Mar’18 TP of Rs. 80
HT Media(Rsmn) EBITDA
(FY18e) Multiple
used Valuation
HTML(standalone) 1,568 6x 9406
(-)Debt
9,145
(+)Cash and investments
5,905
Equity value(1)
6,167
HMVL 2,526 7x 17,679
(-)Debt
1,810
(+)Cash and investments
11,408
Equity value
27,278
HT Media holding
74.3%
Equity value(2)
20,267
Combined equity value(1)+(2)
26,434
Holding company discount
30%
Net combined equity value
18,504
Outstanding shares
230.5
Target price(Rs)
80.0
Source: Equirus Research
Exhibit 17: HT Media has mostly traded in the P/E range of 10x-15x
Source: Company, Equirus Research
Exhibit 18: HT Media has mostly traded in the EV/EBITDA range of 5x-8x
Source: Company, Equirus Research
-30%-20%-10%0%10%20%30%40%
0
50
100
150
200
250
300
Mar
/11
Sep
/11
Mar
/12
Sep
/12
Mar
/13
Sep
/13
Mar
/14
Sep
/14
Mar
/15
Sep
/15
Mar
/16
Sep
/16
Mar
/17
Sep
/17
Mar
/18
5x
10x
15x
20x
25x
EPS Growth
-20%
-10%
0%
10%
20%
30%
0
10000
20000
30000
40000
50000
60000
70000
Mar
/11
Sep
/11
Mar
/12
Sep
/12
Mar
/13
Sep
/13
Mar
/14
Sep
/14
Mar
/15
Sep
/15
Mar
/16
Sep
/16
Mar
/17
Sep
/17
Mar
/18
5x
8x
10x
12x
15x
EBITDA Growth
Page 86
HT Media Limited Absolute – Trade Relative – Benchmark 5% ATR in 15 months
January 8, 2017 Analyst: DepeshKashyap, CFA [email protected] (+91-7228934327) Page 10 of 17
Investment Risk & Concerns
Downside risks:
1. Any economic slowdown can result in lower than expected growth in
advertising revenue: A slowdown in the economy can result in lesser than
expected media spend by the corporates, which can have a negative impact on
the advertising revenue.
2. Higher than expected increase in newsprint will have a negative impact on
the operating margins: 70-80% of the newsprint used by HT Media is imported,
with the rise in prices of crude oil, the newsprint prices are rising and it may put
pressure on the operating margins of the company.
3. Continuance of higher losses in the digital segment: Company expects
Shine.com to breakeven by FY18, but if it gets delayed due to weaker growth, it
will put additional pressure on margins.
Upside risks:
1. Any buybacks or dividend announcements may change the market sentiments
and improve RoE.
2. Advertising growth for the English newspapers revive faster than expected.
3. Newsprint costs correcting further
Corporate Governance
Following are key highlights of our preliminary assessment of level of corporate
governance in the company through its FY16 Annual Report:
Board of directors Composition: The Board Directors of the company is composed of seven Directors,
including five Non-executive Directors, four of whom are independent Directors. The
Chairperson of the board is an Executive Woman Director.
Background: Most of the board members have been with the companyfor the past several
years. All of them have relevant experience in their field.
Distribution of power: Out of 7 board committees, four are headed by independent
directors, the remaining 3 committees namely Banking and Finance committee,
Investment Committee and CSR Committee are headed by the Chairperson herself
Disclosure Norm:
As per our preliminary study, we do not find any issues on this front, company follows
disclosure norms as stipulated by the listing agreement of the exchanges and is timely in
coming up with quarterly results and other disclosures.
Annexure 1: Company Overview Hindustan Times (HT Media) is one of the leading media houses in the country which has
built strong brands across various platforms. In the print space, it has built strong brands
in English newspaper (Hindustan times and Mint) and also in Hindi newspaper (through its
subsidiary)
Exhibit 19: Strong brand portfolio provides multiple growth avenues
Source: Company, Equirus Research
The Company also operates FM radio stations under the brands ’Fever’ and ‘Radio
Nasha’. Their internet businesses include multiple web portals (hindustantimes.com,
livehindustan.com, livemint.com and shine.com). They have also ventured into
education space through ventures like Studymate and Bridge school of management.
Hindustan Times
Newspaper
Hindustan times
Mint
Brunch
Hindustan
Kadambini
Nandan
Internet
Shine.com
Hindustantimes.com
Livemint.com
Livehindustan.
com
Desimartini.
com
Digital quotient
Radio
Radio Fever
Radio Nasha
Education
Studymate
Bridge school of mgnt
Htcampus.
com
Events
HT leaders
hip summit
Mint Luxury
Page 87
HT Media Limited Absolute – Trade Relative – Benchmark 5% ATR in 15 months
January 8, 2017 Analyst: DepeshKashyap, CFA [email protected] (+91-7228934327) Page 11 of 17
Company history
September 26, 1924: Beginning of Hindustan Times with Mahatma Gandhi, inaugurating
the newspaper.
1927: Hindustan Times was reborn as Hindustan Times Ltd, a limited liability company
1936: The Hindi daily Hindustan was launched
2003: The media business was demerged and incorporated under HT Media ltd.
2004: HT Media Ltd was listed as a public company
2006: Fever 104 FM was launched, in technical collaboration with the Virgin Group.
Hindustan was re-launched
2007: Mint, the business paper in partnership with the Wall Street Journal was launched
in Delhi and Mumbai
2008: Firefly e-Ventures, an HT Media Company, launched its first portal for job seekers,
Shine.com and a social networking website Desimartini.com
2009: Hindi business is demerged to Hindustan Media Ventures Limited (HMVL)
2010: HMVL came with an IPO, aggregating Rs. 2,700mn.
2013: Shine.com was demerged from its subsidiary Firefly e-ventures and merged into
the Company.
Key Management profile
Mrs. Shobhana Bhartia –Chairperson& Editorial Director Mrs. Shobhana Bhartia is the Chairperson and Editorial Director of HT Media. She is a
graduate from Calcutta University and was also a former MP from Rajya Sabha. She is also
a recipient of the Padma Shri for her contribution in the field of journalism.
Mr. Priyavrat Bhartia –Director Mr. Priyavrat Bhartia, holds Master’s degree in Business Administration from Stanford
University (USA). He is also a director with a number of companies.
Mr. Shamit Bhartia –Jt. Managing Director Mr. Shamit Bhartia is Son of Mrs. Shobana Bhartia and brother of Priyavrat Bhartia. He
was appointed as Joint Manging Director w.e.f. May15, 2015 for a period of 5 years.
Mr. Rajiv Verma–CEO Mr. Rajiv Verma joined HT Media as CEO in 2004. He is a mechanical engineer from Delhi
College of Engineering. He has over 30 years of cross-sectoral experience with companies
like Hindustan lever, Nestle and Whirlpool. His international experience spans South East
Asia and Europe.
Mr. K N Memani –Director Mr. Memani is a qualified Chartered Accountant, holds a Bachelors degree in Commerce
from Calcutta University. He retired as the Chairman and Country Managing Partner of
Ernst & Young, India. He joined the Board in May 2004.
Mr. N K Singh –Director Mr. N K Singh is an Economist, former bureaucrat and former Member of Parliament. He
is currently the Chairman of the review committee on the Fiscal Responsibility and
Budget Management Act in the Union Ministry of Finance. He is also a senior member of
BJP.
Mr. Ajay Relan –Director Mr. Ajay Relan, is an MBA from IIM Ahmedabad (1976) and has over 25 years of corporate
and investment banking experience. MrRelan has served on the board of directors of
several Citigroup Venture Capital India portfolio companies such as Yes Bank, i-Flex and
Progeon. He is one of the pioneers of the Indian private equity industry.
Mr. Vikram Singh Mehta –Director Mr. Vikram Singh Mehta holds a B.A. (Mathematics Honors) degree from St. Stephens
College, Delhi University, BA/MA (Economics Honors) degree from Magdalen College,
Oxford University and a post graduate degree in Energy Economics from the Fletcher
School of Law and Diplomacy, Tufts University. He is also serving as an Independent
Director on the board of well-known companies.
Page 88
HT Media Limited Absolute – Trade Relative – Benchmark 5% ATR in 15 months
January 8, 2017 Analyst: DepeshKashyap, CFA [email protected] (+91-7228934327) Page 12 of 17
Standalone Quarterly Earnings Forecast and Key Drivers Rs in Mn 1Q16A 2Q16A 3Q16A 4Q16A 1Q17A 2Q17A 3Q17E 4Q17E 1Q18E 2Q18E 3Q18E 4Q18E FY16A FY17E FY18E FY19E
Revenue 3,524 3,604 4,227 3,902 3,650 3,604 3,720 3,744 3,869 3,892 4,278 4,079 15,257 14,717 16,118 17,276
Raw material consumed 933 945 1,025 911 876 908 893 844 948 934 984 901 3,813 3,521 3,767 4,069
Personnel Expenses 995 1,036 1,020 858 1,094 1,088 1,086 1,073 1,161 1,160 1,168 1,170 3,908 4,342 4,658 5,010
Operating and other expenses 1,487 1,441 1,524 1,847 1,530 1,529 1,544 1,549 1,509 1,479 1,583 1,554 6,299 6,152 6,125 6,565
- - - - - - - - - - - - - - - - -
- - - - - - - - - - - - - - - - -
EBITDA 110 182 659 285 149 79 197 278 251 319 543 454 1,236 703 1,568 1,633
Depreciation 163 165 175 191 230 240 245 246 247 247 247 247 694 960 987 996
EBIT -53 17 484 94 -80 -161 -48 31 5 73 297 207 542 -257 581 636
Interest 65 94 181 175 198 203 194 182 183 183 183 183 514 777 732 732
Other Income 172 342 166 352 289 515 200 156 292 292 292 292 1,242 1,160 1,169 1,235
PBT 54 265 469 272 11 151 -42 5 114 182 406 317 1,271 125 1,018 1,139
Tax 10 29 31 121 2 21 5 5 31 49 110 75 191 32 265 296
Recurring PAT 44 237 438 151 9 131 -47 0 83 133 296 241 1,080 92 754 843
Extraordinary 0 0 0 0 0 0 0 0 0 0 0 0 0 0 0 0
Reported PAT 44 237 438 151 9 131 -47 0 83 133 296 241 1,080 92 754 843
EPS (Rs) 0.19 1.02 1.88 1.55 0.04 0.56 -0.20 0.00 0.36 0.58 1.29 1.05 4.64 0.40 3.24 3.62
Key Drivers
English ad revenue(in Rs mn) - - - - - - - - - - - - 12,154 11,304 12,208 12,818
English circulation revenue(in Rs mn) - - - - - - - - - - - - 865 857 883 910
Revenue from digital business(Rs mn) - - - - - - - - - - - - 409 532 692 899
Revenue from radio business(Rs mn) - - - - - - - - - - - - 1,092 1,310 1,638 1,965
- - - - - - - - - - - - - - - - -
- - - - - - - - - - - - - - - - -
Sequential Growth (%)
Revenue -4 % 2 % 17 % -8 % -6 % -1 % 3 % 1 % 3 % 1 % 10 % -5 % - - - -
Raw material consumed -2 % 1 % 8 % -11 % -4 % 4 % -2 % -5 % 12 % -1 % 5 % -8 % - - - -
EBITDA 13 % 66 % 261 % -57 % -48 % -47 % 150 % 41 % -9 % 27 % 70 % -16 % - - - -
EBIT -22 % NA 2,745 % -81 % NA NA NA NA -85 % 1,404 % 309 % -30 % - - - -
Recurring PAT -75 % 433 % 85 % -66 % -94 % - NA NA NA 59 % 123 % -19 % - - - -
EPS -76 % 437 % 84 % -18 % -97 % - -137 % - - 59 % 123 % -19 % - - - -
Yearly Growth (%)
Revenue 6 % 1 % 7 % 6 % 4 % 0 % -12 % -4 % 6 % 8 % 15 % 9 % 5 % -4 % 10 % 7 %
EBITDA -58 % -51 % 25 % 195 % 36 % -57 % -70 % -3 % 68 % 304 % 176 % 64 % -2 % -43 % 123 % 4 %
EBIT -186 % -91 % 37 % -239 % 52 % NA NA -67 % NA NA NA 563 % -1 % NA NA 9 %
Recurring PAT -75 % -31 % -27 % -17 % -80 % -45 % - - 816 % 2 % - - -5 % -91 % 715 % 12 %
EPS -75 % -31 % 1 % 99 % -79 % -45 % - - 804 % 3 % - - -5 % -91 % 715 % 12 %
Margin (%)
EBITDA 3 % 5 % 16 % 7 % 4 % 2 % 5 % 7 % 7 % 8 % 13 % 11 % 8 % 5 % 10 % 9 %
EBIT -2 % 0 % 11 % 2 % -2 % -4 % -1 % 1 % 0 % 2 % 7 % 5 % 4 % -2 % 4 % 4 %
PBT 2 % 7 % 11 % 7 % 0 % 4 % -1 % 0 % 3 % 5 % 9 % 8 % 8 % 1 % 6 % 7 %
PAT 1 % 7 % 10 % 4 % 0 % 4 % -1 % 0 % 2 % 3 % 7 % 6 % 7 % 1 % 5 % 5 %
Page 89
HT Media Limited Absolute – Trade Relative – Benchmark 5% ATR in 15 months
January 8, 2017 Analyst: DepeshKashyap, CFA [email protected] (+91-7228934327) Page 13 of 17
Consolidated Financials P&L (Rs Mn) FY16A FY17E FY18E FY19E
Balance Sheet (Rs Mn) FY16A FY17E FY18E FY19E
Cash Flow (Rs Mn) FY16A FY17E FY18E FY19E
Revenue 25,008 24,810 27,427 29,877 Equity Capital 461 461 461 461 PBT 2,974 2,163 3,047 3,525
Op. Expenditure 21,929 22,424 23,754 25,846 Reserve 20,054 20,908 22,489 24,301 Depreciation 1,018 1,223 1,274 1,339
EBITDA 3,079 2,386 3,673 4,030 Networth 20,515 21,370 22,950 24,762 Others -138 -1,000 -649 -833
Depreciation 1,018 1,223 1,274 1,339 Long Term Debt 10,572 10,572 10,572 10,572 Taxes Paid -917 -606 -823 -952
EBIT 2,061 1,163 2,398 2,692 Def Tax Liability 411 411 411 411 Change in WC -1,542 -281 -301 -72
Interest Expense 630 988 988 988 Minority Interest 2,360 2,871 3,418 4,068 Operating C/F 1,395 1,500 2,549 3,007
Other Income 1,543 1,988 1,637 1,822 Account Payables 4,546 4,486 4,584 4,911 Capex -5,800 -740 -791 -817
PBT 2,974 2,163 3,047 3,525 Other Curr Liabi 4,764 4,764 4,764 4,764 Change in Invest -3,357 0 0 0
Tax 832 606 823 952 Total Liabilities & Equity 43,167 44,473 46,698 49,488 Others 1,088 1,988 1,637 1,822
PAT bef. MI & Assoc. 2,142 1,557 2,224 2,573 Net Fixed Assets 9,902 9,418 8,935 8,412 Investing C/F -8,069 1,248 846 1,005
Minority Interest 464 511 547 650 Capital WIP 326 326 326 326 Change in Debt 7,204 0 0 0
Profit from Assoc. 0 -138 0 0 Others 14,712 14,712 14,712 14,712 Change in Equity 0 0 0 0
Recurring PAT 1,678 907 1,678 1,924
Inventory 1,616 1,750 1,823 1,934 Others -718 -1,041 -1,086 -1,100
Extraordinaires 0 0 0 0 Account Receivables 3,718 3,806 4,133 4,420 Financing C/F 6,486 -1,041 -1,086 -1,100
Reported PAT 1,678 907 1,678 1,924 Other Current Assets 5,324 5,324 5,324 5,324 Net change in cash -188 1,707 2,310 2,913
FDEPS (Rs) 7.2 3.9 7.2 8.3 Cash 7,568 9,274 11,584 14,497 RoE (%) 8 % 4 % 8 % 8 %
DPS (Rs) 0.4 0.2 0.4 0.4 Total Assets 43,167 44,612 46,837 49,626
RoIC (%) 7 % 5 % 7 % 7 %
CEPS (Rs) 11.7 9.2 12.8 14.2 Non-cash Working Capital 1,350 1,631 1,932 2,004
Core RoIC (%) 12 % 5 % 12 % 13 %
FCFPS (Rs) -17.1 6.4 10.8 12.6 Cash Conv Cycle 19.7 24.0 25.7 24.5 Div Payout (%) 7 % 6 % 6 % 6 %
BVPS (Rs) 89.0 92.7 99.6 107.4 WC Turnover 18.5 15.2 14.2 14.9 P/E 10.5 10.5 10.5 10.5
EBITDAM (%) 12 % 10 % 13 % 13 % FA Turnover 2.4 2.5 3.0 3.4 P/B 0.8 0.8 0.8 0.8
PATM (%) 7 % 4 % 6 % 6 % Net D/E 0.1 0.1 0.0 -0.2 P/FCFF -4.4 -4.4 -4.4 -4.4
Tax Rate (%) 28 % 28 % 27 % 27 % Revenue/Capital Employed 1.3 1.2 1.2 1.2 EV/EBITDA 6.8 6.8 6.8 6.8
Sales Growth (%) 9 % -1 % 11 % 9 %
Capital Employed/Equity 1.4 1.4 1.4 1.3
EV/Sales 0.8 0.8 0.8 0.8
FDEPS Growth (%) -7 % -46 % 85 % 15 %
Dividend Yield (%) 0.5 % 0.3 % 0.5 % 0.5 %
TTM P/E vs. 2 yr forward EPS growth TTM EV/EBITDA vs. 2 yr forward EBITDA growth TTM P/B vs. 2 yr forward RoE
-30%-20%-10%0%10%20%30%40%
0
50
100
150
200
250
300
Mar
/11
Sep
/11
Mar
/12
Sep
/12
Mar
/13
Sep
/13
Mar
/14
Sep
/14
Mar
/15
Sep
/15
Mar
/16
Sep
/16
Mar
/17
Sep
/17
Mar
/18
5x
10x
15x
20x
25x
EPS Growth
-20%
-10%
0%
10%
20%
30%
0
10000
20000
30000
40000
50000
60000
70000
Mar
/11
Sep/
11
Mar
/12
Sep/
12
Mar
/13
Sep/
13
Mar
/14
Sep/
14
Mar
/15
Sep/
15
Mar
/16
Sep/
16
Mar
/17
Sep/
17
Mar
/18
5x
8x
10x
12x
15x
EBITDA Growth
0%5%10%15%20%25%30%35%40%
0
50
100
150
200
250
300
350
Mar
/11
Sep/
11
Mar
/12
Sep/
12
Mar
/13
Sep/
13
Mar
/14
Sep/
14
Mar
/15
Sep/
15
Mar
/16
Sep/
16
Mar
/17
Sep/
17
Mar
/18
RoE
0.5x
1x
1.5x
2x
3x
Page 90
HT Media Limited Absolute – Trade Relative – Benchmark 5% ATR in 15 months
January 8, 2017 Analyst: DepeshKashyap, CFA [email protected] (+91-7228934327) Page 14 of 17
Historical Consolidated Financials P&L (Rs Mn) FY13A FY14A FY15A FY16A
Balance Sheet (Rs Mn) FY13A FY14A FY15A FY16A
Cash Flow (Rs Mn) FY13A FY14A FY15A FY16A
Revenue 20,484 22,007 22,897 25,008 Equity Capital 470 461 461 461 PBT 2,404 3,241 2,752 2,974
Op. Expenditure 17,658 18,882 20,212 21,929 Reserve 15,490 16,992 18,563 20,054 Depreciation 914 858 1,003 1,018
EBITDA 2,826 3,125 2,685 3,079 Networth 15,960 17,453 19,024 20,515 Others -141 -613 -587 -138
Depreciation 914 858 1,003 1,018 Long Term Debt 3,826 4,168 3,441 10,572 Taxes Paid -810 -561 -612 -917
EBIT 1,911 2,267 1,683 2,061 Def Tax Liability 575 742 447 411 Change in WC 77 -220 1,535 -1,542
Interest Expense 446 649 467 630 Minority Interest 1,438 1,590 1,923 2,360 Operating C/F 2,444 2,705 4,091 1,395
Other Income 938 1,623 1,537 1,543 Account Payables 3,323 3,937 4,844 4,546 Capex -1,316 -1,517 -910 -5,800
PBT 2,404 3,241 2,752 2,974 Other Curr Liabi 3,321 3,746 4,242 4,764 Change in Invest -1,578 -2,411 -1,480 -3,357
Tax 623 917 574 832 Total Liabilities & Equity 28,443 31,636 33,920 43,167 Others 354 910 597 1,088
PAT bef. MI & Assoc. 1,780 2,324 2,179 2,142 Net Fixed Assets 7,344 7,538 7,042 9,902 Investing C/F -2,535 -3,018 -1,792 -8,069
Minority Interest 104 248 380 464 Capital WIP 1,118 309 380 326 Change in Debt 594 731 -727 7,204
Profit from Assoc. 0 0 0 0 Others 5,057 6,237 14,389 14,712 Change in Equity 0 0 9 0
Recurring PAT 1,677 1,677 1,677 1,677 Inventory 1,631 2,257 1,527 1,616 Others -554 -743 -852 -718
Extraordinaires 0 0 0 0 Account Receivables 2,712 2,867 3,120 3,718 Financing C/F 40 -12 -1,570 6,486
Reported PAT 1,677 1,677 1,677 1,677 Other Current Assets 2,808 3,069 3,471 5,324 Net change in cash -52 -325 729 -188
EPS (Rs) 7.1 8.9 7.7 7.2 Cash 7,773 9,359 3,991 7,568
RoE (%) 11 % 12 % 10 % 8 %
DPS (Rs) 0.4 0.4 0.4 0.4
Total Assets 28,443 31,636 33,920 43,167
RoIC (%) 10 % 11 % 9 % 7 %
CEPS (Rs) 11.0 12.7 12.2 11.7 Non-cash Working Capital 507 510 -967 1,350 Core RoIC (%) 14 % 16 % 14 % 12 %
FCFPS (Rs) 6.2 7.2 15.4 -17.1 Cash Conv Cycle 9.0 8.5 -15.4 19.7 Div Payout (%) 7 % 5 % 6 % 7 %
BVPS (Rs) 67.9 75.7 82.5 89.0 WC Turnover 40.4 43.2 -23.7 18.5
P/E 1,870.3 13.1 9.8 10.7
EBITDAM (%) 14 % 14 % 12 % 12 % FA Turnover 2.4 2.8 3.1 2.4 P/B 2.1 1.8 1.4 1.2
PATM (%) 8 % 9 % 8 % 7 % Net D/E -0.2 -0.3 0.0 0.1 P/FCFF 12.2 12.2 12.2 12.2
Tax Rate (%) 26 % 28 % 21 % 28 % Revenue/Capital Employed 1.8 1.7 1.5 1.3 EV/EBITDA 30.4 8.1 4.3 5.6
Sales growth (%) 2 % 7 % 4 % 9 %
Capital Employed/Equity 1.4 1.4 1.4 1.4
EV/Sales 4.2 4.2 4.2 4.2
FDEPS growth (%) 1 % 24 % -13 % -7 %
Dividend Yield (%) 0.5 % 0.5 % 0.5 % 0.5 %
Page 91
HT Media Limited Absolute – Trade Relative – Benchmark 5% ATR in 15 months
January 8, 2017 Analyst: DepeshKashyap, CFA [email protected] (+91-7228934327) Page 15 of 17
Equirus Securities
Research Analysts Sector/Industry Email
Equity Sales E-mail
Abhishek Shindadkar IT Services [email protected] 91-22-43320643 Vishad Turakhia [email protected] 91-22-43320633
Anirvan Sarkar Banking & Financial Services [email protected] 91-79-61909526 Subham Sinha [email protected] 91-22-43320631
Ashutosh Tiwari Auto, Metals & Mining [email protected] 91-79-61909517 Sweta Sheth [email protected] 91-22-43320634
Depesh Kashyap Mid-Caps [email protected] 91-79-61909528 Viral Desai [email protected] 91-22-43320635
Devam Modi Power & Infrastructure [email protected] 91-79-61909516 Dealing Room E-mail
Dhaval Dama FMCG, Mid-Caps [email protected] 91-79-61909518 Ashish Shah [email protected] 91-79-61909504
Maulik Patel Oil and Gas [email protected] 91-79-61909519 Ilesh Savla [email protected] 91-79-61909505
Nimish Mehta Pharma [email protected] 91-79-61909550 Manoj Kejriwal [email protected] 91-79-61909508
Rohan Mandora Banking & Financial Services [email protected] 91-79-61909529 Sandip Amrutiya [email protected] 91-79-61909503
Associates E-mail Compliance Officer E-mail
Ankit Choudhary [email protected] 91-79-61909533 Jay Soni [email protected] 91-79-61909561
Harshit Patel [email protected] 91-79-61909522
Manoj Gori [email protected] 91-79-61909523
Meet Chande [email protected] 91-79-61909513
Parva Soni [email protected] 91-79-61909541
Pranav Mehta [email protected] 91-79-61909514
Raj Kantawala [email protected] 91-79-61909532
Saylee Warade [email protected] 91-79-61909527
Vikas Jain [email protected] 91-79-61909531
Rating & Coverage Definitions: Absolute Rating • LONG : Over the investment horizon, ATR >= Ke for companies with Free Float market cap >Rs 5 billion and ATR >= 20% for rest of the companies • SHORT: ATR <= negative 5% over investment horizon • TRADE: Stocks that do not meet the criteria for either LONG or SHORT Relative Rating • OVERWEIGHT: Likely to outperform the benchmark by at least 5% over investment horizon • BENCHMARK: likely to perform in line with the benchmark • UNDERWEIGHT: likely to under-perform the benchmark by at least 5% over investment horizon Target Price and Investment Horizon Target Price is a point value for stocks with Absolute rating of LONG or SHORT and a range value for stocks rated TRADE. Investment Horizon is set at a minimum 3 months to maximum 15 months with target date falling on last day of a calendar quarter. Lite vs. Regular Coverage vs. Spot Coverage We aim to keep our rating and estimates updated at least once a quarter for Regular Coverage stocks. Generally, we would have access to the company and we would maintain detailed financial model for Regular coverage companies. We intend to publish updates on Lite coverage stocks only an opportunistic basis and subject to our ability to contact the management. Our rating and estimates for Lite coverage stocks may not be current. Spot coverage is meant for one-off coverage of a specific company and in such cases, earnings forecast and target price are optional. Spot coverage is meant to stimulate discussion rather than provide a research opinion.
Registered Office:
Equirus Securities Private Limited
Unit No. 1201, 12th Floor, C Wing, Marathon Futurex,
N M Joshi Marg, Lower Parel,
Mumbai-400013.
Tel. No: +91 – (0)22 – 4332 0600
Fax No: +91- (0)22 – 4332 0601
Corporate Office:
3rd floor, House No. 9,
Magnet Corporate Park, Near Zydus Hospital, B/H Intas Sola Bridge,
S.G. Highway Ahmedabad-380054 Gujarat
Tel. No: +91 (0)79 - 6190 9550
Fax No: +91 (0)79 – 6190 9560
Page 92
HT Media Limited Absolute – Trade Relative – Benchmark 5% ATR in 15 months
January 8, 2017 Analyst: DepeshKashyap, CFA [email protected] (+91-7228934327) Page 16 of 17
© 2017 Equirus Securities Private Limited. All rights reserved. For Private Circulation only. This report or any portion hereof may not
be reprinted, sold or redistributed without the written consent of Equirus Securities Private Limited
Analyst Certification
I, Depesh Kashyap, author to this report, hereby certify that all of the views expressed in this report accurately reflect my personal views about the subject company or companies and its or their securities. I also
certify that no part of my compensation was, is or will be, directly or indirectly, related to the specific recommendations or views expressed in this report.
Disclaimers
Equirus Securities Private Limited (ESPL) having Corporate Identification Number U65993MH2007PTC176044 is registered in India with Securities and Exchange Board of India (SEBI) as a trading member on the
Capital Market (Reg. No. INB231301731), Futures & Options Segment (Reg. No.INF231301731) of the National Stock Exchange of India Ltd. (NSE) and on Cash Segment (Reg. No.INB011301737) of Bombay Stock
Exchange Limited (BSE).ESPL is also registered with SEBI as Research Analyst under SEBI (Research Analyst) Regulations, 2014 (Reg. No. INH000001154). There are no disciplinary actions that have been taken by
any regulatory authority. ESPL is a subsidiary of Equirus Capital Pvt. Ltd. (ECPL) which is registered with SEBI as Category I Merchant Banker. ESPL/its affiliates provide investment banking services including but
not limited to Private Equity, Mergers & Acquisitions, Structured Finance and Institutional Equities.
ESPL/its affiliates might have, managed or co-managed public offering of securities of the subject company or have received a mandate from the subject company or might have received compensation from the
subject company for investment banking or brokerage services in the past twelve months. ESPL & its affiliates, their directors and employees may from time to time have positions or options in the company and
buy or sell the securities of the company (ies) mentioned herein. ESPL or its Analyst did not receive any compensation or other benefits from the companies mentioned in the report or third party in connection
with preparation of the research report. Accordingly, neither ESPL nor Research Analysts have any material conflict of interest at the time of publication of this report. Compensation of our Research Analysts is
not based on any specific merchant banking, investment banking or brokerage service transactions. ESPL has not been engaged in market making activity for the subject company. Research Analyst might have
served as an employee of the subject company in the past.
This document is not directed or intended for distribution to, or use by, any person or entity who is a citizen or resident of or located in any locality, state, country or other jurisdiction, where such distribution,
publication, availability or use would be contrary to law, regulation or which would subject ESPL and affiliates to any registration or licensing requirement within such jurisdiction. The securities described herein
may or may not be eligible for sale in all jurisdictions or to a certain category of investors. Persons in whose possession this document may come are required to inform themselves of, and to observe, such
applicable restrictions. Please delete this document if you are not authorized to view the same. By reading this document you represent and warrant that you have full authority and all rights necessary to view
and read this document.
This document has been prepared solely for information purpose and does not constitute a solicitation to any person to buy, sell or subscribe a security. ESPL is not soliciting any action based on this report. The
information and opinions contained herein is from publicly available data or based on information obtained in good faith from sources believed to be reliable but ESPL provides no guarantee as to its accuracy or
completeness. The information contained herein stand on date, which are subject to change or modification. Any such changes could impact our interpretation of relevant information contained herein. While we
would endeavour to update the information herein on reasonable basis. ESPL, its affiliates, their directors and employees are under no obligation to update or keep the information current. Also there may be
regulatory, compliance, or other reasons that may prevent ESPL and its group companies from doing so. This document is prepared for assistance only and is not intended to be and must not alone be taken as the
basis for an investment decision. Each recipient of this document should make such investigations as it deems necessary to arrive at an independent evaluation of an investment in the securities of companies
referred to in this document including the merits and risks involved. This document is intended for general circulation and does not take into account the specific investment objectives, financial situation or
particular needs of any particular person. ESPL and its group companies, employees, directors and agents accept no liability, and disclaim all responsibility, for the consequences of you or anyone else acting, or
refraining to act, in reliance on the information contained in this publication or for any decision based on it. ESPL/its affiliates do and seek to do business with companies covered in its research report. Thus,
investors should be aware that the firm may have conflict of interest.
Additional Disclaimer for U.S. Persons
ESPL/its affiliates are not a registered broker – dealer under the U.S. Securities Exchange Act of 1934, as amended (the“1934 act”) and under applicable state laws in the United States. In addition Equirus is not a
registered investment adviser under the U.S. Investment Advisers Act of 1940, as amended (the "Advisers Act" and together with the 1934 Act, the "Acts), and under applicable state laws in the United States.
Accordingly, in the absence of specific exemption under the Acts, any brokerage and investment services provided by Equirus, including the products and services described herein are not available to or intended
for U.S. persons. The information contained in this Report is not intended for any person who is a resident of the United States of America or a resident of any jurisdiction, the laws of which imposes prohibition on
soliciting the securities business in that jurisdiction without going through the registration requirements and/or prohibit the use of any information contained in this website. This Report and its respective contents
does not constitute an offer or invitation to purchase or subscribe for any securities or solicitation of any investments or investment services and/or shall not be considered as an advertisement tool. "U.S. Persons"
are generally defined as a natural person, residing in the United States or any entity organized or incorporated under the laws of the United States. US Citizens living abroad may also be deemed "US Persons" under
certain rules.
Page 93
HT Media Limited Absolute – Trade Relative – Benchmark 5% ATR in 15 months
January 8, 2017 Analyst: DepeshKashyap, CFA [email protected] (+91-7228934327) Page 17 of 17
Disclosures
Disclosure of Interest statement for the subject Company Yes/No If Yes, nature of such interest
Analyst/ESPL/Associate/Relatives’ financial interest No
Analyst/ESPL/Associate/Relatives’ actual/beneficial ownership of 1% or more No
Analyst/ESPL/Associate/Relatives’ material conflict of interest No
Whether ECPL managed any public offering in past 12 months No
* Associate means individual who assist Analyst