Group Results 1 Group Results 1 Shareholder Summary 1 Key Performance Indicators 1 Net Interest Income 2 Net Interest Margin 2 Other Operating Income 2 Operating Expenses 2 Full Time Equivalent Employees 2 Investment Spend 2 Taxation 2 Lending 3 Goodwill and Other Intangible Assets 3 Customer Deposits 3 Bad and Doubtful Debt Charge 3 Provisions for Bad and Doubtful Debts 4 90+ Days Past Due and Gross Impaired Assets 4 Divisional Results 5 Australian Banking 5 Corporate Functions and Other 7 Consolidated Financial Report 8 Income Statement 8 Notes to the Consolidated Income Statement 9 Supplementary Information 13 1. Net Interest Margins and Spreads 13 2. Loans and Advances 13 3. Average Balance Sheet and Related Interest 14 4. Earnings Per Share 17 Key Performance Measures 18 Prior Period Restatement 2015
Transcript
Group Results 1Group Results 1Shareholder Summary 1Key Performance Indicators 1Net Interest Income 2Net Interest Margin 2Other Operating Income 2Operating Expenses 2Full Time Equivalent Employees 2Investment Spend 2Taxation 2Lending 3Goodwill and Other Intangible Assets 3Customer Deposits 3Bad and Doubtful Debt Charge 3Provisions for Bad and Doubtful Debts 490+ Days Past Due and Gross Impaired Assets 4
Divisional Results 5Australian Banking 5Corporate Functions and Other 7
Consolidated Financial Report 8Income Statement 8Notes to the Consolidated Income Statement 9
Supplementary Information 131. Net Interest Margins and Spreads 132. Loans and Advances 133. Average Balance Sheet and Related Interest 144. Earnings Per Share 17
Key Performance Measures 18
Prior Period Restatement
2015
Group Results
Group Results
Group ResultsYear to Half Year to
Sep 15 Sep 15 Mar 15 Sept 15 v$m $m $m Mar 15 %
Net interest income 12,498 6,288 6,210 1.3Other operating income 4,866 2,464 2,402 2.6IoRE 19 (5) 24 largeNet operating income 17,383 8,747 8,636 1.3Operating expenses (7,433) (3,757) (3,676) (2.2)Underlying profit 9,950 4,990 4,960 0.6Charge to provide for bad and doubtful debts (748) (349) (399) 12.5Cash earnings before tax and distributions 9,202 4,641 4,561 1.8Income tax expense (2,657) (1,312) (1,345) 2.5Cash earnings before distributions 6,545 3,329 3,216 3.5Distributions (175) (66) (109) 39.4Cash earnings 6,370 3,263 3,107 5.0Non-cash earnings items (after tax):
Net profit from continuing operations 6,984 3,753 3,231 16.2Net profit/ (loss) after tax from discontinued operations (646) (855) 209 largeNet profit attributable to owners of NAB 6,338 2,898 3,440 (15.8)
Dividend per share (cents) 198 99 99 -Dividend payout ratio 77.6% 77.9% 77.5% (43 bps)Statutory earnings per share from continuing operations (cents) - basic 279.2 147.2 131.5 11.9Statutory earnings per share from continuing operations (cents) - diluted 270.5 141.9 129.4 9.7Cash earnings per share (cents) - basic 255.0 127.1 127.8 (0.5)Cash earnings per share (cents) - diluted 247.7 123.1 125.9 (2.2)Statutory return on equity 14.9% 12.9% 17.7% (480 bps)Cash return on equity (ROE) 14.8% 14.3% 15.8% (150 bps)
Key Performance IndicatorsYear to Half Year to
Sept 15 vSep 15 Sep 15 Mar 15 Mar 15 %
Cash earnings on average assets 0.73% 0.74% 0.73% 1 bpCash earnings on average risk-weighted assets (1) 1.91% 1.89% 1.91% (2 bps)Cash earnings on average FTE ($000) 184 187 181 3.3Banking cost to income ratio 41.2% 41.5% 41.0% (50 bps)Net tangible assets (NTA) per share ($) 14.53 14.53 13.29 9.3(1) Risk-weighted assets have been calculated excluding CYBG and GWB, both discontinued operations.
Australian Banking 190,391 181,832 4.7NZ Banking 32,787 34,072 (3.8)NAB Wealth 36 60 (40.0)Corporate Functions and Other 1,059 2,132 (50.3)
Total non-housing 224,273 218,096 2.8Gross loans and advances including acceptances 521,881 509,457 2.4
Goodwill and Other Intangible Assets
Movement in Capitalised SoftwareHalf Year ended
Sep 15 Mar 15$m $m
Balance at beginning of period 1,859 1,730Additions 304 243Disposals and write-offs (10) (23)Amortisation (109) (100)Foreign currency translation adjustments (12) 9Capitalised software 2,032 1,859
Customer DepositsAs at
30 Sep 15 31 Mar 15 Sep 15 v$m $m Mar 15 %
Australian Banking 320,410 314,577 1.9NZ Banking 41,619 43,817 (5.0)Corporate Functions and Other 2 9 (77.8)Total customer deposits 362,031 358,403 1.0
Bad and Doubtful Debt ChargeYear to Half Year to
Sep 15 Sep 15 Mar 15$m $m $m
Specific charge to provide for bad and doubtful debts 609 268 341Collective (write-back)/charge to provide for bad and doubtful debts 139 81 58Total charge to provide for bad and doubtful debts 748 349 399
Year to Half Year toSep 15 Sep 15 Mar 15
Bad and doubtful debts charge to gross loans and acceptances (annualised) 0.14% 0.13% 0.16%Net write-offs to gross loans and acceptances (annualised) 0.20% 0.20% 0.20%
Prior Period Restatement
2015
3
Group Results
Provisions for Bad and Doubtful DebtsAs at
30 Sep 15 31 Mar 15$m $m
Collective provision for bad and doubtful debts 3,054 2,910Specific provision for bad and doubtful debts 448 700Total provision for bad and doubtful debts 3,502 3,610
As at30 Sep 15 31 Mar 15
Total provision to gross loans and acceptances 0.67% 0.71%Total provisions to net write-offs (1) 341% 352%Specific provision to gross impaired assets 30.3% 35.8%Collective provision to credit risk-weighted assets (2) 0.99% 0.97%Collective provision to gross loans and acceptances (excluding impaired assets) 0.59% 0.57%(1) March 2015 metrics refer to the half year ratio annualised; September 2015 metrics refers to the full year ratio.(2) Credit risk-weighted assets have been calculated excluding CYBG and GWB, both discontinued operations.
90+ Days Past Due and Gross Impaired Assets
As at30 Sep 15 31 Mar 15
90+ days past due loans ($m) 1,813 1,945Gross impaired assets ($m) 1,481 1,95590+ days past due and gross impaired assets ($m) 3,294 3,900
As at30 Sep 15 31 Mar 15
90+ days past due loans to gross loans and acceptances 0.35% 0.38%Gross impaired assets to gross loans and acceptances 0.28% 0.39%90+ days past due and gross impaired assets to gross loans and acceptances 0.63% 0.77%
Prior Period Restatement
2015
4
Divisional Results
Divisional Results
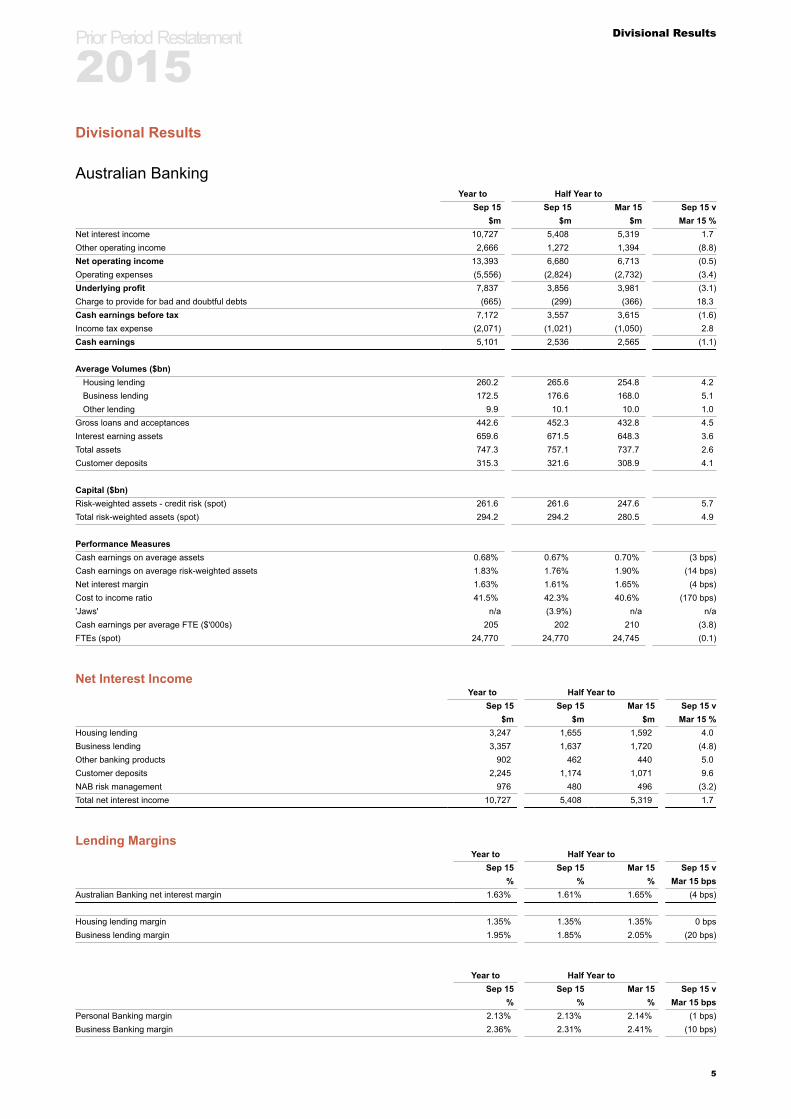
Australian BankingYear to Half Year to
Sep 15 Sep 15 Mar 15 Sep 15 v$m $m $m Mar 15 %
Net interest income 10,727 5,408 5,319 1.7Other operating income 2,666 1,272 1,394 (8.8)Net operating income 13,393 6,680 6,713 (0.5)Operating expenses (5,556) (2,824) (2,732) (3.4)Underlying profit 7,837 3,856 3,981 (3.1)Charge to provide for bad and doubtful debts (665) (299) (366) 18.3Cash earnings before tax 7,172 3,557 3,615 (1.6)Income tax expense (2,071) (1,021) (1,050) 2.8Cash earnings 5,101 2,536 2,565 (1.1)
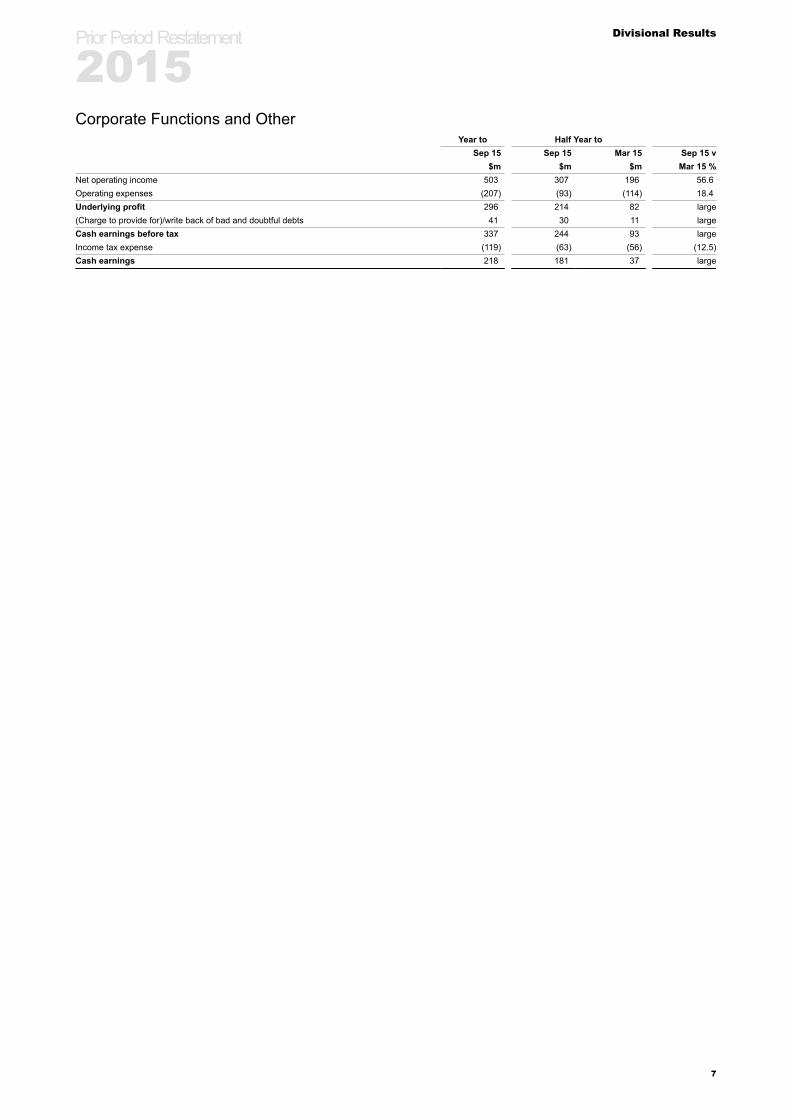
Net operating income 503 307 196 56.6Operating expenses (207) (93) (114) 18.4Underlying profit 296 214 82 large(Charge to provide for)/write back of bad and doubtful debts 41 30 11 largeCash earnings before tax 337 244 93 largeIncome tax expense (119) (63) (56) (12.5)Cash earnings 218 181 37 large
Prior Period Restatement
2015
7
Consolidated Financial Report
Consolidated Financial Report
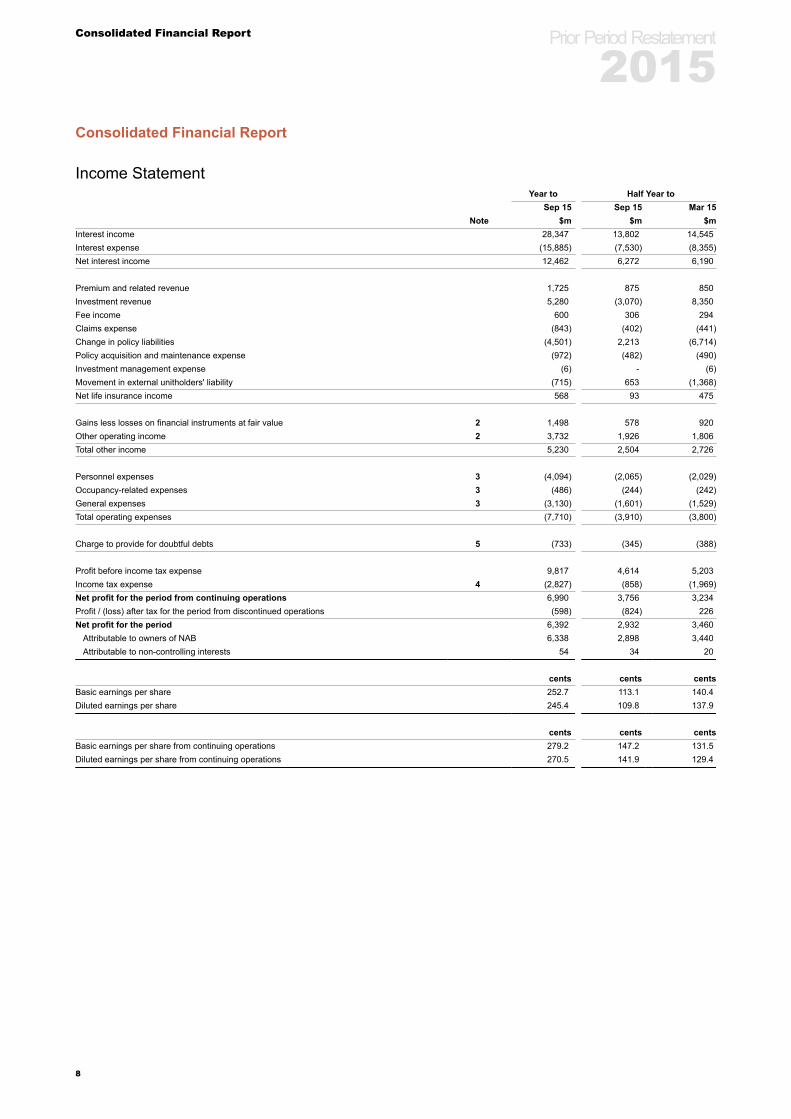
Income StatementYear to Half Year to
Sep 15 Sep 15 Mar 15Note $m $m $m
Interest income 28,347 13,802 14,545Interest expense (15,885) (7,530) (8,355)Net interest income 12,462 6,272 6,190
Premium and related revenue 1,725 875 850Investment revenue 5,280 (3,070) 8,350Fee income 600 306 294Claims expense (843) (402) (441)Change in policy liabilities (4,501) 2,213 (6,714)Policy acquisition and maintenance expense (972) (482) (490)Investment management expense (6) - (6)Movement in external unitholders' liability (715) 653 (1,368)Net life insurance income 568 93 475
Gains less losses on financial instruments at fair value 2 1,498 578 920Other operating income 2 3,732 1,926 1,806Total other income 5,230 2,504 2,726
Charge to provide for doubtful debts 5 (733) (345) (388)
Profit before income tax expense 9,817 4,614 5,203Income tax expense 4 (2,827) (858) (1,969)Net profit for the period from continuing operations 6,990 3,756 3,234Profit / (loss) after tax for the period from discontinued operations (598) (824) 226Net profit for the period 6,392 2,932 3,460
Attributable to owners of NAB 6,338 2,898 3,440Attributable to non-controlling interests 54 34 20
cents cents centsBasic earnings per share 252.7 113.1 140.4Diluted earnings per share 245.4 109.8 137.9
cents cents centsBasic earnings per share from continuing operations 279.2 147.2 131.5Diluted earnings per share from continuing operations 270.5 141.9 129.4
Prior Period Restatement
2015
8
Consolidated Financial Report
Notes to the Consolidated Income Statement
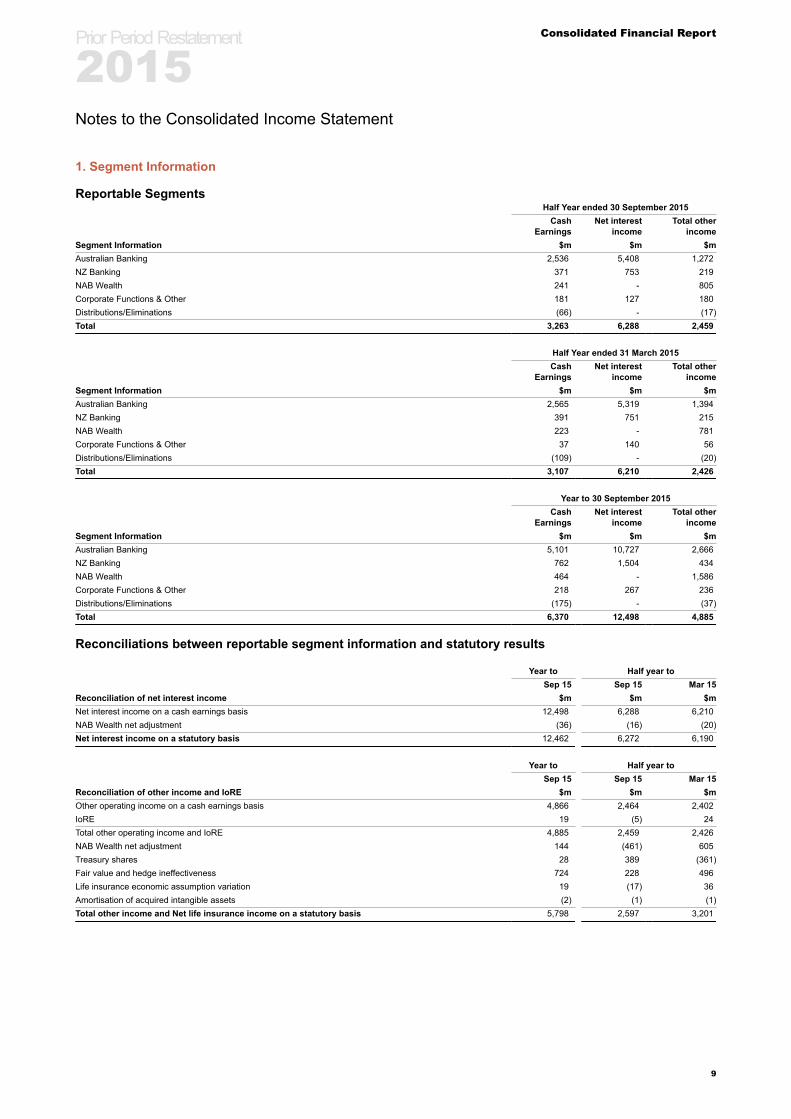
1. Segment Information
Reportable SegmentsHalf Year ended 30 September 2015
Reconciliations between reportable segment information and statutory results
Year to Half year toSep 15 Sep 15 Mar 15
Reconciliation of net interest income $m $m $mNet interest income on a cash earnings basis 12,498 6,288 6,210NAB Wealth net adjustment (36) (16) (20)Net interest income on a statutory basis 12,462 6,272 6,190
Year to Half year toSep 15 Sep 15 Mar 15
Reconciliation of other income and IoRE $m $m $mOther operating income on a cash earnings basis 4,866 2,464 2,402IoRE 19 (5) 24Total other operating income and IoRE 4,885 2,459 2,426NAB Wealth net adjustment 144 (461) 605Treasury shares 28 389 (361)Fair value and hedge ineffectiveness 724 228 496Life insurance economic assumption variation 19 (17) 36Amortisation of acquired intangible assets (2) (1) (1)Total other income and Net life insurance income on a statutory basis 5,798 2,597 3,201
Prior Period Restatement
2015
9
Consolidated Financial Report
2. Other IncomeYear to Half Year to
Sep 15 Sep 15 Mar 15$m $m $m
Gains less losses on financial instruments at fair valueTrading securities 1,219 (285) 1,504Trading derivatives:
Trading and risk management purposes (554) 677 (1,231)Assets, liabilities and derivatives designated in hedge relationships 611 228 383Assets and liabilities designated at fair value 360 29 331Other (138) (71) (67)Total gains less losses on financial instruments at fair value 1,498 578 920
Other operating incomeDividend revenue 26 18 8Gains from sale of investments, loans, property, plant and equipment and other assets 168 29 139Banking fees 868 444 424Money transfer fees 589 297 292Fees and commissions 1,586 830 756Investment management fees 260 139 121Fleet management fees 32 16 16Other income 203 153 50Total other operating income 3,732 1,926 1,806Total other income 5,230 2,504 2,726
3. Operating ExpensesYear to Half Year to
Sep 15 Sep 15 Mar 15$m $m $m
Personnel expensesSalaries and related on-costs 3,160 1,583 1,577Superannuation costs - defined contribution plans 263 134 129Superannuation costs - defined benefit plans (1) (3) 2Performance-based compensation:
Total occupancy-related expenses 486 244 242General expenses
Fees and commission expense 272 132 140Depreciation and amortisation of property, plant and equipment 271 146 125Amortisation of intangible assets 308 162 146Depreciation on leased vehicle assets 5 2 3Operating lease rental expense 28 12 16Advertising and marketing 172 86 86Charge to provide for operational risk event losses 84 52 32Communications, postage and stationery 264 120 144Computer equipment and software 627 315 312Data communication and processing charges 86 48 38Transport expenses 69 35 34Professional fees 487 245 242Travel 79 45 34Loss on disposal of property, plant and equipment and other assets 8 2 6Impairment losses recognised 59 56 3Other expenses 311 143 168
Total general expenses 3,130 1,601 1,529Total operating expenses 7,710 3,910 3,800
Prior Period Restatement
2015
10
Consolidated Financial Report
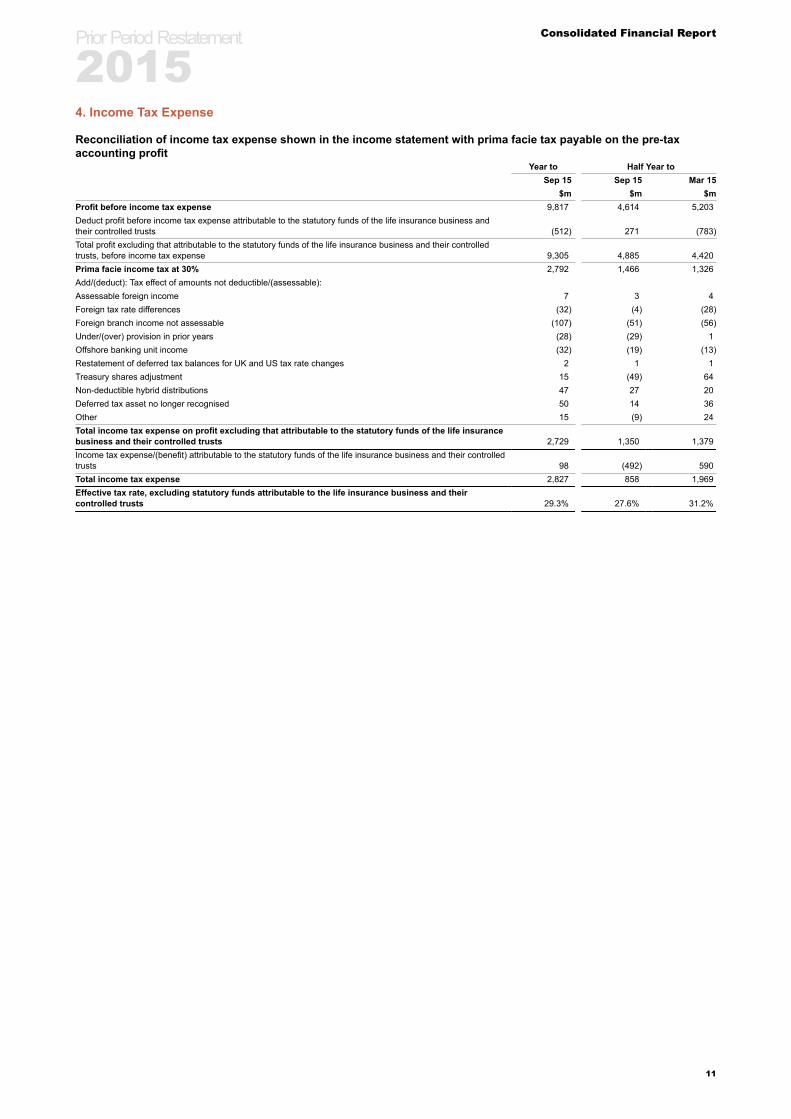
4. Income Tax Expense
Reconciliation of income tax expense shown in the income statement with prima facie tax payable on the pre-taxaccounting profit
Year to Half Year toSep 15 Sep 15 Mar 15
$m $m $mProfit before income tax expense 9,817 4,614 5,203Deduct profit before income tax expense attributable to the statutory funds of the life insurance business andtheir controlled trusts (512) 271 (783)Total profit excluding that attributable to the statutory funds of the life insurance business and their controlledtrusts, before income tax expense 9,305 4,885 4,420Prima facie income tax at 30% 2,792 1,466 1,326Add/(deduct): Tax effect of amounts not deductible/(assessable):Assessable foreign income 7 3 4Foreign tax rate differences (32) (4) (28)Foreign branch income not assessable (107) (51) (56)Under/(over) provision in prior years (28) (29) 1Offshore banking unit income (32) (19) (13)Restatement of deferred tax balances for UK and US tax rate changes 2 1 1Treasury shares adjustment 15 (49) 64Non-deductible hybrid distributions 47 27 20Deferred tax asset no longer recognised 50 14 36Other 15 (9) 24Total income tax expense on profit excluding that attributable to the statutory funds of the life insurancebusiness and their controlled trusts 2,729 1,350 1,379Income tax expense/(benefit) attributable to the statutory funds of the life insurance business and their controlledtrusts 98 (492) 590Total income tax expense 2,827 858 1,969Effective tax rate, excluding statutory funds attributable to the life insurance business and theircontrolled trusts 29.3% 27.6% 31.2%
Prior Period Restatement
2015
11
Consolidated Financial Report
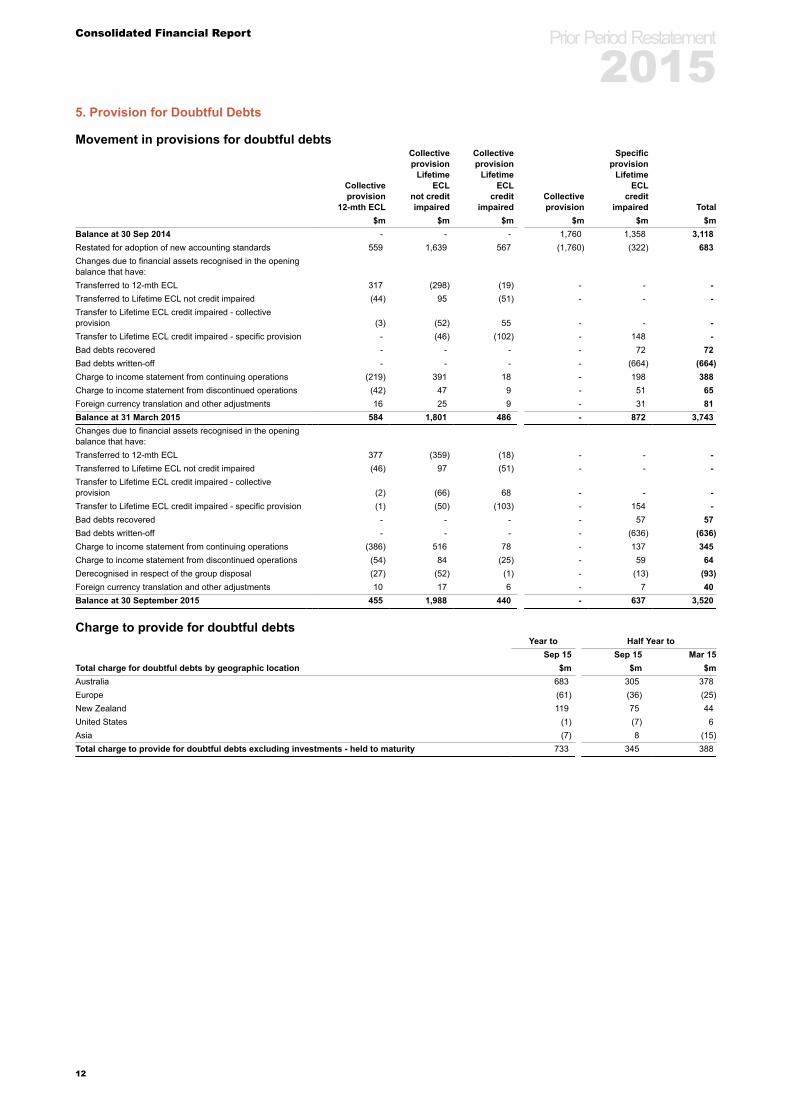
5. Provision for Doubtful Debts
Movement in provisions for doubtful debts
Collectiveprovision
12-mth ECL
Collectiveprovision
LifetimeECL
not creditimpaired
Collectiveprovision
LifetimeECL
creditimpaired
Collectiveprovision
Specificprovision
LifetimeECL
creditimpaired Total
$m $m $m $m $m $mBalance at 30 Sep 2014 - - - 1,760 1,358 3,118Restated for adoption of new accounting standards 559 1,639 567 (1,760) (322) 683Changes due to financial assets recognised in the openingbalance that have:Transferred to 12-mth ECL 317 (298) (19) - - -Transferred to Lifetime ECL not credit impaired (44) 95 (51) - - -Transfer to Lifetime ECL credit impaired - collectiveprovision (3) (52) 55 - - -Transfer to Lifetime ECL credit impaired - specific provision - (46) (102) - 148 -Bad debts recovered - - - - 72 72Bad debts written-off - - - - (664) (664)Charge to income statement from continuing operations (219) 391 18 - 198 388Charge to income statement from discontinued operations (42) 47 9 - 51 65Foreign currency translation and other adjustments 16 25 9 - 31 81Balance at 31 March 2015 584 1,801 486 - 872 3,743Changes due to financial assets recognised in the openingbalance that have:Transferred to 12-mth ECL 377 (359) (18) - - -Transferred to Lifetime ECL not credit impaired (46) 97 (51) - - -Transfer to Lifetime ECL credit impaired - collectiveprovision (2) (66) 68 - - -Transfer to Lifetime ECL credit impaired - specific provision (1) (50) (103) - 154 -Bad debts recovered - - - - 57 57Bad debts written-off - - - - (636) (636)Charge to income statement from continuing operations (386) 516 78 - 137 345Charge to income statement from discontinued operations (54) 84 (25) - 59 64Derecognised in respect of the group disposal (27) (52) (1) - (13) (93)Foreign currency translation and other adjustments 10 17 6 - 7 40Balance at 30 September 2015 455 1,988 440 - 637 3,520
Charge to provide for doubtful debtsYear to Half Year to
Sep 15 Sep 15 Mar 15Total charge for doubtful debts by geographic location $m $m $mAustralia 683 305 378Europe (61) (36) (25)New Zealand 119 75 44United States (1) (7) 6Asia (7) 8 (15)Total charge to provide for doubtful debts excluding investments - held to maturity 733 345 388
Prior Period Restatement
2015
12
Supplementary Information
Supplementary Information
1. Net Interest Margins and SpreadsYear to Half Year to
Sep 15 Sep 15 Mar 15 Sep 15 vGroup % % % Mar 15Net interest spread 1.72 1.71 1.73 (2 bps)Benefit of net free liabilities, provisions and equity 0.17 0.17 0.18 (1 bps)Net interest margin - statutory basis 1.89 1.88 1.91 (3 bps)
2. Loans and Advances
Australia EuropeNew
ZealandUnitedStates Asia Total
As at 30 September 2015 $m $m $m $m $m $mReal estate - mortgage 265,928 - 29,122 - 2,558 297,608Other commercial and industrial 55,267 2,857 7,545 303 4,057 70,029Commercial property services 53,838 293 6,827 7 388 61,353Agriculture, forestry, fishing and mining 21,768 8 12,814 - 102 34,692Financial, investment and insurance 12,949 2,649 933 1,933 1,228 19,692Asset and lease financing 10,252 586 5 - 2 10,845Instalment loans to individuals and other personal lending (including credit cards) 9,299 - 1,400 - 1 10,700Manufacturing 7,515 2 2,823 - 979 11,319Real estate - construction 1,623 952 778 - - 3,353Government and public authorities 2,141 - 106 43 - 2,290Gross loans and advances including acceptances 440,580 7,347 62,353 2,286 9,315 521,881Deduct:
Unearned income and deferred net fee income (701) (54) 41 (15) (24) (753)Provisions for doubtful debts (2,472) (32) (384) (8) (48) (2,944)
Total net loans and advances including acceptances 437,407 7,261 62,010 2,263 9,243 518,184
Australia EuropeNew
ZealandUnitedStates Asia Total
As at 31 March 2015 $m $m $m $m $m $mReal estate - mortgage 258,154 - 30,768 - 2,439 291,361Other commercial and industrial 53,876 2,618 7,471 144 4,022 68,131Commercial property services 50,572 405 7,138 8 389 58,512Agriculture, forestry, fishing and mining 20,203 7 12,843 1 80 33,134Financial, investment and insurance 12,083 2,218 1,328 1,402 2,152 19,183Asset and lease financing 10,190 457 8 - 2 10,657Instalment loans to individuals and other personal lending (including credit cards) 9,328 - 1,647 - 1 10,976Manufacturing 7,397 2 3,247 - 1,262 11,908Real estate - construction 1,678 969 884 - - 3,531Government and public authorities 2,026 - (4) 42 - 2,064Gross loans and advances including acceptances 425,507 6,676 65,330 1,597 10,347 509,457Deduct:
Unearned income and deferred net fee income (739) (50) 20 (9) (24) (802)Provisions for doubtful debts (2,534) (137) (422) (13) (26) (3,132)
Total net loans and advances including acceptances 422,234 6,489 64,928 1,575 10,297 505,523
Prior Period Restatement
2015
13
Supplementary Information
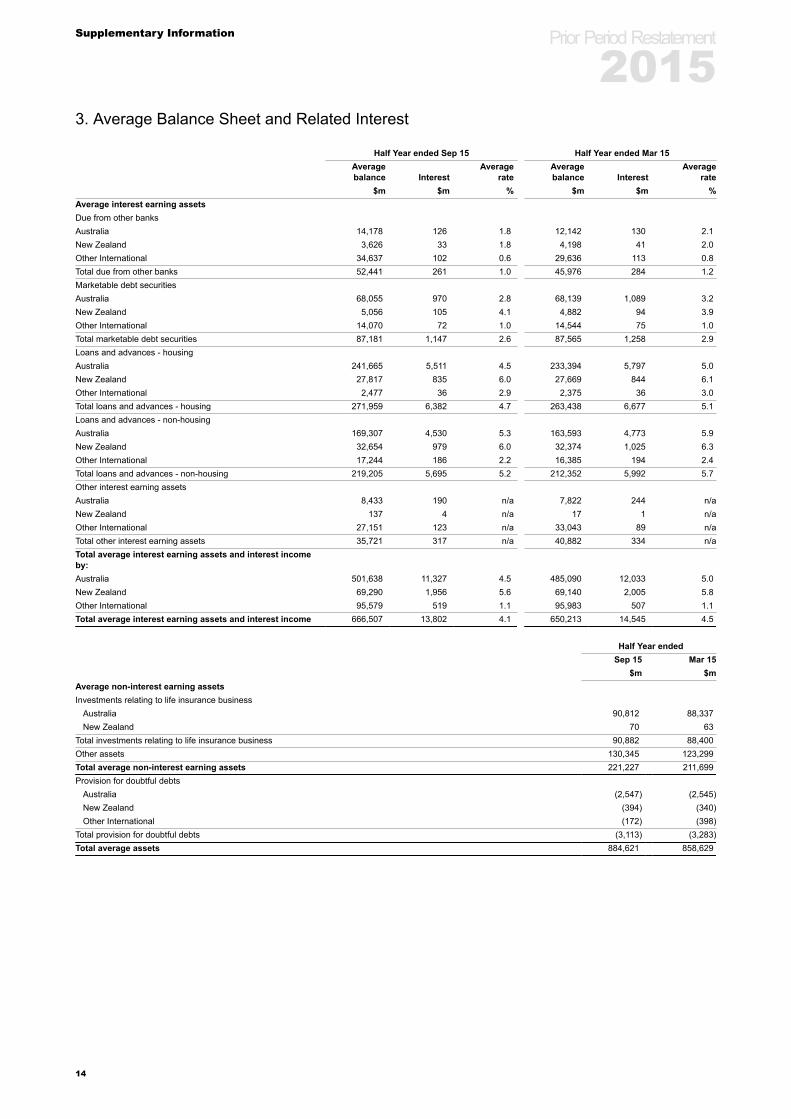
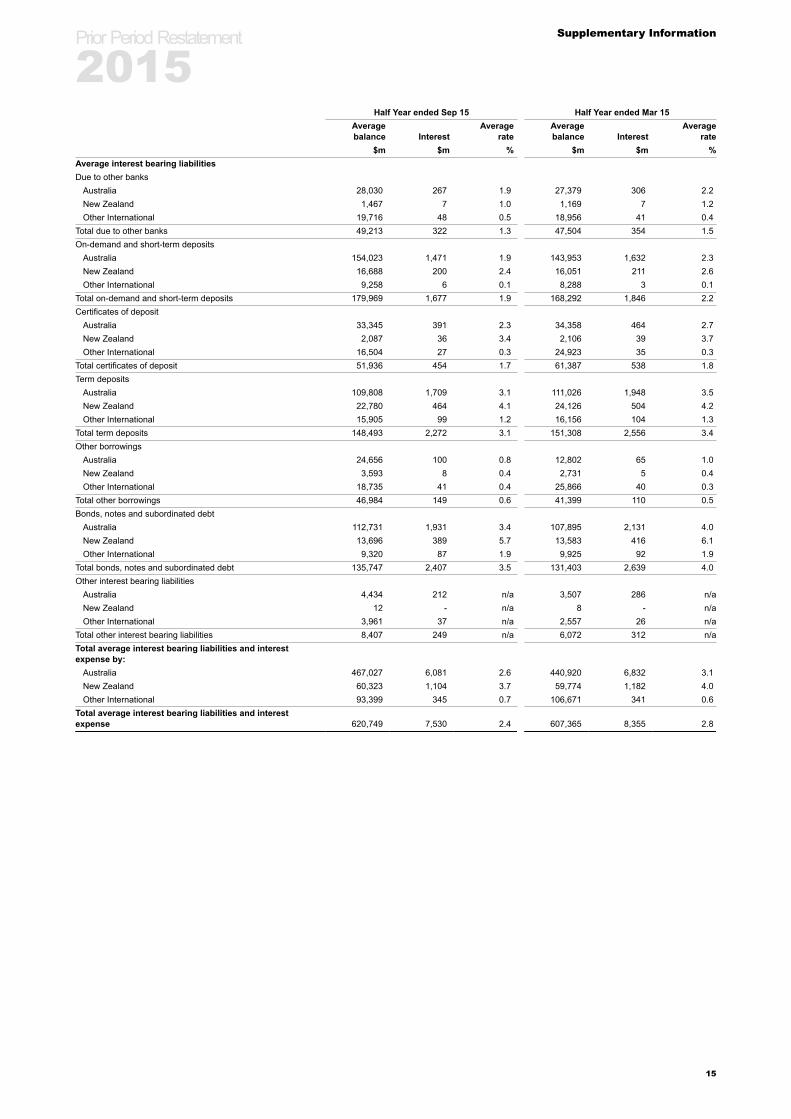
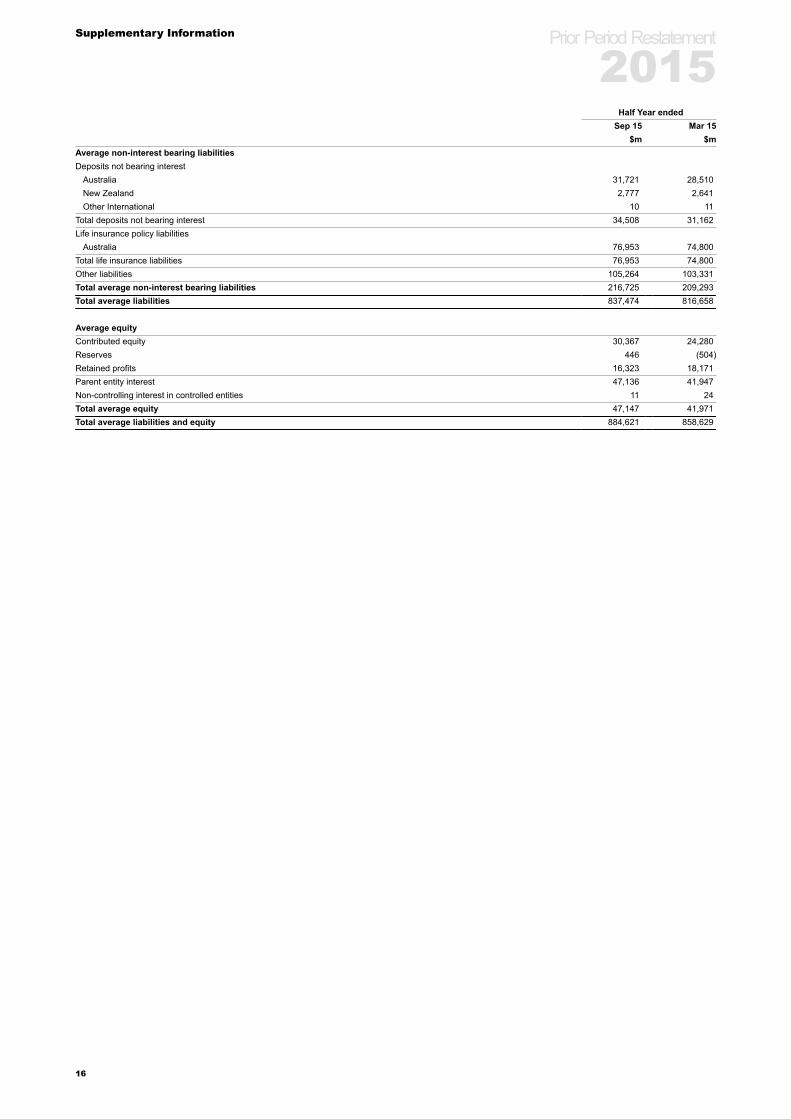
3. Average Balance Sheet and Related Interest
Half Year ended Sep 15 Half Year ended Mar 15Averagebalance Interest
$m $mAverage non-interest earning assetsInvestments relating to life insurance business
Australia 90,812 88,337New Zealand 70 63
Total investments relating to life insurance business 90,882 88,400Other assets 130,345 123,299Total average non-interest earning assets 221,227 211,699Provision for doubtful debts
Australia (2,547) (2,545)New Zealand (394) (340)Other International (172) (398)
Total provision for doubtful debts (3,113) (3,283)Total average assets 884,621 858,629
Prior Period Restatement
2015
14
Supplementary Information
Half Year ended Sep 15 Half Year ended Mar 15Averagebalance Interest
Averagerate
Averagebalance Interest
Averagerate
$m $m % $m $m %Average interest bearing liabilitiesDue to other banks
Total weighted average ordinary shares 2,438,782 2,578,648 2,504,939 2,664,978 2,373,322 2,467,359Earnings per share (cents) attributable to owners of NAB 252.7 245.4 113.1 109.8 140.4 137.9
279.2 270.5 147.2 141.9 131.5 129.4Earnings per share from continuing operations (cents)
Total weighted average ordinary shares 2,498,364 2,638,230 2,566,460 2,726,499 2,430,514 2,524,551Earnings per share (cents) attributable to owners of NAB 255.0 247.7 127.1 123.1 127.8 125.9
Prior Period Restatement
2015
17
Key Performance Measures
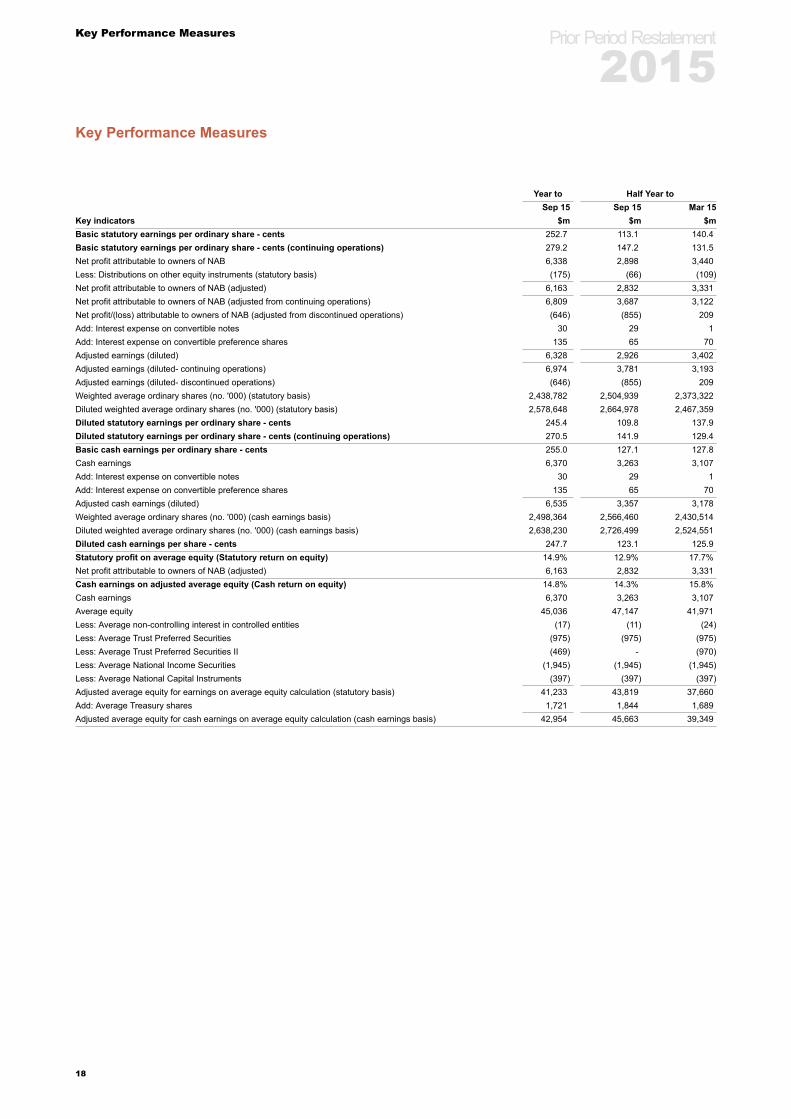
Key Performance Measures
Year to Half Year toSep 15 Sep 15 Mar 15
Key indicators $m $m $mBasic statutory earnings per ordinary share - cents 252.7 113.1 140.4Basic statutory earnings per ordinary share - cents (continuing operations) 279.2 147.2 131.5Net profit attributable to owners of NAB 6,338 2,898 3,440Less: Distributions on other equity instruments (statutory basis) (175) (66) (109)Net profit attributable to owners of NAB (adjusted) 6,163 2,832 3,331Net profit attributable to owners of NAB (adjusted from continuing operations) 6,809 3,687 3,122Net profit/(loss) attributable to owners of NAB (adjusted from discontinued operations) (646) (855) 209Add: Interest expense on convertible notes 30 29 1Add: Interest expense on convertible preference shares 135 65 70Adjusted earnings (diluted) 6,328 2,926 3,402Adjusted earnings (diluted- continuing operations) 6,974 3,781 3,193Adjusted earnings (diluted- discontinued operations) (646) (855) 209Weighted average ordinary shares (no. '000) (statutory basis) 2,438,782 2,504,939 2,373,322Diluted weighted average ordinary shares (no. '000) (statutory basis) 2,578,648 2,664,978 2,467,359Diluted statutory earnings per ordinary share - cents 245.4 109.8 137.9Diluted statutory earnings per ordinary share - cents (continuing operations) 270.5 141.9 129.4Basic cash earnings per ordinary share - cents 255.0 127.1 127.8Cash earnings 6,370 3,263 3,107Add: Interest expense on convertible notes 30 29 1Add: Interest expense on convertible preference shares 135 65 70Adjusted cash earnings (diluted) 6,535 3,357 3,178Weighted average ordinary shares (no. '000) (cash earnings basis) 2,498,364 2,566,460 2,430,514Diluted weighted average ordinary shares (no. '000) (cash earnings basis) 2,638,230 2,726,499 2,524,551Diluted cash earnings per share - cents 247.7 123.1 125.9Statutory profit on average equity (Statutory return on equity) 14.9% 12.9% 17.7%Net profit attributable to owners of NAB (adjusted) 6,163 2,832 3,331Cash earnings on adjusted average equity (Cash return on equity) 14.8% 14.3% 15.8%Cash earnings 6,370 3,263 3,107Average equity 45,036 47,147 41,971Less: Average non-controlling interest in controlled entities (17) (11) (24)Less: Average Trust Preferred Securities (975) (975) (975)Less: Average Trust Preferred Securities II (469) - (970)Less: Average National Income Securities (1,945) (1,945) (1,945)Less: Average National Capital Instruments (397) (397) (397)Adjusted average equity for earnings on average equity calculation (statutory basis) 41,233 43,819 37,660Add: Average Treasury shares 1,721 1,844 1,689Adjusted average equity for cash earnings on average equity calculation (cash earnings basis) 42,954 45,663 39,349
Prior Period Restatement
2015
18
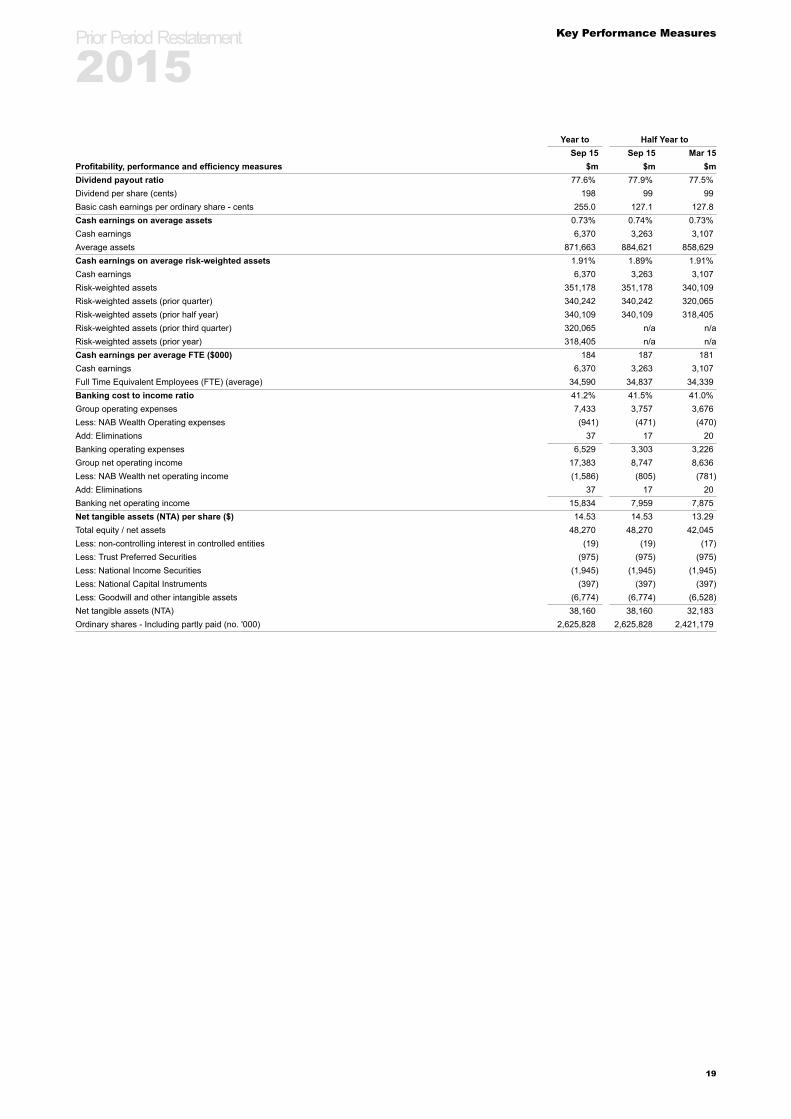
Key Performance Measures
Year to Half Year toSep 15 Sep 15 Mar 15
Profitability, performance and efficiency measures $m $m $mDividend payout ratio 77.6% 77.9% 77.5%Dividend per share (cents) 198 99 99Basic cash earnings per ordinary share - cents 255.0 127.1 127.8Cash earnings on average assets 0.73% 0.74% 0.73%Cash earnings 6,370 3,263 3,107Average assets 871,663 884,621 858,629Cash earnings on average risk-weighted assets 1.91% 1.89% 1.91%Cash earnings 6,370 3,263 3,107Risk-weighted assets 351,178 351,178 340,109Risk-weighted assets (prior quarter) 340,242 340,242 320,065Risk-weighted assets (prior half year) 340,109 340,109 318,405Risk-weighted assets (prior third quarter) 320,065 n/a n/aRisk-weighted assets (prior year) 318,405 n/a n/aCash earnings per average FTE ($000) 184 187 181Cash earnings 6,370 3,263 3,107Full Time Equivalent Employees (FTE) (average) 34,590 34,837 34,339Banking cost to income ratio 41.2% 41.5% 41.0%Group operating expenses 7,433 3,757 3,676Less: NAB Wealth Operating expenses (941) (471) (470)Add: Eliminations 37 17 20Banking operating expenses 6,529 3,303 3,226Group net operating income 17,383 8,747 8,636Less: NAB Wealth net operating income (1,586) (805) (781)Add: Eliminations 37 17 20Banking net operating income 15,834 7,959 7,875Net tangible assets (NTA) per share ($) 14.53 14.53 13.29Total equity / net assets 48,270 48,270 42,045Less: non-controlling interest in controlled entities (19) (19) (17)Less: Trust Preferred Securities (975) (975) (975)Less: National Income Securities (1,945) (1,945) (1,945)Less: National Capital Instruments (397) (397) (397)Less: Goodwill and other intangible assets (6,774) (6,774) (6,528)Net tangible assets (NTA) 38,160 38,160 32,183Ordinary shares - Including partly paid (no. '000) 2,625,828 2,625,828 2,421,179
Prior Period Restatement
2015
19
Key Performance Measures
Year to Half Year toSep 15 Sep 15 Mar 15
Group Cash Earnings $m $m $mNet interest income 12,498 6,288 6,210Other operating income 4,866 2,464 2,402IoRE 19 (5) 24Net operating income 17,383 8,747 8,636Operating expenses (7,433) (3,757) (3,676)Underlying profit 9,950 4,990 4,960Charge to provide for bad and doubtful debts (748) (349) (399)Cash earnings before tax and distributions 9,202 4,641 4,561Income tax expense (2,657) (1,312) (1,345)Cash earnings before distributions 6,545 3,329 3,216Distributions (175) (66) (109)Cash earnings 6,370 3,263 3,107
Non-cash earnings items (after-tax):Distributions 175 66 109Treasury shares 4 321 (317)Fair value and hedge ineffectiveness 516 163 353Life insurance economic assumption variation 13 (12) 25Amortisation of acquired intangible assets (94) (48) (46)Net profit from continuing operations 6,984 3,753 3,231Net profit/(loss) after tax from discontinued operations (646) (855) 209
Net profit attributable to owners of NAB 6,338 2,898 3,440
Average equity dataAverage interest-earnings assets 658,206 666,507 650,213Average assets 871,663 884,621 858,629Average equity 45,036 47,147 41,971Average non-controlling interest in controlled entities 17 11 24Average Trust Preferred Securities 975 975 975Average Trust Preferred Securities II 469 - 970Average National Income Securities 1,945 1,945 1,945Average National Capital Instruments 397 397 397Average Treasury shares 1,721 1,844 1,689Statutory earnings per share dataBasic weighted average ordinary shares (no. '000) 2,438,782 2,504,939 2,373,322Diluted weighted average ordinary shares (no. '000) 2,578,648 2,664,978 2,467,359Distributions on other equity instruments 175 66 109Interest expense on convertible notes 30 29 1Interest expense on convertible preference shares 135 65 70Cash Earnings per share dataBasic weighted average ordinary shares (no. '000) 2,498,364 2,566,460 2,430,514Diluted weighted average ordinary shares (no. '000) 2,638,230 2,726,499 2,524,551Interest expense on convertible notes 30 29 1Interest expense on convertible preference shares 135 65 70Full Time Equivalent Employees (FTE) (average) 34,590 34,837 34,339Banking cost to income ratio dataGroup operating expenses 7,433 3,757 3,676NAB Wealth operating expenses 941 471 470Operating expenses / Net operating income eliminations 37 17 20Group net operating income 17,383 8,747 8,636NAB Wealth net operating income 1,586 805 781Net tangible assets per share dataOrdinary shares - Fully paid (no. '000) 2,625,764 2,625,764 2,421,112Ordinary shares - Partly paid (no. '000) 64 64 67Total equity / net assets 48,270 48,270 42,045Non-controlling interest in controlled entities 19 19 17Trust Preferred Securities 975 975 975National Income Securities 1,945 1,945 1,945National Capital Instruments 397 397 397Goodwill and other intangible assets 6,774 6,774 6,528