Prioritizing Flood Risk Reduction and Ecosystem Services on the Dungeness River Delta: A Parcel-Scale Analysis By Ian Miller and Emily Mastriani, in collaboration with the Jamestown S’Klallam Tribe Released 21 November 2017 Cover Image: A 1977 aerial image looking southeast over the Dungness River delta. Image credit: Washington Coastal Atlas
Transcript
Prioritizing Flood Risk Reduction and Ecosystem
Services on the Dungeness River Delta: A Parcel-Scale
Analysis
By Ian Miller and Emily Mastriani, in collaboration with the Jamestown S’Klallam Tribe Released 21 November 2017
Cover Image: A 1977 aerial image looking southeast over the Dungness River delta. Image credit: Washington Coastal Atlas
1
Prioritizing Flood Risk Reduction and Ecosystem
Services on the Dungeness River Delta: A Parcel-Scale
Analysis Ian Miller, Washington Sea Grant1
Emily Mastrianni, Emily Mastrianni Consulting2
Prepared in collaboration with Hansi Hals and Robert Knapp, Jamestown S’Klallam Tribe
Overview The coastal fringe of the Dungeness River delta on the Strait of Juan de Fuca is characterized by high value habitat that is
important to salmon, Dungeness crab and other species. However, habitat degradation due to shoreline armoring and
water quality impairment is a concern for the Dungeness River delta. The delta’s low-lying shoreline is also particularly
vulnerable to coastal flooding and sea level rise. To support restoration and flood risk mitigation outreach efforts
focused on shoreline parcel-owners, we undertook a parcel-scale multiple-benefits analysis of the Dungeness River delta
shoreline. This assessment presents a methodology for assessing both flood risk and impacts to ecosystem services at
the scale of individual parcels, and also presents an overall multiple benefits ranking of parcels within the study area,
which we call an “Outreach Opportunity” score. The outreach opportunity score and associated ranks are intended to
provide guidance to individuals and entities seeking to implement projections on the Dungeness River delta that will
maximize the reduction of flood risk and optimize the restoration of ecosystem services. The data-sets compiled for the
project are also included as supplemental material3 to facilitate customized re-analyses by other interested entities.
Table of Contents Overview ................................................................................................................................................................................. 1
Introduction: Development, Flood Risk, and Ecosystem Sensitivity ...................................................................................... 2
Our Theory of Change: Reducing Risk to Shoreline Infrastructure and Nearshore Habitats ................................................. 4
Methods and Results .............................................................................................................................................................. 4
Defining and Quantifying Exposure .................................................................................................................................... 5
Defining and Quantifying Built Environment Vulnerability................................................................................................. 8
Defining and Scoring Ecosystem Sensitivity ...................................................................................................................... 10
Defining and Quantifying Adaptive Capacity .................................................................................................................... 14
Conclusions and Next Steps .................................................................................................................................................. 18
1 Corresponding author: 1502 E. Lauridsen Blvd #82, Port Angeles, WA 98362. [email protected] 2 Contact at [email protected] 3 Parcel data tables, full resolution maps, and a downloadable geodatabase are provided along with this project report at http://www.jamestowntribe.org/programs/nrs/nrs_Dungeness_River_Delta.htm
2
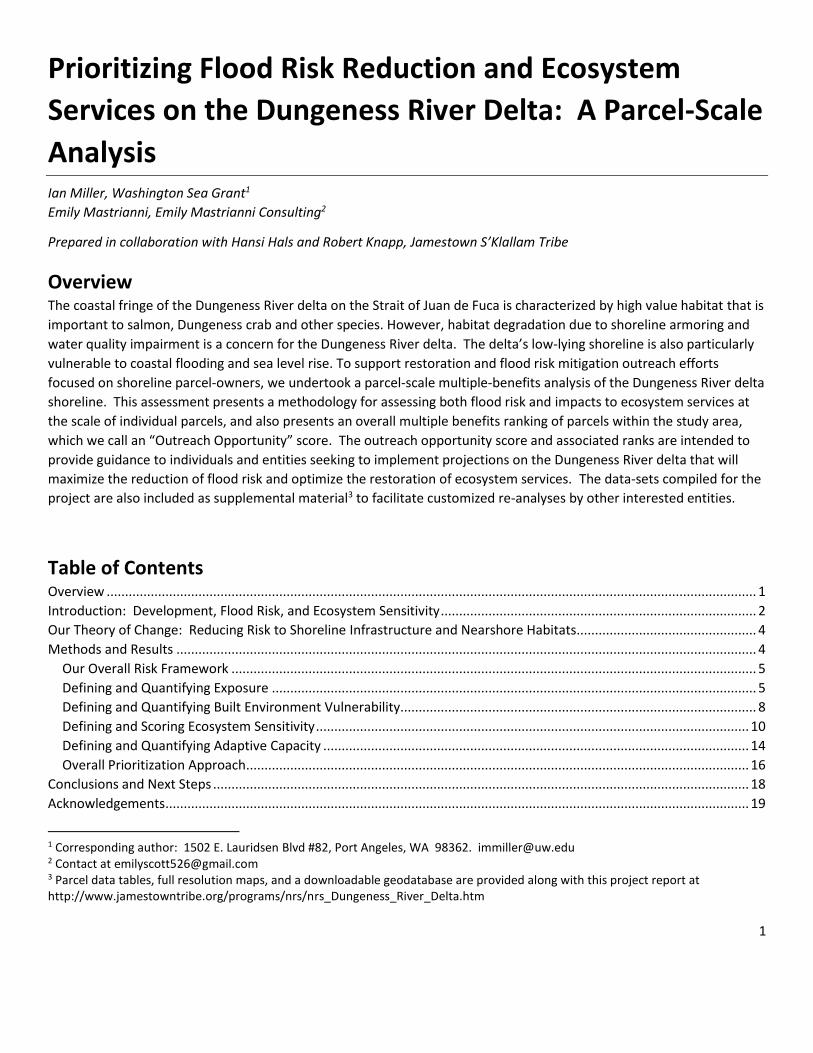
Introduction: Development, Flood Risk, and Ecosystem Sensitivity Since 1977, the number of structures on the low elevation marine shoreline of the Dungeness River delta (Figure 1) has
tripled4; many of those structures were built in the FEMA flood hazard zone5 and are already exposed to coastal
flooding. This rapid development along a low bank shoreline is associated with increased shoreline armoring and on-
going water quality issues that are due in part to residential septic systems6. Both stressors apply pressure to adjacent
nearshore ecosystems, including habitats protected by the Dungeness National Wildlife Refuge (Figure 1B), and have
implications for human health and marine resources such as commercial and recreational shellfish.
Figure 1. Overview map of the area of interest on the Dungeness River delta. Inset map A shows the Dungeness River delta (black inset box) relative to the Olympic Peninsula (OP) and Strait of Juan de Fuca (SJDF). The Dungeness River delta (Panel B) is shown with the area of interest outlined in black, and shown in detail in Panel C. The black star marks the shoreline segment referenced in Figure
2. Specific features of interest, including the Dungeness National Wildlife Refuge (NWR) are shown in Panel B.
Aside from the contemporary flood hazard there are other vulnerabilities to parcels and home-owners in the area. Sea
level is almost certain to rise, reaching elevations between 0.8-5.1 feet relative to the present by 2100 and possibly
4 Based on examination of Washington State Coastal Oblique photos (https://fortress.wa.gov/ecy/coastalatlas/tools/Map.aspx) 5 See flood zones at https://fortress.wa.gov/ecy/coastalatlas/tools/FloodMap.aspx 6 See Woodruff and others, 2009, available at http://www.jamestowntribe.org/programs/nrs/FinalMicrobialSourceTracking_000.pdf
3
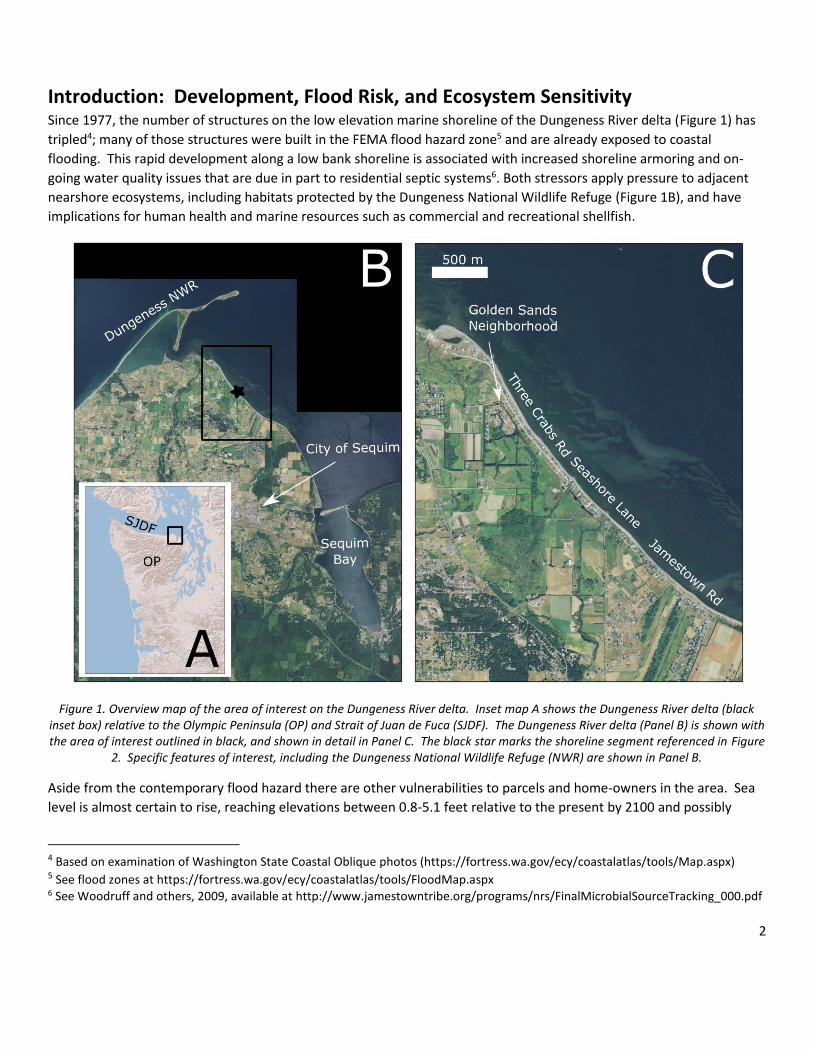
inundating much of the area of interest of this study7. Climate change may also lead to increased frequency or
magnitude of precipitation events which can further increase the potential for coastal flooding (i.e. where coastal storms
are coupled with heavy precipitation). The delta is also a highly dynamic landscape, subject to accretion and erosion8
which can threaten homes and infrastructure. Water quality degradation also poses a challenge to nearshore
ecosystems9 adjacent to the delta.
Figure 2. Oblique photos of a shoreline segment west of Jamestown Rd (see black star in Figure 1B for photo location) taken in 1977
7 Peterson and others, 2015. Available at http://www.noprcd.org/about2 8 Collins, 2005. Available at http://www.jamestowntribe.org/programs/nrs/9-screen_dungeness_080505.pdf 9 Clallam Conservation District, 2009. “Three Crabs Area Assessment” available at http://clallamcd.org/publications/
4
and 2016, showing residential development along a formerly undeveloped portion of shoreline.
Continued development pressure on the low-elevation seaward fringe of the Dungeness River delta (Figure 2), especially
in light of sea level rise projections10 and water quality concerns, has prompted interest in the delta amongst restoration
practitioners, local governments and the Jamestown S’Klallam Tribe. After a comprehensive climate change assessment
by the Jamestown S’Klallam Tribe6 identified significant vulnerabilities to sea level rise on the delta, a group of University
of Washington students identified various strategies and approaches for working with home-owners to reduce their risk
of coastal flooding and related impacts. Their report and recommendations11 identified a variety of tools and strategies
for communicating with parcel-owners, and emphasized the need for relationship-building. On September 28, 2016 the
Jamestown S’Klallam Tribe convened a working group focused on continuing to develop strategies and approaches for
reaching and communicating with marine waterfront home and property owners on the Dungeness River delta. In
particular the working group was interested in technical consultation and relationship-building with waterfront residents
on the delta that could lead to implementing “multiple benefits” projects that reduce present and future flood and
erosion risk while at the same time reducing ecosystem pressures that degrade nearshore habitats.
One outcome of that initial working group meeting was the realization that any outreach efforts focused on shorefront
homeowners on the Dungeness River delta would benefit from an analysis to prioritize parcels (and parcel owners) for
outreach effort. This assessment is an effort to assemble appropriate datasets and create a parcel prioritization scheme
using approaches modelled after previous efforts focused on the Dungeness River watershed, as well as the Dungeness
Bluffs Conservation Plan12.
Our Theory of Change: Reducing Risk to Shoreline Infrastructure and Nearshore
Habitats Fundamentally, our analysis attempts to answer the question, “If we want to maximize the reduction of risk to
infrastructure due to flooding and erosion, while at the same time maximizing protection or restoration of nearshore
ecosystem functions, which parcel-owners should we prioritize working with?” This question is premised on the idea
that any implementation of on-the-ground projects will require substantial lead time and effort to build relationships
with private property owners, develop project proposals, and secure funding. While many parcels are presently at risk,
funding and capacity are limited. Prioritization is necessary.
Methods and Results The goal of this study was to identify relative differences in present and future flood risk, and also potential differences
in risks to habitat quality, (which we term “Ecosystem Sensitivity”) across parcels adjacent to marine waters on the low
elevation fringe of the Dungeness River delta. The study area includes roughly three miles of shoreline to the east of the
mouth of the Dungeness River, specifically from the west end of Three Crabs Road to the east end of Jamestown Road
(Figure 1C). Included in this study area is the Golden Sands neighborhood (Figure 1C). Of the 273 parcels included in the
analysis, 62% have some sort of structural development. With the exception of five parcels designated as Agricultural
10 Also see Jamestown S’Klallam Tribe, 2012 available at http://www.jamestowntribe.org/programs/nrs/nrs_climchg.htm 11 Hernández-Padilla et al., 2015. Coping with a Changing Coast: Adaptation Strategies to Protect the Coastal Culture and Environment of the Jamestown S’Klallam Tribe. Available by request to the corresponding author. 12 http://www.jamestowntribe.org/programs/nrs/nrs_drift_cell.htm
5
Retention, all other parcels are zoned as Rural Neighborhood Conservation or Low Density Rural13. For the purposes of
this study, roads and publicly-owned parcels were removed.
Overall Risk Framework For this assessment, in which our goal was to combine multiple parcel attributes to develop summary risk metrics, we
started with a commonly-applied framework for defining risk14:
We then developed approaches for quantitatively scoring each of the following attributes:
● Exposure: The degree to which a system (in this case parcel), based on its physical configuration, is exposed to a
hazard (in this case coastal flooding).
● Vulnerability: The predisposition of a parcel to being impacted by a hazard based on a variety of concepts
including the susceptibility to harm or sensitivity of infrastructure and ecosystem services.
● Adaptive Capacity: The ability of a system, or in this case parcel-owner, to adjust to climate change (including
climate variability and extremes) to moderate potential damages, to take advantage of opportunities, or to cope
with the consequences of coastal flooding.
The multiple benefits focus of this project demanded that we go beyond considering just the potential interactions
between a hazard and lives, property, or infrastructure (i.e. a typical coastal flood risk assessment15, which we call “Built
Environment Risk” in this assessment). We also considered the potential interactions between the parcel and ecosystem
services, and created a score for the “Ecosystem Sensitivity” of each parcel. A parcel’s Ecosystem Sensitivity score was
then coupled with an “Adaptive Capacity” score to calculate each parcel’s “Restoration Opportunity” ranking, which is
intended to evaluate the degree to which a parcel-owner may benefit from assistance to achieve restoration goals on
their parcel. Finally, the combination of a parcel’s risk from coastal flooding (or Built Environment Risk score), and its
“Restoration Opportunity” score led us to a final “Outreach Opportunity” score and ranking for each parcel.
Throughout this study we were interested in using only publicly available data OR datasets that could be derived from
publicly available data and without additional field work. This was due to capacity limitations, and also because we were
interested in developing an approach that could scale to larger areas.
Defining and Quantifying Exposure In traditional risk analyses spatial differences in exposure to a hazard are typically driven in part by spatial variations in
the hazards16. For example, the USGS’s Coastal Vulnerability Index is applied over the entire coast of the United States,
and differences in vulnerability in that assessment are driven largely by differences in hazard characteristics like wave
climate and storm surges. However, in this assessment we assumed that all parcels over the relatively small spatial scale
of our project area experience the same factors that drive coastal flooding. For instance, we assume that the impact
from current and future hazards, such as tides, storm surge and waves, remain uniform across this small shoreline reach.
As a result, we assumed the differences in hazard exposure across the study area are driven primarily by differences in
elevation between the parcels.
13 Clallam County zoning designations and definitions from http://www.clallam.net/LandUse/zoning.html 14 Modified from https://training.fema.gov/hiedu/docs/terms%20and%20definitions/terms%20and%20definitions.pdf 15 See for example https://www.fema.gov/pdf/plan/prevent/rms/155/e155_unit_v.pdf 16 See, for example, https://woodshole.er.usgs.gov/project-pages/cvi/
6
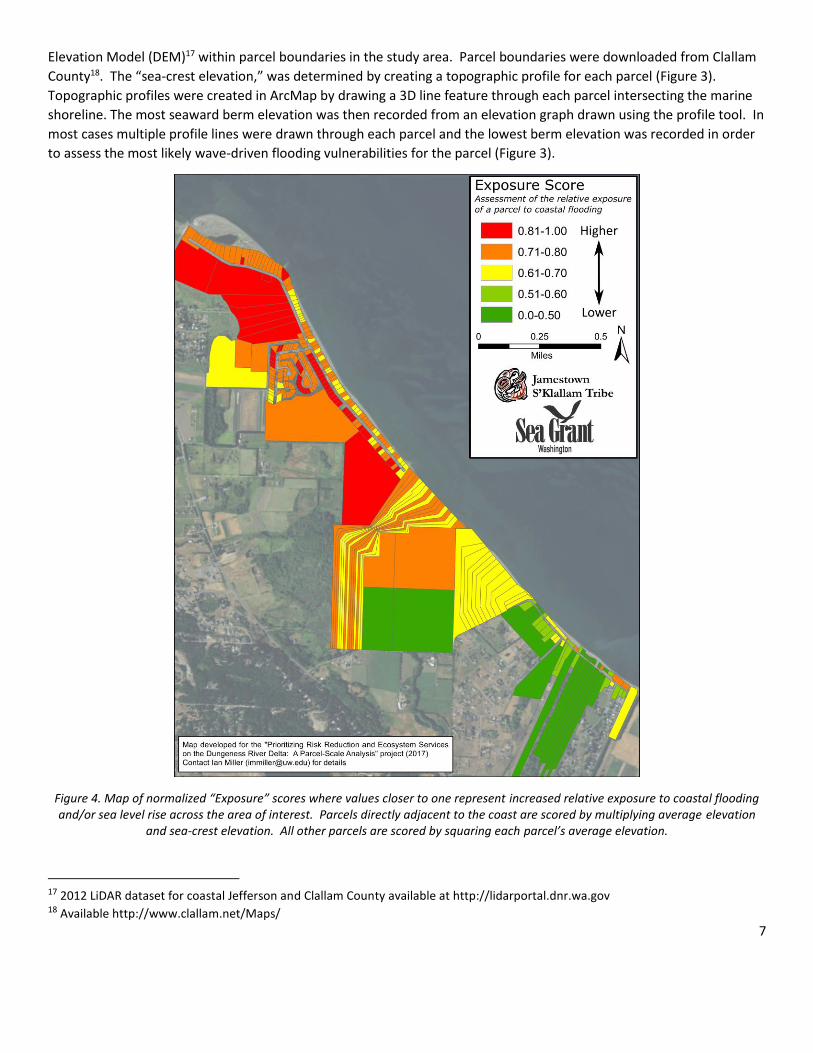
The entire study area that we considered is either in the current flood hazard zone, as defined by FEMA5, or is within
areas possibly influenced by sea level rise by 21007. In other words, every parcel in our study area has some exposure to
current or future flooding. Relative exposure to flooding was therefore calculated for each parcel using two elevation
metrics: 1) Mean parcel elevation, and 2) for those parcels directly fronting the marine shoreline, the “sea-crest
elevation”, or the elevation of the most seaward berm on the parcel (Figure 3). This method assumes that elevation is a
key attribute of the likelihood of flooding occurring in a parcel, both now and under different future sea level rise
scenarios. Furthermore, it assumes that the flood hazard for those parcels directly on the marine shoreline is driven at
least in part by waves, and that parcels with a higher berm on their seaward side may enjoy a greater degree of
protection than those parcels with a lower elevation berm. The inclusion of the “sea-crest” elevation is intended to
account for the protection that those parcels enjoy due to the elevation of any shore-fronting berm.
Figure 3. Example approach for estimating the sea-crest elevation for each parcel using the “profile tool” in the ArcGIS 3-D Analyst toolbox. A profile line was drawn for each parcel, and elevations along that profile extracted from a LiDAR derived digital elevation
model. The peak elevation of the most seaward berm was extracted manually from the profile graph.
The mean elevation of the parcel was determined by averaging each elevation value on a LiDAR-derived 1-m Digital
7
Elevation Model (DEM)17 within parcel boundaries in the study area. Parcel boundaries were downloaded from Clallam
County18. The “sea-crest elevation,” was determined by creating a topographic profile for each parcel (Figure 3).
Topographic profiles were created in ArcMap by drawing a 3D line feature through each parcel intersecting the marine
shoreline. The most seaward berm elevation was then recorded from an elevation graph drawn using the profile tool. In
most cases multiple profile lines were drawn through each parcel and the lowest berm elevation was recorded in order
to assess the most likely wave-driven flooding vulnerabilities for the parcel (Figure 3).
Figure 4. Map of normalized “Exposure” scores where values closer to one represent increased relative exposure to coastal flooding and/or sea level rise across the area of interest. Parcels directly adjacent to the coast are scored by multiplying average elevation
and sea-crest elevation. All other parcels are scored by squaring each parcel’s average elevation.
17 2012 LiDAR dataset for coastal Jefferson and Clallam County available at http://lidarportal.dnr.wa.gov 18 Available http://www.clallam.net/Maps/
8
For those parcels directly fronting the marine shoreline (i.e. all excepting those parcels in the Golden Sands
neighborhood, and a few on the opposite side of the road from the beach [Figure 1C]), the “Exposure” score was
calculated by multiplying the mean elevation and the sea-crest elevation. Parcels NOT directly fronting the marine
shoreline (i.e. like those parcels in Golden Sands [Figure 1C]) were treated slightly differently; an Exposure score was
calculated by squaring the mean elevation. This approach was chosen in an attempt to compare relative exposure across
the area of interest. All Exposure scores were then normalized to values between zero and 1 by dividing all Exposure
values by the highest obtained value (Figure 4).
Defining and Quantifying Built Environment Vulnerability Vulnerabilities specifically associated with built infrastructure on a parcel were assessed to capture the likelihood that
the developed part of each parcel would be negatively affected, or susceptible to harm, from coastal flooding. “Built
Environment Vulnerability” was assessed using criteria associated with the style of construction of the structures on the
parcel, as well as the type and condition of septic systems found in each parcel area. These criteria are described below.
Using the Clallam County parcel dataset12 coupled with imagery available through Google Earth19, the style of
construction was assessed for each parcel (Table 1). The style of construction score was 0 if the parcel had no
structures. Homes with a garage or shed were given a score of 1, under the assumption that the structure was not a
primary residence or dwelling. Recreational vehicles were given a score of 2, assuming that they are vulnerable, but
could be more easily relocated in the case of flooding. Elevated homes (scored at 3) were assumed to have an overall
lower vulnerability than manufactured homes (scored at 4) due to their elevation. The most vulnerable structures, those
that were permanent and non-elevated, received a score of 5. Many of these homes were older, and assumed to include
little, if any, flood adaptation measures.
Table 1. Style of construction categories, and their score assignments used to quantify Built Environment Vulnerability scores
Style of construction Score (least to most vulnerable)
no home or structure 0
garage or shed only 1
recreational vehicle (RV) 2
elevated home 3
manufactured home 4
permanent, non-elevated home 5
The style of septic system on each parcel was also built into this assessment of vulnerability (Table 2). Two different
septic system databases that included details about the type and inspection status of septic systems in our area of
interest, were combined for this assessment, one provided by Clallam County20, and another from the Clallam County
19 https://www.google.com/earth/ 20 Received from Adar Feller, Clallam County, 21 March 2017
9
Conservation District21. Clallam County staff also provided valuable insights about the relative vulnerability of different
types of septic systems to flooding.
Figure 5. Map of normalized “Built Environment Vulnerability” scores. Parcels are scored by summing the scores for structure (Table 1) and septic (Table 2) type. Values closer to 1 represent higher vulnerability for the built features of the parcel, either due to the
type of structure, or the type or condition of the parcel’s septic system.
21 Received from Joe Haltrop, Clallam County Conservation District, 14 November 2017
10
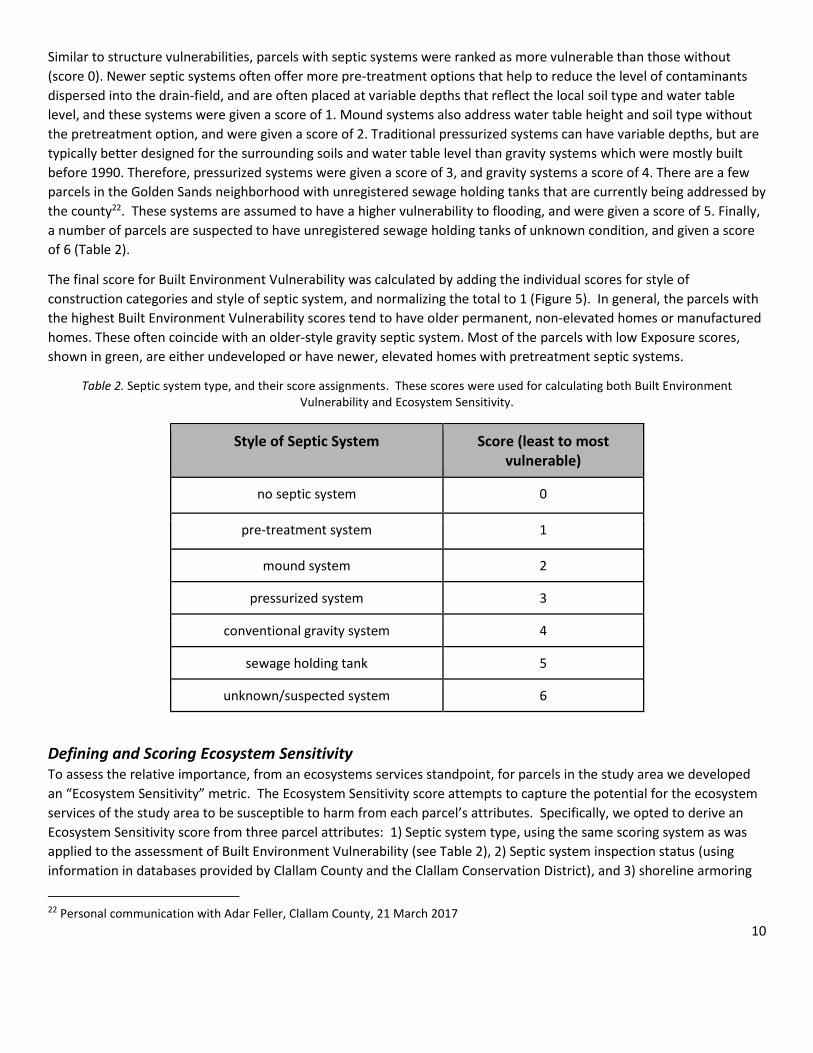
Similar to structure vulnerabilities, parcels with septic systems were ranked as more vulnerable than those without
(score 0). Newer septic systems often offer more pre-treatment options that help to reduce the level of contaminants
dispersed into the drain-field, and are often placed at variable depths that reflect the local soil type and water table
level, and these systems were given a score of 1. Mound systems also address water table height and soil type without
the pretreatment option, and were given a score of 2. Traditional pressurized systems can have variable depths, but are
typically better designed for the surrounding soils and water table level than gravity systems which were mostly built
before 1990. Therefore, pressurized systems were given a score of 3, and gravity systems a score of 4. There are a few
parcels in the Golden Sands neighborhood with unregistered sewage holding tanks that are currently being addressed by
the county22. These systems are assumed to have a higher vulnerability to flooding, and were given a score of 5. Finally,
a number of parcels are suspected to have unregistered sewage holding tanks of unknown condition, and given a score
of 6 (Table 2).
The final score for Built Environment Vulnerability was calculated by adding the individual scores for style of
construction categories and style of septic system, and normalizing the total to 1 (Figure 5). In general, the parcels with
the highest Built Environment Vulnerability scores tend to have older permanent, non-elevated homes or manufactured
homes. These often coincide with an older-style gravity septic system. Most of the parcels with low Exposure scores,
shown in green, are either undeveloped or have newer, elevated homes with pretreatment septic systems.
Table 2. Septic system type, and their score assignments. These scores were used for calculating both Built Environment Vulnerability and Ecosystem Sensitivity.
Style of Septic System Score (least to most vulnerable)
no septic system 0
pre-treatment system 1
mound system 2
pressurized system 3
conventional gravity system 4
sewage holding tank 5
unknown/suspected system 6
Defining and Scoring Ecosystem Sensitivity To assess the relative importance, from an ecosystems services standpoint, for parcels in the study area we developed
an “Ecosystem Sensitivity” metric. The Ecosystem Sensitivity score attempts to capture the potential for the ecosystem
services of the study area to be susceptible to harm from each parcel’s attributes. Specifically, we opted to derive an
Ecosystem Sensitivity score from three parcel attributes: 1) Septic system type, using the same scoring system as was
applied to the assessment of Built Environment Vulnerability (see Table 2), 2) Septic system inspection status (using
information in databases provided by Clallam County and the Clallam Conservation District), and 3) shoreline armoring
22 Personal communication with Adar Feller, Clallam County, 21 March 2017
11
type.
Figure 6. Map of normalized “Ecosystem Sensitivity” scores. Parcels are scored by summing septic type ranks, septic inspection status ranks, and shoreline armoring ranks. Higher scores, closer to 1, represent our project assessment of the degree to which the parcel’s
configuration may represent a risk to ecosystem services.
Parcels without septic systems were assumed to be the least sensitive, and given a score of 0 (Table 3), while parcels
that were up-to-date on their inspections and assumed to be properly functioning were given a score with of 1. These
12
septic systems likely pose less risk of negatively impacting important ecosystem services. On the other hand, parcels not
keeping current with their inspections received a score of 2. Finally, there are a few parcels, specifically in the Golden
Sands neighborhood, that are suspected or known to have undocumented sewage tanks. Some of these are located on
parcels where permits were not originally required, and are being addressed by Clallam County22. These parcels are
assumed to pose the most risk to ecosystem services, and were scored at a 3 (Table 3).
Table 3. Septic Inspection Status and scoring system. These scores were used for assessing Ecosystem Sensitivity.
Septic System Inspection Status Score (least to most sensitive)
no septic system present 0
known septic system with a current inspection
1
known septic system without a current inspection
2
suspected septic system without documentation
3
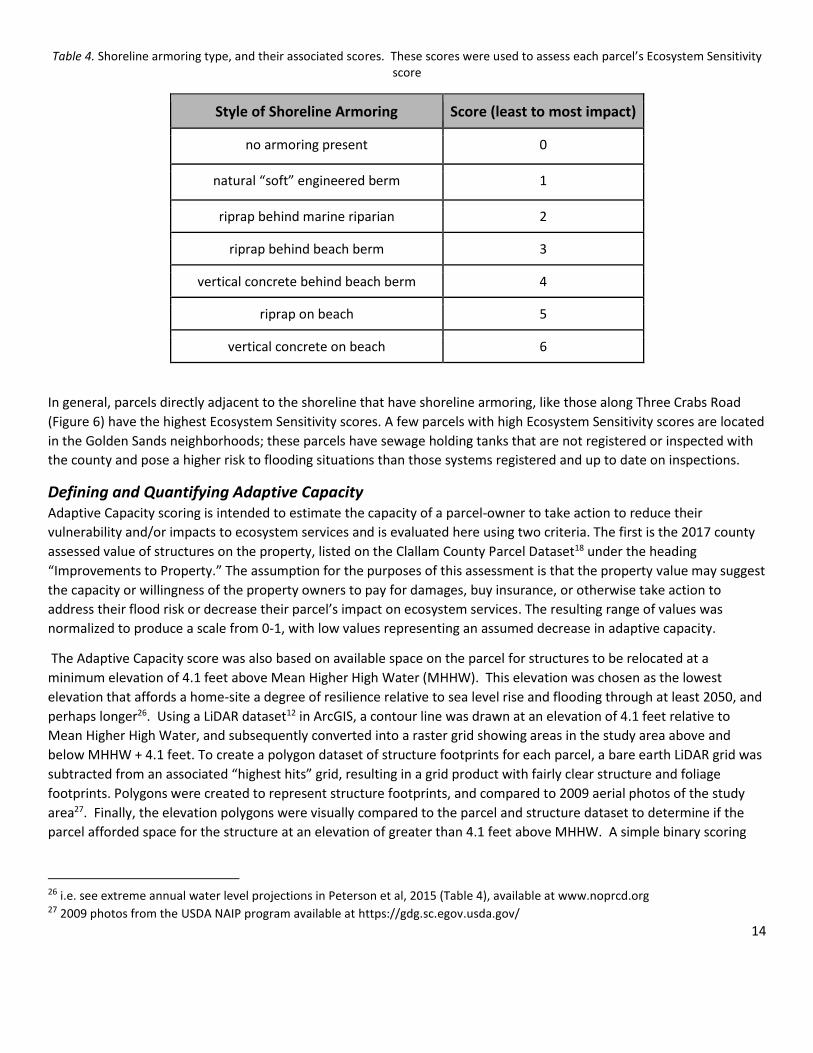
Engineered shoreline protections structures like rip-rap walls or concrete revetments (referred to in this assessment as
“shoreline armoring”) can negatively affect nearshore ecosystems23. The amount of armor in Puget Sound is used as an
indicator of the overall health of Puget Sound24. A new shoreline armoring database was developed for this project by
examining oblique shoreline images available from Google Earth13 and via the Washington Coastal Atlas25. In some
instances, shoreline armoring information was also available in online Clallam County development permits.
Armoring types were divided into six different categories, and scored (from low to high) based on the perceived degree
of impact associated with the particular armoring configuration (Table 4). In general, it was assumed that alternatives to
shoreline armoring, such as engineered “soft shorelines”, and placement of armoring behind a marine riparian zone
(such that the armoring is not directly interacting with marine waters), reduces ecosystem service impacts relative to
shoreline armoring. Shoreline parcels with no armoring received a score of 0 to reflect the best-case scenario where
coastal processes are allowed to proceed naturally. Engineered berms were given a score of 1. In instances in which
hard armoring was placed landward of a marine riparian zone or a beach berm, a lower score was assigned in relation to
other hard armoring that was placed directly on the beach. Vertical concrete construction laying directly on the beach
was scored highest, based on an assumption that it results in the greatest negative impacts to ecosystem services (Table
4).
23 See Dethier et al, 2016, available at http://onlinelibrary.wiley.com/doi/10.1111/conl.12323/full 24 See http://www.psp.wa.gov/vitalsigns/shoreline_armoring_indicator1.php 25 See https://fortress.wa.gov/ecy/coastalatlas/
13
Figure 7. Map of normalized “Adaptive Capacity” scores. Parcels were scored by summing normalized parcel improvement values, and a binary “Room to Move” score. Note that undeveloped parcels are not scored. A higher score closer to one suggests a higher adaptive capacity, and that a parcel owner may have options for reducing risk or addressing ecosystem functions on their parcel.
Each parcels total Ecosystem Sensitivity score was calculated by adding the individual score for style of septic system and
septic system inspection status (which were included in the previous section), and shoreline armoring, and normalizing
the values to 1 (Figure 6).
14
Table 4. Shoreline armoring type, and their associated scores. These scores were used to assess each parcel’s Ecosystem Sensitivity score
Style of Shoreline Armoring Score (least to most impact)
no armoring present 0
natural “soft” engineered berm 1
riprap behind marine riparian 2
riprap behind beach berm 3
vertical concrete behind beach berm 4
riprap on beach 5
vertical concrete on beach 6
In general, parcels directly adjacent to the shoreline that have shoreline armoring, like those along Three Crabs Road
(Figure 6) have the highest Ecosystem Sensitivity scores. A few parcels with high Ecosystem Sensitivity scores are located
in the Golden Sands neighborhoods; these parcels have sewage holding tanks that are not registered or inspected with
the county and pose a higher risk to flooding situations than those systems registered and up to date on inspections.
Defining and Quantifying Adaptive Capacity Adaptive Capacity scoring is intended to estimate the capacity of a parcel-owner to take action to reduce their
vulnerability and/or impacts to ecosystem services and is evaluated here using two criteria. The first is the 2017 county
assessed value of structures on the property, listed on the Clallam County Parcel Dataset18 under the heading
“Improvements to Property.” The assumption for the purposes of this assessment is that the property value may suggest
the capacity or willingness of the property owners to pay for damages, buy insurance, or otherwise take action to
address their flood risk or decrease their parcel’s impact on ecosystem services. The resulting range of values was
normalized to produce a scale from 0-1, with low values representing an assumed decrease in adaptive capacity.
The Adaptive Capacity score was also based on available space on the parcel for structures to be relocated at a
minimum elevation of 4.1 feet above Mean Higher High Water (MHHW). This elevation was chosen as the lowest
elevation that affords a home-site a degree of resilience relative to sea level rise and flooding through at least 2050, and
perhaps longer26. Using a LiDAR dataset12 in ArcGIS, a contour line was drawn at an elevation of 4.1 feet relative to
Mean Higher High Water, and subsequently converted into a raster grid showing areas in the study area above and
below MHHW + 4.1 feet. To create a polygon dataset of structure footprints for each parcel, a bare earth LiDAR grid was
subtracted from an associated “highest hits” grid, resulting in a grid product with fairly clear structure and foliage
footprints. Polygons were created to represent structure footprints, and compared to 2009 aerial photos of the study
area27. Finally, the elevation polygons were visually compared to the parcel and structure dataset to determine if the
parcel afforded space for the structure at an elevation of greater than 4.1 feet above MHHW. A simple binary scoring
26 i.e. see extreme annual water level projections in Peterson et al, 2015 (Table 4), available at www.noprcd.org 27 2009 photos from the USDA NAIP program available at https://gdg.sc.egov.usda.gov/
15
system was used, using 1 to represent space available, and 0 to represent a lack of space availability.
Figure 8. “Built Environment Risk” ranking for the Dungeness River delta. This ranking process considers the relative exposure of parcels, along with their vulnerability based on the type of infrastructure on the property and the adaptive capacity of the parcel-
owners.
The normalized Home Value score, derived from the improvements to property value, and Room to Move score were
summed, and normalized to 1 (Figure 7). Undeveloped parcels are not scored for this criterion. The resulting map (Figure
16
7) shows red parcels, many of which are in the Golden Sands neighborhood, as being susceptible to complete inundation
in the selected sea level rise scenario (i.e. no room to move on the parcel) and also tending towards lower improvement
values. Most parcels to the east of, and including, Jamestown Beach Road, have a higher capacity for adaptation due to
their higher elevation and larger size (more likely to have room to move), and greater value of property improvements.
Overall Prioritization Approach Using the four parcel attributes described above we developed an approach for separately scoring and ranking each
parcel’s risk from flooding (called “Built Environment Risk”) as well as a score representing the possible benefits
associated with restoration on the parcel (the “Restoration Opportunity” score). We then combined those two
assessments treating each as being equally important (i.e. no weighting was applied) to come up with an overall parcel
score and rank, which we called an “Outreach Opportunity” score. For mapping purposes, the parcels were ranked and
distributed into five priority categories (Table 5).
Table 5. Priority descriptors associated with ranks for parcels for “Built Environment Risk”, “Restoration Opportunity”, and “Outreach Opportunity” scores. Raw scores are available in the supplemental data tables.
Priority Designation on Map Ranking of Parcels
Highest Priority 1-10
High Priority 11-20
Medium Priority 21-30
Low Priority 31-40
Lowest Priority > 40 (remaining parcels)
Note that since Adaptive Capacity scores were only assigned to developed parcels, this scoring and ranking process
described in this section by definition only applies to developed parcels. There may be instances, though, in which a
conservation ranking is of interest to prioritize outreach to owners of undeveloped parcels. Such a ranking process
could easily be conducted using the data available in the supplemental data tables or the associated geodatabases.
Built Environment Risk In order to score and rank parcels we first calculated a “Built Environment Risk” score, which follows the traditional
flood risk framework:
Built Environment Risk = (Exposure * Built Environment Vulnerability)/Adaptive Capacity
The Built Environment Risk score for each parcel was then ranked and mapped (Figure 8). This overall risk ranking
suggests that the risk to the built environment is generally highest for parcels in the Golden Sands neighborhood (Figure
1C), though a number of parcels in the priority categories are also on Three Crabs Road.
17
Figure 9. “Restoration Opportunity” ranking for the Dungeness River delta. This ranking process considers the Ecosystem Sensitivity score of parcels, which is based on the presence and type of shoreline armoring as well as the presence and type of septic system,
along with the Adaptive Capacity score for the parcel.
Restoration Opportunity Score The “Restoration Opportunity” score was intended to identify those parcels that provide the best opportunity for
restoration action (i.e. shoreline armoring removal or modification, or septic system updates or inspections), but are
also parcels where restoration action may be most challenging (i.e. the parcel has a low “Adaptive Capacity” score) for
18
the property owner. “Restoration Opportunity” scores were calculated as follows:
The restoration opportunity scores were then ranked and mapped (Figure 9). In general, the highest ranked parcels in
this category (i.e. highest priority categories) are distributed in the Golden Sands neighborhood (Figure 1C) and on Three
Crabs Road.
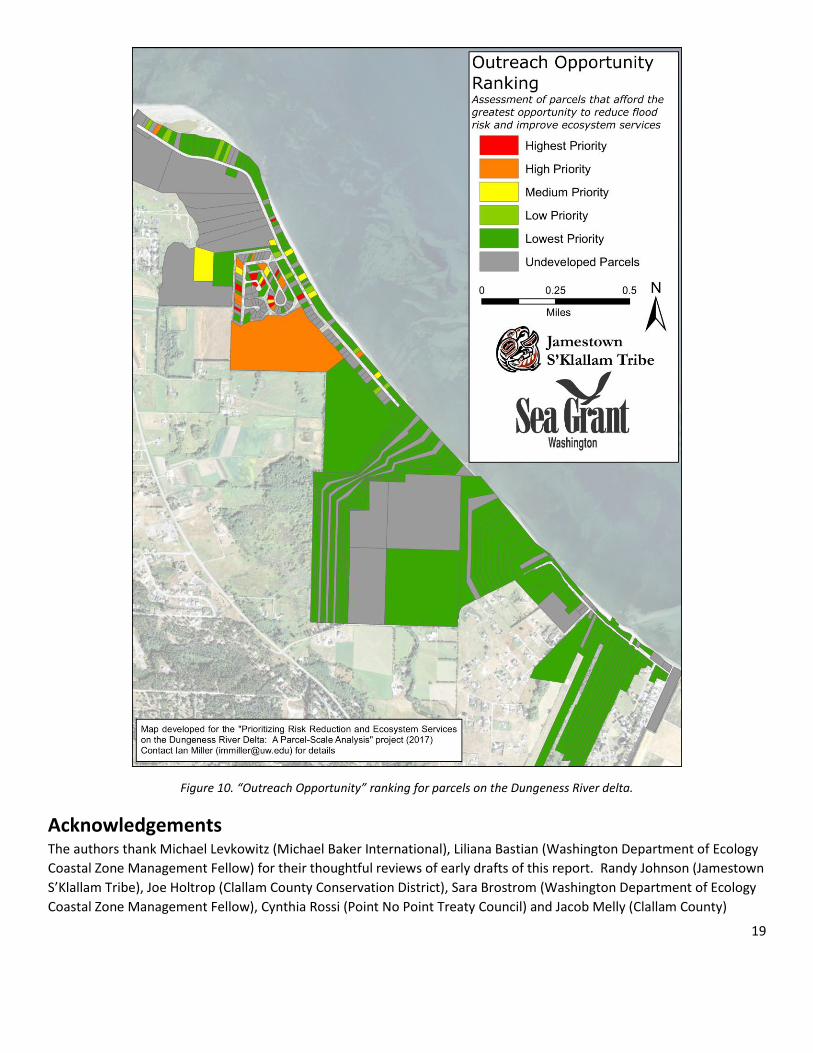
Final Prioritization: Outreach Opportunity Score Finally, we used a simple sum of the “Built Environment Risk” and “Restoration Opportunity” scores, without weighting
(i.e. each was considered equally important in this assessment) to rank those parcels that presented both the highest
flood risk to infrastructure and buildings, and the highest potential impact to ecosystem services. This ranking process
therefore provides some insight into which parcels may provide the most benefit from outreach attention, restoration,
flood risk mitigation activity or acquisition (Figure 10). There are 96 parcels that have no structural development, and
therefore do not receive an “Outreach Opportunity” score (though those parcels may be considered for conservation
outreach, as noted above).
Conclusions and Next Steps The purpose of this assessment was to develop and apply a prioritization approach for parcels on the Dungeness River
delta that optimizes the reduction of flood risk and ecosystem impacts due to armoring and water quality degradation
associated with residential septic systems. The assessment also attempts to quantify an “Outreach Opportunity” score
and rank of each developed parcel, or the likelihood that some sort of assistance or partnership with a parcel owner, or
acquisition of a parcel, may be necessary or desirable to reduce flood risk or gain ecosystem benefits. The overall
prioritization approach is intended to provide a roadmap for outreach to parcel owners in that it attempts to answer the
question, “Who should you approach and attempt to work with first?” This question assumes that any person or entity
interested in approaching parcel-owners on the Dungeness River delta will have limited capacity and will need to
prioritize. This assessment is intended as a tool for that purpose.
It is not perfect, and there are a variety of assumptions embedded in the assessment. Notably we limited ourselves to
readily available datasets in order to develop and test a methodology that could potentially be scaled to larger spatial
scales. Why does this matter? As an example, we opted to assess each parcel’s relative exposure to flooding using
parcel elevation characteristics derived from LiDAR, rather than something like first-floor elevations of the structure,
which may provide a more realistic perspective on the true risk of infrastructure on a parcel to flooding. Those data,
though, are harder to come by. As another example, we weighted each of our derived parcel attributes (i.e. Exposure,
Built Environment Vulnerability, Ecosystem Sensitivity, etc.) equally, whereas a particular individual or entity may be
more interested in scaling the flood risk reduction benefits in terms of prioritizing their outreach activities. In applying
this assessment it is important to take into consideration these factors and think deeply about the data sources and how
they were combined before approaching a parcel owner.
Despite these short-comings, the hope is that this assessment will prove to be an insightful tool for practitioners wishing
to work with parcel owners to realize multiple benefits on the Dungeness River delta. It is intended to be flexible. While
we have mapped a particular approach for prioritizing parcels, the raw data sets are included in formats that encourage
users to create their own prioritization schemes.
19
Figure 10. “Outreach Opportunity” ranking for parcels on the Dungeness River delta.
Acknowledgements The authors thank Michael Levkowitz (Michael Baker International), Liliana Bastian (Washington Department of Ecology
Coastal Zone Management Fellow) for their thoughtful reviews of early drafts of this report. Randy Johnson (Jamestown
S’Klallam Tribe), Joe Holtrop (Clallam County Conservation District), Sara Brostrom (Washington Department of Ecology
Coastal Zone Management Fellow), Cynthia Rossi (Point No Point Treaty Council) and Jacob Melly (Clallam County)
20
provided valuable edits and comments, and in some cases data, that improved the final report and associated