116
Control of Toxic Chemicals in Puget Sound Quality Assurance Project Plan for Phase 3: Priority Pollutant Scans of Ten POTWs

Control of Toxic Chemicals in Puget Sound
Quality Assurance Project Plan for Phase 3: Priority Pollutant Scans of Ten POTWs

Quality Assurance Project Plan for
Control of Toxic Chemicals in Puget Sound Phase 3: Priority Pollutant Scans of Ten POTWs
Prepared by
Ecology and Environment, Inc. 720 Third Avenue Suite 1700
Seattle, Washington 98104
and
Herrera Environmental Consultants 2200 Sixth Avenue Suite 1100
Seattle, Washington
February 2009 Publication No. 09-10-001

Publication and Contact Information This plan is available on the Department of Ecology’s website at http://www.ecy.wa.gov/biblio/0910001.html Data for this project will be available on Ecology’s Environmental Information Management (EIM) website at www.ecy.wa.gov/eim/index.htm. Search User Study ID: ToxLPh3F For more information contact: Washington Department of Ecology Water Quality Program PO Box 47600 Olympia, WA 98504 Phone: 360-407-6400 Work Assignment Information: 1. Firm: Ecology and Environment, Inc 2. Contract No.: C0700036 3. Project Name: Phase 3: Priority Pollutant Scans of Ten POTWs 4. Work Assignment Number: 025 Distribution List: James M. Maroncelli, Washington Department of Ecology Stuart A. Magoon, Washington Department of Ecology Andrew Hafferty, Ecology and Environment, Inc. Joy Michaud, Herrera Environmental Consultants John Lenth, Herrera Environmental Consultants
Adams
AsotinBenton
ChelanClallam
Clark
Columbia
Cowlitz
Douglas
Ferry
Franklin Garfield
Grant
GraysHarbor
Island
Jefferson
King
Kitsap
Kittitas
Klickitat
If you need this publication in an alternate format, please call the Water Quality Program at 360-407-6401. Persons with hearing loss can call 711 for the Washington Relay Service. Persons with a speech disability can call 877-833-6341.
Lewisc
Lincoln
Mason
Okanogan
Pacifi
PendOreille
Pierce
San Juan
Skagit
Skamania
Spokane
Stevens
Snohomish
Thurston
WahkiaWallaWalla
Whatcom
Whitman
Yakimakum
Northwest425-649-7000
Southwest360-407-6300
Eastern509-329-3400
Central509-575-2490
Headquarters (Lacey) 360-407-6000
RegionalOfficelocation
Spokane
Yakima
Lacey
Bellevue
Persons with a hearing loss can call 711 for Washington Relay Service.Persons with a speech disability can call 877-833-6341.

QAPP – Phase 3: Priority Pollutant Scans of Ten POTWs Page iii February 2009
Quality Assurance Project Plan Phase 3: Priority Pollutant Scans of Ten POTWs February 2009 Approved By: Signature Date
Andrew Hafferty, Project Manager, Ecology and Environment, Inc. Signature Date
Joy Michaud, Technical and Reporting Lead, Herrera Environmental Consultants Signature Date
David Ikeda, QA Lead and Senior Chemist, Ecology and Environment Inc. Signature Date
John Lenth, Project Sampling Lead, Herrera Environmental Consultants Signature Date
Jennifer Schmidt, Project Database Lead, Herrera Environmental Consultants Signature Date
James M. Maroncelli, Project Manager, Washington Department of Ecology
Page iv QAPP – Phase 3: Priority Pollutant Scans of Ten POTWs February 2009
Signature Date
Mike Herold, Water Quality Program, QA Coordinator, Washington Department of Ecology Signature Date
Stuart A. Magoon, Director, Washington Department of Ecology Signature Date
Robert Duff, Environmental Assessment Program Manager, Washington Department of Ecology Signature Date
Bill Kammin, QA Officer, Washington Department of Ecology

QAPP – Phase 3: Priority Pollutant Scans of Ten POTWs Page v February 2009
ableT
able
T
of Contents of Contents
Section Page Section Page
Abstract ...................................................................................................... 1 Abstract ...................................................................................................... 1
1 Introduction .................................................................................. 3 1 Introduction .................................................................................. 3 1.1 Background ..........................................................................................................3 1.1 Background ..........................................................................................................3 1.2 Previous Studies ...................................................................................................8 1.2 Previous Studies ...................................................................................................8
2 Project Description .................................................................... 11 2 Project Description .................................................................... 11
3 Organization and Schedule ....................................................... 15 3 Organization and Schedule ....................................................... 15 3.1 Organization .......................................................................................................15 3.1 Organization .......................................................................................................15 3.2 Schedule .............................................................................................................16 3.2 Schedule .............................................................................................................16
4 Experimental Design .................................................................. 17 4 Experimental Design .................................................................. 17
5 Health and Safety ....................................................................... 29 5 Health and Safety ....................................................................... 29
6 Measurement Procedures ......................................................... 31 6 Measurement Procedures ......................................................... 31
7 Quality Objectives ...................................................................... 33 7 Quality Objectives ...................................................................... 33
8 Quality Control Procedures ....................................................... 39 8 Quality Control Procedures ....................................................... 39 8.1 Field ....................................................................................................................39 8.1 Field ....................................................................................................................39 8.2 Laboratory ..........................................................................................................44 8.2 Laboratory ..........................................................................................................44
9 Data Verification, Review, and Validation ................................ 47 9 Data Verification, Review, and Validation ................................ 47 9.1 Data Verification ................................................................................................47 9.1 Data Verification ................................................................................................47 9.2 Data Quality (Usability) Assessment .................................................................47 9.2 Data Quality (Usability) Assessment .................................................................47 9.4 Data Management Procedures ............................................................................48 9.4 Data Management Procedures ............................................................................48 9.5 Audits and Reports .............................................................................................48 9.5 Audits and Reports .............................................................................................48
References ................................................................................................ 49 References ................................................................................................ 49

Page vi QAPP – Phase 3: Priority Pollutant Scans of Ten POTWs February 2009
A Scope of Work
B WWTP List
C POTW Selection Rationale
D POTW Project Gantt Chart
E Meeting Notes
F Avalanche Operating Instructions
G Field Activity Logbooks
H SOPs: Low Level Metals Water Sampling 1.0 Scope and Application .................................................................................... H-5 2.0 Method Summary ............................................................................................ H-5 3.0 Sample Preservation, Containers, Handling, and Storage ............................... H-5 4.0 Interferences and Potential Problems .............................................................. H-6 5.0 Equipment/Apparatus ...................................................................................... H-6 6.0 Reagents .......................................................................................................... H-7 7.0 Procedures ....................................................................................................... H-7
7.1 Preparation .......................................................................................... H-7 7.2 Sample Collection ............................................................................... H-8
7.2.1 Clean Hands and Dirty Hands Protocol Performed by One Field Technician ............................................................ H-8
7.2.2 Clean Hands and Dirty Hands Protocol Performed by Two Field Technicians .......................................................... H-8
8.0 Calculations ..................................................................................................... H-9 9.0 Quality Assurance/Quality Control ................................................................. H-9 10.0 Data Validation ............................................................................................... H-9 11.0 Health and Safety ............................................................................................ H-9 12.0 References ..................................................................................................... H-10
QAPP – Phase 3: Priority Pollutant Scans of Ten POTWs Page vii
February 2009
ist of L
ist of
Tables Tables
L
Table Page Table Page Table 1. Ten Representative POTWs .........................................................................................13 Table 1. Ten Representative POTWs .........................................................................................13
Table 2 Proposed Project Schedule ...........................................................................................16 Table 2 Proposed Project Schedule ...........................................................................................16
Table 3 Proposed Weekly Automated Sample Schedule ..........................................................24 Table 3 Proposed Weekly Automated Sample Schedule ..........................................................24
Table 4 Analytical Methods, Reporting Limits, and Quality Control Limits ...........................37 Table 4 Analytical Methods, Reporting Limits, and Quality Control Limits ...........................37
Table 5 Sample Volumes, Containers, Preservation and Holding Times for Target Analytes .......................................................................................................................40
Table 5 Sample Volumes, Containers, Preservation and Holding Times for Target Analytes .......................................................................................................................40
Table 6 Field Quality Control Samples for each Parameter monitored at POTWs ..................43 Table 6 Field Quality Control Samples for each Parameter monitored at POTWs ..................43
Table 7 Analytical Laboratory Quality Control Samples .........................................................45 Table 7 Analytical Laboratory Quality Control Samples .........................................................45

Page viii QAPP – Phase 3: Priority Pollutant Scans of Ten POTWs February 2009
ist of L
ist of
L
Figures Figures
Figure Page Figure Page Figure 1 POTW City Location Map ...........................................................................................14 Figure 1 POTW City Location Map ...........................................................................................14

QAPP – Phase 3: Priority Pollutant Scans of Ten POTWs Page ix February 2009
ist of L
ist of L
Abbreviations and Acronyms Abbreviations and Acronyms
oC degrees Celcius oC degrees Celcius
BEHP bis(2-ethylhexyl) phthalate BEHP bis(2-ethylhexyl) phthalate BNAs base/neutral/acid extractable compounds BNAs base/neutral/acid extractable compounds CPAHs carcinogenic polycyclic aromatic hydrocarbons CPAHs carcinogenic polycyclic aromatic hydrocarbons CSO combined sewer outfall CSO combined sewer outfall DDT dichlorodiphenyltrichloroethane DDT dichlorodiphenyltrichloroethane DQOs data quality objectives DQOs data quality objectives E & E Ecology and Environment, Inc. E & E Ecology and Environment, Inc. Ecology Washington State Department of Ecology Ecology Washington State Department of Ecology EIM Environmental Information Management database EIM Environmental Information Management database GC gas chromatograph GC gas chromatograph GC/ECD gas chromatography/electron capture detector GC/ECD gas chromatography/electron capture detector GC/ELCD gas chromatography/electrolytic conductivity detector GC/ELCD gas chromatography/electrolytic conductivity detector GC/HRMS gas chromatography/high resolution mass spectrometry GC/HRMS gas chromatography/high resolution mass spectrometry GC/MS gas chromatography/mass spectrometry GC/MS gas chromatography/mass spectrometry Herrera Herrera Environmental Consultants, Inc. Herrera Herrera Environmental Consultants, Inc. HPAHs high molecular weight polycyclic aromatic hydrocarbons HPAHs high molecular weight polycyclic aromatic hydrocarbons IDW investigation-derived wastes IDW investigation-derived wastes LCS laboratory control sample LCS laboratory control sample LPAHs low molecular weight polycyclic aromatic hydrocarbons LPAHs low molecular weight polycyclic aromatic hydrocarbons MBRs membrane bioreactor systems MBRs membrane bioreactor systems MEL Manchester Environmental Laboratory MEL Manchester Environmental Laboratory mgy million gallons per year mgy million gallons per year MS matrix spike MS matrix spike MSD matrix spike duplicate MSD matrix spike duplicate PAHs polycyclic aromatic hydrocarbons PAHs polycyclic aromatic hydrocarbons PARCC precision, accuracy, representativeness, completeness, and comparability PARCC precision, accuracy, representativeness, completeness, and comparability PBDEs polybrominated diphenyl ethers PBDEs polybrominated diphenyl ethers PCBs polychlorinated biphenyls PCBs polychlorinated biphenyls PFOAs perfluoroorganic acids PFOAs perfluoroorganic acids PFOSs perfluorosulfonates PFOSs perfluorosulfonates POTW Publicly-Owned Treatment Works POTW Publicly-Owned Treatment Works QA quality assurance QA quality assurance QAPP Quality Assurance Project Plan QAPP Quality Assurance Project Plan QC quality control QC quality control SIM selected ion monitoring SIM selected ion monitoring TEQ toxicity equivalency quotient TEQ toxicity equivalency quotient ug/L micrograms per liter ug/L micrograms per liter U.S. EPA United States Environmental Protection Agency U.S. EPA United States Environmental Protection Agency UV ultraviolet UV ultraviolet WWTP wastewater treatment plant WWTP wastewater treatment plant

Abstract This Quality Assurance Project Plan (QAPP) is provided for monitoring pollutants not routinely monitored in wastewater treatment effluent from 10 publicly owned treatment works (POTWs). The ten selected facilities represent various types of wastewater discharges in the Puget Sound Watershed. They were chosen to represent the range of treatment processes, discharge volumes, and sources (highly industrialized, urban, rural, etc.) as well as to cover different receiving waters within Puget Sound while remaining within the authorized budget for this work. Washington State Department of Ecology (Ecology) goals for this project are to (1) improve loading estimates for certain toxic chemicals, and (2) screen representative discharges for toxic chemicals not routinely monitored. Ecology expects the following outcomes from this project:
1. Improved estimates of loadings of pollutants from municipal wastewater dischargers due to improved detection limits and broader monitoring.
2. Additional POTW effluent input data to support operation of the Ecology Puget Sound Box Model.
This QAPP describes the objectives of the study and the procedures to be followed to achieve those objectives. After completion of the study, analytical data will be uploaded to Ecology’s Environmental Information Management database and a final report describing the results will be posted to Ecology’s website.
QAPP – Phase 3: Priority Pollutant Scans of Ten POTWs Page 1 February 2009

Introduction 1 The ongoing, multiphase Washington State Department of Ecology (Ecology) “Control of Toxic Chemicals in Puget Sound” project provided initial estimates of toxic loadings to Puget Sound (Phase 1). Those loading estimates are currently being improved in Phase 2. Future work, of which this project is one component, will target priority toxic sources for restorative action (Phase 3). This Quality Assurance Project Plan (QAPP) was prepared generally based on “Guidelines for Preparing Quality Assurance Project Plans for Environmental Studies” (Ecology, 2004a) and guidance provided by Ecology’s Project Manager and others during meetings and teleconferences (James Maroncelli, personal communications, Stuart Magoon, personal communications, Ecology 2008a, Ecology 2004b). This QAPP meets the requirements of the Ecology Scope-of-Work for this project which is presented in Appendix A. 1.1 Background
This section briefly describes Ecology’s ongoing, multiphase “Control of Toxic Chemicals in Puget Sound” project, Ecology’s link to the Puget Sound Partnership, and generic POTW operations.
Ecology and other groups including the Puget Sound Partnership (PSP 2008a) are working toward the overall goal of restoring the environmental health of Puget Sound by 2020. This multi-year effort requires development of strategies, actions, and performance measures for restoring the Puget Sound ecosystem (Ecology 2008b). Control of Toxic Chemicals in Puget Sound Project objectives include:
Identifying toxic chemicals of greatest ecological and human health concern for the Puget Sound marine ecosystem.
Estimating loadings of key contaminants from major pathways to all or selected portions of the Puget Sound marine ecosystem.
Describing the mass budget of toxic chemicals in the Puget Sound marine ecosystem, including characterizing toxic chemical loading, accumulation, and loss.
Evaluating the potential for reductions in toxic chemical loadings for major pathways.
Increasing understanding of the levels and sources of uncertainty in each phase of the characterization and evaluation.
QAPP – Phase 3: Priority Pollutant Scans of Ten POTWs Page 3 February 200
9

1. Introduction
Page 4 QAPP – Phase 3: Priority Pollutant Scans of Ten POTWs February 2009
Developing recommendations for appropriate uses of results and suggestions for data presentation to assure clear communication of the uncertainties.
Preparing a strategy that identifies the actions, practices, and policies necessary to protect and restore the overall health of the Puget Sound ecosystem.
Ecology’s Control of Toxic Chemicals in Puget Sound Project has three phases, which are described in the following subsections. The work identified in this Plan is one component of one of the Phase 3 tasks. A more detailed explanation of the work is included within the description of Phase 3 below.
Phase 1 - Initial Estimate of Toxic Chemical Loadings to Puget Sound Phase 1 of this project led to Ecology Publication No. 07-10-079, “Phase 1: Initial Estimate of Toxic Chemical Loadings to Puget Sound” (Hart Crowser, 2007). The Phase 1 study yielded estimates for the loadings of 17 chemicals (six metals, total polychlorinated biphenyls (PCBs), total polybrominated diphenyl ethers (PBDEs), polycyclic aromatic hydrocarbons (PAHs), carcinogenic polycyclic aromatic hydrocarbons (CPAHs), high molecular weight PAHs (HPAHs), low molecular weight PAHs (LPAHs), bis(2-ethylhexyl) phthalate (BEHP), total dioxin toxicity equivalency quotient (TEQ), total dichlorodiphenyltrichloroethane (DDT), Triclopyr, nonylphenol, and oil and other petroleum products) into the Puget Sound ecosystem. Sources included surface runoff, atmospheric deposition to the marine area of the watershed, some of the many permitted wastewater point source discharges, and direct spills to the watershed surface waters.
The report provided estimates of loadings from 14 hydrologic study areas of the Puget Sound Basin that corresponded to the ten regions of Puget Sound simulated by the Ecology Puget Sound Box Model. The report acknowledged the high uncertainty of the loading estimates and recommended collection of additional data.
Phase 2- Improve Loading Estimates
Phase 2 work builds on the initial Phase 1 investigation. Information has been and is being gathered to better understand and quantify sources of toxic contaminants to Puget Sound and to improve understanding of toxics movement within the ecosystem. Combined Phase 1 and Phase 2 information is critical for determining the priorities for actions to reduce and, whenever possible, avoid toxics-based harm to the Puget Sound ecosystem.
The Puget Sound Partnership identified Phase 2 toxics work that entailed the following eight tasks:
A: Improve loading estimates from roadways;
B: Improve loading estimates for publicly owned treatment works (POTWs) and industries;

1. Introduction
QAPP – Phase 3: Priority Pollutant Scans of Ten POTWs Page 5 February 2009
C: Improve loading estimates for sediments;
D : Identify and evaluate water column data for Puget Sound and its ocean boundary;
E: Conduct studies to support a human health risk assessment;
F: Upgrade a simple numeric model of Puget Sound (the Ecology Box Model);
G: Design a biological observing system for Puget Sound; and
H: Improve estimates of loading from biota.
Ecology has completed or will complete within the next two months projects and final reports for tasks A, B, C, D, and F. The U.S. Environmental Protection Agency, National Oceanographic and Atmospheric Administration, and Washington Department of Fish and Wildlife were responsible for completing tasks E, G, and H.
Ecology recently published its “Improved Estimates of Loadings to Puget Sound from Dischargers of Municipal and Industrial Wastewater”, Ecology Publication Number 08-10-089 (EnviroVision, 2008). This report focused on Task B above. The purpose of the study was to refine the wastewater loading estimates developed during Phase 1. This involved conducting a more thorough search for wastewater discharge data to represent a more complete list of wastewater facilities and a wider list of pollutants. This information was used to develop a database. The database was used to estimate the load of 137 toxic chemicals discharged from 124 wastewater facilities that discharge to Puget Sound. Study recommendations include further quantifying toxic chemical loadings from wastewater dischargers.
Phase 3- Targeting Priority Toxic Sources
Phase 3 continues the Puget Sound Partnership’s stewardship of Puget Sound with ongoing measurement and control of the sources of toxics to Puget Sound. Ecology will assess relative risks from toxics from specific sources, then select and implement actions to clean up and prevent contamination from sources that cause the highest risks to Puget Sound.
While the specific tasks identified below are currently part of Ecology’s strategy to control toxic chemicals in Puget Sound, the results of the Phase 1 and Phase 2 studies may lead to modifications of some of the tasks:
A: Quantify toxics from surface runoff;
C: Evaluate air deposition of fuel oil soot emissions from mobile sources;
D: Evaluate toxics exchange between Puget Sound and the Pacific Ocean;

1. Introduction
Page 6 QAPP – Phase 3: Priority Pollutant Scans of Ten POTWs February 2009
E: Refine the numeric model of toxics in Puget Sound, and evaluate pollution reduction scenarios;
F: Sample and analyze pollutants from ten representative POTWs;
H: Characterize PPCP loadings from POTWs;
and
J: Analyze toxics in selected biota and their effects on salmonids (four projects).
NOTE: There are no tasks B, G, or I.
This QAPP addresses Task F above. The specific goals for this are to (1) improve the loading estimates for certain toxic chemicals, and (2) screen representative discharges for toxic chemicals not routinely monitored.
Puget Sound Partnership
The Puget Sound Partnership (PSP 2008a) is a recently created state agency whose mandate is coordination and leadership of the effort to restore water quality in Puget Sound. One of the most significant early tasks of the Partnership was development of the “2020 Action Agenda” (PSP 2008b). The Agenda includes clear, measurable goals for the recovery of Puget Sound by 2020. Specifically, the Agenda sets goals, identifies strategies, prioritizes, and includes both long- and near-term actions and plans for cleaning up Puget Sound. The Partnership has identified four initial strategic priorities:
A: Ensuring that activities and funding are focused on the most urgent and important problems facing the Sound;
B: Protecting the intact ecosystem processes that sustain Puget Sound;
C: Implementing restoration projects that will reestablish ecosystem processes; and
D: Preventing the sources of water pollution.
While the Partnership does not have regulatory authority, its mandate includes (1) identifying entities responsible for restoring Puget Sound (for example, Ecology) and (2) ensuring that these entities receive state funding for work identified in the 2020 Action Agenda. The Partnership issued its “2020 Action Agenda” on December 1, 2008 (PSP 2008c).

1. Introduction
QAPP – Phase 3: Priority Pollutant Scans of Ten POTWs Page 7 February 2009
Publicly Owned Treatment Works Puget Sound Watershed The Puget Sound Watershed covers nearly 42,000 square kilometers in western Washington. Within that area, Ecology has identified 199 state-regulated facilities or outfalls and 54 U.S. EPA-regulated facilities that discharge wastewater to Puget Sound. Stormwater and general permittees are not included in this list. The list includes both direct discharges to Puget Sound as well as those facilities that discharge to lakes, streams, or rivers that in turn discharge to Puget Sound. Of these 253 facilities, 105 (42 percent) are municipal wastewater treatment facilities (publicly-owned treatment works). A complete list of these facilities is presented in Appendix B. The known or reported total volume of effluent discharged to Puget Sound from these individually permitted municipal wastewater treatment plants point sources is approximately 130,000 million gallons per year (mgy). 130,000 mgy is approximately 0.34 percent of the total inflow to Puget Sound from all the rivers and direct groundwater discharges in the watershed (Ecology 2008c). Wastewater Treatment Process Waste water from human activities is typically treated before it is released back into the environment. Waste water can include:
raw sewage from toilets, showers and sinks, including laundry, dish washing and food preparation discharges;
commercial, institutional and industrial waste water discharges (which may or may not undergo treatment prior to discharge to the sewer lines); and,
unless collected and conveyed separately, storm water run off from streets, roof tops and other impervious surfaces.
With the exception of isolated septic systems, waste water from residential, commercial and industrial areas is normally collected and conveyed to a waste water treatment plant (WWTP). Occasionally when large storm events occur where storm water and sanitary lines are combined, the influx of storm water can overwhelm the system and combined storm water and sewage streams in excess of capacity bypass are discharged to surface waters before they reach the WWTP. Once waste water reaches the WWTP it undergoes treatment before it is discharged to open waters or used for irrigation purposes in agricultural areas. The typical treatment process involves three stages: primary, secondary and tertiary. The primary stage is a mechanical process designed to remove solids and immiscible fats and oils. This is accomplished in large settling tanks (usually referred to as sedimentation tanks or primary clarifiers) where solids and immiscibles either float to the top or sink to the bottom. Preliminary screens may also be used to separate large objects before waste water enters the settling tanks.

1. Introduction
Page 8 QAPP – Phase 3: Priority Pollutant Scans of Ten POTWs February 2009
The top product is skimmed off with a raking mechanism and is processed for disposal. The bottom product (or sludge) is scraped into a hopper where it is further dewatered before disposal to a landfill, biosludge composter or waste fuel incinerator. Sludge can also be processed along with other compostable waste (grass clipping, leaves, food waste and some cardboard products) and sold as a biosolid fertilizer. The purpose of secondary treatment is to substantially degrade the biological or organic content of the liquid sewage effluent from the primary treatment process, typically using aerobic biological processes. The essential elements of this process are oxygen and biota, consisting of bacteria and protozoa that are capable of consuming the soluble organic contaminants (e.g., sugars, fats, and other hydrocarbons). The biota require a substrate where they can thrive and bind much of the less soluble fractions into floc. The floc is then separated from the waste water stream in secondary clarifiers, producing an additional sludge product that it processed in similar ways as the primary sludge product. Some facilities employ membrane bioreactor systems (MBRs) which produce effluents that exceed federal secondary treatment standards. Some WWTPs incorporate a tertiary treatment phase that typically uses chemical technology to further raise the effluent water quality before it is discharged to the environment. Multiple treatment processes can be employed, each with a specific target chemical. Nitrogen and phosphorus are two common targets of tertiary treatment, each involving a specific chemical treatment course. Disinfection (or “polishing”) is an additional step used to dramatically decrease the number of microorganisms. Prior to discharge to the environment treated wastewater requires disinfection to inactivate pathogens that were not destroyed earlier in the treatment process. The traditional and most common disinfection method is chlorination; however, ultraviolet (UV) and ozone treatments are also effective. 1.2 Previous Studies
Previous studies include the data published in Ecology’s “Phase 1: Initial Estimate of Toxic Chemical Loadings to Puget Sound” (Hart Crowser 2007). The Phase 1 study yielded estimates for the loadings of 17 chemicals (six metals, total PCBs), total PBDEs, CPAHs, HPAHs, LPAHs, BEHP, total dioxin TEQ, total DDT, Triclopyr, nonylphenol, and oil and other petroleum products) into the Puget Sound ecosystem. Sources included surface runoff, atmospheric deposition to the marine area of the watershed, some of the many permitted wastewater point source discharges, and direct spills to the watershed surface waters.
The report provided loadings for 14 hydrologic study units within the Puget Sound Basin used by Ecology in its Box Model. The report acknowledged the high uncertainty of the loading estimates (for example BEHP loading from wastewater treatment plants was based on a single analytical data point) and recommended collection of additional data. Simple models were identified that

1. Introduction
QAPP – Phase 3: Priority Pollutant Scans of Ten POTWs Page 9 February 2009
could be used to evaluate toxic chemical loadings into the Puget Sound ecosystem.
Ecology recently published its “Phase 2: Improved Estimates of Loadings to Puget Sound from Dischargers of Municipal and Industrial Wastewater” (Envirovision, 2008). This study refined and expanded wastewater loading estimates developed during Phase 1 to estimate the load of 137 toxic chemicals discharged from 124 wastewater facilities to Puget Sound.
Historically, POTW effluent testing has been limited to more conventional parameters, such as temperature and total dissolved solids. More recently, priority pollutants have been added to the list of analytes. However, testing is often infrequent and detection limits may not be adequate to quantify low level contaminants. This study includes analytes generally not tested for in treated POTW effluent and tests for them at low detection limits.

Project Description 2 Current processes used today to treat municipal wastewater do not result in the complete elimination of many pollutants. The goals of this project are to (1) improve the loading estimates for certain toxic chemicals, and (2) screen representative discharges for toxic chemicals not routinely monitored. The overall project objectives are to improve estimates of toxic chemical loadings from municipal wastewater dischargers due to improved detection limits and broader monitoring and provide additional POTW effluent input data to support operation of the Ecology Puget Sound Box Model. The project will evaluate concentrations of several organic contaminants and metals of concern in treated POTW effluent:
Polycyclic aromatic hydrocarbons (PAHs) Base/neutral/acid extractables (BNAs [semi-volatile organic compounds]) Pesticides Herbicides Polybrominated diphenyl ethers (PBDEs [congeners]) Perfluorooganic acids and perfluorosulfonates (PFOAs and PFOSs
[congeners]) Polychlorinated biphenyls (PCBs [congeners]), and Total metals (copper, lead and zinc).
Each of these chemicals or classes of chemicals are of concern for one or more of the following reasons:
• A considerable degree of uncertainty still exists regarding their loading estimates due to the limited (i.e., small or none) amount of data.
• Seasonal variations in the rates of toxic chemical loadings to Puget Sound
are generally not known.
• Relatively large analytical reporting limits for some of the toxic chemicals likely cause overestimates of their loadings when loading calculations employ half the values of the reporting limits.
QAPP – Phase 3: Priority Pollutant Scans of Ten POTWs Page 11 February 200
9

2.0 Project Description
Page 12 QAPP – Phase 3: Priority Pollutant Scans of Ten POTWs February 2009
Effluent samples will be collected from ten POTWs that discharge within the Puget Sound Watershed. One of the first tasks in this project was the assessment of the criteria and process Ecology used to identify the original list of 10 POTWs identified in its scope-of-work for treated effluent sampling. In creating this list, Ecology’s purpose was to identify 10 POTWs that represent the various types of wastewater discharges in the Puget Sound Watershed. Ecology used the assessment team’s suggestions to finalize the list of POTWs that are the subject of this project. The rationale for selecting POTWs is presented in Appendix C. The POTWs chosen for inclusion in this study are listed in Table 1. Figure 1 illustrates the general locations of the ten POTWs. One set of effluent samples will be collected representing higher flow conditions during the wet season (December through February), and one set will be collected reflecting lower flow conditions during the dry season (July through August).

2.0 Project Description
QAPP – Phase 3: Priority Pollutant Scans of Ten POTWs Page 13 February 2009
Table 1. Ten Representative POTWs
POTW Name
Permit ID Number
Geographic Region
Puget Sound Study Area
Mean Flow (MGD)
Treatment Process
Industrial Influent
Ecology Region
Gig Harbor WA0023957B South South Sound East 0.8 Secondary activated sludge with chlorine No NWR
Everett (deep outfall) WA0024490C North Port Gardner 10 Trickling filter Yes NWR
Burlington WA0020150 North Whidbey Basin 1.56 Activated sludge with UV disinfection No NWR
Sumner WA0023353C Central Commencement Bay 1.89 Activated sludge with UV disinfection & anaerobic sludge digestion
Small SWR
Shelton WA0023345C South South Sound East 2.13 Secondary activated sludge in oxidation ditch with chlorine No SWR
Bremerton WA0029289E Central Sinclair-Dyes Inlet 5.03 West Plant: Secondary activated sludge with chlorine Yes NWR
Bellingham WA0023744D North Strait of Georgia 12.1 Secondary oxygen-activated sludge with chlorine Yes NWR
Pierce County Chambers Creek WA0039624C South South Sound East 17.8 Secondary activated sludge (aerobic
& anoxic) with UV Small SWR
City of Tacoma (Central No.1) WA0037087B Central Commencement Bay 19.7 Secondary activated sludge with
chlorine Yes SWR
Metro West Point WA0029181E Central Main Basin 102 Secondary activated sludge with chlorine Yes NWR
Key: ID Identification. POTW Publicly Owned Treatment Works MGD - Million gallons per day SWR Southwest Region NWR - Northwest Region UV Ultraviolet

2.0 Project Description
Page 14 QAPP – Phase 3: Priority Pollutant Scans of Ten POTWs
February 2009
Figure 1 POTW City Location Map

Organization and Schedule 3 3.1 Organization Ecology and Environment, Inc. (E & E) together with Herrera Environmental Consultants (Herrera) reviewed data on Puget Sound Watershed POTWs, prepared an assessment and recommendations identifying POTWs for inclusion in this study (Appendix C), and developed this draft QAPP. E & E and Herrera staff will work jointly on sample collection, and reporting. Key staff assigned to this work and their responsibilities are shown in the following organization chart.
QAPP – Phase 3: Priority Pollutant Scans of Ten POTWs Page 15 February 200
9

3.0 Organization and Schedule
Page 16 QAPP – Phase 3: Priority Pollutant Scans of Ten POTWs February 2009
3.2 Schedule The anticipated deliverables and field sampling event schedule is summarized in Table 2. A detailed POTW Project Gantt Chart is included in Appendix D. Should there be any Ecology-approved changes in the schedule; this information will be relayed as soon as possible by the E & E project manager to Stuart Magoon of the Manchester Environmental Laboratory by telephone and email. Table 2 Proposed Project Schedule Deliverable/Activity Tentative Schedule Status Reports Monthly Draft QAPP Draft submitted December 5, 2008 Final QAPP February 4, 2009 Winter Sampling Event February 9-13, 2009 Winter Event Data Verification and Validation
May 11, 2009
Winter Event Data Entry into EIM
June 1, 2009
Summer Sampling Event July 13-17, 2009 Summer Event Data Verification and Validation
October 12, 2009
Summer Event Data Entry into EIM
October 26, 2009
Draft Technical Report October 30, 2009 Final Technical Report December 14, 2009
Key: EIM Environmental Information Management Database QAPP Quality Assurance Project Plan
Experimental Design 4 Project Tasks Task descriptions are provided below. The list of tasks reflects the Ecology Scope of Work provided in Appendix A as modified by Ecology during development of this project. Task 1: Preparation Task 1 includes meetings with Ecology for general project orientation and project start-up, obtaining data required for the project, coordinating assumptions and methods to ensure that estimates of toxic chemical loadings are credible, and participating in ad hoc meetings to address encountered problems and their solutions. A kick-off meeting was held on November 12, 2008 at Ecology headquarters in Lacey Washington. A meeting to discuss the draft QAPP was held on January 12, 2009 at Ecology headquarters in Lacey, Washington. Summaries of the meetings are presented in Appendix E. As noted earlier, work began by assessing the criteria and process Ecology used to develop its original proposed list of 10 publicly-owned treatment works (POTWs) identified for inclusion in this study. Results of this assessment are presented in Appendix C. This QAPP with detailed scope of work has been prepared in accordance with Ecology formatting requirements, including a detailed description of the sampling procedures and an approach and rationale for addressing non-detect values. Coordination with POTW operators to establish sampling locations, available on-site resources, and a tentative schedule is occurring concurrently with QAPP preparation. E & E has addressed Ecology comments on the draft QAPP submitted December 5, 2008 and is providing this final QAPP for Ecology’s approval. Task 2: Sample Collection Ecology has not issued formal guidance unique to sampling of POTW effluent. The approach to sampling detailed herein is based on previously published documents for collecting effluent samples from POTWs within the Puget Sound
QAPP – Phase 3: Priority Pollutant Scans of Ten POTWs Page 17 February 200
9

4.0 Experimental Design
Page 18 QAPP – Phase 3: Priority Pollutant Scans of Ten POTWs February 2009
Region (e.g., Katz et al, 2004 and Ecology, 2004b), Water Quality Program Inspection Manual (Ecology, 1992) and guidance in Standard Methods for the Examination of Water and Wastewater (APHA 2005). Throughout the course of each sampling event, proper sample collection, handling, preservation, transport, and custody procedures will be followed. Sampling involves collecting one, 24-hour, time-weighted composite sample of final effluent from each of 10 POTWs. One set of samples will be collected representing higher flow conditions during the wet season (December through February), and one set will be collected reflecting lower flow conditions during the dry season (July through August). E & E will work with Ecology, Manchester Environmental Laboratory (MEL) and POTW personnel to finalize sampling dates corresponding to low- and high-flow conditions at the POTWs for each of these sampling events. Tentative dates for effluent sampling shown below have been established but will be confirmed with the Ecology project manager prior to mobilizing to the field.
Wet season February 9 through 13, 2008 Dry season July 13 through 17, 2009
The sampling approach for this project will rely primarily on using automated equipment for all analytes; except PFOAs and PFOSs, and metals, which will be collected by hand as two discrete grab samples which will be composited. The grabs will be collected twice from each POTW; once in the morning in the period between 2 and 8 AM and once in late morning or early afternoon between 10:00 AM and 3:00 PM to capture both the time of expected lower concentrations and higher concentrations. The key advantages of this design are that samples from all 10 POTWs can be collected within a short timeframe, reflecting similar flow conditions and entailing lower costs. Samples will be collected at equal time intervals. Additional data will be collected from each POTW to document operating conditions at the time of sampling, including:
sludge dewatering time CSO input retention time sludge age design flow rates recent actual seasonal average flow rates recent actual annual flow rates description of any plant upsets that may have occurred during sampling description of whether any backflushing occurred during sampling flow during sampling.

4.0 Experimental Design
QAPP – Phase 3: Priority Pollutant Scans of Ten POTWs Page 19 February 2009
Sampling will be performed by two field teams (designated A and B in Table 3). The same two field teams will sample all 10 POTWs over a 1-week period as shown on the schedule in Table 3. Since one objective of the study is to assess POTWs with industrial influent, and because the industrial facilities may not follow a 7-day work week, the schedule was designed such that all POTWs are sampled during a standard (Monday through Friday) work-week. The schedule also reflects the most efficient use of the two teams in relation to the locations of the facilities. Field teams will retain schedule flexibility, especially for the winter sampling, since Ecology may want to re-schedule if floods (combined sewer outfall [CSO] events) are predicted for the sampling week. Similarly, Ecology may want to avoid monitoring during unusually dry winter weather conditions. Under this sampling approach, automated samplers are used to collect samples for all chemical pollutants except PFOAs and PFOSs, and metals. Since Teflon suction tubing and other components of the automated samplers are a potential source of contamination for PFOAs and PFOSs, grab samples will be collected and used to measure concentrations of these chemicals. Similarly, metals samples will be collected using Teflon equipment to help minimize contamination from the glass components of the automated samplers. Specifically, two grab PFOA/PFOS and two metals samples will be collected and composited from each POTW during wet season events and dry season events. To meet data quality objectives during sample collection, field teams will use a modified single-person “Clean Hands Dirty Hands” technique when handling samples. To facilitate collection of time-weighted composite samples, the following activities will be performed during each sampling event:
1. Sampling teams will deploy one Avalanche® or equivalent refrigerated portable autosampler at pre-selected, representative locations (chosen based on advance coordination with the POTW operators) within each POTW accessing the final effluent stream. Each autosampler will be configured with one pre-cleaned 9 Liter glass jar. Pre-cleaned Teflon-lined suction tubing from each sampler will be suspended within the effluent stream to draw representative sample aliquots. Avalanche® refrigerated portable autosampler operating instructions are presented in Appendix F.
2. PFOA and PFOS aliquots will be collected as two hand-composited grab
samples. Sampling teams will collect a one liter effluent sample during initial set up of the automated samplers, and one liter the following day when the equipment is removed. The collection of these two samples will be timed to ensure one represents early morning hours (2:00 to 8:00 AM) and one represents early to mid-afternoon hours (10:00 to 3:00) .These samples will be composited into one bottle at the POTW site. MEL will provide pre-cleaned, one liter sample bottles for this task.

4.0 Experimental Design
Page 20 QAPP – Phase 3: Priority Pollutant Scans of Ten POTWs February 2009
3. Metals aliquots will be collected as two hand-composited grab samples. Sampling teams will collect a one-half liter effluent sample during initial set up of the automated samplers, and one-half liter the following day when the equipment is removed. The collection of these two samples will be timed to ensure one represents early morning hours (2:00 to 8:00 AM) and one represents early to mid-afternoon hours (10:00 to 3:00) .These samples will be composited by MEL personnel who will also provide pre-cleaned sample bottles for this task.
4. After each autosampler is deployed at the site, but before automated sampling is initiated, the volume calibration routine will be run on the sampler to insure the sampler is correctly calibrated to collect the appropriate sample volume.
5. Automated samplers at each POTW will be programmed to initiate
sampling soon after arrival at the site. The automated samplers will be programmed to collect 175 mL every half-hour over a 24 hours period. The samplers will be programmed to perform a single sample rinse before each new sample aliquot is collected. In total, 24 hours will have elapsed from the initiation of sampling to the time the last sample is collected by the automated sampler.
6. Sampling teams will terminate sampling at each POTW and transport
bottles to Ecology headquarters where they will be stored in a refrigerated condition until pick up by MEL couriers. All samples will reach Ecology’s MEL within the maximum holding times for the targeted analytical procedures. Teams will follow chain-of-custody procedures documented in this QAPP. Sampling teams will utilize detailed field data forms and logbooks to record pertinent information.
7. Hourly flow rates will be obtained from the POTW operators for the
sampling interval at each POTW.
8. No field compositing will be required for the sample collected by the automated sampler. The glass jar will be sealed with a Teflon lid and placed in a ice-filled cooler. Once the jar has been sealed and stored, the autosampler will be set to manually collect a sample into a graduated cylinder to verify the sample volume calibration. This will be done 5 times and the volume collected each time will be documented in the field notes.
9. MEL will provide pre-cleaned sample bottles for collection of the
PFOA/PFOS and metals samples. MEL will provide pre-cleaned “glassware” and measuring equipment for compositing samples. Project documentation will include a table indicating time interval, flow rate, and volume collected for each of the 24 sample aliquots included in the

4.0 Experimental Design
QAPP – Phase 3: Priority Pollutant Scans of Ten POTWs Page 21 February 2009
composite sample and for the two grab samples collected for PFOA/PFOS and metals samples.
10. If insufficient sample is collected, or the laboratory has problems with
sample processing, the priority for analysis for the time-weighted composite sample will be as follows:
Polychlorinated biphenyls (PCBs [congeners]), Pesticides Herbicides Polybrominated diphenyl ethers (PBDEs [congeners]) Polycyclic aromatic hydrocarbons (PAHs) Base/neutral/acid extractables (BNAs [semi-volatile organic compounds])
The following analytes will be collected separately and do not require prioritization:
Perfluorooganic acids and perfluorosulfonates (PFOAs and PFOSs [congeners])
and Total metals (copper, lead and zinc).
11. Field Sample Naming Convention – Time weighted composite samples
will be will be labeled using the following convention
• “POTW name” – “date” – “comp” – “sample type” - “POTW name” = name of the POTW;
- “date” = date sampling was initiated (mm/dd/yyyy) - “start time” = 24-hour clock time each individual sample aliquot collection began will be recorded but not included in the sample ID; - “end time” = 24-hour clock time each individual sample aliquot collection finished will be recorded but not included in the sample ID; and
- “comp” = composite (24 hour time weighted composite for automated samples or sampling interval required to collect adequate sample volume for each grab sample); and
- “sample type” = type of sample (A for automated, GP for PFOA/PFOS grabs, or GT for metals grabs, followed by B for field rinsate blank, or D for field duplicate.
Using this convention an example sample number is “Sumner-02092009-comp-GP for a composited PFOA/PFOS grab sample collected on February 9, 2009 at the Sumner POTW. Duplicate samples will provide adequate volume for all required QC analyses. Separate duplicates will not be required for metals analyses since each 500 ml bottle contains sufficient volume for these tests.

4.0 Experimental Design
Page 22 QAPP – Phase 3: Priority Pollutant Scans of Ten POTWs February 2009
12. Sample labels Sample labels/tags attached to the sample container will be used to
identify all samples collected in the field. Sample information will be printed legibly. Field identification will be sufficient to enable cross-reference with the project field sheets. For chain-of-custody purposes, all quality assurance/quality control (QA/QC) samples will be subject to the same custodial procedures and documentation as site samples.
In the field, the sample label will be filled out completely using waterproof ink, then attached firmly to the sample containers and protected with clear tape.
Laboratories will be provided composite sample containers. Composite sample labels will be filled out completely using waterproof ink, then attached firmly to the sample containers and protected with clear tape.
11. Custody Seals Custody seals are preprinted gel-type seals, designed to break into small pieces if the seals are disturbed. Sample storage and shipping containers (e.g., coolers, drums, and cardboard boxes, etc., as appropriate) will be sealed in as many places as necessary to ensure security. Seals will be signed and dated before use. Clear tape will be placed over the seals to ensure that seals are not broken accidentally during shipment. Upon receipt at the laboratory, the custodian will check (and certify by completing the package receipt log) that seals on shipping containers are intact.
12. Chain-of Custody in the Field To the extent possible, custody seals will be applied to automated sampling equipment left unattended in the POTWs. Similarly, any sample aliquots stored temporarily at the POTWs will be secured with custody seals as noted above.
13. Chain-of-Custody/Analytical Request
For composite samples to be analyzed at MEL, the chain-of-custody record, analyses required forms, and/or analytical traffic report forms will be completed as described in the Manchester Environmental Laboratory Lab Users Manual (MEL, 2005). The chain-of-custody record, analyses required forms, and analytical traffic reports will be completed fully at least in duplicate by one field technician and checked by the other field team member. Information specified on the chain-of-custody record will contain the same level of detail found in the site logbook. The custody record will include the following information:
Name and company or organization of the person collecting the
samples Project name

4.0 Experimental Design
QAPP – Phase 3: Priority Pollutant Scans of Ten POTWs Page 23 February 2009
Project code Method of shipment Account code Ecology project manager name Type of sampling conducted (composite or grab) Ecology sample number Sampling date and time Matrix code Number of containers Preservative type Sampler Initials Station Description Analyses requested; and Signature of the person relinquishing samples to the transporter,
with the date and time of transfer noted and signature of the designated sample custodian at the receiving facility.
The relinquishing individual will record all shipping data (e.g., air bill number, organization, date, and time) on the original custody record, which will be transported with the samples to Ecology’s headquarters and retained in the laboratory’s file. Original and duplicate custody records, together with the air bill or delivery note, constitute a complete custody record. It is the lead sampler’s responsibility to ensure that all records are consistent and that they become part of the permanent job file. Since MEL will not be conducting all analyses in-house, aliquots of composites will be shipped to laboratories subcontracted to Ecology/MEL. MEL will be responsible for preparing the chain-of-custody/analytical requests for these samples, all shipping, and any required interactions with all subcontracted laboratories. MEL personnel will prepare the aliquots required for shipment. 14. Investigation-Derived Waste (IDW) Field team members will make every effort to minimize the generation of IDW throughout the field effort. Disposable personal protective clothing generated during field activities will be rendered unusable by tearing (when appropriate), bagged in opaque plastic garbage bags, and disposed as solid waste. All wastes will be bagged and properly disposed of at either the POTW where they were generated or the MEL. Residual effluent left after compositing will be emptied into the sewer system at MEL. Bottles and measuring equipment will be decontaminated by rinsing with household strength bleach then washing with soap and water and rinsing with potable water; or washed using the MEL’s laboratory glassware washing equipment designed specifically to clean glassware for use in the laboratory. Liquid wastes will be treated the same as residual effluent.

4.0 Experimental Design
Page 24 QAPP – Phase 3: Priority Pollutant Scans of Ten POTWs February 2009
Table 3 Proposed Weekly Automated Sample Schedule Sampling Team
POTW
Initiate Sampling – Collect Grabs (time – 24 h)
Terminate Sampling – Collect Grabs (time – 24 h)
Sample Delivery to Laboratory (time – 24 h)
A Shelton Monday(7) Tuesday (7) Wednesday AM
A Bremerton Monday (9) Tuesday (9) Wednesday AM
A Gig Harbor Monday (11) Tuesday (11)
Wednesday AM
B Bellingham Monday (7) Tuesday (7) Wednesday
AM B Burlington Monday (10) Tuesday
(10) Wednesday AM
A Pierce Co.
Chambers Creek
Wednesday (7) Thursday (7)
Friday AM
A Sumner Wednesday (9) Thursday (9)
Friday AM
A City of Tacoma Central
Wednesday (11) Monday (11)
Friday AM
B Metro West
Point Wednesday (7) Thursday
(7) Friday AM
B Everett (Deep outfall)
Wednesday (9) Thursday (9)
Friday AM
Key: H hour POTW Publicly owned treatment works
Note: Times are approximate. Task 3: Laboratory Analyses According to the Scope of Work, Ecology will arrange for the Manchester Environmental Laboratory (MEL) to analyze the wastewater samples for the toxic chemicals listed in Appendix A to sensitivities at least as great as those indicated. MEL will subcontract with specialty laboratories as necessary for some analyses. All analyses will be done by Washington State-accredited laboratories, if possible. Laboratories will provide the analytical results, including summary data sheets and all raw data, electronically (in Excel, Access, and EIM formats) to Ecology who will forward them on to E & E. MEL will verify that subcontract

4.0 Experimental Design
QAPP – Phase 3: Priority Pollutant Scans of Ten POTWs Page 25
laboratories have the capabilities to conduct the specialty analyses with the specified methods and reporting limits. The E & E QA Lead will coordinate analytical work with MEL prior to the field events as well as verify sample data delivery from the laboratories after each field event. PCBs will be collected from 6 POTWS during the winter sampling event only; due to budget constraints: Metro West Point
Everett (deep outfall) City of Tacoma Central #1 Pierce County Chambers Creek Bremerton Shelton
These six POTWs include the four largest plus Bremerton (where the Navy handles PCBs) and Shelton (where infiltration and inflow is a significant factor). The E & E Team discussed project data quality objectives with the director of the MEL and confirmed the specifications for laboratory QA/QC (e.g., QC samples), holding times, sample volume requirements, laboratory capacity, and potential technical concerns such as field contamination noted in this QAPP. Task 4: Reporting Data validation and database activities The E & E project QA Lead will review and validate the analytical data to verify they meet project data quality objectives and to identify any limitations of the data, following the process outlined in Ecology QA1 review guidelines (PTI 1989). These data will be reviewed by comparing calibration, accuracy, and precision results to the quality control criteria listed in the method, the laboratory SOP, and the QAPP. If no QA guidelines exist for specific analytes, then applicable U.S. Environmental Protection Agency (EPA) National and Regional Data Review guidelines will be used. The E & E Team will enter data into Ecology’s Environmental Information Management (EIM) database and the electronic Access database created during the Phase 2 project. Pollutant Load Calculations E & E will use the same equation as used during the Phase 2 study to calculate average daily loading rates for each pollutant for each POTW. These loading rates will be calculated for both winter and summer sampling periods as well as an average annual loading rate.
The following equation will be used in calculating loading rates:
∑ ∑+=i
unsampledmedianiimunicipal QCCQL
∑=j
jjindustrial CQL
Where: Qi and Ci = individual municipal concentrations and flows;
February 2009

4.0 Experimental Design
Page 26 QAPP – Phase 3: Priority Pollutant Scans of Ten POTWs February 2009
Qj and Cj = individual industrial flows and concentrations;
Cmedian = median municipal concentration; Qunsampled = unsampled municipal flows; Lmunicipal and Lindustrial = municipal and industrial loading rates,
respectively.
To account for the impact of non-detect values on the results, we will repeat these calculations three times, handling the non-detect values in three different ways:
• For a high estimate of loading, we will assign non-detect values at the method reporting limit if it is available. If the method reporting limit is not available, we will assign these the method detection limit value.
• For an intermediate estimate of loading, we will assign non-detect values a value of ½ the method reporting limit if available. If the method reporting limit is not available, we will assign them ½ the method detection limit.
• For the lowest estimate of loading, zeros will be assigned to non-detect values.
This is the same method followed in the Phase 2 study. There are more rigorous methods for assigning values to analytes that are not measured above detection limits however they each require an adequate data set to allow for statistical analysis. Statistical testing is limited since only 2 samples will be collected from each POTW. Report Preparation The E & E Team will prepare a draft summary report of the project; including (1) descriptions of the sampling and analytical methods; (2) evaluation of the data quality; (3) analysis comparing the analytical data among the facilities relative to the treatment technologies in use and the flow rates on the days of sampling; (4) estimates of the loadings of toxic chemicals from the 10 POTWs revised from the estimates provided by the Phase 2 project (Ecology, 2008c); (5) conclusions; and (6) recommendations. The report will address (1) potential revisions to the loading estimates for other point source wastewater dischargers in the Puget Sound Watershed; (2) quantities and relative contributions of toxic chemicals discharged to Puget Sound from POTWs in different areas of the Puget Sound Watershed; (3) comparison of the results from Phase 2 with those of this project; (4) reasons for any differences; and (5) limitations of the available data and the data gaps that must be filled to justify selection and implementation of control actions that will reduce the amount of toxic chemicals released to Puget Sound.

4.0 Experimental Design
QAPP – Phase 3: Priority Pollutant Scans of Ten POTWs Page 27 February 2009
POTW operators will be requested to provide seasonal average and annual average flow data for inclusion in the Technical Report. Data from the field events will be compared to these longer term flow data. Loading estimates will be in a format compatible with and usable within Ecology’s Puget Sound Box Model. The E & E Team will meet with Ecology to review comments on the draft summary report. The format and style of the summary report will be in accordance with Ecology requirements. The summary report will conform to agency PlainTalk guidelines, employ primarily the active voice, use 12-point font, be printed double-sided (hardcopy), and use Microsoft Word and Excel software (electronic version). Other Deliverables E & E will keep Ecology apprised of its progress during conference call meetings once every two weeks, except during months when no project activity takes place (i.e., between the first and second sampling events). E & E will submit monthly written progress reports along with its invoices. Progress reports and invoices will contain applicable information as listed in Ecology’s Contract with E & E, and will be submitted via email to Mr. James Maroncelli.
Health and Safety 5 The field work identified in this plan requires careful consideration of health and safety, including:
Physical hazards associated with working in operating POTWs Chemical hazards related to treated sewage effluent collection and
handling Biological hazards related to treated sewage effluent collection and
handling Safe driving
A Health and Safety Plan will be prepared for this work. Decontamination Procedures To the greatest extent possible, disposable and/or dedicated personal protective and sampling equipment will be used to avoid cross-contamination. When required, decontamination will be conducted at the MEL. Pre-cleaned sample bottles will be provided by MEL for the metals and PFOA/PFOS samples. Autosamplers and associated bottles and auxiliary tubing will be cleaned at an outside laboratory facility before use in the field. Tubing and bottles will be washed with soap and rinsed with tap water, rinsed with 20% HCL, rinsed with tap water, rinsed with distilled water, and a final rinse with ultra-grade acetone and then allowed to air dry. Aluminum foil will be placed over each end of the tubing and retained with a zip tie and the tubing placed in a protective bag until deployment at the POTW. Pump tubing internal to the autosampler will be washed with soap and hot water, rinsed with 20% HCL, rinsed with tap water, and finally rinsed with deionized water.
QAPP – Phase 3: Priority Pollutant Scans of Ten POTWs Page 29 February 200
9

Measurement Procedures 6 Ecology will arrange for the MEL to analyze the wastewater samples for the majority of toxic chemicals listed in Appendix A. Ecology/MEL will subcontract directly with specialty laboratories required for testing which the MEL will not conduct. The analytical methods and reporting limits for all target analytes are also shown in Appendix A. BNAs and Herbicides will be analyzed using USEPA SW-846 Method 8270. Samples will be analyzed by gas chromatography/mass spectrometry (GC/MS) following extraction and, if necessary, appropriate sample cleanup and derivatization procedures. Sample extracts are injected into a gas chromatograph (GC), equipped with a capillary column, which utilizes a temperature program to separate analytes which are then detected with a mass spectrometer (MS). Analytes are identified by comparing electron impact spectra to the spectra of known standards. Analytes are quantified by comparing the response of a major ion relative to an internal standard using a calibration curve developed for each GC/MS. PAHs will be analyzed using USEPA SW-846 Method 8270 SIM. Method 8270 SIM is a modification of method 8270. SIM, Selected Ion Monitoring, enhances sensitivity by setting the MS to detect specific ions rather than a range of ions. Sensitivity is generally increased by a factor of ten over standard MS measurements. The primary disadvantage of SIM is a loss of qualitative information (unable to compare spectra). Pesticides will be analyzed using USEPA SW-846 Method 8081. Samples will be analyzed by gas chromatography/electron capture detector (GC/ECD) following extraction and, if necessary, appropriate sample cleanup procedures. Sample extracts are injected into a GC, equipped with a capillary column, which utilizes a temperature program to separate analytes which are then detected with either an electron capture detector (ECD) or electrolytic conductivity detector (ELCD). Analytes are identified by comparing the retention time of target compounds with retention times of known standards on two
QAPP – Phase 3: Priority Pollutant Scans of Ten POTWs Page 31 February 2009

6.0 Measurement Procedures
Page 32 QAPP – Phase 3: Priority Pollutant Scans of Ten POTWs February 2009
dissimilar columns. Analytes are quantified by comparing the sample peak response using a calibration curve developed for each target compound. PBDEs and PCBs will be analyzed using EPA method GC/HRMS 1668 Samples will be analyzed using gas chromatography/high resolution mass spectrometry (GC/HRMS) following extraction and, if necessary, appropriate sample cleanup procedures. Sample extracts are injected into a GC, equipped with a capillary column, which utilizes a temperature program to separate analytes which are then detected with a HRMS. Congeners are identified by comparing the retention time and ion-abundance ratio of target compounds and associated labeled analog compounds with retention times and ion-abundance ratio of known standards. Congeners are quantified using the isotopic dilution quantitation technique, comparing the area of the quantification ion to that of the 13C-labelled standard and correcting for response factors PFOAs and PFOSs will be analyzed using AXYS method MLA-060 Samples will be analyzed by liquid chromatography-tandem mass spectrometry (LC/MS/MS) following solid phase extraction and selective elution procedures. Sample extracts are analyzed on a high performance liquid chromatograph coupled to a triple quadrapole mass spectrometer. Target compounds are quantified using the internal standard method, comparing the area of the quantification ion to that of the 13C-labelled standard and correcting for response factors. Metals will be analyzed using EPA Method 200.8 Samples will be analyzed by Inductively Coupled Plasma-Mass Spectrometry (ICP-MS) following acid extraction. Sample extracts injected into the ICP-MS are quantified by comparing instrument response to a calibration curve developed for each analyte. Results will be reported for total (unfiltered) copper, lead and zinc.

Quality Objectives 7 The data quality objectives (DQOs) for this project are presented below identifying the seven steps taken to develop this QAPP. 1. State the Problem – Recent reviews of available priority pollutant monitoring data found that little information exists about the actual discharges of several key organic pollutants to the Puget Sound Watershed (Ecology, 2007; Ecology, 2008c). Findings identified data gaps for the following classes of chemical pollutants:
Polycyclic aromatic hydrocarbons (PAHs) Phthalates (exemplified by bis(2-ethylhexyl)phthalate) Hormone disrupting chemicals (exemplified by nonylphenol and some
phthalates) Polybrominated diphenyl ethers (PBDEs) Pesticides and herbicides (particularly current use chemicals, such as
triclopyr) Perfluoroorganic acids and Perfluorosulfonates (PFOAs and PFOSs) PCBs Metals
Available data indicate total loadings of some toxic chemicals to Puget Sound are greater from municipal wastewater treatment plants than from NPDES-permitted industrial wastewater dischargers. 2. Identify the Decision – Are the priority pollutants listed above being released from POTWs into the Puget Sound Watershed? Do treatment technology, source type, and flow impact these priority pollutants and their concentrations in treated effluent? Should previous estimates of POTW loadings for these compounds into Puget Sound be revised? Can the Puget Sound Box Model be updated if improved (additional analytes, lower detection limits) effluent data are available? Results together with all the other Control of Toxic Chemicals in Puget Sound study data may be used in the future by regulators to justify selection and implementation of control actions that will reduce the amount of toxic chemicals released to Puget Sound.
QAPP – Phase 3: Priority Pollutant Scans of Ten POTWs Page 33
February 200
9
7.0 Quality Objectives
Page 34 QAPP – Phase 3: Priority Pollutant Scans of Ten POTWs February 2009
3. Identify the Inputs to the Decision – Treated effluent samples will be collected from ten representative POTWs during different seasons. Time weighted composite samples will be analyzed for PAHs, BNAs (which include phthalates and other contaminants of concern), pesticides, herbicides, PBDEs and PCBs, Composites of two grab samples will be analyzed for PFOAs/PFOSs, and total metals 4. Define the Boundaries of the Study – One 24-hour, time-composited final effluent samples will be collected from each of 10 POTWs with the exception of PCBs. PCBs will be collected from 6 POTWS during the winter sampling event only; due to budget constraints. One set of samples will be collected representing higher flow conditions during the wet season (December 2008 through February 2009), and one set will be collected reflecting lower flow conditions during the dry season (July 2009 through August 2009). The ten POTWS cover a range of treatment technologies, source types, source volume, and geographic distribution within the Puget Sound Basin.
5. Develop a Decision Rule – If additional analytes and low detection limits data can be generated, then improved estimates of toxics loadings from municipal wastewater dischargers can be made and additional input data will be available to support operation of Ecology’s Puget Sound Box Model. The data generated in this study will be added to other data and evaluated by Ecology and the Puget Sound Partnership in order to improve implementation of its 2020 Action Agenda. 6. Specify Tolerable Limits on Decision Errors – Sampling should be conducted following guidance appropriate for effluent sampling and analyses, e.g., Standard Methods for the Examination of Water and Wastewater (APHA 2005). Analyses should be conducted using standard methods by Ecology-approved analytical laboratories (alternate laboratories may be used with Ecology approval). Analytical data should meet standard quality control criteria (EPA 1999, EPA 2004). 7. Optimize the Design for Obtaining Data – This Quality Assurance Project Plan presents the design for conducting priority pollutant scans of effluent at ten representative POTWs during periods of higher and lower annual flow. Acceptance and performance criteria are often specified in terms of the precision, accuracy, representativeness, completeness, and comparability (PARCC) parameters. Numerical acceptance criteria cannot be assigned to all PARCC parameters, but general performance goals are established for most data collection activities. PARCC parameters are briefly defined below.
Precision Precision measures the reproducibility of measurements under a given set of conditions. Specifically, it is a quantitative measure of the variability of a group of measurements compared to their average value, usually stated in terms of standard deviation or coefficient of variation. It also may be measured as the

7.0 Quality Objectives
QAPP – Phase 3: Priority Pollutant Scans of Ten POTWs Page 35 February 2009
relative percent difference (RPD) between two values. Precision includes the interrelated concepts of instrument or method detection limits (MDLs) and multiple field sample variance. Sources of this variance are sample heterogeneity, sampling error, and analytical error.
Accuracy Accuracy measures the bias of the measurement system. Sources of this error include sampling process, field contamination, preservation, handling, sample matrix, sample preparation, and analysis. Data interpretation and reporting may also be significant sources of error. Typically, analytical accuracy is assessed through the analysis of spiked samples and may be stated in terms of percent recovery or the average (arithmetic mean) of the percent recovery. Blank samples are also analyzed to assess sampling and analytical bias (i.e., sample contamination).
Representativeness Representativeness expresses the degree to which data represent a characteristic of a population, a parameter variation at a sampling point, or an environmental condition over time. Representativeness is a qualitative parameter, which is most concerned with proper design of the measurement program. Sample/measurement locations may be biased (judgmental) or unbiased (random or systematic). For unbiased schemes, the sampling must be designed not only to collect samples that represent conditions at a sample location, but also to select sample locations that represent the total area to be sampled. Representativeness also embodies the concept of temporal (for example, seasonal) variations in parameters or conditions.
Completeness Completeness for sample collection is defined as the percentage of specified samples listed in the QAPP that were actually collected. The completeness goal shall be 90% for this project. Completeness for acceptable data is defined as the percentage of acceptable data out of the total amount of data generated. Acceptable data includes data that passes all QC criteria or data that may not pass all of the QC criteria but has appropriate corrective actions taken.
Comparability Comparability is a qualitative parameter expressing the confidence with which one data set may be compared to another. Sample data should be comparable with other measurement data for similar samples and sample conditions. This goal is achieved through the use of standard techniques to collect and analyze samples.
Analytical quality objectives for each method are summarized in Table 8. Reporting limits are the practical quantitation limits attainable with these methods. Ranges are presented for some analyte groups due to the large number of compounds analyzed. Analyte specific reporting limits are presented in Appendix A

7.0 Quality Objectives Table 4 Analytical Methods, Reporting Limits, and Quality Control Limits Priority Pollutant Scans for 10 POTWs – Laboratory Quality Control Limits Analysis Method
Prepar-ation Method
Para-meter
Reporting Limit (ug/L)
MS/MSD %R
MS/MSD RPD
Calibration %RSD†††
CCV LCS Others (specify) Surrogate %Recovery
8270 SIM 3510 PAHs 0.01 ** see below
** see below
† see below ±15% 40-140 20-200
8270 3510 BNAs 0.1 - 2 50-150 40 † see below ±20% 50-150 *see below 8270 3535 or
3510 Herbi-cides
0.08 40-130 40 † see below ±20% 40-130 40-130
GC/HRMS 1668
GC/HRMS 1668
PBDEs 0.01 –0.0001 (0.00025 for DeBDE)
** see below
** see below
±20% target, ±35% labeled
70-130 target, 50-150 labeled
50-150 target, 30-140 labeled
10-150
8081 3535 or 3510
Pesti-cides
0.0025 – 0.025 50-150 40 †† ±15% 50-150 50-150
MLA060 (AXYS, 2008)
MLA060 (AXYS, 2008)
PFOAs and PFOSs
0.0001 ** see below
** see below
R2 > 0.990 ±30% for a maximum of three compounds; remainder ±20%
80-120, 70-130 depending on analyte
20-150, 40-150 depending on analyte
GC/HRMS 1668
GC/HRMS 1668
PCBs 0.00001 ** see below
** see below
±20% target, ±35% labeled
70-130 target, 50-150 labeled
50-150 target, 30-140 labeled
10-150
200.8 200.8 Metals 0.1 for Cu and Pb
5 for Zn
75-125 20 ††† ±10% 85-115 NA
QAPP – Phase 3: Priority Pollutant Scans of Ten POTWs Page 37 February 2009

7.0 Quality Objectives
Page 38 QAPP – Phase 3: Priority Pollutant Scans of Ten POTWs February 2009
Key to Table 4: *1,2-Dichlorobenzene-D4 16-110% *2-Fluorobiphenyl 43-116% *2-Fluorophenol 21-110 *D4-2-Chlorophenol 33-110% *D5-Nitrobenzene 35-114% *D5-Phenol 10-110% *Pyrene-D10 50 -150% *Terphenyl-D14 33-141% ** These are isotopic dilution methods: no MS/MSD required. †Calibration Model Requirement Average response %RSD < 15% Linear curve r2 > 0.995; %RSD < 20% Quadratic curve coefficient of determination (cod) > 0.99, at least 6 calibration points ††† Calculated concentration of each standard must be ±20% (lowest cal may be ±50%); except for PFOA/PFOS: ±25 % of actual (lowest cal may be ±30%) and metals ± 10% of actual (lowest cal may be ±20%) SOW includes detailed list of RLs for each individual analyte/congener
Acronyms and Abbreviations: %R percent recovery BNAs Base/Neutral/Acid Extractable Compounds (semivolatiles) CCV Continuing Calibration Verification Cu copper GC Gas Chromatograph HRMS High Resolution Mass Spectrometry LCS Laboratory Control Sample MS Matrix Spike MSD Matrix Spike Duplicate NA Not Applicable PAHs Polycyclic Aromatic Hydrocarbons Pb lead PBDEs Polybrominated diphenyl ethers PCBs Polychlorinated Biphenyls PFOAs Perfluoroorganic acids PFOSs Perfluorosulfonates RPD Relative Percent Difference RSD Relative Standard Deviation SIM Selected Ion Monitoring ug/L micrograms per liter (parts per billion [ppb]) zn zinc

Quality Control Procedures 8 8.1 Field Table 5 specifies the sample volumes, types of containers, preservation, and holding times for all analyses.
QAPP – Phase 3: Priority Pollutant Scans of Ten POTWs Page 39 February2009

8.0 Quality Control Procedures
Page 40 QAPP – Phase 3: Priority Pollutant Scans of Ten POTWs February 2009
Table 5 Sample Volumes, Containers, Preservation and Holding Times
for Target Analytes Parameter Laboratory Method Container Preservation Holding
time PAHs MEL 8270 SIM 1 liter amber
glass, Teflon lid
Cool to ≤6oC 7 days for extraction then 40 days till analysis
BNAs MEL 8270 1 liter amber glass, Teflon lid
Cool to ≤6oC 7 days for extraction then 40 days till analysis
Pesticides MEL 8081 1 liter amber glass, Teflon lid
Cool to ≤6oC 7 days for extraction then 40 days till analysis
Herbicides MEL 8270 1 liter amber glass, Teflon lid
Cool to ≤6oC 7 days for extraction then 40 days till analysis
PBDEs Pacific Rim GC/HRMS 1668
1 liter amber glass, Teflon lid
Cool to ≤6oC 1 year from collection to analysis
PFOAs and PFOSs
Axys MLA060 1 liter polypropylene
Cool to ≤6oC 28 days to extraction then 14 days till analysis
PCBs Pacific Rim GC/HRMS 1668
1 liter amber glass, Teflon lid
Cool to ≤6oC 1 year from collection to analysis
Metals MEL 200.8 500 ml Teflon bottle
7 ml ultrapure HNO3
6 months from collection to analysis
Key: PAHs – Polycyclic Aromatic Hydrocarbons BNAs – Base/Neutral/Acid Extractable Compounds (semivolatiles) PBDEs – Polybrominated diphenyl ethers PFOAs – Perfluoroorganic acids PFOSs – Perfluorosulfonates PCBs – Polychlorinated biphenyls Metals - Total copper, lead, and zinc

8.0 Quality Control Procedures
QAPP – Phase 3: Priority Pollutant Scans of Ten POTWs Page 41 February 2009
Field Logbooks and Data Forms Field logbooks and data forms/sheets will be used to document daily activities and observations. Documentation will be sufficient to enable participants to accurately and objectively reconstruct events that occurred during the project at a later time. Entries will be made in waterproof ink, dated, and signed. Project-specific field data forms/sheets will be used to capture field operations and observations. Field sheet content requirements are described in Appendix G. If corrections are necessary, these corrections will be made by drawing a single line through the original entry (so that the original entry is legible) and writing the corrected entry alongside. The correction will be initialed and dated. Corrected errors may require a footnote explaining the correction. Custody Procedures The primary objective of chain-of-custody procedures is to provide an accurate written or computerized record that can be used to trace the possession and handling of a sample from collection to completion of all required analyses. A sample is in custody when it is:
In someone’s physical possession; In someone’s view; Locked up; or Kept in a secured area that is restricted to authorized personnel.
Field Custody Procedures The following guidance will be used to ensure proper control of samples while in the field:
As few people as possible will handle the samples. The sample collector will be responsible for the care and custody of
collected samples until they are transferred to another person or dispatched properly under chain-of-custody rules.
The sample collector will record sample data in the field logbook and/or on field data forms/sheets.
The sampling team leader will determine whether proper custody procedures were followed during the fieldwork and will decide if additional samples are required.
When transferring custody (i.e., releasing samples to a shipping agent), the following will apply (MEL personnel will be responsible for packaging and shipping samples to outside laboratories.):
The container in which the samples are packed will be sealed and accompanied by two copies of the chain-of-custody records. When transferring samples, the individuals relinquishing and receiving them

8.0 Quality Control Procedures
Page 42 QAPP – Phase 3: Priority Pollutant Scans of Ten POTWs February 2009
must sign, date, and note the time on the chain-of-custody record. This record will document sample custody transfer.
Samples will be dispatched to the laboratory for analysis with separate chain-of-custody records accompanying each shipment. Shipping containers will be sealed with custody seals for shipment to the laboratory. The chain-of-custody records will be signed by the relinquishing individual, and the method of shipment, name of courier, and other pertinent information will be entered on the chain-of-custody record before placement in the shipping container.
All shipments will be accompanied by chain-of-custody records identifying their contents. The original record will accompany the shipment. The other copies will be distributed appropriately to the site team leader and site manager.
Is sent by common carrier, a bill of lading will be used. Freight bills and bills of lading will be retained as part of the permanent documentation.
Laboratory Custody Procedures A designated sample custodian at the laboratory will accept custody of the shipped samples from the carrier and enter preliminary information about the package into a package or sample receipt log, including the initials of the person delivering the package and the status of the custody seals on the coolers (i.e., broken versus unbroken). The custodian responsible for sample log-in will follow the laboratory’s SOP for opening the package, checking the contents, and verifying that the information on the chain-of-custody agrees with samples received. The laboratory will follow its internal chain-of-custody procedures as stated in the laboratory QA Manual. Field QC Samples Field QC samples for this project will include: one field (equipment rinsate) blank and one field duplicate for collection of sufficient sample volume to allow the laboratories to conduct the QC analyses identified in Table 6 below for each sampling event. A separate duplicate will not be required for metals since the sample contains sufficient volume for both sample and QC testing. The field/rinsate blank is used to evaluate potential contamination from sampling equipment. Analyses conducted using isotopic dilution will not require MS/MSD samples. Analytical accuracy is evaluated using isotope dilution data for samples analyzed using this methodology. Precision will be defined using the duplicate analysis. The matrix spike and matrix spike duplicate taken from the duplicate sample is a co-located sample collected concurrently with one sample which the laboratory uses to measure analytical precision and accuracy.

8.0 Quality Control Procedures
QAPP – Phase 3: Priority Pollutant Scans of Ten POTWs Page 43 February 2009
Table 6 Field Quality Control Samples for each Parameter
monitored at POTWs Method Parameter Equipment
/rinsate blank
MS MSD
8270 SIM PAHs 1/sampling event
1/sampling event
1/sampling event
8270 BNAs 1/sampling event
1/sampling event
1/sampling event
8270 Herbicides 1/sampling event
1/sampling event
1/sampling event
GC/HRMS 1668
PBDEs 1/sampling event
NA 1 duplicate per sampling event
NA
8081 Pesticides 1/sampling event
1/sampling event
1/sampling event
MLA060 PFOAs and PFOSs
1/sampling event
NA 1 duplicate per sampling event
NA
GC/HRMS 1668
PCBs 1/1st sampling event only
NA 1 duplicate 1st sampling event only
NA
200.8 Metals 1/sampling event
1/sampling event
1/sampling event
Key: NA – Not Applicable PAHs – Polycyclic Aromatic Hydrocarbons BNAs – Base/Neutral/Acid Extractable Compounds (semivolatiles) PBDEs – Polybrominated diphenyl ethers PFOAs – Perfluoroorganic acids PFOSs – Perfluorosulfonates PCBs – Polychlorinated biphenyls Metals – Total copper, lead and zinc
PCBs will be collected from 6 POTWS during the winter sampling event only; due to budget constraints: Metro West Point
Everett (deep outfall) City of Tacoma Central #1 Pierce County Chambers Creek Bremerton Shelton
The lead field sampler will verify aliquot collection by reviewing the data on the auto-sampler and noting on the field sheet whether there is evidence that each aliquot has been collected at the appropriate time. The time that each individual grab sample was collected will also be noted before the samples are composited on the site.

8.0 Quality Control Procedures
Page 44 QAPP – Phase 3: Priority Pollutant Scans of Ten POTWs February 2009
One automated equipment rinsate blank will be collected during each sampling event. 1. In the office, prepare the autosampler and associated equipment for sample
collection as described in Appendix F. 2. Place the sampling tube into a pre-cleaned glass sample bottle filled with
ultrapure water provided by MEL. 3. Use the autosampler to collect 100 milliliters of water into the sample bottle. 4. Use the water to rinse the bottle. 5. Repeat for a total of 3 rinses. 6. Use the autosampler to fill the 9 L sample bottle. 7. Place the sample in the sample refrigerator and retain until delivery to MEL
with the effluent samples. Two grab sample equipment rinsate blanks (one for PFOAs and PFOSs, and one for metals) will be collected during each sampling event. The blanks will be collected by filling samples bottles using the same equipment utilized for actual sample collection. One field duplicate will be collected during each sampling event. This will be collected at the West Point POTW by a co-located autosampler to collect one co-located contemporaneous time-weighted composite sample. Clean blank water field (equipment rinsate) blanks will be provided by MEL. A modified one-person clean hands/dirty hands sampling technique will be used to collect the samples. 8.2 Laboratory Laboratory QC samples are summarized in Table 7. Detailed Quality Control Procedures are documented in the Manchester Environmental Laboratory Quality Assurance Manual (MEL, 2006) and each subcontracted laboratory’s quality assurance manual. One QC target for this project is for each lab to extract and analyze all the samples collected during each event in a single batch. By doing this, a single set of quality control parameters will be applicable to all samples collected during each sampling event. PCBs will be collected from 6 POTWS during the winter sampling event only; due to budget constraints: Metro West Point
Everett (deep outfall) City of Tacoma Central #1 Pierce County Chambers Creek Bremerton Shelton

8.0 Quality Control Procedures
QAPP – Phase 3: Priority Pollutant Scans of Ten POTWs Page 45 February 2009
Table 7 Analytical Laboratory Quality Control Samples Method Parameter Method
Blank Laboratory Control Sample (aka Ongoing Precision & Recovery Standard – OPR)
MS MSD
8270 SIM PAHs 1/batch 1/batch ** ** 8270 BNAs 1/batch 1/batch 1/batch 1/batch 8270 Herbicides 1/batch 1/batch 1/batch 1/batch GC/HRMS 1668
PBDEs 1/batch 1/batch ** **
8081 Pesticides 1/batch 1/batch 1/batch 1/batch MLA060 PFOAs and
PFOSs 1/batch 1/batch ** **
GC/HRMS 1668
PCBs 1/batch 1/batch ** **
200.8 Metals 1/batch 1/batch *** *** Key: PAHs – Polycyclic Aromatic Hydrocarbons BNAs – Base/Neutral/Acid Extractable Compounds (semivolatiles) PBDEs – Polybrominated diphenyl ethers PFOAs – Perfluoroorganic acids PFOSs – Perfluorosulfonates PCBs – Polychlorinated biphenyls Metals – Total copper, lead and zinc A batch is defined as the 10 samples collected during each of two sampling events ** - These are isotopic dilution methods. No MS/MSD is required *** - One duplicate per batch is required for metals The method blank is used to assess potential contamination from sample handling in the laboratory. The laboratory control sample (LCS) is sometimes referred to as a blank spike. The LCS is used to measure the accuracy of the laboratory by determining the ability of the lab to recover known amounts of target analytes in the absence of matrix effects. Isotopic dilution provides recovery data for labeled analytes that relate directly to the native compound recoveries. The matrix spike and matrix spike duplicate are samples have known amounts of target analytes added to them in the laboratory. The laboratories measure the percent recovery of these compounds to estimate accuracy. Analytical precision

8.0 Quality Control Procedures
Page 46 QAPP – Phase 3: Priority Pollutant Scans of Ten POTWs February 2009
is estimated by comparing the MS and MSD recoveries. The matrix spikes allow the laboratory to assess matrix interferences. Precision is also impacted by field variability since separate samples are being collected.
Data Verification, Review, and Validation
9 9.1 Data Verification Field data and observations will be recorded in detailed log books. MEL and all subcontracted laboratories will provide both electronic and hard copy data packages for data from each sampling event. Each data package will include a case narrative discussing any problems with the analyses, alterations, if any, made to the methods, and an explanation of data qualifiers. The data package will include all relevant QC results. QC information will be use to evaluate the accuracy and precision of the data and to determine measurement data quality objectives were met. A Quality Assurance level 1 (QA1) analytical data review will be conducted following the process outlined in Ecology QA1 review guidelines (PTI 1989). QA1 includes review of case narratives and laboratory data. Reviews verify that methods specified in this QAPP were followed, calibrations and quality control checks are provided for all samples, and data are correct and complete. Evaluation criteria include: holding times, calibrations, blanks, detection limits, control samples, spike recoveries and relative percent differences, and laboratory applied data qualifiers. Significant laboratory findings will be discussed with the applicable laboratory project managers. QA summary memoranda will be prepared for the record. Impacts if any to the data will be summarized and addressed in the final report. Field data will also be evaluated for quality assurance. Impacts if any to the data will be summarized and addressed in the final report. All reviews will be completed by the QA lead, an experienced data validation chemist, and checked by the project manager. 9.2 Data Quality (Usability) Assessment Once the data verification process has been completed, the project manager will determine if the data are adequate for the calculations, determinations, and
QAPP – Phase 3: Priority Pollutant Scans of Ten POTWs Page 47 February2009

9.0 Data Verification, Review, and Validation
Page 48 QAPP – Phase 3: Priority Pollutant Scans of Ten POTWs February 2009
decisions for which this project was conducted. If the results are acceptable, data analysis will be completed. Data analysis will include, but not be limited to, compiling summary statistics and constructing plots to examine the distribution of contaminant concentrations in samples spatially, temporally, and by source (e.g., industrial versus non-industrial). 9.3 Data Validation Analytical data will be validated to verify they meet project data quality objectives and to identify any limitations of the data, following the process outlined in Ecology QA1 review guidelines (PTI 1989). These data will be validated by comparing calibration, accuracy, and precision results to the quality control criteria listed in the method, the laboratory SOP, and the QAPP. If no QA guidelines exist for specific analytes, then applicable U.S. Environmental Protection Agency (EPA) National and Regional Data Review guidelines will be used. 9.4 Data Management Procedures Field and laboratory project data will be entered into Excel spreadsheets. Entries will be independently verified for accuracy. All applicable data will be entered into Ecology’s Environmental Information Management system (EIM). Entries will be independently verified for accuracy. Ms. Becca Conklin has been identified by Ecology as their point-of-contact for EIM related tasks. All applicable data will be entered into the electronic Access database created during the Phase 2 project. Entries will be independently verified for accuracy. 9.5 Audits and Reports The Manchester Environmental Laboratory conducts performance and system audits of their procedures. MEL will be requested to make those audits available on written request. Ecology’s Accreditation Program determines if external laboratories may be used to analyze samples. Because the method identified for PFOA and PFOS analysis are not yet vetted by Ecology; Ecology’s Quality Assurance Officer will be asked to waive the requirement for accreditation of the method for this project. E & E and Herrera will prepare the following reports for this project: Draft Summary Technical Report Final Summary Technical Report Project Data will be entered into Ecology’s EIM Project data will be entered into Ecology’s Phase 2 Access database

References AHPA, 2005. American Public Health Assoc., Washington, DC (USA),
American Water Works Assoc. (USA), and Water Pollution Control Fed. (USA). 2005. Standard methods for the examination of water and wastewater. Twenty-first edition, edited by L. S. Clesceri, A. E. Greenberg and R. R. Trussell
Axys, 2008, AXYS Analytical Services Ltd., Summary of MLA-060, Analytical
Procedure for the Analysis of Perfluorinated Organic Compounds in Aqueous Samples by LC-MS/MS, Rev 05
Ecology, 1992. Water Quality Program Inspection Manual, Publication Number
92-76. Ecology, 2004a. Washington State Department of Ecology, Guidelines for
Preparing Quality Assurance Project Plans for Environmental Studies, Publication Number 04-03-030
Ecology, 2004b. Results of Screening Analysis for Pharmaceuticals in
Wastewater Treatment Plant Effluents, Wells, and Creeks in the Sequim-Dungeness Area, Publication Number 04-03-051
Ecology, 2008a. Quality Assurance Project Plan – Pharmaceuticals and Personal
Care Products in Wastewater Treatment Systems, Publication Number 08-03-112.
Ecology 2008b: http://www.ecy.wa.gov/programs/wq/pstoxics/index.html EnviroVision, 2008. EnviroVision Corporation; Herrera Environmental
Consultants, Inc.; Washington Department of Ecology. Phase 2: Improved Estimates of Toxic Chemical Loadings to Puget sound from Dischargers of Municipal and Industrial Wastewater, Ecology Publication Number 08-10-089. September 2008. Olympia, Washington.
EPA 1999, EPA, USEPA Contract Laboratory Program National Functional
Guidelines for Organic Data Review, EPA-540/R-99-008 (PB99-963506), October 1999.
QAPP – Phase 3: Priority Pollutant Scans of Ten POTWs Page 49 February2009

References
Page 50 QAPP – Phase 3: Priority Pollutant Scans of Ten POTWs February 2009
EPA 2004, Review, OSWER 9240.1-45, EPA 540-R-04-004, October 2004.
EPA 2007, Test Methods for Evaluating Solid Waste, Physical/Chemical Methods (SW-846), Update IV, February 2007.
EPA Method 1668, Revision A: Chlorinated Biphenyl Congeners in Water, Soil, Sediment, and Tissue by HRGC/HRMS, United States Office of Water, EPA No. EPA 821-R-00-002, Environmental Protection Agency (4303), December 1999.
Hart Crowser, 2007. Hart Crowser, Inc.; Washington Department of Ecology; U.S. Environmental Protection Agency; and Puget Sound Partnership. Phase 1: Initial Estimate of Toxic Chemical Loadings to Puget Sound. Ecology Publication Number 07-10-079. October 2007. Olympia, Washington.
James Maroncelli, January 12, 2009. personal communication. James Maroncelli, November 12, 2008. personal communication. Katz, C.N. et al 2004. Sinclair Inlet Water Quality Assessment Final Report,
Puget Sound Wastewater Technology Evaluation and Research Project, Environmental Quality Branch Code 2362, Space and Naval Warfare Systems Center, San Diego, CA, January 2004.
Manchester Environmental Laboratory, 2005. Manchester Environmental
Laboratory Lab Users Manual. Eighth Edition. Manchester Environmental Laboratory, Washington State Department of Ecology, Manchester, Washington
PSP 2008a: http://www.psp.wa.gov PSP 2008b: http://www.psp.wa.gov/aa_what.php PSP 2008c: http://www.psp.wa.gov/aa_action_agenda.php PTI, 1989. Data Validation Guidance Manual for Selected Sediment Variables.
Prepared by PTI Environmental Services for Washington Department of Ecology, Olympia, Washington.
Stuart Magoon, November 12, 2008. personal communication.

Scope of Work
A

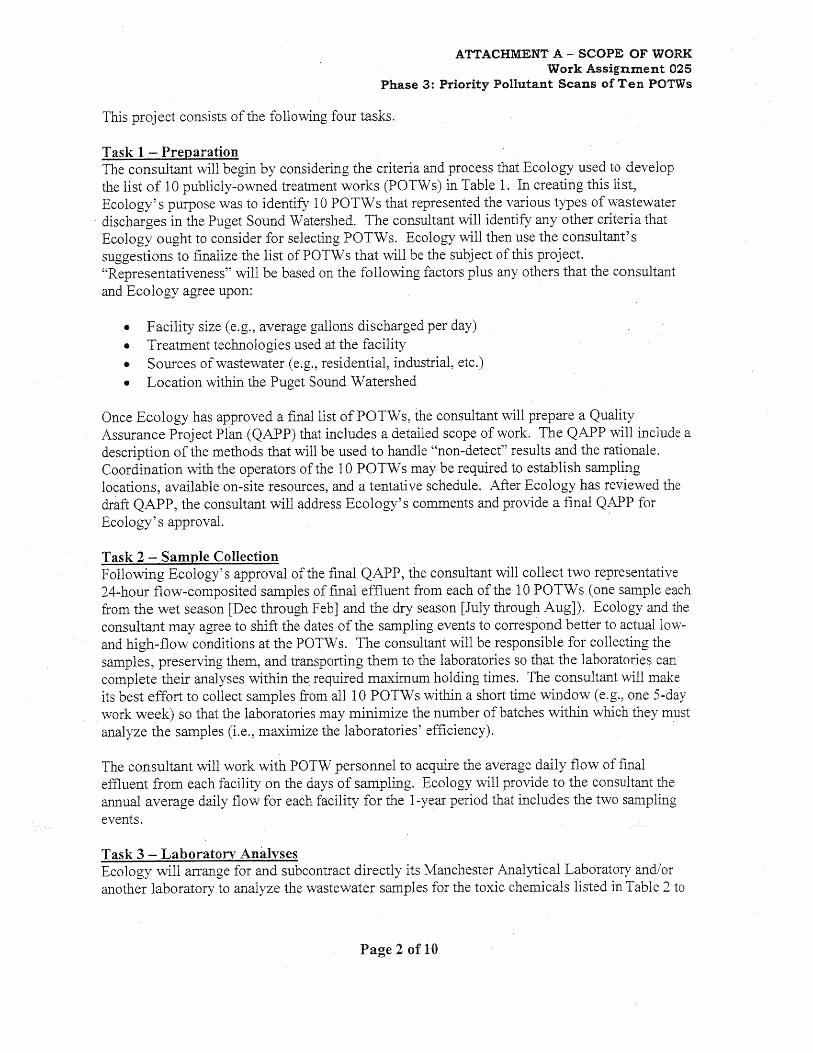


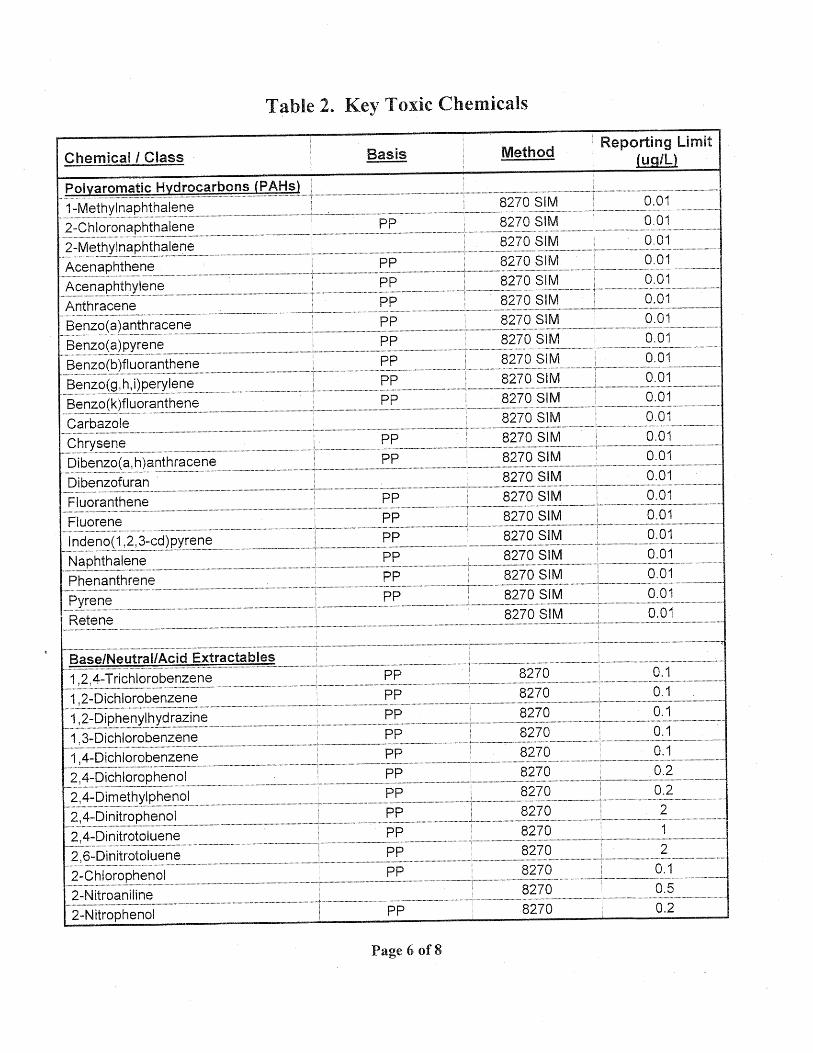


WWTP List B

Facility Name Permit ID ExpirationDate
Facility TotalAverage Flow
(MGD)
Facility TotalAverage
Annual Flow(MGYear)
Permit Manager
Alderbrook Resort & Spa WA0037753A 0.011 4.02 DAVID DOUGHERTYAlderwood Stp WA0020826D 2.16 787 BERNARD JONESAnacortes Wwtp WA0020257E 1.8 659 TONYA LANEArlington Stp WA0022560E 1.18 430 MIKE DAWDABainbridge Island City WA0020907D 0.537 196 ALISON EVANSBellingham Stp WA0023744D 12.1 4430 MARK HENDERSONBirch Bay Stp WA0029556C 0.797 291 MARK HENDERSONBlaine Stp WA0022641C 0.567 207 MARK HENDERSONBoston Harbor Stp WA0040291B 0.034 12.4 DAVID DOUGHERTYBremerton Stp WA0029289E 5.03 1835 MIKE DAWDABrightwater Conveyance System Noi WA0032051A 31-Jan-10 - - MARK HENLEYBrightwater Conveyance System Noi WA0032051A 31 Jan 10 MARK HENLEYBuckley Stp WA0023361C 0.608 222 MAHBUB ALAMBurlington Wwtp WA0020150C 1.56 569 TONYA LANECarbonado Stp WA0020834C 0.0237 8.65 MAHBUB ALAMCarlyon Beach Stp WA0037915C 0.0203 7.4 DAVID DOUGHERTYChambers Creek Stp WA0039624C 17.8 6480 MAHBUB ALAMCherrywood Mobile Home Manor WA0037079B 0.0113 4.11 MAHBUB ALAMClallam Bay Correction Center Stp WA0039845D 0.124 45.4 GREG ZENTNERClallam Bay Stp WA0024431B 0.0378 13.8 GREG ZENTNERConcrete Stp WA0020851B 0.0816 29.8 SHAWN MCKONECoupeville Stp WA0029378D 0.183 66.8 ALISON EVANSDuvall Stp WA0029513C 0.493 180 LAURA FRICKEEastsound Orcas Village WA0030911D 0.00356 1.3 BERNARD JONESEastsound Water District WA0030571C 0.0904 33 BERNARD JONESEatonville Stp WA0037231C 0.209 76.3 MAHBUB ALAMEdmonds Stp WA0024058C 5.7 2080 SHAWN MCKONEEnumclaw Stp WA0020575D 1.69 618 Greg ZentnerEverett Stp WA0024490C OF-100=4623 LAURA FRICKE
B-1

Facility Name Permit ID ExpirationDate
Facility TotalAverage Flow
(MGD)
Facility TotalAverage
Annual Flow(MGYear)
Permit Manager
Everett Stp WA0024490C OF-015=4141 LAURA FRICKEEverson Stp WA0020435D 0.252 91.8 MARK HENDERSONFerndale Stp WA0022454C 1.47 538 MARK HENDERSONFisherman Bay Stp WA0030589D 0.0175 6.4 SHAWN MCKONEFriday Harbor Stp WA0023582D 0.318 116 SHAWN MCKONEGig Harbor Stp WA0023957B 0.8 292 MIKE DAWDAGranite Falls Stp WA0021130D 0.264 96.3 LAURA FRICKEHartstene Pointe Stp WA0038377B 0.0723 26.4 DAVID DOUGHERTYIndian Ridge Corrections Center WA0029424B 0.00197 0.72 MIKE DAWDAKitsap Cnty Central Kitsap WA0030520E 3.67 1340 MIKE DAWDAKitsap Cnty Manchester WA0023701D 0 205 74 8 MIKE DAWDAKitsap Cnty Manchester WA0023701D 0.205 74.8 MIKE DAWDAKitsap Cnty Sewer Dist 7 WA0030317D 0.0696 25.4 ALISON EVANSKitsap County Kingston Wwtp WA0032077A 0.118 42.9 MIKE DAWDALa Conner Stp WA0022446C 0.248 90.6 LAURA FRICKELake Stevens Sewer District WA0020893D 1.99 726 LAURA FRICKELakota Stp WA0022624D 4.6 1680 ALISON EVANSLangley Stp WA0020702C 0.0784 28.6 TONYA LANELott WA0037061B 11 4020 DAVID DOUGHERTYLummi Indian Business Council, Gooseberry Point WA0025666Lummi Indian Business Council, Sandy Point WA0025658Lynden Stp WA0022578D 1.05 382 MARK HENDERSONLynnwood Stp WA0024031E 4.27 1560 BERNARD JONESMakah WWTP WA0023213Marysville Stp WA0022497C LAURA FRICKEMessenger House Care Ctr WA0023469D 0.00597 2.18 ALISON EVANSMetro Renton (KingCounty-Renton) WA0029581D 77 28100 MARK HENLEYMetro West Point (KingCounty-WestPoint) WA0029181E 102 37400 MARK HENLEYMidway Sewer District WA0020958D 4.27 1560 TONYA LANE
B-2
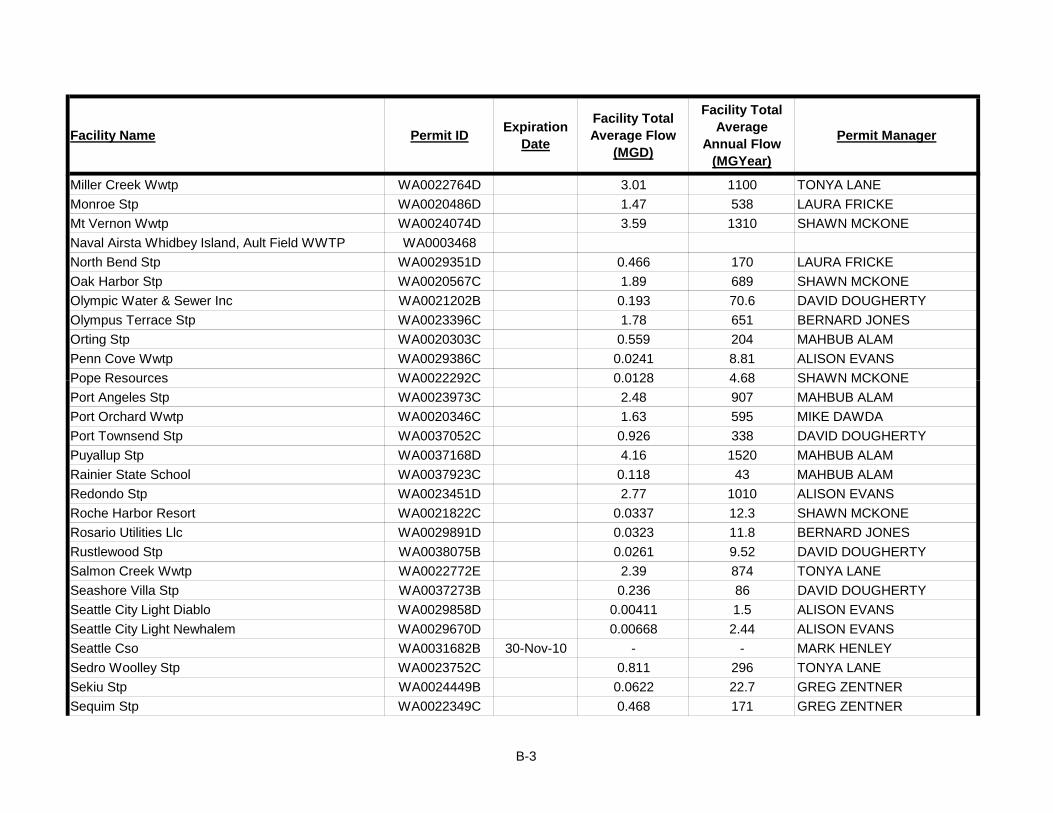
Facility Name Permit ID ExpirationDate
Facility TotalAverage Flow
(MGD)
Facility TotalAverage
Annual Flow(MGYear)
Permit Manager
Miller Creek Wwtp WA0022764D 3.01 1100 TONYA LANEMonroe Stp WA0020486D 1.47 538 LAURA FRICKEMt Vernon Wwtp WA0024074D 3.59 1310 SHAWN MCKONENaval Airsta Whidbey Island, Ault Field WWTP WA0003468North Bend Stp WA0029351D 0.466 170 LAURA FRICKEOak Harbor Stp WA0020567C 1.89 689 SHAWN MCKONEOlympic Water & Sewer Inc WA0021202B 0.193 70.6 DAVID DOUGHERTYOlympus Terrace Stp WA0023396C 1.78 651 BERNARD JONESOrting Stp WA0020303C 0.559 204 MAHBUB ALAMPenn Cove Wwtp WA0029386C 0.0241 8.81 ALISON EVANSPope Resources WA0022292C 0 0128 4 68 SHAWN MCKONEPope Resources WA0022292C 0.0128 4.68 SHAWN MCKONEPort Angeles Stp WA0023973C 2.48 907 MAHBUB ALAMPort Orchard Wwtp WA0020346C 1.63 595 MIKE DAWDAPort Townsend Stp WA0037052C 0.926 338 DAVID DOUGHERTYPuyallup Stp WA0037168D 4.16 1520 MAHBUB ALAMRainier State School WA0037923C 0.118 43 MAHBUB ALAMRedondo Stp WA0023451D 2.77 1010 ALISON EVANSRoche Harbor Resort WA0021822C 0.0337 12.3 SHAWN MCKONERosario Utilities Llc WA0029891D 0.0323 11.8 BERNARD JONESRustlewood Stp WA0038075B 0.0261 9.52 DAVID DOUGHERTYSalmon Creek Wwtp WA0022772E 2.39 874 TONYA LANESeashore Villa Stp WA0037273B 0.236 86 DAVID DOUGHERTYSeattle City Light Diablo WA0029858D 0.00411 1.5 ALISON EVANSSeattle City Light Newhalem WA0029670D 0.00668 2.44 ALISON EVANSSeattle Cso WA0031682B 30-Nov-10 - - MARK HENLEYSedro Woolley Stp WA0023752C 0.811 296 TONYA LANESekiu Stp WA0024449B 0.0622 22.7 GREG ZENTNERSequim Stp WA0022349C 0.468 171 GREG ZENTNER
B-3

Facility Name Permit ID ExpirationDate
Facility TotalAverage Flow
(MGD)
Facility TotalAverage
Annual Flow(MGYear)
Permit Manager
Shelton Stp WA0023345C 2.13 776 DAVID DOUGHERTYSkagit Cnty 2 Big Lake WA0030597C 0.126 46 TONYA LANESkagit Co. Sewer District #1, Sneeoosh WA0029432Snohomish Stp WA0029548C 0.94 343 LAURA FRICKESnoqualmie Wwtp WA0022403C 0.729 266 SHAWN MCKONESouth Prairie Stp WA0040479C 0.025 9.13 MAHBUB ALAMStanwood Stp WA0020290E 0.477 174 MIKE DAWDASultan Wwtp WA0023302D 0.345 126 KEN ZIEBARTSumner Stp WA0023353C 1.89 690 MAHBUB ALAMSwinomish Indian Tribal Community Industrial District WA0025062Swinomish Reservatiion Shelter bay WWTP WA0024422Swinomish Reservatiion, Shelter bay WWTP WA0024422Tacoma Central No 1 WA0037087B 19.7 7190 MAHBUB ALAMTacoma North No 3 WA0037214C 4.52 1650 MAHBUB ALAMTamoshan Stp WA0037290C 0.0285 10.4 DAVID DOUGHERTYTaylor Bay Stp WA0037656B 0.0105 3.85 BERNARD JONESTulalip Tribes of Washington, Utilities District #1 WA0024805U.S. NPS Paradise Wastewater Treatment WA0025569Vashon Stp (King County - Vashon) WA0022527E 0.118 43.2 ALISON EVANSWa Doc Mcneil Island Stp WA0040002C 0.227 83 BERNARD JONESWa Parks Larrabee WA0023787D 0.00929 3.39 MARK HENDERSONWarm Beach Campground WA0029904C 0.0329 12 MIKE DAWDAWilkeson Stp WA0023281C 0.0267 9.75 MAHBUB ALAMYelm Stp WA0040762B 0.213 77.7 MAHBUB ALAM
B-4

POTW Selection Rationale
C

C. POTW Selection Rationale
Appendix C POTW Selection Rationale
The goals of this project are to (1) improve the Phase 2 loading estimates for certain toxic chemicals, and (2) screen representative POTW discharges for toxic chemicals not routinely monitored. Selection of the publically owned treatment works (POTWs) that would be targeted for monitoring for this project was one of the first steps in defining the approach. Due to budget considerations, the number of POTWs that could be sampled was limited to ten. The purpose of this Technical Memorandum is to document the rationale for selection of the ten POTWs chosen for monitoring. Ecology’s intent was to select ten POTWs that represented a range of operating variables for Puget Sound area POTWs. These variables were: size (as volume of effluent discharged), type of treatment process, and influence of industrial influent to the POTW. The intent was not to provide for equal representation of each variable, i.e., an equal number of small, medium, and large facilities, or even necessarily a balanced representation (i.e., if 60% of facilities in Puget Sound are medium sized have 6 of the 10 facilities be medium sized). Instead the intent was to reasonably cover the variables. It is understood that variations in all three of these operating variables can not be adequately compared through evaluations of only 10 facilities, however by providing some representation of each, Ecology expects to cover the range of conditions. In addition to operating variables, the list of POTWs was to represent geographic coverage around Puget Sound. A draft POTW list was developed by Ecology through assessment of the variables. Two changes were made to the draft list in response to a few suggestions made at the project kick-off meeting on November 12, 2008. First, the City of Bainbridge Islands’ POTW was removed from the list. Logistical problems associated with the need to get monitoring crews to the site 3 times in a 24 hour period, made the 45 minute (each way) ferry ride for this facility excessive. Second, the Tacoma Central POTW was added to improve the representation of facilities that receive industrial influent. A final change was made to the list after initial POTW site visits were made. At that time, the Arlington POTW was replaced with the Burlington POTW because Arlington was planning a major plant upgrade during the monitoring period. The final list of selected POTWs is provided as Table 1. In the list of 10 POTWS, there is one small treatment plants (< 1 mgd), 5 medium sized plants (1 to 10 mgd) and 4 large sized plants (>10 mgd); and one of these is very large; >100 mgd. In comparison, there are a total of 105 municipal POTWs in the Puget Sound basin; 69 are small, 28 are medium, and 8 are large. However, nearly 75% of the volume discharged from POTWs is discharged from the 8 largest facilities; so a distribution that is weighted toward medium and large is reasonable. In terms of treatment process, 9 of the 10 POTWs selected use an activated sludge secondary treatment process. The remaining facility is an aerated lagoon system. The vast majority of POTWs in Puget Sound use activated sludge for secondary treatment, so this weighting the analysis toward this treatment process is appropriate. For disinfection, seven of the selected
C-1

C. POTW Selection Rationale
C-2
facilities use chlorine and the remaining use UV. In Puget Sound, generally, most of the older facilities are still using chlorine, while newer facilities often rely on UV. The MBR treatment process is not represented, but there is only one such Ecology permitted POTW in the Puget Sound basin and it is very small. Four of the 10 POTWs selected were considered to have significant industrial influent, 2 are believed to have minor amounts and 4 treat only municipal waste. Also, 7 of the 14 study areas in Puget Sound are represented in the list.

C. POTW Selection Rationale
C-3
POTW Name
Permit ID
Region Study Area Ave Flow(MGD)
Treatment Process
Industrial Influent?
Gig Harbor WA0023957B
NWRO South Sound East
0.8 Activated sludge w chlorine
No
Everett WA0024490C
NWRO Port Gardner 10. Trickling filter Yes
Burlington WA0020150E
NWRO Whidbey Basin 1.56 Activated sludge w UV disinfection
No
Sumner WA0023353C
SWRO Commencement Bay
1.89 Activated sludge w UV disinfection & anaerobic sludge digestion
Small
Shelton WA0023345C
SWRO South Sound East
2.13 Activated sludge in Oxidation Ditch w chlorine
No
Bremerton WA0029289E
NWRO Sinclair-Dyes Inlet
5.03 Activated sludge w chlorine
Yes
Bellingham WA0023744D
NWRO Strait of Georgia 12.1 Activated sludge w chlorine
Yes
Pierce County Chambers Creek
WA0039624C
SWRO South Sound East
17.8 Activated Sludge (aerobic & anoxic) w UV
Small
Tacoma Central No. 1
WA0037087B
SWRO Commencement Bay
19.7 Activated Sludge w chlorine
Yes
Metro West Point
WA0029181E
NWRO Main Basin 102 Activated sludge w chlorine
Yes

POTW Project Gantt Chart
D
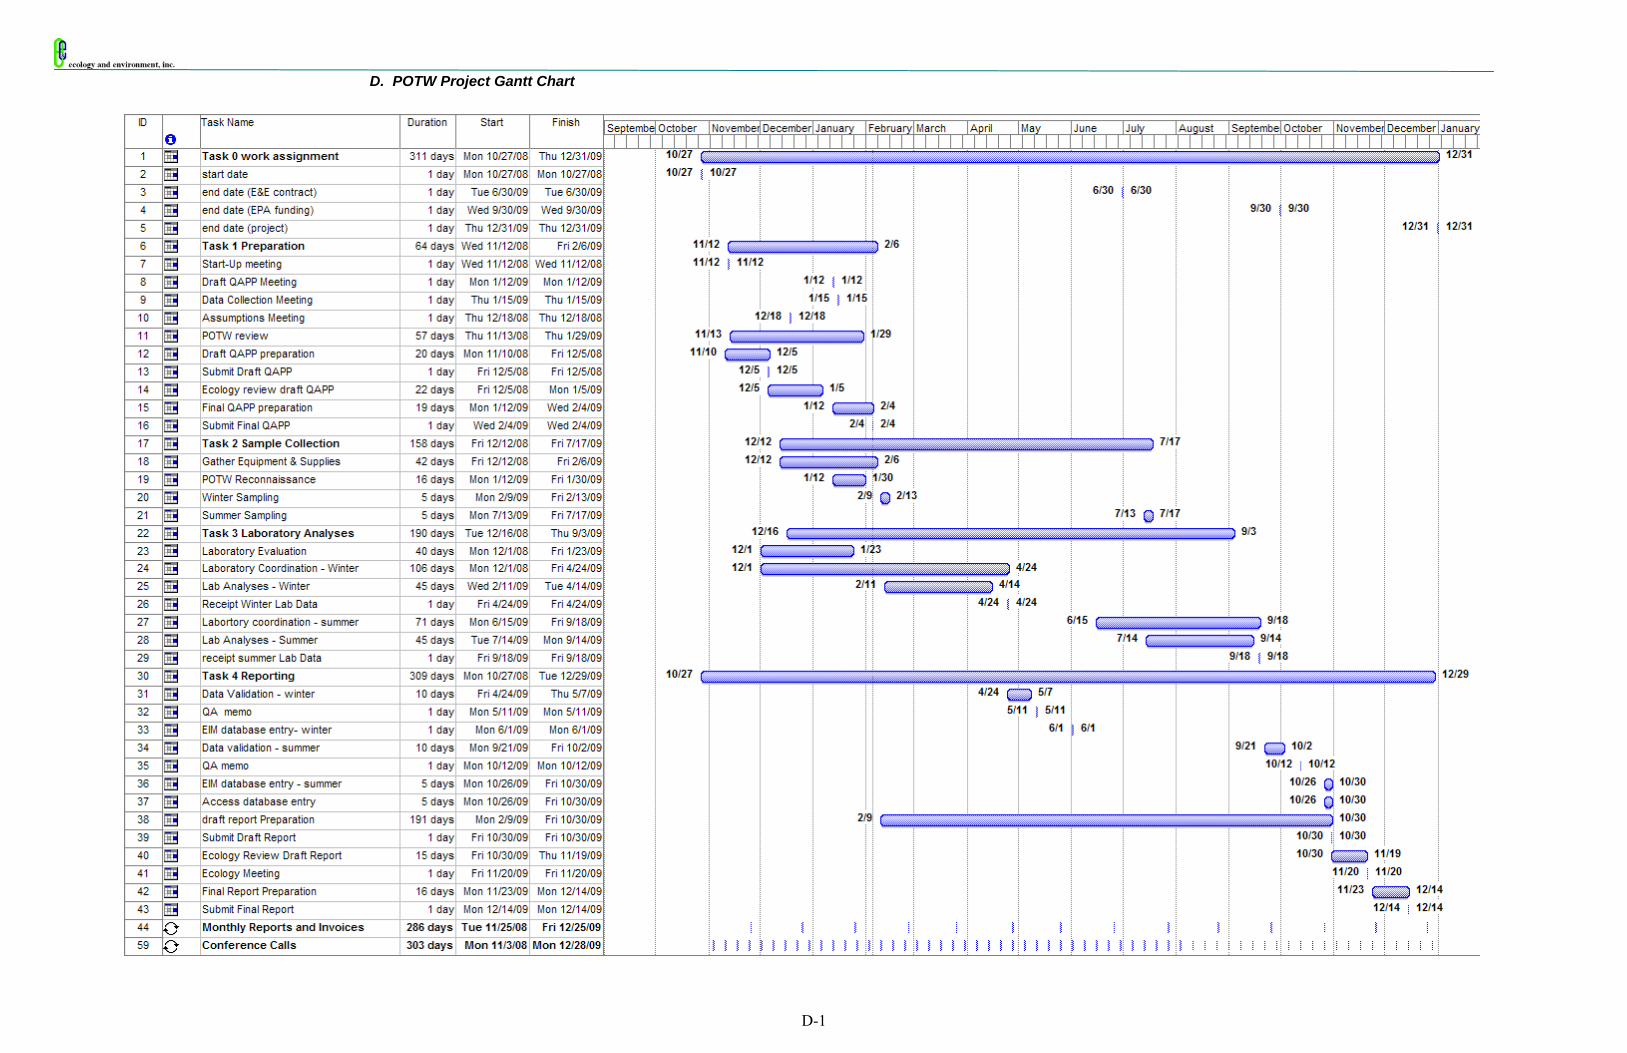
D. POTW Project Gantt Chart
D-1

Meeting Notes E

E. Meeting Notes
E-1
Priority Pollutant Scans at 10 POTWS Meeting Notes
Date: November 12, 2008 Place: Ecology Headquarters, Lacey, Washington Participants: Washington Department of Ecology (Ecology) Jim Maroncelli, Project Manager Foroozan Labib, Water Quality Program
Dave Knight, Water Quality Program Alison Evans, NW Regional Office (via teleconference) Stuart Magoon, Manchester Environmental Laboratory [MEL] (via
teleconference) John Weakland, Manchester Environmental Laboratory [MEL] (via
teleconference) Ecology and Environment, Inc. (E & E) Andy Hafferty, Project Manager Herrera Environmental Consultants, Inc. Joy Michaud, Project Technical Reporting Lead Note – Several unsuccessful attempts were made to reach Ms. Heather Trim (People for Puget Sound) in order for her to join via teleconference. Purpose: Project Kick-Off Meeting Summary: This was the kick-off meeting for Phase 3: Priority Pollutant Scans of Ten POTWs. Jim Maroncelli outlined past work leading to this project, reviewed the scope of work, identified roles and responsibilities, provided additional information and addressed upcoming activities and schedule. These notes are not intended to be a complete record of all discussions, but have been prepared by E & E to serve as a summary of major items addressed during the meeting. Meeting Notes: Project Background (provided by Maroncelli)
• This is Phase 3 – Year 1 project.

E. Meeting Notes
E-2
• Origins go back to Gov. Gregoire’s Puget Sound Initiative and the Puget Sound Partnership (PSP) 2020 Action Agenda
• Ecology began Phase 1 prior to establishment of the PSP • Ecology used available data to estimate toxics loadings to Puget sound via
selected pathways • Control of Toxic Chemicals in Puget Sound Phase 1: Initial Estimate of
Loading published ~ October 2007 • By end of 2007, Ecology and other authorities began eight Phase 2 toxics
loading projects • These projects were initiated in advance of full PSP review and were
designed to provide the PSP with data relevant to their future decisions regarding the 2020 Action Agenda
• Four of the 8 projects have been completed • Details on these projects may be found at
http://www.ecy.wa.gov/puget_sound/index.html • Ecology’s Water Quality Program has completed two Phase 2 projects
related to release of toxic chemicals from point source discharges. Information may be found on http://www.ecy.wa.gov/programs/wq/pstoxics/index.html
• Additional sampling was recommended in both these Phase 2 project reports
• The PSP has issued its draft 2020 Action Agenda http://www.psp.wa.gov/aa_draft.php
• Ecology is reviewing the Agenda. Comments are due in approximately 2 weeks.
• The PSP Science Panel is now providing guidance on future activities • Ecology together with several other agencies have established an 8-9
person steering committee to review and develop Phase 3 scopes-of-work for projects in Puget Sound. The group had its first meeting the week of November 3, 2008
• Ecology has an internal ~12-person toxics work group which meets monthly to address Puget Sound projects
• Phase 3 work got a late start. SOWs were begun without Science Panel or Toxics Work Group review
• This project, Phase 3: Priority Pollutant Scans of Ten POTWs, is funded through a U.S.EPA’s National Estuary Program grant
• Phase 3 – Year 2 projects will likely be proposed to the U.S.EPA by March 2009
• There is temporal overlap between the Phases This Project
• Ecology has identified target analytes in treated effluent for testing (see SOW). The analyte list is limited by available funding
• Ecology has identified 10 representative POTWs. The sampling of only 10 POTWs is limited by available funding
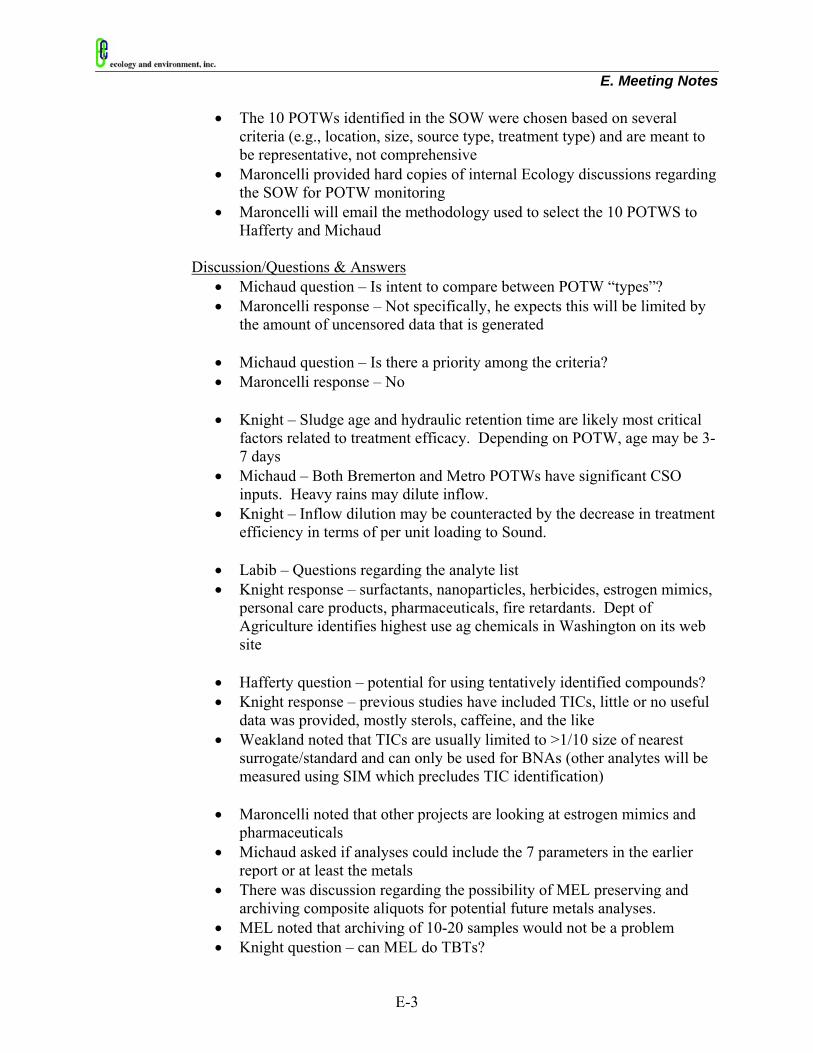
E. Meeting Notes
E-3
• The 10 POTWs identified in the SOW were chosen based on several criteria (e.g., location, size, source type, treatment type) and are meant to be representative, not comprehensive
• Maroncelli provided hard copies of internal Ecology discussions regarding the SOW for POTW monitoring
• Maroncelli will email the methodology used to select the 10 POTWS to Hafferty and Michaud
Discussion/Questions & Answers
• Michaud question – Is intent to compare between POTW “types”? • Maroncelli response – Not specifically, he expects this will be limited by
the amount of uncensored data that is generated
• Michaud question – Is there a priority among the criteria? • Maroncelli response – No
• Knight – Sludge age and hydraulic retention time are likely most critical
factors related to treatment efficacy. Depending on POTW, age may be 3-7 days
• Michaud – Both Bremerton and Metro POTWs have significant CSO inputs. Heavy rains may dilute inflow.
• Knight – Inflow dilution may be counteracted by the decrease in treatment efficiency in terms of per unit loading to Sound.
• Labib – Questions regarding the analyte list • Knight response – surfactants, nanoparticles, herbicides, estrogen mimics,
personal care products, pharmaceuticals, fire retardants. Dept of Agriculture identifies highest use ag chemicals in Washington on its web site
• Hafferty question – potential for using tentatively identified compounds? • Knight response – previous studies have included TICs, little or no useful
data was provided, mostly sterols, caffeine, and the like • Weakland noted that TICs are usually limited to >1/10 size of nearest
surrogate/standard and can only be used for BNAs (other analytes will be measured using SIM which precludes TIC identification)
• Maroncelli noted that other projects are looking at estrogen mimics and
pharmaceuticals • Michaud asked if analyses could include the 7 parameters in the earlier
report or at least the metals • There was discussion regarding the possibility of MEL preserving and
archiving composite aliquots for potential future metals analyses. • MEL noted that archiving of 10-20 samples would not be a problem • Knight question – can MEL do TBTs?
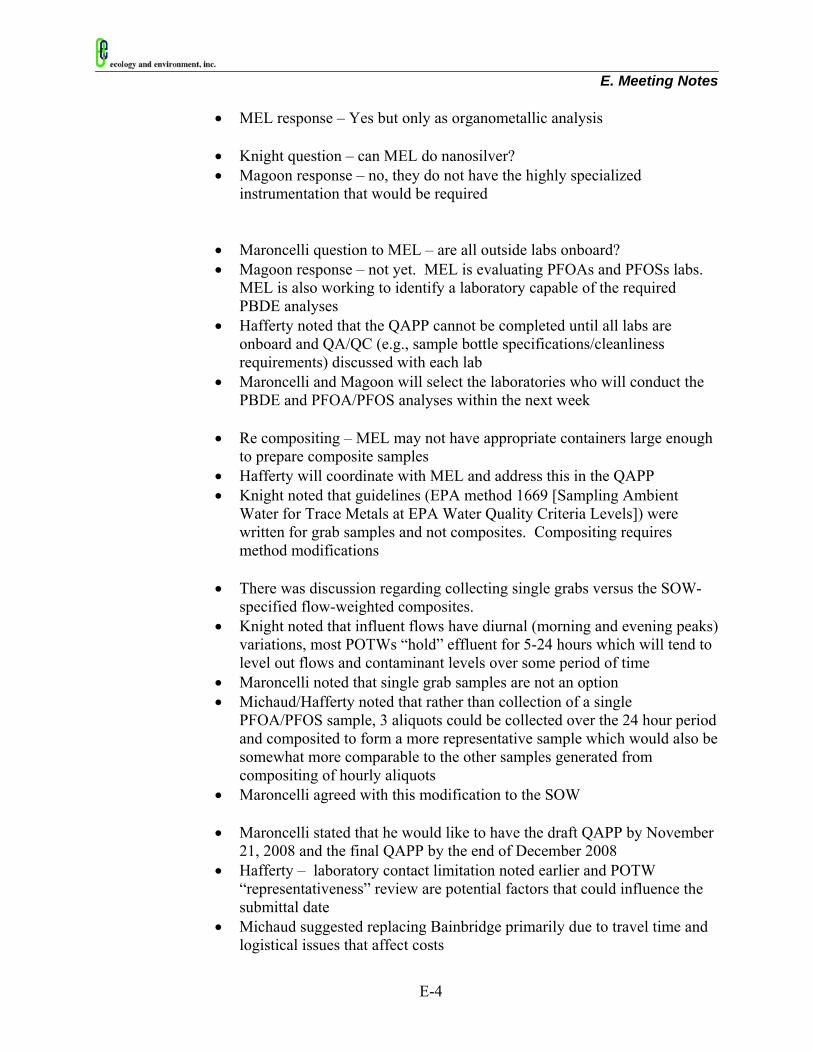
E. Meeting Notes
E-4
• MEL response – Yes but only as organometallic analysis
• Knight question – can MEL do nanosilver? • Magoon response – no, they do not have the highly specialized
instrumentation that would be required
• Maroncelli question to MEL – are all outside labs onboard? • Magoon response – not yet. MEL is evaluating PFOAs and PFOSs labs.
MEL is also working to identify a laboratory capable of the required PBDE analyses
• Hafferty noted that the QAPP cannot be completed until all labs are onboard and QA/QC (e.g., sample bottle specifications/cleanliness requirements) discussed with each lab
• Maroncelli and Magoon will select the laboratories who will conduct the PBDE and PFOA/PFOS analyses within the next week
• Re compositing – MEL may not have appropriate containers large enough
to prepare composite samples • Hafferty will coordinate with MEL and address this in the QAPP • Knight noted that guidelines (EPA method 1669 [Sampling Ambient
Water for Trace Metals at EPA Water Quality Criteria Levels]) were written for grab samples and not composites. Compositing requires method modifications
• There was discussion regarding collecting single grabs versus the SOW-
specified flow-weighted composites. • Knight noted that influent flows have diurnal (morning and evening peaks)
variations, most POTWs “hold” effluent for 5-24 hours which will tend to level out flows and contaminant levels over some period of time
• Maroncelli noted that single grab samples are not an option • Michaud/Hafferty noted that rather than collection of a single
PFOA/PFOS sample, 3 aliquots could be collected over the 24 hour period and composited to form a more representative sample which would also be somewhat more comparable to the other samples generated from compositing of hourly aliquots
• Maroncelli agreed with this modification to the SOW
• Maroncelli stated that he would like to have the draft QAPP by November 21, 2008 and the final QAPP by the end of December 2008
• Hafferty – laboratory contact limitation noted earlier and POTW “representativeness” review are potential factors that could influence the submittal date
• Michaud suggested replacing Bainbridge primarily due to travel time and logistical issues that affect costs

E. Meeting Notes
E-5
• Maroncelli wants the review to show the chosen 10 POTWs are “credible” rather than fully balanced
• Knight will provide assistance to Michaud in conducting this review • Weakland and Hafferty will address laboratory related questions
• There was discussion regarding UV and chlorine disinfection • Knight and Michaud will include differing disinfection methods in the
review
• Hafferty/Michaud noted biomembranes as a treatment to be considered • Maroncelli noted that covering all types of treatment was not a
requirement and that the intent was to represent loading character as it is today rather than simulate possible future characteristics
• Knight noted that vast majority of pollutants come from relatively small
number of POTWs. He suggested possibly replacing Bainbridge Island with City of Tacoma since the Tacoma facility is more representative of one with industrial effluent
• There was discussion about analytical data validation • Hafferty noted that E & E would conduct QA1 level review on all data,
but that the data deliverables (data packages) should include fully reviewable (i.e., level 4) data
• MEL agreed and will address this in its contracts with outside labs • MEL plans to complete full data review on all internal lab work and data
deliverables from both outside labs
• All agreed that a 60 day turn around from sample submission to data delivery from the labs was acceptable
• Maroncelli noted that the original plan for December sampling was not
viable. The wet season sampling event should be in January 2009 Action Items
• Maroncelli – E-mail files and criteria used to identify the 10 POTWs chosen for this study to Hafferty & Michaud
• Hafferty/Michaud will review hard copies of internal Ecology discussions
regarding the SOW for POTW monitoring
• Hafferty – Contact Magoon and Weakland to address outside labs, bottle requirements, and compositing protocol
• Michaud – Work with Knight to prepare a representativeness study of the
POTW selection
E. Meeting Notes
E-6
• Hafferty/Michaud – Complete Draft QAPP for submittal to Ecology by
November 21, 2008

E. Meeting Notes
E-7
Priority Pollutant Scans at 10 POTWS Meeting Notes
Date: January 12, 2009 Place: Ecology Headquarters, Lacey, Washington Participants: Washington Department of Ecology (Ecology) Jim Maroncelli, Project Manager
Dave Knight Dewey Weaver Greg Pelletier Dale Norton Robert Duff Mindy Roberts Alison Evans (via teleconference) Karen Burgess (via teleconference)
Ecology and Environment, Inc. (E & E) Andy Hafferty, Project Manager Herrera Environmental Consultants, Inc. Joy Michaud
John Lenth Dylan Ahearn
Purpose: Discuss Scope-of-Work/QAPP Finalization Meeting Summary: PowerPoint presentation and discussions regarding the scope-of-work and QAPP for the Phase 3: Priority Pollutant Scans of Ten POTWs. Jim Maroncelli outlined how work fits in with Puget Sound Phase 3 projects. Andy Hafferty presented a PowerPoint overview of the scope of work and QAPP. Possible changes to the QAPP were discussed by the group. These notes are not intended to be a complete record of all discussions, but have been prepared by E & E to serve as a summary of major items addressed during the meeting.

E. Meeting Notes
E-8
Meeting Notes: Project Background (provided by Maroncelli)
• This is Phase 3 – Year 1 project. • These projects were initiated in advance of full PSP review and were
designed to provide the PSP with data relevant to their future decisions regarding the Action Agenda
• The PSP plans to issue an update to the Action Agenda in 2010 • Ecology has reviewed and provided comments on a draft QAPP for this
project. This Project
• Hafferty presented an overview of the scope-of-work and QAPP for this project.
• A copy of the presentation is attached. Discussion/Questions & Answers
• Roberts noted that intra-POTW nutrient concentration variability is generally much less than inter-POTW variability.
• Roberts stated that POTWs chosen for inclusion in this study provide good coverage of the effluent loading to Puget Sound.
• Roberts noted that there was a good blend of facilities in terms of including at least one with a high I & I problem, a few with little I & I, and several with a moderate amount
• Maroncelli noted that Everett effluent flows are 24 mgd. (After the meeting, he provided the correct value of about 10 mgd.)
• Michaud noted that QAPP will include contingency plans for “incomplete” sampling should problems be encountered in the field.
• There were discussion regarding sampling during CSO events (four of the POTWs have CSOs).
• Knight – Inflow dilution may be counteracted by the decrease in treatment efficiency in terms of per unit loading to Sound.
• It was agreed that E & E will attempt to avoid sampling during CSO event.
• The QAPP will include a go/no go threshold for rain events. • There were discussions regarding flow-weighted versus time-weighted
sample collection. The following points were raised: o Flow-weighting will greatly increase monitoring costs for
personnel and equipment as compared to time-weighting o Flow weighting will increase the potential for sample
contamination o Flow weighting increases the volume of sample needed and is the
reason two auto-samplers are required at each site

E. Meeting Notes
E-9
o Flow weighting requires that a more detailed contingency plan for missed samples is in place
o The points made in favor of flow-weighting were ; it corrects for hydrologic variability (though the group’s discussion around this was that that variability was less than 20%
• All samples are to be flow-weighted, including the “grab” samples for PFOAs/PFOSs and metals.
• Hafferty will confirm that adequate sample jars will be available from MEL.
• Roberts noted that sampling should occur Monday through Friday to maximize effluent strength. All sampling will be conducted Monday through Friday.
• Knight and Norton requested the metals analyte list be expanded. • Maroncelli will address this request for additional metals with MEL. • Maroncelli noted that any changes must result in a zero-sum change to the
current project budget. • Norton and Pelletier noted that the proposed low-resolution PCB method
in the QAPP would likely not provide adequate detection limits for trace level PCBs.
• After some discussion it was agreed that the low-res PCB analyses would be replaced by high-res tests. To stay within budget, only the 4 or 5 largest POTWS will be included. The Shelton POTW may replace one of the POTWs since it has one of the higher I & I factors for Puget Sound.
Action Items
• Maroncelli – Discuss PCB methodology (low-res/high-res) and additional metals to analyte list with Stuart Magoon, MEL.
• Michaud will prepare contingency table to address incomplete sampling and identify a go/no go threshold for sampling in response to rainfall events.
• Hafferty – Contact Magoon to address outside labs, bottle requirements, and compositing protocol
• Hafferty/Michaud – Complete Final QAPP for submittal to Ecology by January 19, 2008.

Avalanche Operating Instructions F

F. Avalanche Operating Instructions
F-1
Avalanche® refrigerated portable sampler operating instructions are available in hard copy (272 pages) and electronically as a 9 MB pdf. Rather than include the entire document in this appendix, a link to the instructions is provided below. http://www.isco.com/pcfiles/PartPDF4/UP0011XM.pdf

Field Activity Logbooks
G

Title: FIELD ACTIVITY LOGBOOKS
Category: DOC 2.1
Revised: April 1998
ecology and environment, inc.
FIELD ACTIVITY LOGBOOKS
STA
ND
AR
D O
PER
ATI
NG
PR
OC
EDU
RE
© 1998 Ecology and Environment, Inc.
368 Pleasant View Drive / Lancaster, New York 14086 / (716) 684-8060
TITLE: FIELD ACTIVITY LOGBOOKS
CATEGORY: DOC 2.1 REVISED: April 1998
None of the information contained in this Ecology and Environment, Inc., (E & E) publication is to be construed as granting any right, by implication or otherwise, for the manufacture, sale, or use in connection with any method, apparatus, or product covered by letters patent, nor as ensuring any-one against liability for infringement of letters patent. Anyone wishing to use this E & E publication should first seek permission from the company. Every effort has been made by E & E to ensure the accu-racy and reliability of the information contained in the document; however, the company makes no representations, warranty, or guarantee in connection with this E & E publication and hereby expressly disclaims any liability or responsibility for loss or damage resulting from its use; for any violation of any federal, state, or municipal regulation with which this E & E publication may conflict; or for the infringement of any patent resulting from the use of the E & E publication.
TITLE: FIELD ACTIVITY LOGBOOKS
CATEGORY: DOC 2.1 REVISED: April 1998
TABLE OF CONTENTS Section Page
1. Summary ..............................................................................................................................1
2. Purpose.................................................................................................................................1 2.1 Adequate Field Information/Quality Control...........................................................1
2.2 Work Plan Changes/Deviation.................................................................................1
2.3 Evidentiary Documentation .....................................................................................2
3. Guidelines ............................................................................................................................2 3.1 General Instructions .................................................................................................3
3.2 Format ......................................................................................................................4
3.3 Corrections...............................................................................................................5
4. Documentation.....................................................................................................................5 4.1 Prior to Fieldwork ....................................................................................................5
4.2 Site Sketch ...............................................................................................................6
4.3 Monitoring Equipment and Activities .....................................................................7
4.4 Sample Collection Activities ...................................................................................8
4.5 Photodocumentation ................................................................................................9
4.6 Data Collection Forms ...........................................................................................10
Appendix
A Sample Logbook ................................................................................................................11
iii

TITLE: FIELD ACTIVITY LOGBOOKS
CATEGORY: DOC 2.1 REVISED: April 1998
1. Summary This Standard Operating Procedure (SOP) establishes requirements for the entry of in-formation into logbooks to ensure that E & E field activities are properly documented. The pro-ject manager (PM) and the field team leader (FTL) are responsible for ensuring that logbook en-tries provide sufficient information for the completion of an accurate and detailed description of field operations and meets the requirements of the contract or technical direction document (TDD). This SOP describes logbook entry requirements for all types of projects, specifies the format that should be used, and provides examples. Some flexibility exists when implementing the SOP because different types of projects require different data collection efforts. This SOP does not address site safety logbook requirements or geotechnical logbook entries.
2. Purpose Complete and accurate logbook entries are important for several reasons: to ensure that data collection associated with field activities is sufficient to support the successful completion of the project; to provide sufficient information so that someone not associated with the project can independently reconstruct the field activities at a later date; to maintain quality control (QC) throughout the project; to document changes to or deviations from the work plan; to fulfill ad-ministrative needs of the project; and to support potential legal proceedings associated with a specific project. 2.1 Adequate Field Information/Quality Control QC procedures for data collection begin with the complete and systematic documentation of all persons, duties, observations, activities, and decisions that take place during field activities. It is especially important to fully document any deviations from the contract, project scope, work plans, sampling plans, site safety plans, quality assurance (QA) procedures, personnel, and re-sponsibilities, as well as the reasons for the deviations. Prior to entering the field, the project manager must indicate to the field team what perti-nent information must be collected during field activity in order to meet the desired objectives of the data collection effort. The PM is responsible for reviewing the adequacy of the project log-books both during and following completion of field activities, and is also responsible for meet-ing with the field team members to discuss any findings and to direct activities to correct any de-ficiencies, as appropriate. The PM also has the responsibility of ensuring that the logbooks be-come part of the project or TDD file. 2.2 Work Plan Changes/Deviation The logbook is the document that describes implementation of the work plan and other appropriate contract documents and provides the basis for the project reports. It must include
1

TITLE: FIELD ACTIVITY LOGBOOKS
CATEGORY: DOC 2.1 REVISED: April 1998
detailed descriptions of any and all deviation from the work plan and the circumstances that ne-cessitate such changes. These changes will be reviewed for compliance with data quality objec-tives and include:
Changes in procedures agreed to in the project planning stages;
Any conditions that prevent the completion of the field effort, or that result in additional fieldwork must be noted (i.e., weather delays, gov-ernment actions, physical obstructions, personnel/ equipment problems, etc.). Persons from whom permission was obtained to make such changes must be clearly documented.
Any modifications requested by the client or client's representative that
are contradictory to the contract or outside of the existing scope of work must be documented in detail because the cost of the project could be affected by such modifications.
2.3 Evidentiary Documentation Field activity documentation can become evidence in civil and/or criminal judicial pro-ceedings, as well as in administrative hearings. Field logbooks serve this purpose. Accordingly, such documentation is subject to judicial or administrative review. More importantly, it is sub-ject to the review of an opposing counsel who will attempt to discredit its evidentiary value. The National Enforcement Investigation Center (NEIC) and the United States Environ-mental Protection Agency (EPA) have prepared documents outlining their documentation needs for legal proceedings. These guidelines indicate the importance of accurate and clear documen-tation of information obtained during the inspections, investigations, and evaluations of uncon-trolled hazardous waste sites. Consequently, attention to detail must be applied by E & E per-sonnel to all field documentation efforts for all E & E projects. Project personnel must document where, when, how, and from whom any vital project information was obtained. This information is necessary to establish a proper foundation for admissible evidence.
3. Guidelines Logbooks should contain a summary of any meeting or discussion held with a client or with any federal, state, or other regulatory agency that was on site during the field activities. The logbook should also describe any other personnel that appear on site, such as representatives of a potential responsible party (PRP). The logbook can be used to support cost recovery activities. Data concerning site condi-tions must be recorded before the response activity or the passage of time eliminates or alters those conditions. Logbooks are also used to identify, locate, label, and track samples and their final disposition. In addition, data recorded in the logbook will assist in the interpretation of the analytical results. Logbooks are subject to internal and external audits. Therefore, the recorded information should be consistent with and capable of substantiating other site documentation such as time cards, expense reports, chain-of-custody forms, shipping papers, and invoices from suppliers and

TITLE: FIELD ACTIVITY LOGBOOKS
CATEGORY: DOC 2.1 REVISED: April 1998
subcontractors, etc. Logbooks also act as an important means of reconstructing events should other field documents such as data collection forms become lost or destroyed. Therefore, all mission-essential information should be duplicated in the logbook. 3.1 General Instructions The following general guidelines must be used for all logbooks:
At a minimum, one separate field activity logbook must be maintained for each project or TDD.
All logbooks must be bound and contain consecutively numbered
pages.
No pages may be removed for any reason, even if they are partially mutilated or illegible.
All field activities must be recorded in the site logbook (e.g., meetings,
sampling, surveys, etc.).
All information must be printed legibly in the logbook using water-proof ink, preferably black. If weather conditions do not permit this (i.e., if it is too cold or too wet to write with ink), another medium, such as pencil, may be used. The reason that waterproof ink was not used should be specifically noted in the logbook.
The language used in the logbook should be objective, factual, and free
of personal feelings or terminology that might prove inappropriate.
Entries should be made in chronological order. Contemporaneous en-tries are always preferred because recollections fade or change over time. Observations that cannot be recorded during field activities should be recorded as soon after as possible. If logbook entries are not made during field activities, the time of the activity/ observation and the time that it is recorded should be noted.
The first entry for each day will be made on a new, previously blank
page.
Each page should be dated and each entry should include the time that the activity occurred based on the 24-hour clock (e.g., 0900 for 9 a.m., 2100 for 9 p.m.).
At the completion of the field activity, the logbook must be returned to
the permanent project or TDD file.

TITLE: FIELD ACTIVITY LOGBOOKS
CATEGORY: DOC 2.1 REVISED: April 1998
3.2 Format The information presented below is not meant to be all-inclusive. Each project manager is responsible for determining the specific information requirements associated with a field activ-ity logbook. If someone other than the Project Manager is keeping the logbook, the Project Manager is responsible to convey to that individual, prior to the start of fieldwork, specific in-structions on what type of information is required to be entered into the logbook. Information requirements will vary according to the nature and scope of the project. (Refer to Appendix A for an example of a completed logbook.) Title Page The logbook title page should contain the following items:
Site name,
Location,
TDD No. or Job No.,
PAN (an EPA site/task identification number), if applicable,
SSID No. (Site ID number-assigned under CERCLA), if applicable,
Start/Finish date, and
Book of . First Page The following items should appear on the first page of the logbook prior to daily field activity entries:
TDD No. or Job No.,
Date,
Summary of proposed work (Reference work plan and contract documents, as apriate),
ppro-
Weather conditions,
Team members and duties, and
Time work began and time of arrival (24-hour clock).

TITLE: FIELD ACTIVITY LOGBOOKS
CATEGORY: DOC 2.1 REVISED: April 1998
Successive Pages In addition to specific activity entries and observations, the following items should ap-pear on every logbook page:
Date,
TDD or Job No., and
Signature (bottom of each page). If more than one person makes entries into the log-book, each person should sign next to his or her entry.
Last Page In addition to specific activity entries and observations and the items that should appear on each successive page, the last page of the logbook should contain a brief paragraph that sum-marizes the work that was completed in the field. This summary can become especially impor-tant later on if more or less work was accomplished during the duration of the field activity. 3.3 Corrections If corrections are necessary, they must be made by drawing a single line through the original entry in such a manner that it can still be read. Do not erase or render an incorrect no-tation illegible. The corrected entry should be written beside the incorrect entry, and the correc-tion must be initialed and dated. Most corrected errors will require a footnote explaining the cor-rection.
4. Documentation Although the requirements and content of the field logbook will vary according to the site and the tasks to be performed, the following information should be included in every logbook: 4.1 Prior to Fieldwork Summary of Proposed Work The first paragraph of each daily entry should summarize the work to be performed on that day. For example:
“Collect soil and groundwater samples from previously installed wells and ship samples to Analytical Services Center (ASC). Discuss removal with site owner.”
The first paragraph becomes especially important later when discussing work plan devia-tions or explaining why more or less work was accomplished for that day.

TITLE: FIELD ACTIVITY LOGBOOKS
CATEGORY: DOC 2.1 REVISED: April 1998
Personnel Each person to be involved in activities for the day, his/her respective role (sampler, health and safety, etc.), and the agency he/she represents should be noted in the logbook. On-Site Weather Conditions Weather conditions may have an impact on the work to be performed or the amount of time required to perform the proposed work; therefore, all weather on-site weather conditions should be noted, including temperatures, wind speed and direction, precipitation, etc., and up-dated as necessary. Similarly, any events that are impacted by weather conditions should be noted in the logbook. Site Safety Meeting Although minutes should be recorded for all site safety meetings under separate cover, the logbook should briefly summarize the site safety meeting and any specific site conditions and resultant site safety concerns. 4.2 Site Sketch A site sketch should be prepared on the first day of field activities to indicate prominent site and environmental features. The sketch should be made either to scale or by noting the ap-proximate distances between site feature. Area-specific sketches should be prepared as work is undertaken in such areas, and updated sketches should be drawn as work progresses. Site Features Examples of features to be noted on the site sketch include the following:
Structures such as buildings or building debris;
Drainage ditches or pathways, swales, and intermittent streams (include direction of overland runoff flow and direction of stream flow);
Access roads, site boundaries, and utility locations;
Decontamination and staging areas;
Adjacent property data: the type of property that borders the site, in-
formation pertaining to ownership, and available addressees; and
North arrow.

TITLE: FIELD ACTIVITY LOGBOOKS
CATEGORY: DOC 2.1 REVISED: April 1998
Changes in Site Conditions Any deviation from previous site sketches or drawings presented in the work plan, and any changes that have occurred since the last site visit must be noted. Differences to be noted include the following:
Demolished buildings;
Changes to access routes;
Damage to wells or equipment, or changes to the amount of such equipment believed to be on site,
Changes resulting from vandalism;
Destruction of reference points;
Changes resulting from environmental events or natural disasters; and
Locations of excavations, waste piles, investigation-derived waste
(IDW), drum staging areas, etc. In short, any site condition that varies from the conditions described in the work plan should be noted. 4.3 Monitoring Equipment and Activities Any monitoring equipment used during field activities should be documented in the log-book. Information to be noted includes:
The type of equipment with model and serial numbers. (HNu, OVA, etc.);
The frequency at which monitoring is performed;
Calibration results and the frequency at which the equipment is cali-
brated or tested;
Background readings;
Any elevated or unusual readings; and
Any equipment malfunctions. It is particularly important to note elevated or unusual equipment readings because they could have an impact on personal protection levels or the activities to be performed on site. If a

TITLE: FIELD ACTIVITY LOGBOOKS
CATEGORY: DOC 2.1 REVISED: April 1998
change in the proposed work or protection levels occurs, it should be clearly noted in the log-book. 4.4 Sample Collection Activities Because it represents the first step in an accurate chain-of-custody procedure, field sam-pling documentation must be complete. The following items should be documented in the log-book: Sample Collection Procedures The following items pertaining to sample collection procedures should be included in the logbook:
Any pre-sampling activities (i.e., well purging and the number of volumes purged be-fore sample collection);
Results of the pre-sampling activities (i.e., pH/conductivity/ tempera-
ture readings for well water, results of hazard categorization testing, etc.);
Any environmental conditions that make sample collection difficult or
impossible (i.e., dry or flooded drainage paths, inclement weather con-ditions, etc.); and
Any deviation from the work plan (i.e., additional samples and the rea-
son for their collection, alternate sample locations, etc.). Sample Information The following information regarding sample data should be recorded in the logbook:
Sample number and station location including relationship to perma-nent reference point(s);
Name(s) of sampler(s);
Sample description and any field screening results;
Sample matrix and number of aliquots if a composite sample;
Preservatives used, recipient laboratory, and requested analyses;
QA/QC samples; and
Shipping paper (airbill) numbers, chain-of-custody form numbers, and
jar lot numbers.

TITLE: FIELD ACTIVITY LOGBOOKS
CATEGORY: DOC 2.1 REVISED: April 1998
Investigation-Derived Waste/Sample Shipment Details pertaining to sampling equipment, decontamination, and IDW should be clearly delineated in the work plan. However, the following information should be included in the log-book:
The type of IDW generated an the number of containers generated (each drum should be numbered and its contents noted);
All information relevant to the characterization of the IDW;
Any directions received from the client/workplan/contract relative to
the management of the IDW;
The disposition of IDW (left on site or removed from site);
The number of sample containers shipped to the ASC or laboratory and the courier used (i.e., Federal Express, Airborne Express, etc.);
Airbill or shipment tracking numbers; and
The type of paperwork that accompanied the waste/sample shipment
(e.g., manifests, etc.). 4.5 Photodocumentation Photographs should be taken during all relevant field activities to confirm the presence or absence of contaminants encountered during fieldwork. Specific items to be documented in-clude:
Sample locations and collection activities;
Site areas that have been disturbed or impacted, and any evidence of such impacts (i.e., stressed vegetation, seepage, discolored water, or debris);
Hazardous materials requiring disposal, including materials that may
not appear in the work plan;
Any evidence that attests to the presence or absence of contamination; and
Any features that do not appear in the work plan or differ from those
described in the work plan.
TITLE: FIELD ACTIVITY LOGBOOKS
CATEGORY: DOC 2.1 REVISED: April 1998
Documentation of any photographs taken during the course of the project must be pro-vided in the logbook with a detailed description of what is shown in the photograph and the rea-son for taking it. This documentation should include:
Make, model, and serial numbers of the camera and lens,
Film type and number of exposures,
Roll and frame number of the photograph;
Direction or view angle of the photograph, and
Name of the photographer.
4.6 Data Collection Forms Certain phases of fieldwork may require the use of project-specific data collection forms, such as task data sheets or hazard categorization data sheets. Due to the specific nature of these forms, the information that should be included in the logbook cannot be fully discussed in this SOP. However, the following data should be included in the logbook:
Results of any field tests or hazard categorization tests (i.e., ignitability, corrosivity, reactivity, etc.);
The source from which any field sample was collected and its condi-
tion (i.e., drum, tank, lagoon, etc.).
Other conclusions as a result of the data collected on data collection forms.
In many cases, rubber stamps that contain routine data collection forms can be manufac-tured ahead of time. These forms can be stamped into the logbook on an as-needed basis.

TITLE: FIELD ACTIVITY LOGBOOKS
CATEGORY: DOC 2.1 REVISED: April 1998
Appendix A
Sample Logbook
11

TITLE:FIELD
AC
TIVITY LOG
BO
OK
S
CA
TEGO
RY:
DO
C 2.1
REVISED
: April 1998

TITLE:FIELD
AC
TIVITY LOG
BO
OK
S
CA
TEGO
RY:
DO
C 2.1
REVISED
: April 1998

TITLE:FIELD
AC
TIVITY LOG
BO
OK
S
CA
TEGO
RY:
DO
C 2.1
REVISED
: April 1998
SOPs: Low Level Metals Water Sampling
H

H. SOPs: Low Level Metals Water Sampling
H-1
STANDARD OPERATING PROCEDURES
Low-Level Metals Water Sampling
SOP No. 2007
Herrera Environmental Consultants, Inc. 2200 Sixth Avenue, Suite 1100
Seattle, Washington 98121 Telephone: 206/441-9080
Rev. #1 2/5/02
February 12, 2009

Contents
1.0 Scope and Application............................................................. H-5
2.0 Method Summary ..................................................................... H-5
3.0 Sample Preservation, Containers, Handling, and Storage ... H-5
4.0 Interferences and Potential Problems .................................... H-6
5.0 Equipment/Apparatus .............................................................. H-6
6.0 Reagents ................................................................................... H-7
7.0 Procedures ............................................................................... H-7 7.1 Preparation .......................................................................................................... H-7 7.2 Sample Collection ............................................................................................... H-8
7.2.1 Clean Hands and Dirty Hands Protocol Performed by One Field Technician ........................................................................................... H-8
7.2.2 Clean Hands and Dirty Hands Protocol Performed by Two Field Technicians .......................................................................................... H-8
8.0 Calculations .............................................................................. H-9
9.0 Quality Assurance/Quality Control ......................................... H-9
10.0 Data Validation ......................................................................... H-9
11.0 Health and Safety ..................................................................... H-9
12.0 References .............................................................................. H-10
February 12, 2009 H-3 Herrera Environmental Consultants

Surface Water Sampling—Standard Operating Procedures
1.0 Scope and Application This standard operating procedure (SOP) is applicable to the collection of low-level metals water samples from streams, rivers, lakes, ponds, and wells. It includes samples collected from depth, as well as samples collected from the surface. These are standard (i.e., typically applicable) operating procedures which may be varied or changed as required, dependent upon site conditions, equipment limitations or limitations imposed by the procedure or other procedure limitations. In all instances, the ultimate procedures employed should be documented and associated with the final report.
The purpose of this SOP is to establish a uniform procedure for collecting low-level metal concentrations water samples. In developing these methods, one of the greatest difficulties in measuring low-level metals in water was precluding sample contamination during collection, transport, and analysis (USEPA 1996). The degree of difficulty, however, is highly dependent on the metal and site-specific conditions. This SOP, therefore, is designed to provide the level of protection necessary to preclude contamination in nearly all situations. It is also designed to provide the procedures necessary to produce reliable results at the lowest possible water quality criteria. The ease of contaminating ambient water samples with the metal(s) of interest and interfering substances cannot be overemphasized. This SOP includes “clean” sampling techniques that should maximize the ability of the sampler(s) to collect water samples reliably and eliminate sample contamination, thus providing the highest quality data.
2.0 Method Summary Sampling situations vary widely, therefore, no universal sampling procedure can be recommended. However, sampling water for low-levels metals analysis is generally accomplished through the use of the clean hands and dirty hands protocol, including:
• Clean hands and dirty hands protocol performed by one field technician • Clean hands and dirty hands protocol performed by two field technicians.
These sampling techniques will allow for the collection of representative samples from the majority of surface waters and impoundments encountered.
3.0 Sample Preservation, Containers, Handling, and Storage Once samples have been collected, the following procedure should be followed:
1. Use clean hand and dirty hand procedure for one or two technicians (see Procedures section)
2. Transfer the sample(s) into suitable sample containers.
3. Preserve the sample if appropriate
4. Do not overfill bottles if they are pre-preserved.
February 12, 2009 H-5 Herrera Environmental Consultants

Surface Water Sampling—Standard Operating Procedures
5. Cap the container, place in two Ziploc plastic bags and cool to 4°C.
6. Label inner Ziploc bag (which can be performed prior to sampling) with sample ID information.
7. Record all pertinent data in the site logbook and on field data sheets.
8. Complete the Chain of Custody record.
9. Attach custody seals to cooler prior to shipment.
10. Decontaminate all sampling equipment prior to the collection of additional samples.
4.0 Interferences and Potential Problems There are numerous routes by which water samples may become contaminated with trace metals. Potential sources of trace metals contamination during sampling include metallic or metal-containing sampling equipment, containers, talc (powdered) gloves, and improperly cleaned and stored equipment, labware, and reagents. Atmospheric inputs pose another potential source of contamination, including dirt and dust from automobile exhaust, cigarette smoke, nearby roads, bridges, wires, and poles. Even human contact can be a source of trace metals contamination. For example, it has been demonstrated that dental work (e.g., mercury amalgam fillings) in the mouths of laboratory personnel can contaminate samples that are directly exposed to exhalation (USEPA 1996). Contamination by carryover is another source of potential trace metal contamination. Contamination may occur when a sample containing low concentrations of metals is processed immediately after a sample containing relatively high concentrations of these metals. At sites where more than one sample will be collected, the sample known or expected to contain the lowest concentration of metals should be collected first with the sample containing the highest levels collected last. This will help minimize carryover of metals from high concentration samples to low concentration samples. If the sampling team does not have prior knowledge of the waterbody, or when necessary, the sample collection system should be rinsed with dilute acid and reagent water or be replaced with a new clean sample collection system between samples and followed by collection of a field blank. 5.0 Equipment/Apparatus Equipment needed for collection of low-level metals water samples may include:
• Sample bottles/preservatives • Ziploc bags • Powder-free gloves • Field portable glove bag • Ice • Coolers
Herrera Environmental Consultants H-6 February 12, 2009

Surface Water Sampling—Standard Operating Procedures
• Filters • Chain of Custody records, custody seals • Field data sheets • Decontamination equipment • Maps/plot plan • Safety equipment • Peristaltic pump • Peristaltic batteries (i.e., 12 volt batteries) • Precleaned fluoropolymer or styrene/ethylene/butylene/ silicone (SEBS) tubing • Tyvek® coveralls • Depth sounder • Compass • Tape measure • Survey stakes, flags, or buoys and anchors • Camera • Logbook/waterproof pen • Sample bottle labels.
6.0 Reagents Reagents will be utilized for preservation of samples and for decontamination of sampling equipment. The preservatives required are specified in the sampling plan for each analysis to be performed.
7.0 Procedures 7.1 Preparation
1. Determine the extent of the sampling effort, the sampling methods to be employed, and the types and amounts of equipment and supplies needed.
2. Obtain the necessary sampling and monitoring equipment.
3. Clean all sampling equipment and sample containers in a laboratory or cleaning facility using detergent, mineral acids, and reagent water.
4. All sampling equipment and sample containers should be nonmetallic or free from any material that may contain metals.
5. Determine the appropriate number and type of blanks (i.e., field blanks, filter blanks, equipment blanks, etc.)
6. Prepare scheduling and coordinate with staff, clients, and regulatory agency, if appropriate.
7. Perform a general site survey prior to site entry, in accordance with the site specific Health and Safety Plan.
February 12, 2009 H-7 Herrera Environmental Consultants

Surface Water Sampling—Standard Operating Procedures
8. Stakes, flagging, or buoys may be used to mark sampling locations. Care should be taken not to disturbe sediment at the sample location. If required, the proposed locations may be adjusted based on site access, property boundaries, and surface obstructions.
7.2 Sample Collection 7.2.1 Clean Hands and Dirty Hands Protocol Performed by One Field
Technician Prior to sample collection, the field technician will put on a new set of gloves (i.e., clean powder-free gloves made of polyethylene, latex, or vinyl) for each sequence of clean and dirty hands operations that is required for proper implementation of the protocol. The sequence of clean and dirty hands operations that will be used by one technician during sampling is described in detail as follows:
1. Dirty hands (two sets of new gloves):
a. Open the cooler with sample bottles. b. Remove double-bagged sample bottle from cooler. c. Unseal outer bag.
2. Clean hands (remove outer set of gloves):
a. Unseal inner bag containing the sample bottle. b. Remove bottle and unscrew cap. c. Rinse inside of bottle three times with water to be sampled (if sample
contains no preservative). d. Fill sample bottle, keeping sample bottle upwind and away from
technician exhalation pathway (do not breathe near sample bottle). e. Return sample bottle to inner bag. f. Reseal inner bag. g. Reseal outer bag. h. Return double-bagged sample to cooler.
7.2.2 Clean Hands and Dirty Hands Protocol Performed by Two Field Technicians
Prior to sample collection, both field technicians will put on a two sets of new gloves (i.e., clean powder-free gloves made of polyethylene, latex, or vinyl) for each sequence of clean and dirty hands operations that is required for proper implementation of the protocol. The sequence of clean and dirty hands operations that will be used by two technicians during sampling is described in detail as follows:
1. Dirty hands technician (remove outer set of gloves):
a. Open the cooler with sample bottles.
Herrera Environmental Consultants H-8 February 12, 2009

Surface Water Sampling—Standard Operating Procedures
b. Remove double-bagged sample bottle from cooler. c. Unseal outer bag.
2. Clean hands technician (remove outer set of gloves):
a. Unseal inner bag containing the sample bottle. b. Remove bottle and unscrew cap. c. Rinse bottle three times in water to be sampled (if sample contains no
preservative). d. Fill sample bottle, keeping sample bottle upwind and away from
technician exhalation pathway (do not breathe near sample bottle). e. Return sample bottle to inner bag. f. Reseal inner bag. g. Reseal outer bag (either technician). h. Return double-bagged sample to cooler (either technician).
8.0 Calculations This section is not applicable to this SOP.
9.0 Quality Assurance/Quality Control There are no specific quality assurance (QA) activities which apply to the implementation of these procedures. However, the following general quality control (QC) procedures apply:
1. All field conditions must be documented on field data sheets or within site logbooks.
2. All instrumentation must be operated in accordance with operating instructions as supplied by the manufacturer, unless otherwise specified in the work plan. Equipment checkout and calibration activities must occur prior to sampling or operation and they must be documented.
3. The appropriate number and type of blanks need to be included in the sampling plan to confirm that the low-levels metals water sampling procedures were adequate.
10.0 Data Validation This section is not applicable to this SOP.
11.0 Health and Safety When working with potentially hazardous materials, follow U.S. EPA, OSHA and corporate health and safety procedures.
The sampling team member collecting the sample should not get too close to the edge of the impoundment where bank failure may cause him/her to lose his/her balance. The person performing the sampling should be on a lifeline and wear adequate protective equipment. When
February 12, 2009 H-9 Herrera Environmental Consultants

Surface Water Sampling—Standard Operating Procedures
Herrera Environmental Consultants H-10 February 12, 2009
conducting sampling from a boat in an impoundment or flowing waters, appropriate boating safety procedures should be followed.
12.0 References USEPA. 1996. Method 1669: Sampling ambient water for trace metals at EPA water quality criteria levels. U.S. Environmental Protection Agency, Office of Science and Technology, Washington, D.C. (EPA-821/R-96-008).


