47
1 Private Equity: Beyond the “storytelling” Aswath Damodaran Home page: http://www.damodaran.com Twitter: @AswathDamodaran Blog: http://aswathdamodaran.blogspot.com

1!
Private Equity: Beyond the “storytelling”!
Aswath Damodaran Home page: http://www.damodaran.com ���
Twitter: @AswathDamodaran Blog: http://aswathdamodaran.blogspot.com

2!
The “private equity” debate: Key questions!
1. What is private equity investing? 2. Who are these “private” equity investors? 3. Who do they target? 4. What do they do at these targets? 5. Do they make money? 6. Do they do good or bad?

3!
What is private equity?!

4!
To understand private equity, you have to go back to the basics..!
Assets Liabilities
Assets in Place Debt
Equity
Lenders, both short and long term, get first claim whatever cash flow is generated by the firm.
Equity investors get whatever is left over, after meeting the debt obligations.
Growth Assets
Value of inestments you have already made as a company over your history. Their value is updated to reflect their current cash flow potential.
Value of investments you expect the company to take int the future. This value rests on perceptions of the opportunities you see for the firm.
Sources of equity!Private: Owner, Venture Capital, Institutions!Public: Stockholders (individual, institutional)!

5!
An idea business to IPO!

6!
A public company matures…!

7!
A real world picture…!

8!
The “corporate governance” and “market” problems…!
Insider(s) 4%
Public 96%
Mature public
1. Market may be mispricing the firm 2. The company may be operating in a “bad” business or its business model could be broken. 3. The company may be mismanaged.

9!
And there are lots of “poor” performing companies in the market!

10!
A “road map” for “value” creation!
Status Quo ValueIntrinsic value of firm with
existing management
Optimal ValueIntrinsic value with "best"
management in place
X X
1 - Probability (Management Change) Probability (Management Change)
Expected value = Status Quo value (1- Prob(chg))+ Optimal Value (Prob(change)Market Value
Pricing Gap
Value Gap

11!
Provide an entrée for private equity!
Insider(s)
Public 96%
Mature public Gets “key” managers to buy in as “equity” investors.!
The general partners (GP) of the PE firm raise equity capital from limited partner (LP) “equity investors and borrow the rest!
Insider(s) 15%
Private equity: Borrowed
40%
Private equity: GP Equity 25%
Private equity: LP Equity
20%
Private equity

12!
The time line for PE… with risks at each stage!
"Public" company acquired with mix of debt & equity and taken private
Run as a private company, with changes made to asset mix and operations
Private equity investors come up with the equity portion of the transaction
Private equity investors provide "management" and "strategic" input, and receive management fees and residual cash payouts.
"Fixed" company is taken back public or sold to a public company.
Private equity investors sell their equity stake in the public market at market prices.
Risks1. Wrong target2. Too high a price
RisksIf business model fails or economy weakens:1. Asset sales disappoint2. Too much debt
RisksMarket/Sector weakness leads to poor exit values

13!
Who are these “private” equity investors?!

14!
Private equity has grown over time… but remains cyclical!
0
100
200
300
400
500
600
1980
1981
1982
1983
1984
1985
1986
1987
1988
1989
1990
1991
1992
1993
1994
1995
1996
1997
1998
1999
2000
2001
2002
2003
2004
2005
2006
2007
2008
2009
2010
2011
US Buyout Deal value: 1980-2011
Strong economy & rising markets!
Conglomerate inefficiency & Junk bond markets!
Credit bubble & Cheap debt!

15!
And it is an increasingly global phenomenon!

16!
With Emerging Market companies leading the way…!

17!
Here are the biggest players..!

18!
But many of these institutions have individuals behind them…!

19!
Who do they target?!

20!
Who do they target?!
The typical target company in a PE buyout is one that is under performing its peer group in profitability and stock price performance, and with relatively small insider holdings.!

21!
And what are their reasons?!
You have to be able to buy the target company at the right price.!

22!
And are spread around sectors…!

23!
And what do they try to do at these firms?!

24!
Cashflows from existing assetsCashflows before debt payments, but after taxes and reinvestment to maintain exising assets
Expected Growth during high growth period
Growth from new investmentsGrowth created by making new investments; function of amount and quality of investments
Efficiency GrowthGrowth generated by using existing assets better
Length of the high growth periodSince value creating growth requires excess returns, this is a function of- Magnitude of competitive advantages- Sustainability of competitive advantages
Stable growth firm, with no or very limited excess returns
Cost of capital to apply to discounting cashflowsDetermined by- Operating risk of the company- Default risk of the company- Mix of debt and equity used in financing
(1) How well do you manage your existing investments/assets?a. Cost cuttingb. Asset divestituresc. Tax managementd. Working capital management
(2) Are you investing optimally fo future growth?a. If ROC < WACC, invest lessb. If ROC > WACC, invest more
(3) Is there scope for more efficient utilization of exsting assets?
(4) Are you building on your competitive advantages?a. Augment existing advantagesb. Find new barriers to entry
(5) Are you using the right amount and kind of debt for your firm?a. Change mix of debt and equityb. Match debt to assetsc. Make your products less discrtionaryd. Reduce fixed costs
With young growth firms, start of the life cycle: Focus on (2)With established growth firms, later in life cycle: Focus on (2, (4) and (5)
With mature firms, middle of life cycle: Focus on (1), (3) and (5)With declining firms, end of life cycle: Focus on (1) and (5)

25!
On the “governance” part… they push for changes!
Board of directors: The board of directors at target firms is picked by the equity investors in the buyout deal and therefore is more active in overseeing management. – Boards of the targeted firms tend to become smaller and meet more
frequently after buyouts. – More of the directors are picked for their expertise in the target firm’s
business Top management: While some of the managers in the target firm are
part of the buyout team, there is also a greater push on accountability and compensation: – The likelihood of CEO turnover jumps at firms that have been, increasing
5.5% after the targeting. One study found that two-thirds of CEO of buyout companies were replaced within four years of buyout.
– CEO compensation decreases in the targeted firms in the years after the activism, with pay tied more closely to performance.
26!
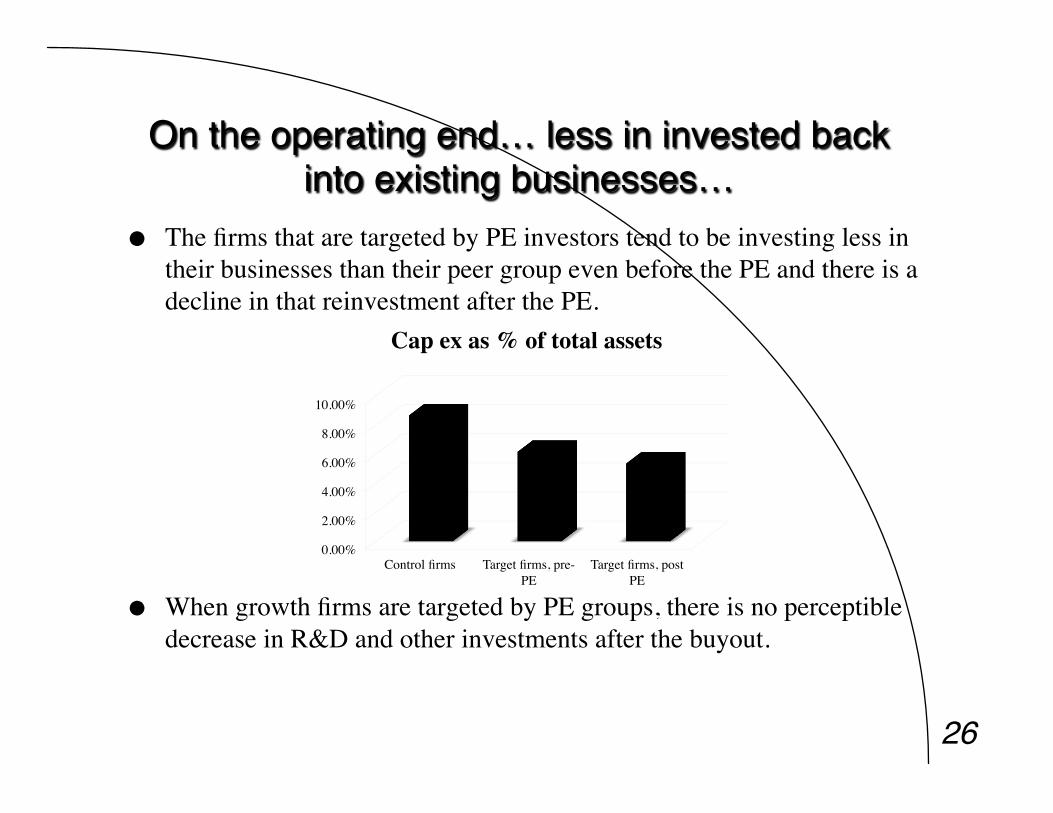
On the operating end… less in invested back into existing businesses… !
The firms that are targeted by PE investors tend to be investing less in their businesses than their peer group even before the PE and there is a decline in that reinvestment after the PE.
When growth firms are targeted by PE groups, there is no perceptible decrease in R&D and other investments after the buyout.
0.00%
2.00%
4.00%
6.00%
8.00%
10.00%
Control firms Target firms, pre-PE
Target firms, post PE
Cap ex as % of total assets

27!
And there is asset redeployment!
There is an increase in divestitures, especially in non-core businesses, for firms with business sprawl.
There is very little evidence of wanton stripping of assets for cash, i.e., the divestitures are generally not overboard are driven by the need to service debt.
At the same time, many targeted firms find new businesses to invest in and change their asset mix.
28!
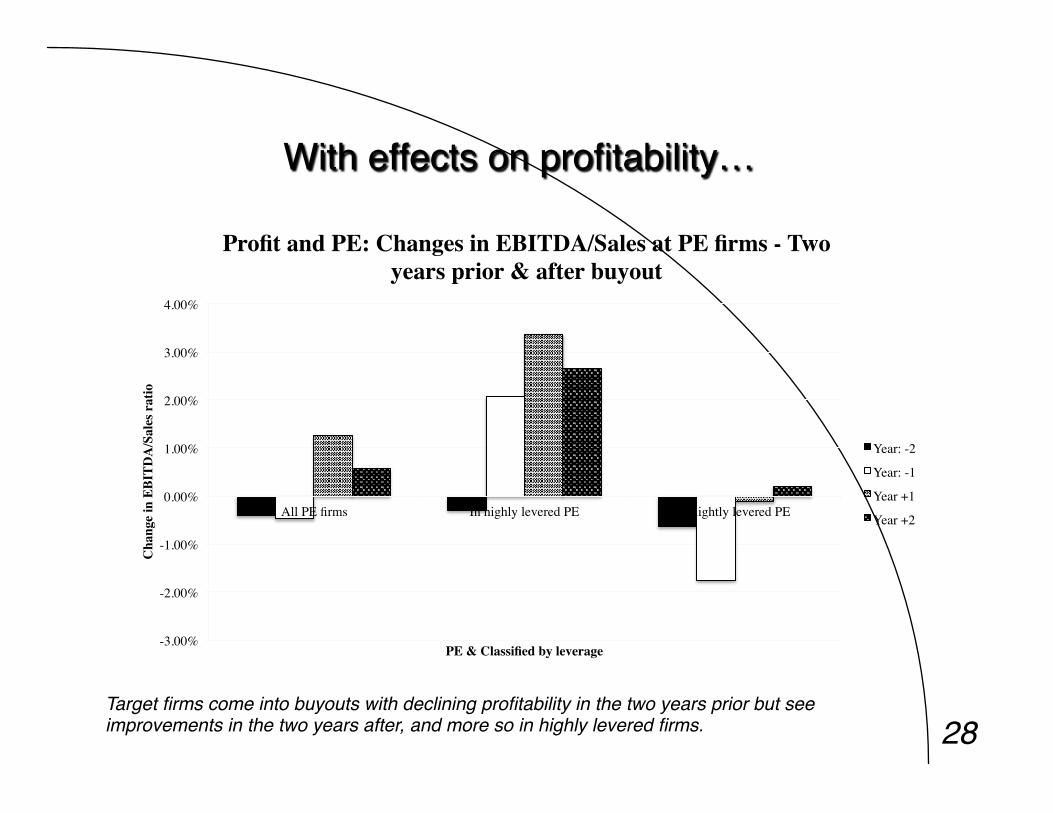
With effects on profitability…!
-3.00%
-2.00%
-1.00%
0.00%
1.00%
2.00%
3.00%
4.00%
All PE firms In highly levered PE In lightly levered PE
Cha
nge
in E
BITD
A/S
ales
rat
io
PE & Classified by leverage
Profit and PE: Changes in EBITDA/Sales at PE firms - Two years prior & after buyout
Year: -2
Year: -1
Year +1
Year +2
Target firms come into buyouts with declining profitability in the two years prior but see improvements in the two years after, and more so in highly levered firms.!

29!
On the financial front… they do borrow money to finance the deal..!
0%
10%
20%
30%
40%
50%
60%
70%
80%
2000
2001
2002
2003
2004
2005
2006
2007
2008
2009
2010
2011
Debt as % of Transaction Value: Buyouts from 2000-2011
0
1
2
3
4
5
6
7
2000
2001
2002
2003
2004
2005
2006
2007
2008
2009
2010
2011 D
ebt a
s mul
tiple
of E
BITD
A
Debt as multiple of EBITDA at Buyout Companies
Subordinated debt
Senior debt
PE investors use more debt in funding transactions than other public companies.!
Default risk increase as debt increases as % of value and cash flows!
Existing bondholders/lenders may be adversely affected, if they did not protect themselves.!

30!
But the PE record on default is only slightly worse than it is for non-PE firms with similar leverage…!
0.00%
2.00%
4.00%
6.00%
8.00%
10.00%
12.00%
14.00%
16.00%
18.00%
20.00%
% o
f firm
s tha
t def
aulte
d du
ring
yea
r
Default rates: PE versus non-PE firms
Non-PE firms
PE firms
PE firms are less likely to be liquidated (11% vs 16%) & stay in bankruptcy for shorter periods than non-PE firms.!
One study found that only 1.2% of PE firms defaulted between 1980 & 2002. In contrast, the default rate across all publicly traded firms was 1.6%.!

31!
And on dividend policy, there is little evidence that PE firms strip firms and cash out…!
Special dividends: While there are some who fear that PE investors pay themselves large dividends right after they take over target firms, special dividends remain rare. A study of 788 private equity targets, tracked from 1993 to 2009 found only 42 instances of special dividends paid to PE investors.
Asset strips: While there are undoubtedly some PE houses that turn target companies into ATMs, selling assets and drawing cash out of them, they are not the norm.

32!
Do they make money?!

33!
When the transaction is announced…!
34!
Ways for PE to generate profits from the transaction!
Management fees: When the PE investor runs the company as a private business, the company will pay management fees for the services rendered by the PE investor.
Make equity stake more valuable before exit: By finding market mistakes, making operating fixed or through financial engineering, try to reap the difference in value at exit (by taking company back public or by selling in a private transaction).

35!
Breaking down the returns to PE investors!

36!
The returns to PE investors!
On average, PE investors deliver about 3% more each year than equivalent public investments. !

37!
But excess returns vary widely across PE investors..!

38!
And even the best PE investors lose sometimes.. But make up with big winners!

39!
Is private equity a net good or net bad?!
The “critiques”

40!
The critiques of private equity!
Use of debt exploits the tax code: PE investors “unfairly” exploit the tax code’s tilt towards debt by borrowing large amounts to fund their deals.
PE profits are not taxed enough: In particular, the “carried interest” should be taxed at ordinary tax rates, not capital gains rates.
PE investment destroy jobs: Even if PE investors make companies more profitable, they do so by eliminating jobs.
PE is disruptive: PE disrupts businesses, changing the way they are run and causing stress for those involved in these businesses.
41!
Their “debt usage” exploits the tax code..!
It is true that private equity investors increase “debt” at the companies that they target and take private and do so because the tax code gives tax an advantage over equity.
Note, though, that this tilt in the tax code is available to every company and to most investors and that the tax benefit given to debt does not imply that every business is better off borrowing more money. Debt does come with costs – bankruptcy and agency – that increase as you borrow more and at some point, the costs exceed the benefits.
Bottom line: If you want to take issue with investors, businesses and individuals borrowing money because the tax code is tilted towards debt, your target should be those who write the tax code, not those who are governed by it.
42!
And so does the treatment of “carried interest”!
Private equity fund managers (general partners) generally structure their “payoff” from “ from other equity investors in the fund (limited partners) into two components: – A share of the “committed” capital under management (usually 2%) – A share of the “profits” (usually 20%) in the target firms, over and above
what the they are entitled to on their equity holdings, that is categorized as carried interest. It is generally not paid out until the private equity fund exits the investment.
Management fees are taxed as ordinary income and carried interest as capital gains. Critics argue that carried interest is really compensation for investment services and should be taxed as ordinary income. PE investors argue that it is “extra” return to compensate for the risk they face as general partners.
Bottom line: Allowing PE investors to structure the deal as 2/20, you are allowing them to decide what portion is income and what portion is capital gains and to disguise what should be ordinary income as capital gains.

43!
PE causes job losses… or does it?!
PE investors are viewed as job destroyers, who make their profits from shrinking companies and payroll.
The evidence on PE job destruction is surprisingly murky. A study that looked at 3200 target firms between 1980 and 2005 found that while jobs were lost in the target, they were also created in new businesses that these firms entered:
-6%
-4%
-2%
0%
2%
4%
6%
In 2 years In 5 years
% jo
bs g
aine
d/lo
st re
lativ
e to
co
ntro
l gro
up
Private Equity: Job destroyer & creator
Jobs lost
Jobs created
Net jobs

44!
PE investors disrupt businesses…. But is that a bad thing?!
It is true that PE investors are a disruptive influence, causing big changes in the ways the businesses that they target are run and financed. That disruption comes with both social and economic costs.
In some cases, the disruption can also create social costs that are not borne by the private equity investor. The social costs can range the spectrum from unemployment benefits/retraining costs for employees who get laid off to bigger costs if the government steps in as a lender of last resort or a back stop (too big to fail… too important to let go…)
Bottom line: Socializing costs while privatizing benefits is a problem in any capitalist society. But disruption is the life blood of that society. Without creative destruction, you get stagnation and no innovation.
45!
Imagine…!
Let’s say you buy into one or more of the critiques of private equity and feel that the only solution is to eliminate private equity. Imagine a world without private equity investors and ask the following questions:
Micro questions – Would managers at companies by relieved, indifferent or upset? – How would it impact employees at these companies? – What about customers? – What about stockholders and lenders?
Macro questions – Would we collect more tax revenue? – Would the overall economy be stronger or weaker? – Would we have more or less employment?

46!
Closing thoughts…!
47!
In my view…!
Private equity investors can play a critical role in corporate governance by putting managers at publicly traded companies on notice. In the process, they can and will make money for themselves, but other investors can piggy back on their efforts.
My problem with private equity investors is not that they are not “activist” enough in pushing for change at target companies and that they give up too easily when confronted with resistance.
When they do make changes, I think they focus too much on changes in financing policy, often over estimating the tax benefits of debt and under estimating the costs, and not enough on operating changes.
In short, I would like to see more PE investors live up to the stereotype and not behave like value investors.


