Private Equity Trends 1Q 2012Presentation Slide Deck
Try the PitchBook Platform:Email: [email protected] Phone: 1-877-267-5593
Consult the Research Team:Email: [email protected]: 1-877-636-3496
Source:PitchBook
The PitchBook Platform
REQUEST A DEMO:[email protected]
1-877-267-5593
Private EquityDeal Flow
Source:PitchBook
2011 PE Investment Above 2009 LowsNumber of Deals Closed (red line) and Total Capital Invested by Year (blue bars)
Source:PitchBook
2011: The Year of Two HalvesNumber of Deals Closed and Total Capital Invested by Quarter
Source:PitchBook
Midwest Led PE Deal Flow with 360 Deals Percentage of Deal Volume (count) by Region
Source:PitchBook
B2B and B2C Dominate PE Deal ActivityPercentage of Deal Volume (count) by Industry
Source:PitchBook
B2B and B2C Deal Flow Increased in 2011Percentage of Deal Volume (count) by Industry
Source:PitchBook
Capital Investment Continued Shift to IT, Healthcare & EnergyPercentage of Deal Volume (capital) by Industry
Source:PitchBook
Deals Under $250M Accounted for 75% of Deal FlowPercentage of Deal Volume (count) by Deal Size Range
Source:PitchBook
Large Deals Attracted More Capital InvestmentPercentage of Deal Volume (capital) by Deal Size Range
Source:PitchBook
Add-ons Continue to Sweeten DealsAdd-on Deals as Percentage of Buyout Deals
Source:PitchBook
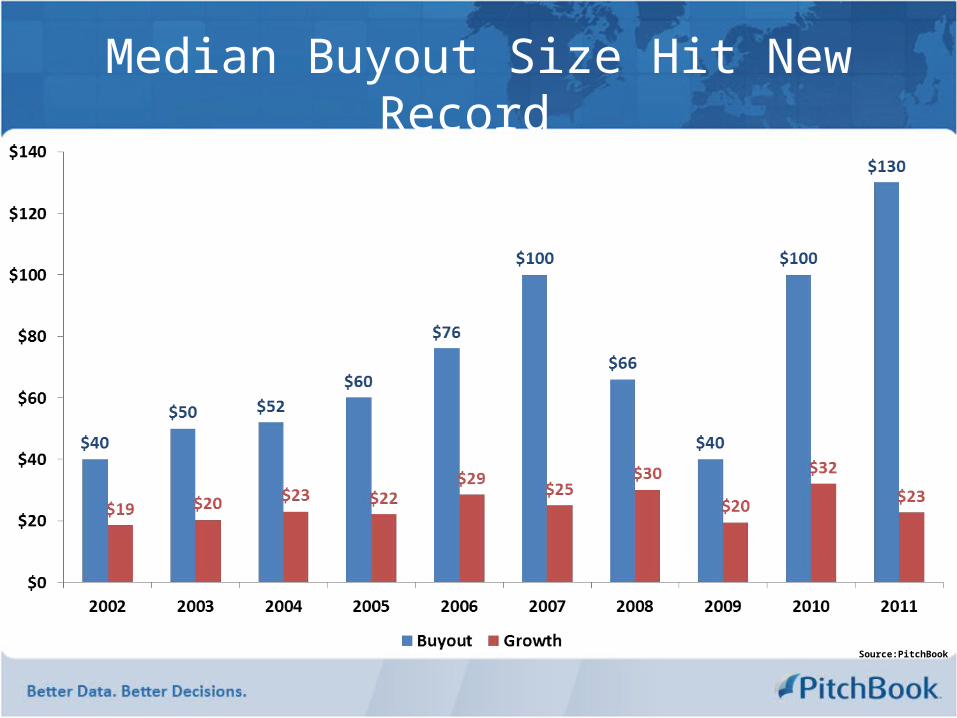
Median Buyout Size Hit New Record Median Capital Invested in U.S. PE Transactions
Source:PitchBook
Still Low Leverage in the Middle MarketPercentage of Debt Used in Buyouts
Source:PitchBook
Buyout Multiples Finished Close to 2008 High EBITDA Multiples of Buyout Transactions
Private EquityExits
Source:PitchBook
Private Equity Exits on Par with 2010Annual PE Exits by Corporate Acquisition, IPO and Secondary Sale
Source:PitchBook
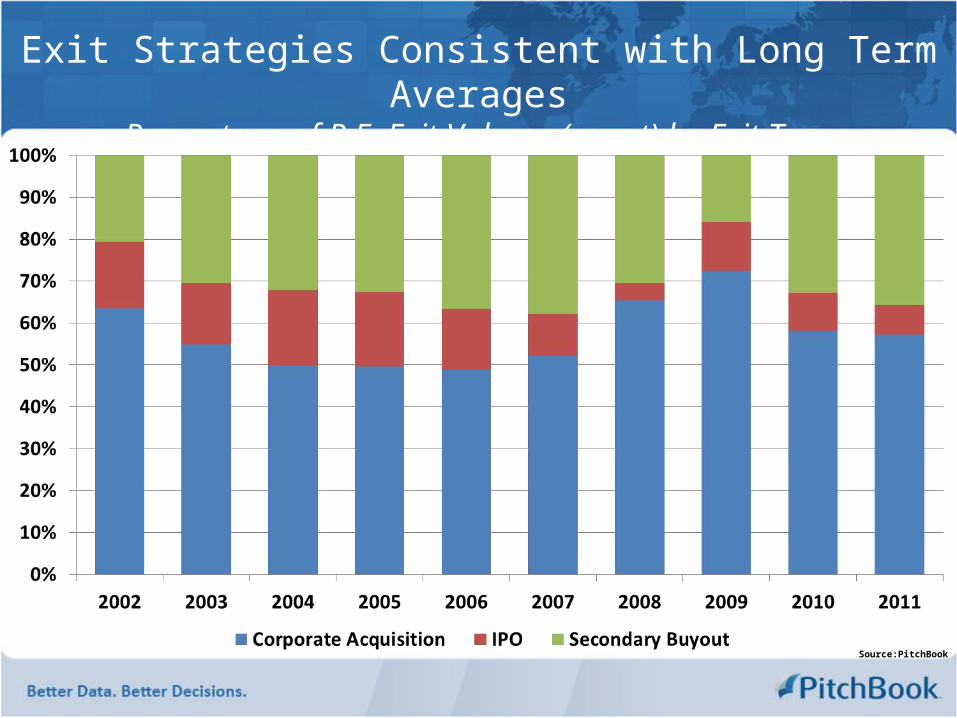
Exit Strategies Consistent with Long Term AveragesPercentage of P.E. Exit Volume (count) by Exit Type
Source:PitchBook
Private Equity Investors Exited $108B of Investments Quarterly PE Exits by Corporate Acquisition, IPO and Secondary Sale
Source:PitchBook
Corporate Acquisitions Dominated ExitsMedian Exit Size ($M)
Source:PitchBook
PE Exits Likely to Stay Strong in 2012 Number of U.S. Private Equity Company Inventory by Deal Year
Source:PitchBook
Inventory Buildup Resulted in Increased Holding Length Median Time from Buyout to Exit
Private EquityFundraising
Source:PitchBook
Company Inventory & Capital Overhang Stall FundraisingNumber of Funds Closed and Total Capital Raised by Year
Source:PitchBook
Fundraising Remained FlatNumber of Funds Closed and Total Capital Raised by Quarter
Source:PitchBook
Funds Under $1B Accounted for 39% of U.S. PE FundraisingPercentage of U.S. P.E. Funds (capital) by Fund Size
Source:PitchBook
Middle Market Funds Dominate FundraisingPercentage of U.S. P.E. Funds (count) by Fund Size
Source:PitchBook
PE Investors Sitting on $425B of Dry Powder Capital Overhang of US PE Investors by Vintage Year
Source:PitchBook
New GPs are Entering the Private Equity IndustryNumber of Funds Closed by Year
Source:PitchBook
Funds are Closing FasterAverage Time to Close U.S. PE Funds
Source:PitchBook
Average 2011 Vintage Fund 13% Larger than 2010 Average Fund Size ($M)
Greater Private EquityPerformance
Source:PitchBook
PE Led in Average IRR For 7 Consecutive VintagesAverage Fund IRR by Vintage Year and Fund Type
Source:PitchBook
Fund Performances Bounced Back Median 1-Year Rolling Horizon IRR by Fund Type
Source:PitchBook
Private Equity Outperforming in the Long RunHorizon IRR – Private Equity, Venture Capital and Public Index
Private EquityPerformance
Source:PitchBook
Larger Funds Lead Returns Across VintagesPrivate Equity Average Fund IRR by Vintage Year
Source:PitchBook
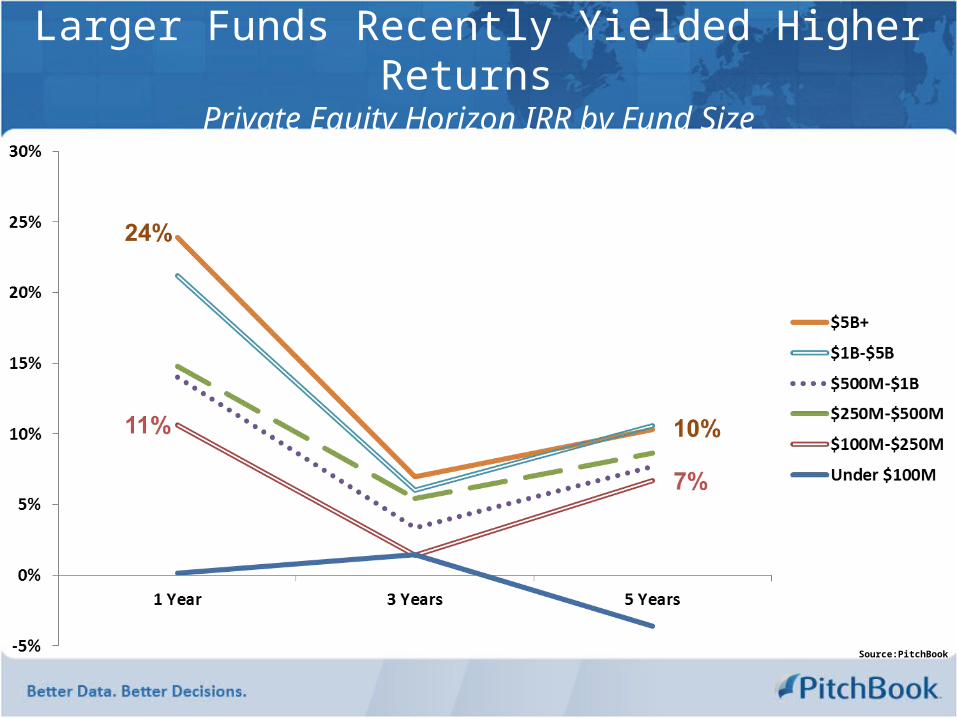
Larger Funds Recently Yielded Higher Returns Private Equity Horizon IRR by Fund Size
Source:PitchBook
Recent PE Funds Hit Positive IRR in 2010Median IRR by Years Since First Investment
Source:PitchBook
LPs Waiting for Distribution for 2003 & Younger Funds Average Private Equity Return Multiples by Vintage Year
Source:PitchBook
Dramatic Quartile DifferencesPrivate Equity IRR Quartiles by Vintage Year
3rd Quartile
2nd Quartile
Top Quartile
BottomQuartileSource:PitchBook
Source:PitchBook
Matured Funds Called 92% of Committed CapitalPrivate Equity Capital Call
Venture CapitalPerformance
Source:PitchBook
Mid-Sized VC Funds Showed Growth TrendVenture Capital Average Fund IRR by Vintage Year
Source:PitchBook
$150M-$250M Funds Generated 2nd Highest ReturnsVenture Capital Horizon IRR by Fund Size
Source:PitchBook
Economy Impacted Returns More than Fund AgeMedian IRR by Years Since First Investment
Source:PitchBook
TVPI Shows Improvement, DPI Remains Low Average Venture Capital Return Multiples by Vintage Year
Source:PitchBook
VC Funds in Upper Quartiles Show Positive ReturnsVenture Capital IRR Quartiles by Vintage
3rd Quartile
2nd Quartile
Top Quartile
BottomQuartile
Source:PitchBook
High % of Committed Capital for New InvestmentsVenture Capital Call
Fund of FundsPerformance
Source:PitchBook
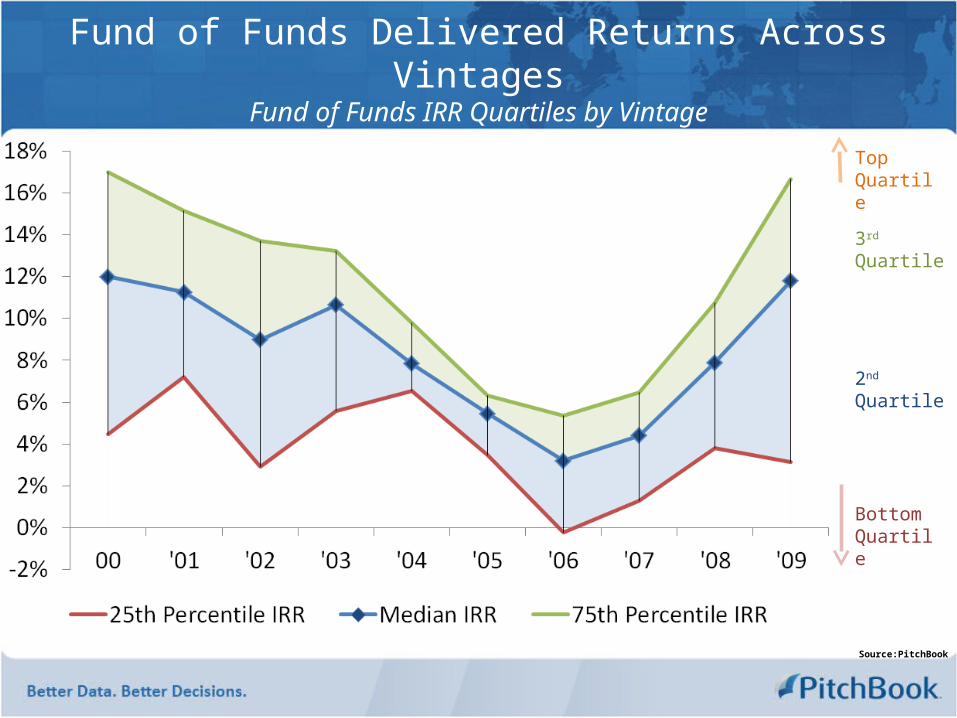
Fund of Funds Delivered Returns Across VintagesFund of Funds IRR Quartiles by Vintage
3rd Quartile
2nd Quartile
Top Quartile
BottomQuartile
Source:PitchBook
Fund of Funds Slower to Distribute Capital Average Fund of Funds Return Multiples by Vintage Year
MezzaninePerformance
Source:PitchBook
Strong and Consistent Performance Across VintagesMezzanine IRR Quartiles by Vintage
3rd Quartile
2nd Quartile
Top Quartile
BottomQuartile
Source:PitchBook
Mezzanine Funds Fastest in Distribution of Capital Average Mezzanine Return Multiples by Vintage Year
Real EstatePerformance
Source:PitchBook
Top Quartiles Show Slow RecoveryReal Estate IRR Quartiles by Vintage
3rd Quartile
2nd Quartile
Top Quartile
BottomQuartile
Source:PitchBook
2004 – 2008 Funds Still RecoveringAverage Real Estate Return Multiples by Vintage Year
Non-U.S. InvestorPerformance
Source:PitchBook
PE Vintages Under 2004 Perform Closely to U.S. Counterparts Average Non-U.S. PE Return Multiples by Vintage Year
Source:PitchBook
VC 2001-2004 Vintages Perform Better than U.S. Counterparts Average Non-U.S. VC Return Multiples by Vintage Year
VIDEO: Better Intelligence & Fund Benchmarkingwith the PitchBook Platform
• Access the most robust database on PE and VC fund returns.
• Create fund benchmarks that match your fund’s peer group.
• Use our fully transparent data to validate your benchmark.
In this video, you’ll learn how to:
WATCH NOW: www.pitchbook.com/videos/better-benchmarking.html


![INDEX [worldradiohistory.com] · 5593 "Space Communications System Design Nomographs," H. R Mathwich, Trans. I.R.E. PGCS (Correspondence) (March) 1962 5594 "A Spectrophotometric Investigation](https://static.documents.pub/doc/80x56/5f8374324ddcba3bc907dfd3/index-5593-space-communications-system-design-nomographs-h-r-mathwich.jpg)


